bridge to india - global solar demand conference - 2013 - tobias engelmeier
TRANSCRIPT

www.bridgetoindia.com
Global Demand Conference VII, Munich
Where is the Indian solar market headed?
Tobias Engelmeier New Delhi,June 18th 2013 [email protected]

© BRIDGE TO INDIA, 2011 2
About us
Our business BRIDGE TO INDIA specializes in supporting international solar companies and investors in India
• Founded in 2008 • Based in New Delhi,
Hamburg and Munich • German competency
and local expertise • Entrepreneurial
approach • Solar PV as a core
knowledge area • Three mutually
supportive business segments
BRIDGE TO INDIA’s key fields of expertise are:
Policy
Projects Financing Industry
Market Entry
Market Potential Competitor Landscape
Market Strategy
Capital Investments
Remittance PD Due Diligence

© BRIDGE TO INDIA, 2011 3
Overall context India is rich, poor, democratic, chaotic – 1/6thof the global population – in a league of its own…
© BRIDGE TO INDIA, 2011 4
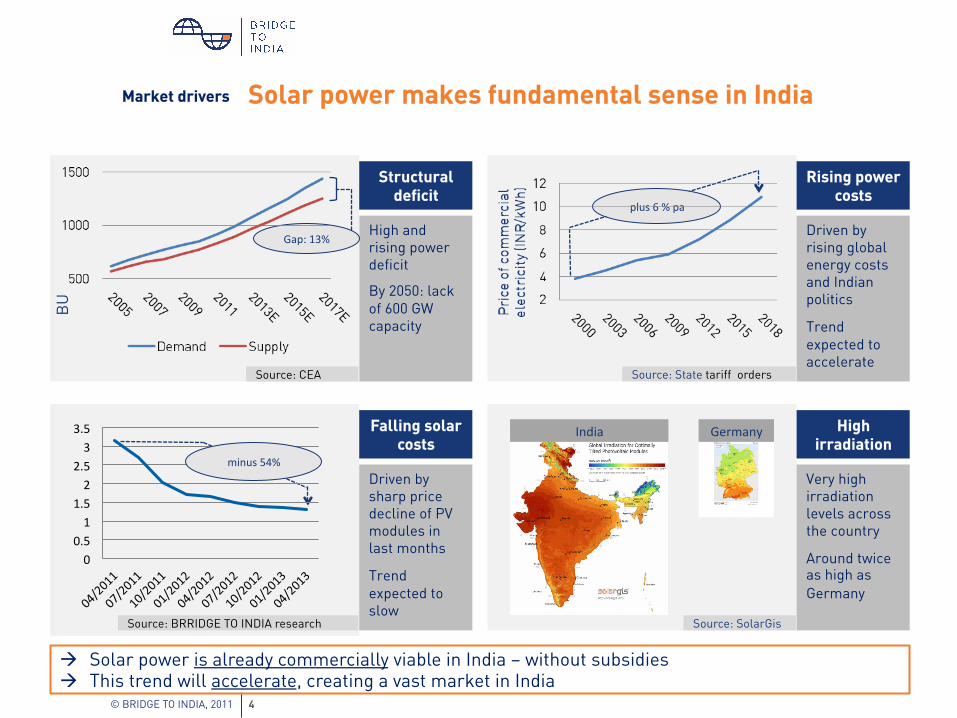
Solar power makes fundamental sense in India
High and rising power deficit
By 2050: lack of 600 GW capacity
Driven by sharp price decline of PV modules in last months
Trend expected to slow
Market drivers
à Solar power is already commercially viable in India – without subsidies à This trend will accelerate, creating a vast market in India
Driven by rising global energy costs and Indian politics
Trend expected to accelerate
Very high irradiation levels across the country
Around twice as high as Germany
Structural deficit
Rising power costs
Falling solar costs
High irradiation
Source: State tariff orders Source: CEA
Source: BRRIDGE TO INDIA research Source: SolarGis
plus 6 % pa
India Germany
Gap: 13%
BU
0 0.5 1
1.5 2
2.5 3
3.5
minus 54%

© BRIDGE TO INDIA, 2011 5
Installed PV capacity India has more than 1.7 GW of installed capacity already
Key Facts
• Currently market growth centres on grid-connected plants (FiT)
• The average project size in India is 6.8 MW
• Around 50% of installations are in the Indian state of Gujarat, another 30% in Rajasthan – both in the West
Total installed capacity: 1.7 GW Average size of project: 6.8 MW

© BRIDGE TO INDIA, 2011 6
Installed PV capacity New agreements for 2.5 GW to be signed in India in 2013. Of this, allocation process for 1.7 GW is under way
Key Facts • A capacity of 1,745
MW is being allocated or has been recently allocated in Tamil Nadu, Andhra Pradesh, Uttar Pradesh, Karnataka, Punjab and Rajasthan
• More than 1,100 MW of this 1,700 MW is in the southern states of Tamil Nadu, Andhra Pradesh and Karnataka
• A capacity allocation of 750 MW under the NSM will begin in July 2013
Note: some agreements are only Memorandums of Understanding (MoUs) and the indicated capacity is not expected to be completely installed. Some policy based projects also get delayed or cancelled.
1,718 MW
315 MW
1,745 MW
750 MW
654 MW
Installed capacity
Projects under development
Recently allocated projects (under allocation process)
New allocations expected in 2013
Existing agreements that have not been formalized or are likely to be cancelled
Snapshot of policy based projects in India (2013)
© BRIDGE TO INDIA, 2011 7
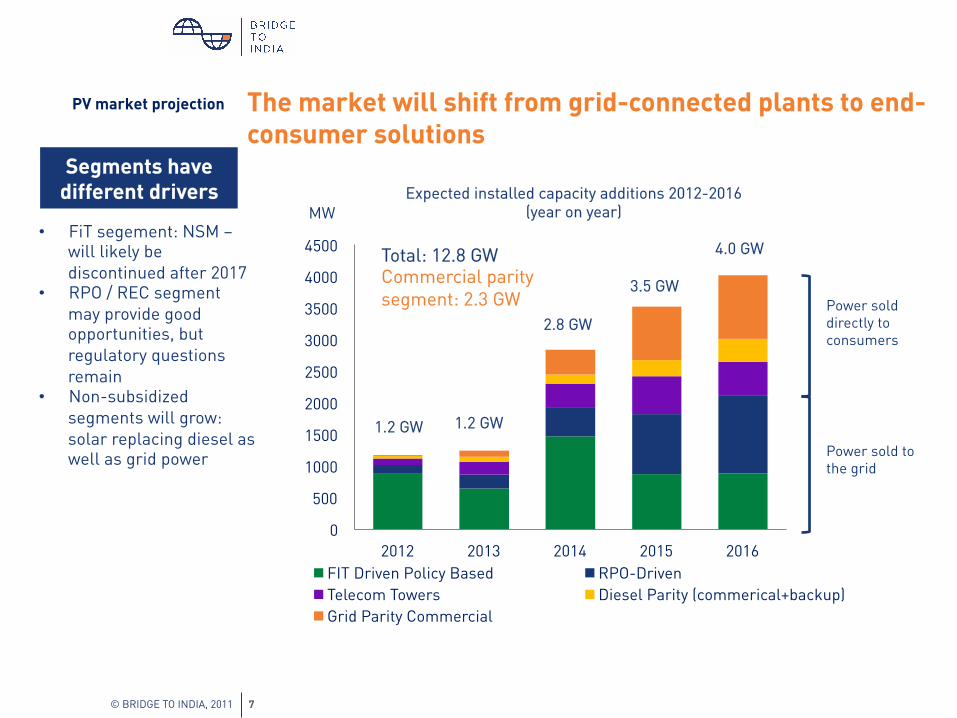
PV market projection The market will shift from grid-connected plants to end-consumer solutions
• FiT segement: NSM – will likely be discontinued after 2017
• RPO / REC segment may provide good opportunities, but regulatory questions remain
• Non-subsidized segments will grow: solar replacing diesel as well as grid power
Segments have different drivers
0
500
1000
1500
2000
2500
3000
3500
4000
4500
2012 2013 2014 2015 2016 FIT Driven Policy Based RPO-Driven Telecom Towers Diesel Parity (commerical+backup) Grid Parity Commercial
Expected installed capacity additions 2012-2016 (year on year)
1.2 GW
4.0 GW
3.5 GW
2.8 GW
1.2 GW
Total: 12.8 GW Commercial parity segment: 2.3 GW
MW
Power sold to the grid
Power sold directly to consumers

© BRIDGE TO INDIA, 2011 8
Parity in 2013
Source: BTI market analysis, based on data from various state tariff orders
Key assumptions
Three states have already reached commercial parity , 40% of the states have reached parity with MNRE subsidy
2013 scenario
Key assumptions: • System size 100 kWp • Interest rate: 13% • Debt-equity ratio:
70:30 • System cost: INR 82/
Wp (EUR 1.2/Wp) • MNRE capital
subsidy at 30% • Solar LCOE varies by
irradiation across states
• Diesel LCOE varies by diesel prices at state level, taken in May 2013
• Commercial grid tariffs for states taken from various state tariff orders as of May 2013
Three Indian states with a poten?al of 728 MW of solar installa?ons ?ll 2016 have already reached parity.
© BRIDGE TO INDIA, 2011 9
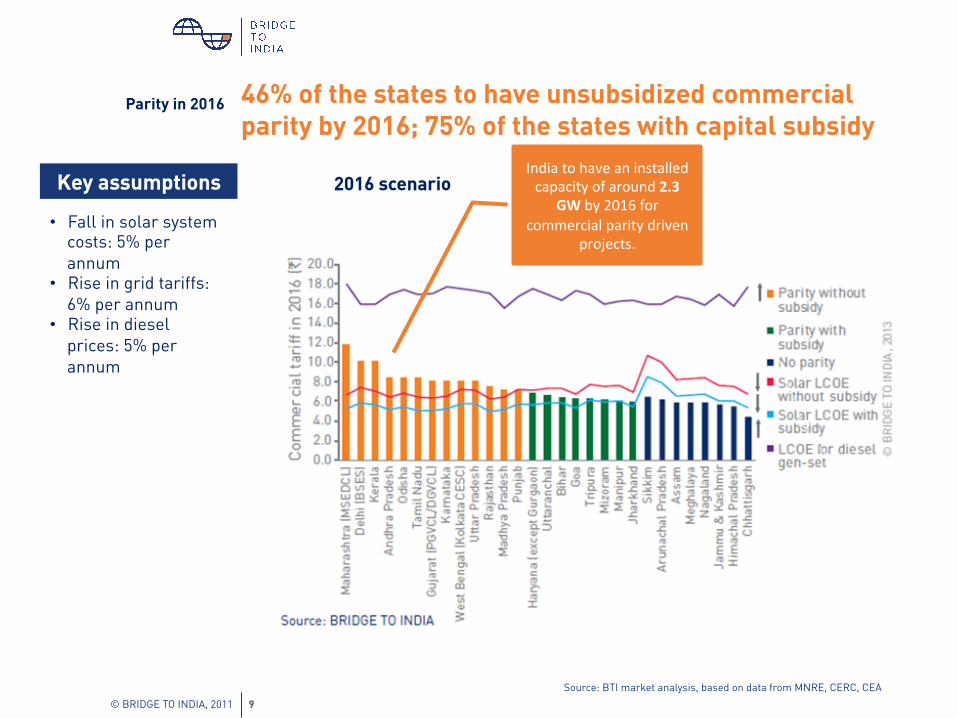
Parity in 2016
Source: BTI market analysis, based on data from MNRE, CERC, CEA
Key assumptions
46% of the states to have unsubsidized commercial parity by 2016; 75% of the states with capital subsidy
• Fall in solar system costs: 5% per annum
• Rise in grid tariffs: 6% per annum
• Rise in diesel prices: 5% per annum
2016 scenario India to have an installed capacity of around 2.3
GW by 2016 for commercial parity driven
projects.
© BRIDGE TO INDIA, 2011 10
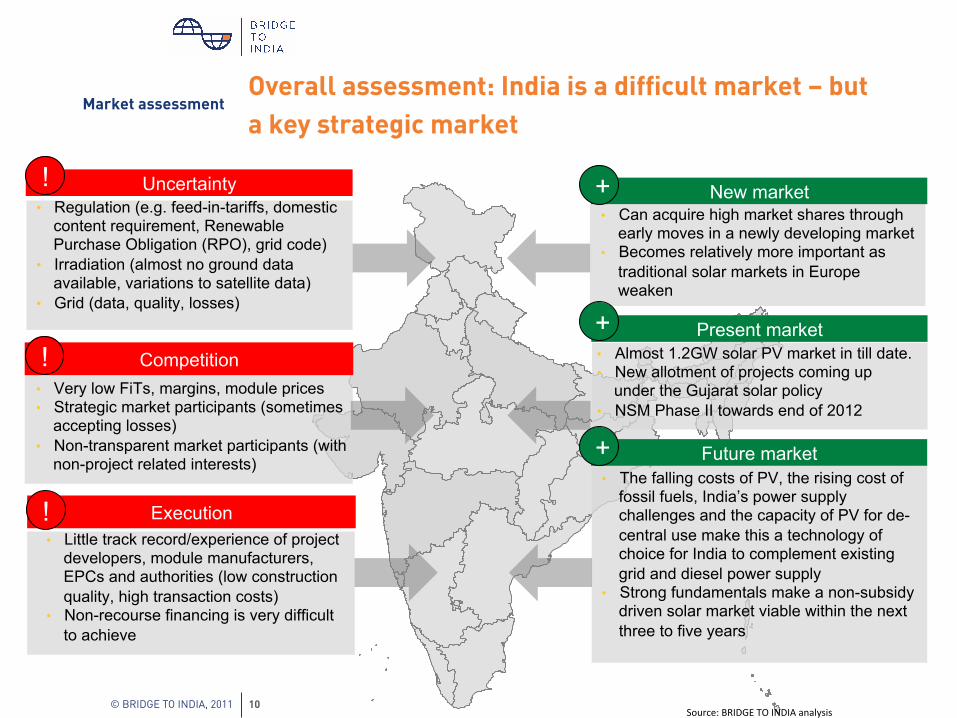
Market assessment Overall assessment: India is a difficult market – but a key strategic market
• Regulation (e.g. feed-in-tariffs, domestic content requirement, Renewable Purchase Obligation (RPO), grid code)
• Irradiation (almost no ground data available, variations to satellite data)
• Grid (data, quality, losses)
Uncertainty
• Very low FiTs, margins, module prices • Strategic market participants (sometimes
accepting losses) • Non-transparent market participants (with
non-project related interests)
Competition
• Little track record/experience of project developers, module manufacturers, EPCs and authorities (low construction quality, high transaction costs)
• Non-recourse financing is very difficult to achieve
Execution
• Can acquire high market shares through early moves in a newly developing market
• Becomes relatively more important as traditional solar markets in Europe weaken
New market
• The falling costs of PV, the rising cost of fossil fuels, India’s power supply challenges and the capacity of PV for de-central use make this a technology of choice for India to complement existing grid and diesel power supply
• Strong fundamentals make a non-subsidy driven solar market viable within the next three to five years
Future market
!
!
!
+
• Almost 1.2GW solar PV market in till date. • New allotment of projects coming up
under the Gujarat solar policy • NSM Phase II towards end of 2012
Present market +
+
Source: BRIDGE TO INDIA analysis

© BRIDGE TO INDIA, 2011 11
Our publications We help you understand and track the Indian solar market
Reports
INDIA SOLAR HANDBOOK
INDIA SOLAR COMPASS
INDIA SOLAR DECISION BRIEF
INDIA SOLAR POLICY BRIEF
IndiaSolarMarket.com IndiaSolarHomes.com
Social Media
www. facebook.com/ bridgetoindia
Write to us at [email protected] for any further information.
Our LinkedIn group,
‘India Solar Future’
www. twitter.com/
bridgetoindia
The BRIDGE TO INDIA Blog
Weekly market update (newsletter)

© BRIDGE TO INDIA, 2011 12
Our customers We have serviced many international solar players with our Indian market knowledge
Conglomerates
Solar Companies
Institutions
Government of Madhyapradesh

© BRIDGE TO INDIA, 2011
Contact www.bridgetoindia.com Follow us on facebook.com/bridgetoindia
We are happy to support you in any further queries