bridge admittance measurements of 10 preference … · bridge admittance measurements of 10...
TRANSCRIPT

HAL Id: hal-00810717https://hal.archives-ouvertes.fr/hal-00810717
Submitted on 23 Apr 2012
HAL is a multi-disciplinary open accessarchive for the deposit and dissemination of sci-entific research documents, whether they are pub-lished or not. The documents may come fromteaching and research institutions in France orabroad, or from public or private research centers.
L’archive ouverte pluridisciplinaire HAL, estdestinée au dépôt et à la diffusion de documentsscientifiques de niveau recherche, publiés ou non,émanant des établissements d’enseignement et derecherche français ou étrangers, des laboratoirespublics ou privés.
Bridge admittance measurements of 10 preference-ratedviolins
Charalampos Saitis, Claudia Fritz, Bruno Giordano, Gary Scavone
To cite this version:Charalampos Saitis, Claudia Fritz, Bruno Giordano, Gary Scavone. Bridge admittance measurementsof 10 preference-rated violins. Société Française d’Acoustique. Acoustics 2012, Apr 2012, Nantes,France. 2012. <hal-00810717>

Bridge admittance measurements of 10 preference-ratedviolins
C. Saitisa, C. Fritzb, B. L. Giordanoc and G. P. Scavoned,e
aComputational Acoustic Modeling Lab, CIRMMT, McGill University, 555 Sherbrooke Str.W., Montreal, QC, Canada H3A 1E3
bLAM, Institut Jean le Rond d’Alembert, UMR CNRS 7190, UPMC, 11 rue de Lourmel,75015 Paris, France
cMusic Perception and Cognition Laboratory, McGill University, 555 Sherbrooke Street West,Montreal, Canada H3A 1E3
dCentre for Interdisciplinary Research in Music Media and Technology (CIRMMT), 527 RueSherbrooke Ouest, Montreal, Canada H3A 1E3
eComputational Acoustic Modeling Lab, Schulich School of Music, McGill University, 555 RueSherbrooke Ouest, Montreal, QC, Canada H3A 1E3
Proceedings of the Acoustics 2012 Nantes Conference 23-27 April 2012, Nantes, France
3605

The overall goal of the research presented here is to investigate correlations between measured vibrational proper-
ties of the violin and subjective judgments by violinists and to better understand what distinguishes one instrument
from another. The novelty of this study is that 10 violins of different make and age were evaluated and preference-
rated by 13 experienced musicians in a carefully controlled violin-playing perceptual experiment. Regarding the
vibrational properties of the instruments, the classical bridge admittance measurements have been examined so far.
The five “signature” modes below 600 Hz were identified in all of the tested violins. Comparisons between violin
groups based on across-players average preference score generally showed no prominent preference-related trends
for mode frequencies or frequency spacings. Further analysis showed no links between admittance correlations
and preference.
1 IntroductionA long-standing goal of violin acoustics research has been
to correlate measurable mechanical properties to instrument
quality. What distinguishes one violin from another? What
defines a “good” violin?
Alonso Moral and Jansson realized bridge admittance me-
asurements on 24 violins, which had previously been played
and tonal-quality-rated by two professional violinists based
on evenness, volume, and brilliance of sound as well as playa-bility [1]. From the admittance curves, 4 “acoustical quality”
criteria were extracted and used to acoustical-quality-rate the
instruments. Correlations between the two types of ratings
showed a strong influence of the modes below 600 Hz and
the bridge hill in the 2–3 kHz range on violin sound quality.
Jansson later conducted bridge admittance measurements on
25 violins, which belong to a private collection of high qual-
ity instruments, and made similar conclusions [2].
Dunnwald conducted measurements on a large set of vio-
lins, which had previously been classified as of very good or
moderate quality, and proposed that the four frequency bands
190–650, 650–1300, 1300–4200, and 4200–6400 Hz were
critical in assessing the quality of the violin sound: 1. The
first band contains the critical lower modes; 2. If the sec-
ond band is too strong, the sound is boxy and nasal; 3. The
third band is responsible for brilliance, effective radiation,
and evenness in the lower playing range; and 4. The fourth
band should be relatively low to create a clear sound [3].
However, recent virtual violin listening tests did not corrob-
orate most of these suggestions [4].
Hutchins conducted acoustical measurements including
input admittance on over 100 violins with “a wide variety
of tone and playing qualities, as described by their owners-
players,” and proposed the B1+− A1 frequency spacing as
a violin quality criterion1 [6]. She noted that violins with a
B1+− A1 frequency difference of less than 40 Hz were easy
to play with little projection and preferred in chamber mu-
sic; instruments with values between 40 and 70 Hz were pre-
ferred by soloists; violins in the 55–70 Hz range were more
powerful in terms of projection; above 100 Hz instruments
were “harsh” and hard to play. Schleske later remarked that
the B1+ mode strongly influences the “tonal color” of the vi-
olin [7]. According to Schleske, violins with B1+ < 510 Hz
and > 550 Hz are soft-harsh, less-more resistant and charac-
terized by dark-bright sound respectively.
Bissinger conducted a wide range of systematic vibration
and radiation measurements on 17 violins with quality rat-
ings from bad to excellent. All instruments were played by
a professional violinist; 12 violins were rated by the violinist
1Hutchins originally considered only one first corpus bending mode, B1,
which corresponded to B1+. Bissinger noticed that this criterion was am-
biguous as there are two such modes (see [5]).
using a standardized qualitative evaluation procedure [8]; the
other 5 violins, including two Stradivari and a Guarneri del
Gesu, were rated by the author based on feedback from the
violinist, comments of listeners, and the historical status of
the old Cremonese instruments. The suggestions by Hutchins
and Schleske were not confirmed as no quality trends for sig-
nature mode frequencies or total damping were found from
bad-excellent comparisons [5]. More elaborate band-/modal-
averaged mobility and radiativity comparisons further con-
firmed no significant quality differentiators except for the
Helmholtz-like cavity mode A0, the radiation of which was
significantly stronger for excellent than for bad violins [9].
The reliability and generalizability of the results of these
studies is unclear, mostly because the quality judgments were
based on only 1 or 2 violinists. Also, no specifics were re-
ported concerning the conditions under which those judg-
ments were made. In the study presented here, 13 experi-
enced musicians were asked to play 10 different violins and
evaluate them according to overall preference. We adopted a
carefully controlled method whereby performers could pro-
vide uninfluenced judgments. Bridge admittance measure-
ments were realized on all of the tested violins to investigate
possible correlations between admittance features and pref-
erence ratings.
2 Method
2.1 Perceptual evaluationParticipants (N = 13; 9 females, 4 males; average age =
28 yrs) were selected according to their musical background.
They had at least 15 years of violin practice (average violin
training = 22 yrs; average violin practice per week = 25 hrs).
Ten violins of different make, age and price were inves-
tigated (see Table 1). The strings, bridge, and chin rest were
optimally setup for each violin by the luthiers prior to the
experiment. Participants were given the option to either use
a provided shoulder rest (Kun Original model), or use their
own, or use no shoulder rest.
The experiment took place in an acoustically dry room
(surface = 27 m2, RT60 = .18s) to minimize the effect of
room reflections on violin sound. In order to remove visual
cues that may influence judgment (e.g., varnish, wood grain,
identifying marks), low light conditions were used and par-
ticipants were asked to wear dark sunglasses. Considering
the bow as an extension of the player, we asked participants
to use their own bow.
The experimental session lasted two hours. Initially, par-
ticipants were asked to play all instruments for twenty min-
utes to acquaint themselves with the set. Following a short
training session, the main task comprised three subsequent
blocks of ten trials (i.e., ten violins) in randomized order.
Proceedings of the Acoustics 2012 Nantes Conference23-27 April 2012, Nantes, France
3606
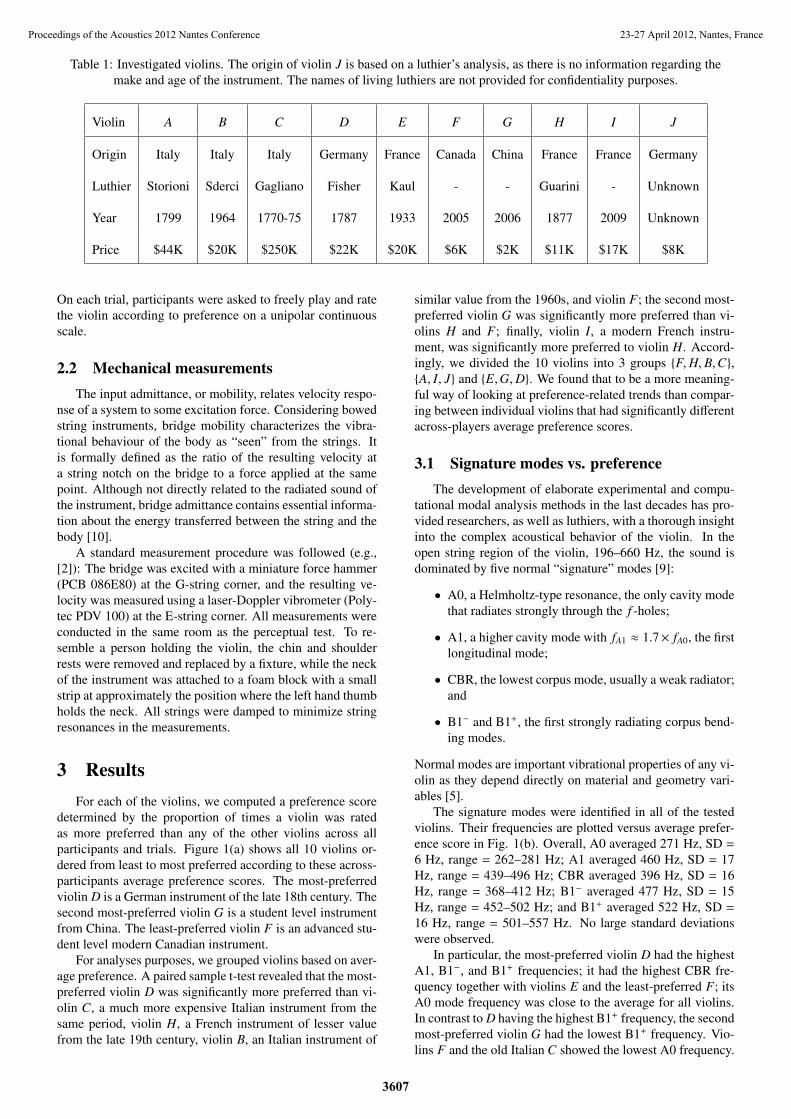
Table 1: Investigated violins. The origin of violin J is based on a luthier’s analysis, as there is no information regarding the
make and age of the instrument. The names of living luthiers are not provided for confidentiality purposes.
Violin A B C D E F G H I J
Origin Italy Italy Italy Germany France Canada China France France Germany
Luthier Storioni Sderci Gagliano Fisher Kaul - - Guarini - Unknown
Year 1799 1964 1770-75 1787 1933 2005 2006 1877 2009 Unknown
Price $44K $20K $250K $22K $20K $6K $2K $11K $17K $8K
On each trial, participants were asked to freely play and rate
the violin according to preference on a unipolar continuous
scale.
2.2 Mechanical measurementsThe input admittance, or mobility, relates velocity respo-
nse of a system to some excitation force. Considering bowed
string instruments, bridge mobility characterizes the vibra-
tional behaviour of the body as “seen” from the strings. It
is formally defined as the ratio of the resulting velocity at
a string notch on the bridge to a force applied at the same
point. Although not directly related to the radiated sound of
the instrument, bridge admittance contains essential informa-
tion about the energy transferred between the string and the
body [10].
A standard measurement procedure was followed (e.g.,
[2]): The bridge was excited with a miniature force hammer
(PCB 086E80) at the G-string corner, and the resulting ve-
locity was measured using a laser-Doppler vibrometer (Poly-
tec PDV 100) at the E-string corner. All measurements were
conducted in the same room as the perceptual test. To re-
semble a person holding the violin, the chin and shoulder
rests were removed and replaced by a fixture, while the neck
of the instrument was attached to a foam block with a small
strip at approximately the position where the left hand thumb
holds the neck. All strings were damped to minimize string
resonances in the measurements.
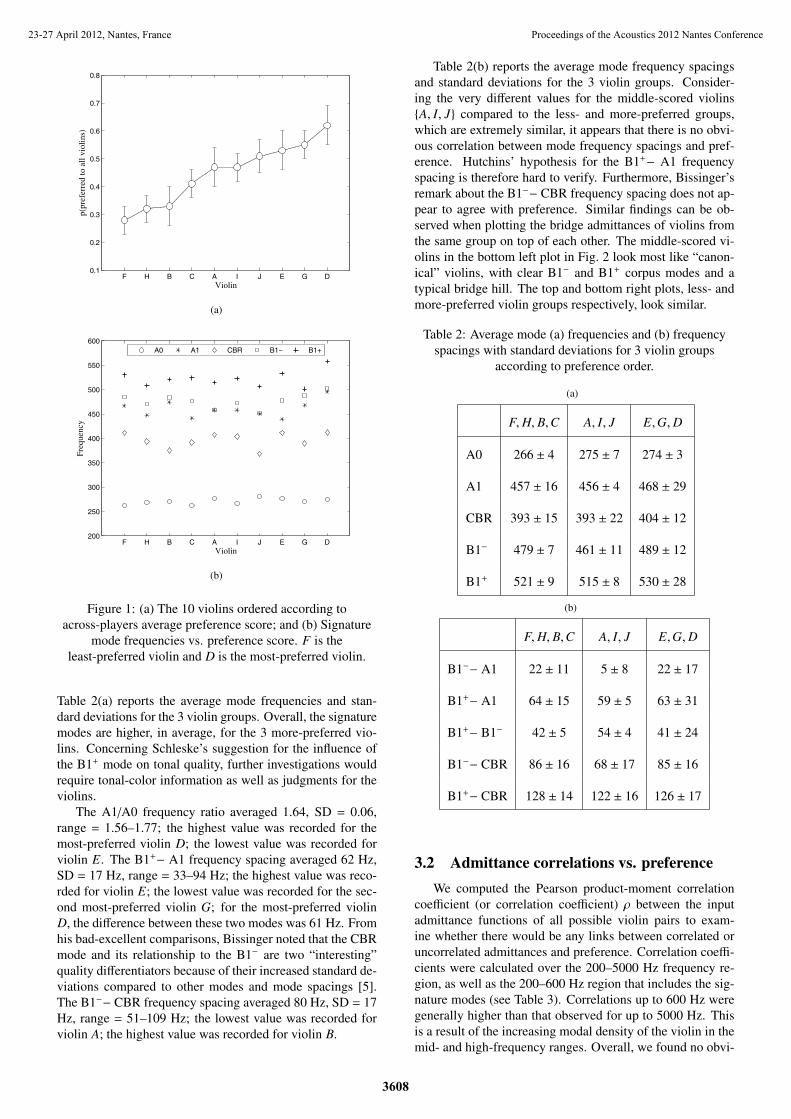
3 ResultsFor each of the violins, we computed a preference score
determined by the proportion of times a violin was rated
as more preferred than any of the other violins across all
participants and trials. Figure 1(a) shows all 10 violins or-
dered from least to most preferred according to these across-
participants average preference scores. The most-preferred
violin D is a German instrument of the late 18th century. The
second most-preferred violin G is a student level instrument
from China. The least-preferred violin F is an advanced stu-
dent level modern Canadian instrument.
For analyses purposes, we grouped violins based on aver-
age preference. A paired sample t-test revealed that the most-
preferred violin D was significantly more preferred than vi-
olin C, a much more expensive Italian instrument from the
same period, violin H, a French instrument of lesser value
from the late 19th century, violin B, an Italian instrument of
similar value from the 1960s, and violin F; the second most-
preferred violin G was significantly more preferred than vi-
olins H and F; finally, violin I, a modern French instru-
ment, was significantly more preferred to violin H. Accord-
ingly, we divided the 10 violins into 3 groups {F,H, B,C},{A, I, J} and {E,G,D}. We found that to be a more meaning-
ful way of looking at preference-related trends than compar-
ing between individual violins that had significantly different
across-players average preference scores.
3.1 Signature modes vs. preferenceThe development of elaborate experimental and compu-
tational modal analysis methods in the last decades has pro-
vided researchers, as well as luthiers, with a thorough insight
into the complex acoustical behavior of the violin. In the
open string region of the violin, 196–660 Hz, the sound is
dominated by five normal “signature” modes [9]:
• A0, a Helmholtz-type resonance, the only cavity mode
that radiates strongly through the f -holes;
• A1, a higher cavity mode with fA1 ≈ 1.7× fA0, the first
longitudinal mode;
• CBR, the lowest corpus mode, usually a weak radiator;
and
• B1− and B1+, the first strongly radiating corpus bend-
ing modes.
Normal modes are important vibrational properties of any vi-
olin as they depend directly on material and geometry vari-
ables [5].
The signature modes were identified in all of the tested
violins. Their frequencies are plotted versus average prefer-
ence score in Fig. 1(b). Overall, A0 averaged 271 Hz, SD =
6 Hz, range = 262–281 Hz; A1 averaged 460 Hz, SD = 17
Hz, range = 439–496 Hz; CBR averaged 396 Hz, SD = 16
Hz, range = 368–412 Hz; B1− averaged 477 Hz, SD = 15
Hz, range = 452–502 Hz; and B1+ averaged 522 Hz, SD =
16 Hz, range = 501–557 Hz. No large standard deviations
were observed.
In particular, the most-preferred violin D had the highest
A1, B1−, and B1+ frequencies; it had the highest CBR fre-
quency together with violins E and the least-preferred F; its
A0 mode frequency was close to the average for all violins.
In contrast to D having the highest B1+ frequency, the second
most-preferred violin G had the lowest B1+ frequency. Vio-
lins F and the old Italian C showed the lowest A0 frequency.
Proceedings of the Acoustics 2012 Nantes Conference 23-27 April 2012, Nantes, France
3607
F H B C A I J E G D0.1
0.2
0.3
0.4
0.5
0.6
0.7
0.8p(
pref
erre
d to
all
viol
ins)
Violin
(a)
F H B C A I J E G D200
250
300
350
400
450
500
550
600
Violin
Freq
uenc
y
A0 A1 CBR B1− B1+
(b)
Figure 1: (a) The 10 violins ordered according to
across-players average preference score; and (b) Signature
mode frequencies vs. preference score. F is the
least-preferred violin and D is the most-preferred violin.
Table 2(a) reports the average mode frequencies and stan-
dard deviations for the 3 violin groups. Overall, the signature
modes are higher, in average, for the 3 more-preferred vio-
lins. Concerning Schleske’s suggestion for the influence of
the B1+ mode on tonal quality, further investigations would
require tonal-color information as well as judgments for the
violins.
The A1/A0 frequency ratio averaged 1.64, SD = 0.06,
range = 1.56–1.77; the highest value was recorded for the
most-preferred violin D; the lowest value was recorded for
violin E. The B1+− A1 frequency spacing averaged 62 Hz,
SD = 17 Hz, range = 33–94 Hz; the highest value was reco-
rded for violin E; the lowest value was recorded for the sec-
ond most-preferred violin G; for the most-preferred violin
D, the difference between these two modes was 61 Hz. From
his bad-excellent comparisons, Bissinger noted that the CBR
mode and its relationship to the B1− are two “interesting”
quality differentiators because of their increased standard de-
viations compared to other modes and mode spacings [5].
The B1−− CBR frequency spacing averaged 80 Hz, SD = 17
Hz, range = 51–109 Hz; the lowest value was recorded for
violin A; the highest value was recorded for violin B.
Table 2(b) reports the average mode frequency spacings
and standard deviations for the 3 violin groups. Consider-
ing the very different values for the middle-scored violins
{A, I, J} compared to the less- and more-preferred groups,
which are extremely similar, it appears that there is no obvi-
ous correlation between mode frequency spacings and pref-
erence. Hutchins’ hypothesis for the B1+− A1 frequency
spacing is therefore hard to verify. Furthermore, Bissinger’s
remark about the B1−− CBR frequency spacing does not ap-
pear to agree with preference. Similar findings can be ob-
served when plotting the bridge admittances of violins from
the same group on top of each other. The middle-scored vi-
olins in the bottom left plot in Fig. 2 look most like “canon-
ical” violins, with clear B1− and B1+ corpus modes and a
typical bridge hill. The top and bottom right plots, less- and
more-preferred violin groups respectively, look similar.
Table 2: Average mode (a) frequencies and (b) frequency
spacings with standard deviations for 3 violin groups
according to preference order.
(a)
F,H, B,C A, I, J E,G,D
A0 266 ± 4 275 ± 7 274 ± 3
A1 457 ± 16 456 ± 4 468 ± 29
CBR 393 ± 15 393 ± 22 404 ± 12
B1− 479 ± 7 461 ± 11 489 ± 12
B1+ 521 ± 9 515 ± 8 530 ± 28
(b)
F,H, B,C A, I, J E,G,D
B1−− A1 22 ± 11 5 ± 8 22 ± 17
B1+− A1 64 ± 15 59 ± 5 63 ± 31
B1+− B1− 42 ± 5 54 ± 4 41 ± 24
B1−− CBR 86 ± 16 68 ± 17 85 ± 16
B1+− CBR 128 ± 14 122 ± 16 126 ± 17
3.2 Admittance correlations vs. preferenceWe computed the Pearson product-moment correlation
coefficient (or correlation coefficient) ρ between the input
admittance functions of all possible violin pairs to exam-
ine whether there would be any links between correlated or
uncorrelated admittances and preference. Correlation coeffi-
cients were calculated over the 200–5000 Hz frequency re-
gion, as well as the 200–600 Hz region that includes the sig-
nature modes (see Table 3). Correlations up to 600 Hz were
generally higher than that observed for up to 5000 Hz. This
is a result of the increasing modal density of the violin in the
mid- and high-frequency ranges. Overall, we found no obvi-
Proceedings of the Acoustics 2012 Nantes Conference23-27 April 2012, Nantes, France
3608

270 500 660 2000 3000−60
−55
−50
−45
−40
−35
−30
−25
−20
−15
−10
Adm
ittan
ce (
dB)
Frequency (Hz)270 500 660 2000 3000
−60
−55
−50
−45
−40
−35
−30
−25
−20
−15
−10
Adm
ittan
ce (
dB)
Frequency (Hz)
FHBC
270 500 660 2000 3000−55
−50
−45
−40
−35
−30
−25
−20
−15
−10
Adm
ittan
ce (
dB)
Frequency (Hz)
AIJ
270 500 660 2000 3000−60
−55
−50
−45
−40
−35
−30
−25
−20
−15
−10
Adm
ittan
ce (
dB)
Frequency (Hz)
EGD
Figure 2: Bridge admittances plotted on top of each other. Top left: all 10 investigated violins; top right: the 4 less-preferred
violins; bottom left: the 3 middle-scored violins; bottom right: the 3 more-preferred violins.
ous connection between admittance correlations and prefer-
ence.
Table 3: Pearson product-moment correlation coefficients ρbetween the bridge admittances of the most-preferred violin
D and each of the other instruments over the 200–5000 Hz
(upper line) and 200–600 Hz (lower line) regions.
F H B C A I J E G
D.59 .74 .68 .59 .62 .70 .62 .70 .58
.87 .81 .80 .79 .81 .82 .78 .79 .85
4 ConclusionThis paper reports an investigation into correlations be-
tween violin bridge admittance measurements and preference
judgements by experienced musicians. The novelty of this
study is that a perceptual evaluation playing test was de-
signed, based on a carefully controlled procedure. As a start-
ing point, we considered the signature normal modes of the
violin and attempted comparisons between violin groups ba-
sed on average preference scores. The 3 more-preferred vio-
lins displayed higher mode frequencies than the other violins.
However, we found no obvious preference-related trends in
signature modes overall. There appears to be no association
between mode frequency spacings and preference. Finally,
we found no links between bridge mobility correlations and
preference.
A couple of considerations are necessary about the in-
terpretation of these results. First, participants in this ex-
periment were asked to rate different violins according to
preference rather than quality. However, preference judg-
ments may be different from quality assessments. For exam-
ple, two hypothetical players may prefer the same violin but
rate its quality differently. Second, even though participants
were self-consistent in their preference for the violins, we ob-
served a significant lack of agreement between individual vi-
olinists. This is likely due to the fact that the perceptual eval-
uation of violin attributes widely considered to be essential
to preference strongly varies across players [11]. Therefore,
we need to better understand how these perceived qualities
are assessed, and how they relate to measurable acoustical
properties of the violin.
Proceedings of the Acoustics 2012 Nantes Conference 23-27 April 2012, Nantes, France
3609

AcknowledgmentsThis project has been partially funded by the Centre for
Interdisciplinary Research in Music Media and Technology
(CIRMMT) and the Natural Sciences and Engineering Re-
search Council of Canada (NSERC). All violin shoulder rests
were generously provided by Kun Shoulder Rest Inc. (Ot-
tawa, Ontario, Canada). We are grateful to luthiers Wilder
& Davis and Olivier Perot for loaning the violins used in the
experiment.
References[1] Alonso Moral, J. & Jansson, E. V. Input admittance,
eigenmodes and quality of violins. Tech. Rep. STL-
QPSR 2-3, Dept. for Speech, Music and Hearing, KTH
(1982).
[2] Jansson, E. V. Admittance measurements of 25 high
quality violins. Acust. Acta Acust. 83, 337–341 (1997).
[3] Dunnwald, H. Deduction of objective quality param-
eters on old and new violins. In Hutchins, C. M. &
Benade, V. (eds.) Research Papers in Violin Acous-tics 1975-1993, 50–63 (Acoustical Society of America,
1997). Reprinted (1991).
[4] Fritz, C., Blackwell, A. F., Cross, I., Woodhouse, J. &
Moore, B. C. J. Exploring violin sound quality: In-
vestigating English timbre descriptors and correlating
resynthesized acoustical modifications with perceptual
properties. J. Acoust. Soc. Am. 131, 783–794 (2012).
[5] Bissinger, G. & Gregorian, A. Relating normal mode
properties of violins to overall quality: Part I: Signa-
ture modes. Catgut Acoust. Soc. J. (Series II) 4, 37–45
(2003).
[6] Hutchins, C. M. A measurable controlling factor in the
tone and playing qualities of violins. Catgut Acoust.Soc. J. (Series II) 1, 10–15 (1989).
[7] Schleske, M. Empirical tools in contemporary violin
making: Part I. Analysis of design, materials, varnish,
and normal modes. Catgut Acoust. Soc. J. (Series II) 4,
50–64 (2002).
[8] Bissinger, G. & Gearhart, F. A standardized qualitative
violin evaluation procedure? Catgut Acoust. Soc. J.(Series II) 3, 44–45 (1998).
[9] Bissinger, G. Structural acoustics of good and bad vio-
lins. J. Acoust. Soc. Am. 124, 1764–1773 (2008).
[10] Cremer, L. The Physics of the Violin (The MIT Press,
Cambridge MA, 1984).
[11] Saitis, C., Giordano, B. L., Fritz, C. & Scavone, G. P.
Perceptual evaluation of violins: A quantitative analy-
sis of preference judgements by experienced players. J.Acoust. Soc. Am. (Submitted).
Proceedings of the Acoustics 2012 Nantes Conference23-27 April 2012, Nantes, France
3610