brice theodore willey - defense technical information center · brice theodore willey september...
TRANSCRIPT
o GO
CO N Q
USAAYLABS TECHNICAL REPORT 69-48 l
i
INSTABILITY OF GLASS FIBER REINFORCED PLASTIC PANELS UNDER AXIAL COMPRESSION
Brice Theodore Willey
September 1971
EUSTIS DIRECTORATE Ü. S. ARMY AIR MOBILITY RESEARCH AND DEVELOPMENT LABORATORY
FORT EUSTIS, VIRGINIA CONTRACT DA 44-17^-AMC-115(T)
STANFORD UNIVERSITY STANFORD, CALIFORNIA
Approved for public release; distribution unlimited.
Reproduced by
NATIONAL TECHNICAL INFORMATION SERVICE
Springfield,' Va. 221SI
- D D C
Ä DEC 27 \971
J iElSElIU&Ui - c tol
Unclassified fcaaa saaMBSa
DOCUMINT CONTROL DATA -R&D (Urnmltf €UtutUKttfm ml IH$m, tt<| W «»«l—l —< ^grtM ggglpWJ» giMg »« wwwrf -fc«» »» »wmrmU mmrt Im «I—W<i
I ORiaiNATIM« »CTIVlTr fCl
Stanford University Stanford, California
is.mtPomr IBCUKITV CLAKIFICATION
Ilaclaaaltted
* REPORT TITL«
INSTABILITY OF GLASS FIBER REINFORCED PLASTIC PANELS UNDER AXIAL COMPRESSION
«. DttcRiPTiva morm»(Trpm »tHftttrnt*tMlmlwu
■ AUTNomik vans* -MI« BBR sasar Bruce Theodore Willey
■■»ORT OATB '"'
September 1971 TOT4IL MO. C
60 »*. MO.
M. CONTRACT OR «RANT NO
DA 1^-177-AIC-115(T) k. RROJBCT NO.
Task lFl6220ltA17002
•a. ORIRINATOR*« RMORT NUMRCRUM
USAAVLABS Technical Report 69-U8
, OTMKR RKRORT wem (Aar
•e. OI«TRIRUTION «TATBMCNT
Approved for public release; distribution unlimited.
X
I». tROWOWIW MLIT
Fustis Directorate U.S. Army Air Mobility RüP Laboratory Fort Fustis, Virginia
it AtsTRÜf
This report shows that the so-called strain reversal method is of little value in interpreting test data obtained on compressed panels. At the same time it demonstrates that the Southwell and large displacement techniques both give results, assoclahle with theory.
DD .'■•?..t473 Unclassified BSBS OBiHIESK
DISCLAIMERS
The findings in this report are not to be construed as an official Department of the Array position unless so designated by other authorized documents.
When Government drawings, specifications, or other data are used for any purpose other than in connection with a definitely related Government procurement operation, the United States Government thereby incurs no responsibility nor any obligation whatsoever; and the fact that the Government may have formulated, furnished, or in any way supplied the said drawings, specifications, or other data Is not to be regarded by implication or otherwise as in any manner licensing the holder or any other person or corporation, or conveying any rights or permission, to manufacture, use, or sell any patented invention that may in any way be related thereto.
Trade names cited in this report do not constitute an official endorse- nent or approval of the use of such commercial hardware or software.
DISPOSITION INSTRUCTIONS
Destroy this report when no longer needed. Do not return it to the originator.
JSESUW
«11 WHin SMTIM IN tm 3ECTI.WI a
WMMDIKHI D
J«TIFICATIO«
aK
IT ...... 1 BlST1«IBiniO«/»V»ri«ILITT Ci.i-
||$T. ! kU\L Ud« SP«"-
ä 1
täfftää Icatlon
noL( | WT
Axial Compression Reinforced Plastic Panels Instability Strain Reversal Southwell Method Large Displacement Technique
Unclassified Security CUsaiflculion 935J-71
■ . ■
DEPARTMENT OF THE ARMY U. S. ARMY AIR MOBILITY RESEARCH A DEVELOPMENT LABORATORY
EUSTIS DIRECTORATE FORT EUSTIS, VIRGINIA 23604
This research effort was carried out under Contract DA 44-177-AMC-115(T) by Stanford University to study the instability of glass reinforced plas- tic panels under axial compression.
The report has been reviewed by this Directorate and is considered to be technically sound. It is published for the exchange of information and the stimulation of future research.
This program was conducted under the technical management of Mr. James P. Waller, Structures Division.
Task 1F162201+A17002 Contract DA 44-177-AMD-115(T)
USMVLABS Technical Report 69-48 September 1971
INSTABILITY OF GLASS FIBE REINFORCED PLASTIC PANELS UNDER AXIAL COMPRESSION
By
Bruce Theodore Willey
Prepared by
Department of Aeronautics and Astronautics Stanford University Stanford, California
for
EUSTIS DIRECTORATE U.S. ARMY AIR MOBILITY RESEARCH AND DEVELOPMENT LABORATORY
FORT EUSTIS, VIRGINIA
Approved for public release; distribution unlimited.

.
SUMMARY
This report deals with the stability of flat panels of fiber reinforced plastic when subjected to axial compression and the factors affecting this stability. Prime attention was paid to the methods of data inter- pretation. The results demonstrate in a conclusive fashion that the so termed strain reversal technique has no value in the interpretation of the data obtained in such tests. They show In an equally positive manner that both the Southwell and large deflection methods give identical results and these are associable with theoretical load levels. For ease of use the large displacement interpretation method is preferable.
Hi
FOREWORD
The research described herein is part of a general investigation of composite structures being conducted by the Department of Aeronautics and Astronautics at Stanford University, and sponsored by the U. S. Army Aviation Materiel Laboratories*under Contract DA 44-177-AMC-115(T)
^Redesignated Hustis Directorate, U.S. Army Air Mobility Research and Development Laboratory.

•
LANK Ir •
. l : ^ ^ ^
E t
*
•'
^am 'III' 111 M*: IMMW«iWM(MM«|
■
TABLE OF CQMTEKTS Page
SUMMARY lii
FOREWORD v
LIST OF ILLUSTRATIONS viii
LIST OF TABLES ix
LIST OF SYMBOLS x
IMTRODUCTION 1
DISCUSSION OF PROBLEM 2
OUTLINE OF THE RESEARCH PROGRAM k
DESCRIPTION OF SPECIMENS 5
MANUFACTURE OF SPECIMENS 6
SPECIMEN PREPARATION AND ASSEMBLY FOR TEST 11
TEST PROCEDURE AND INSTRUMENTATION 20
PRELIMINARY TESTS 27
STIFFUUSS MEASUREMENTS 30
DISCUSSION OF RESULTS 32
Critical Lcxids 32
Adjiistment for Stiffness 32
Dependence on Fiber Orientation ^1
Correlation of Southwell and Large Deflection Techniques ^1
Strain Reversal Technique h8
CONCLUSIONS ^9
REFERENCES , 50
DISTRIBUTION 51
vil
LIST OF ILLUSTRATIONS
Figure Page
1 Manufacture of Specimens 7
2 Specimen Assembly for Test 12
3 Load Cell 21
k Strain Gage Circuit 22
5 Test Rig in Machine with Large Square to Ensure Perpendicularity 23
6 Final Postition of Test Rig in the Test Machine 2k
7 Overall View of Test Setup 25
8 Load versus Deflection at Various Side Rail Clearances .... 28
9 Southwell Plot at Various Side Rail Clearances 28
10 Lateral Displacement versus Axial Strain 29
11 Stiffness Tester 31
12 Frequency Distribution of Buckling Loads 35
3 3 Probability Plots of Raw Data 36
Ik Probability Plots of Normalized Data 38
15 Critical Load versus Angle k2
16 Normalized Critical Load versus Angle 1*2
17 Large Deflection vs. Load (Strain Reversal) and Large Deflection and Southwell Plots, at Various Side Rail Clearances < ^3
18 Large Deflection vs. Load (Strain Reversal) and Large Deflection and Southwell Plots, at Various Side Rail Clearances kk
19 Large Deflection vs. Load, Large Deflection and Southwell Plots, at Various Side Rail Clearances ^5
20 Large Deflection vs. Load and Large Deflection and Southwell Plots, Panel Subjected to Small Normal Forces ^6
21 Normal Fcrce vs. Southwell Eccentricity ^T
viii

LIST OF TABLES
Table Fage
I Physical and Geometric Characteristics of Panels 17
II Test Data 33 #
III Summary of Means and Standard Deviations of Critical Loads ... **0
ix

iim
LIST OF SYMBOLS
deflections of the panel
E2
k
P
cr
t
W
w
Y
modulus in principal (axial) direction
modulus in secondary (antiaxlal) direction
factor depending upon side rail clearance
actual load on the specimen
Euler critical load ,
thickness
lateral displacement under load
initial imperfection (displacement)
i'
defined by equation (3)
Poisson's ratio
OTRODUCTION
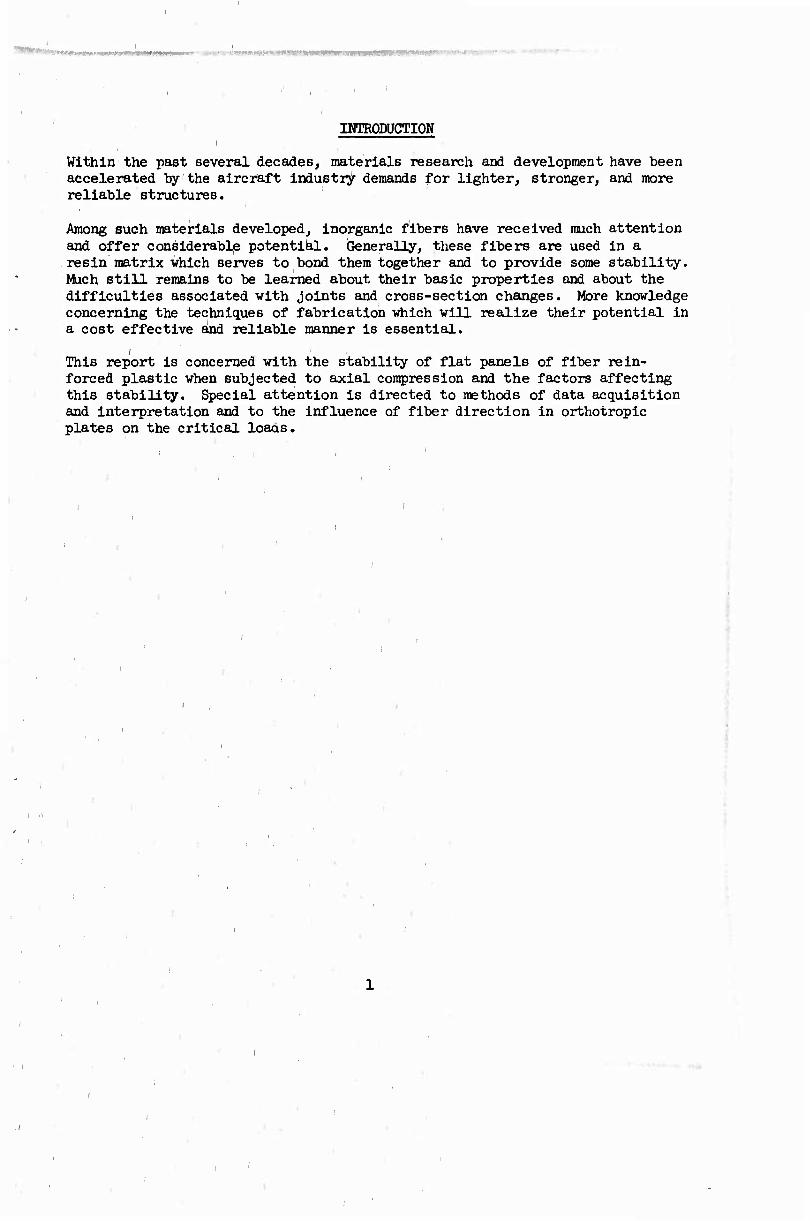
Within the past several decades, materials research and development have been accelerated by the aircraft industry demands for lighter, stronger, and more reliable structures.
Among such materials developed, inorganic fibers have received much attention and offer considerable potential. Generally, these fibers are used in a resin matrix vhich serves to bond them together and to provide some stability. Mach still remains to be learned about their basic properties and about the difficulties associated with joints and cross-section changes. More knowledge concerning the techniques of fabrication which will realize their potential in a cost effective and reliable manner is essential.
ThlB report is concerned with the stability of flat panels of fiber rein- forced plastic when subjected to axial compression and the factors affecting this stability. Special attention is directed to methods of data acquisition and interpretation and to the influence of fiber direction in orthotropic plates on the critical loaas.
i

DISCUSSION OF PROBLEM
All practical investigations of plate stability are marred by the difficulty of test data interpretation. A number of methods for deducing critical load level from load-displacement curves have been suggested1 and are in current usage. Two in particular find common acceptance. Theee are the so-called top-of-the-knee method and the strain-reversal procedure. The former tech- nique lacks precise definition and is difficult to apply , consequently, it cannot be seriously considered. The latter, although clearly definable, does not yield results which are correlatable with theory. Therefore, the first question to be resolved was what data should be acquired and what method should be adopted to analyze these data.
2 In 1933^ Donnell considered the stability of a panel on the basis of large deflection theory. He showed that the load, the initial imperfection amplitude, the final displacement, and the classic critical (Euler) load could be associated by the following equation:
8t
where
P = Actual load on specimen
P = Euler critical load cr
W = Initial imperfection (displacement)
W = Lateral displacement under load
t = Thickness
H = Poisson's ratio
It is clear from this expression that if W and W1 are small compared to t, then
P = Pcr "WfW7 (2)
3 a form which is identical to the Southwell expression for a column. It seemed desirable, therefore, to study whether or not such a process of data acquisition and interpretation leading to a Southwell analysis could be employed.
The basic equation (Equation l) can be considered in a different manner. Instead of requiring that W/t and W'/* 'both be small, the condition that W'/W be small could be imposed. When this is done,^ the equation reduces to a second approximate form,
P = Pcr (1 + VW2) (3)

where
y 3(1-^) y at2
Now clearly, in all cases, y is positive and W is real. Thus, Equation 3 applies only to the situation when P > P . In other words, the formulation applies only to the post-buckling situation. It is clear, too, that such a process requires that the material rei&ain elastic.
A comparison of these two processes seems essential. It also appears desir- able to use these methods in determining the effect on critical load when boundary conditions and initial imperfections are varied.
If a valid method of correlation with theory could be established, then a study of the effects of fiber direction in fiber-reinforced panels would be possible. Knowledge in this area would be of great interest in design.
OUTLINE OF THE RESEARCH PROGRAM
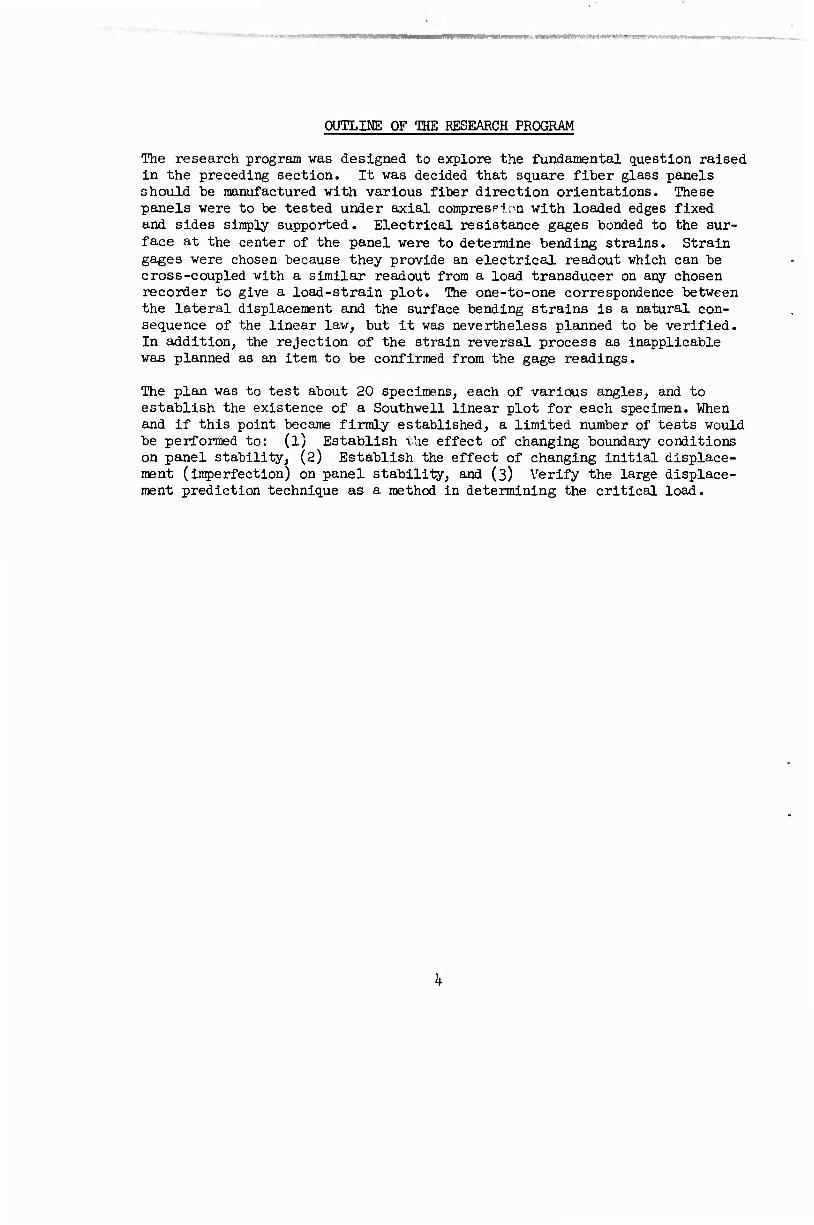
The research program vas designed to explore the fundamental question raised In the preceding section. It was decided that square fiber glass panels should he manufactured with various fiber direction orientations. These panels were to be tested under axial comprespl.m with loaded edges fixed and sides simply supported. Electrical resistance gages bonded to the sur- face at the center of the panel were to determine bending strains. Strain gages were chosen because they provide an electrical readout which can be cross-coupled with a similar readout from a load transducer on any chosen recorder to give a load-strain plot. The one-to-one correspondence between the lateral displacement and the surface bending strains is a natural con- sequence of the linear law, but it was nevertheless planned to be verified. In addition, the rejection of the strain reversal process as inapplicable was planned as an item to be confirmed from the gage readings.
The plan was to test about 20 specimens, each of various angles, and to establish the existence of a Southwell linear plot for each specimen. When and if this point became firmly established, a limited number of tests would be performed to: (l) Establish the effect of changing boundary conditions on panel stability, (2) Establish the effect of changing Initial displace- ment (imperfection) on panel stability, and (3) Verify the large displace- ment prediction technique as a method in determining the critical load.
wwmr-'y
DESCRIPTION OF SPECIMENS
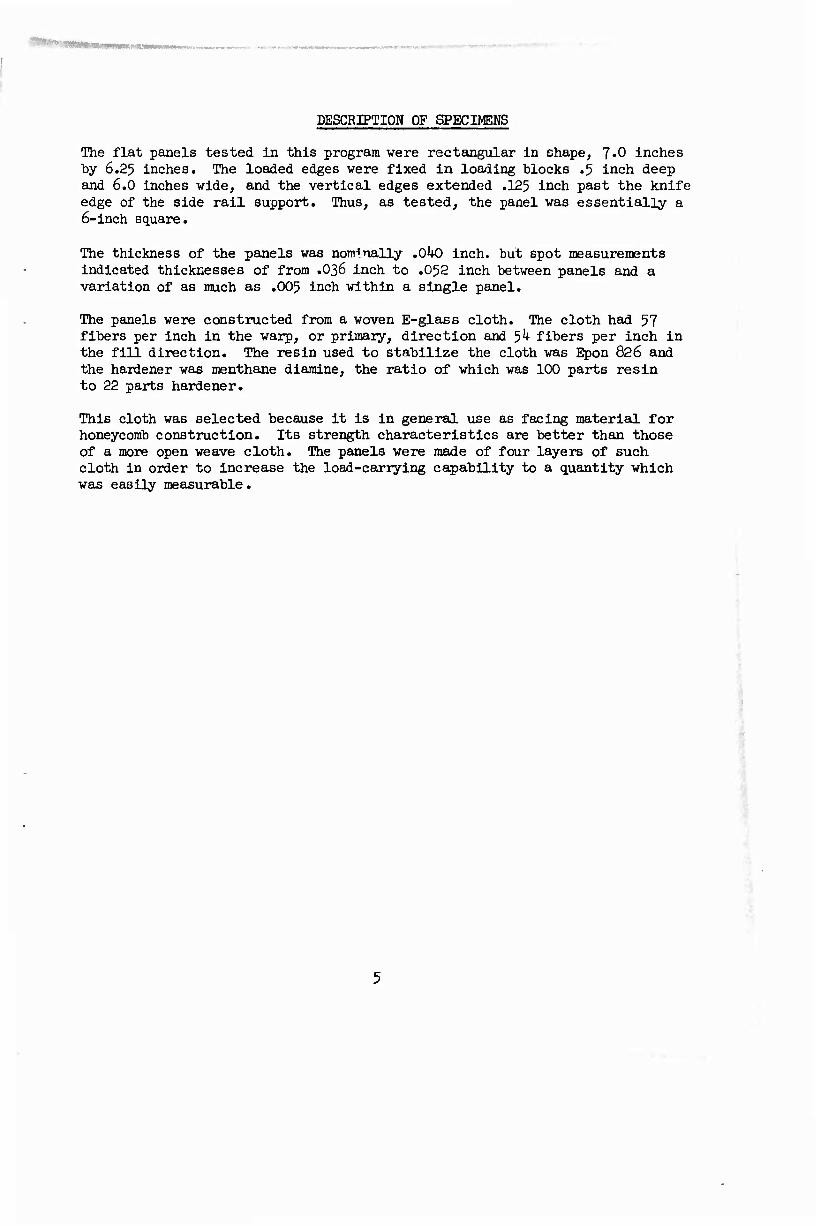
The flat panels tested in this program were rectangular In shape, 7*0 inches by 6.25 inches. The loaded edges vere fixed in loading blocks .5 inch deep and 6.0 inches wide, and the vertical edges extended .125 inch past the knife edge of the side rail support. Thus, as tested, the panel was essentially a 6-inch square.
The thickness of the panels was nominally .O^tO inch, but spot measurements Indicated thicknesses of from .036 inch to .052 inch between panels and a variation of as much as .005 inch within a single panel.
The panels were constructed from a woven E-glass cloth. The cloth had 57 fibers per inch in the warp, or primary, direction and 54 fibers per inch in the fill direction. The resin used to stabilize the cloth was Epon 826 and the hardener was menthane diamine, the ratio of which was 100 parts resin to 22 parts hardener.
This cloth was selected because it is in general use as facing material for honeycomb construction. Its strength characteristics are better than those of a more open weave cloth. The panels were made of four layers of such cloth in order to increase the load-carrying capability to a quantity which was easily measurable.
^
MAHUFACTURE OF SPECIMEINS
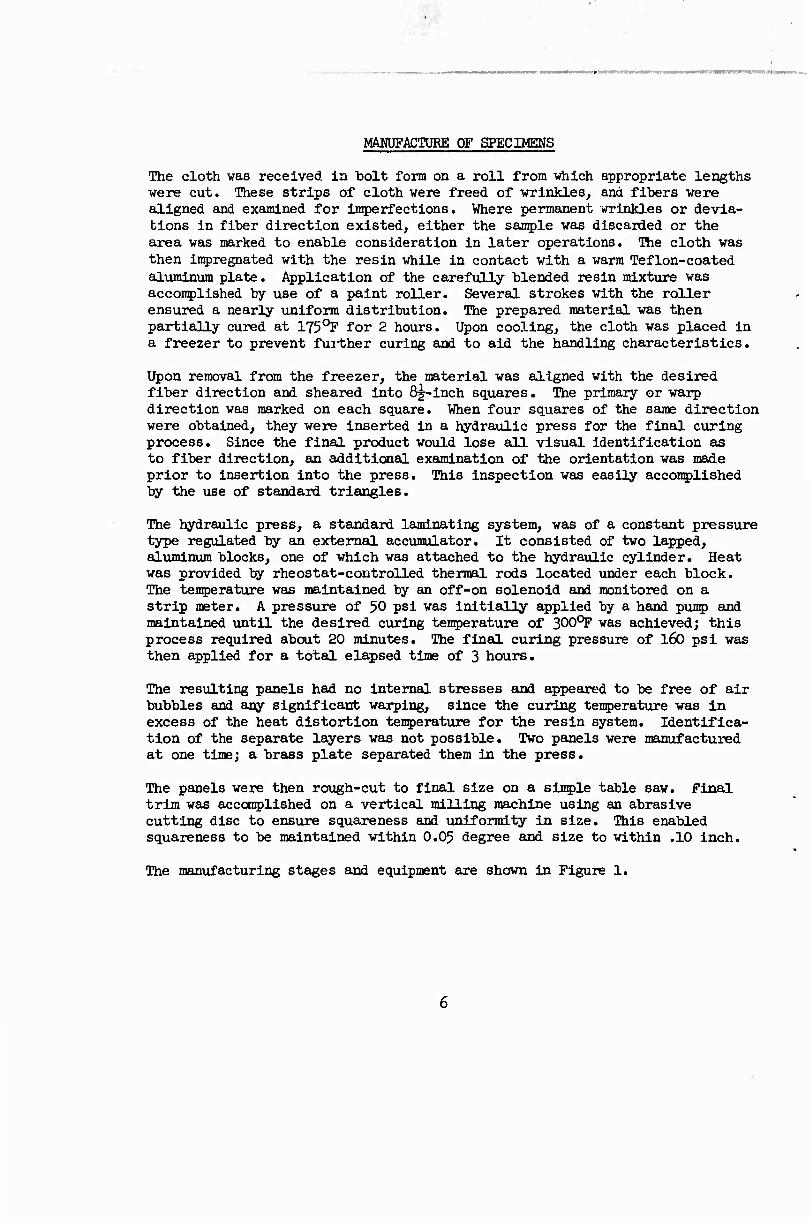
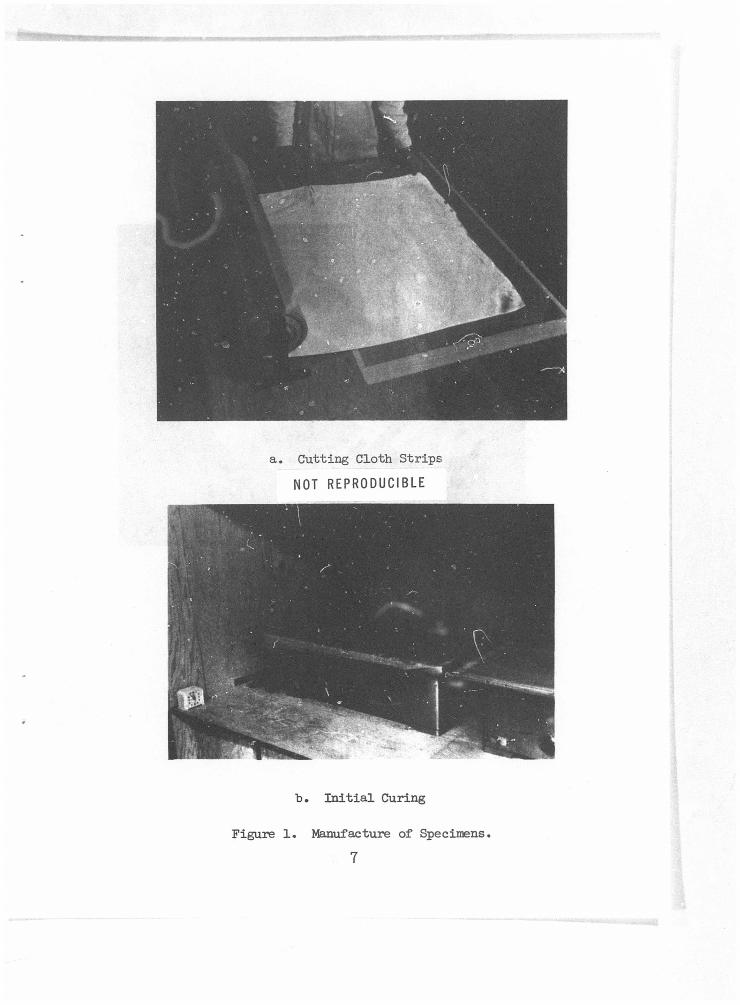
The cloth was received la bolt form on a roll from which appropriate lengths were cut. These strips of cloth were freed of wrinkles, and fibers were aligned and examined for imperfections. Where permanent wrinkles or devia- tions in fiber direction existed, either the sample was discarded or the area was marked to enable consideration in later operations. The cloth was then impregnated with the resin while in contact with a warm Teflon-coated aluminum plate. Application of the carefully blended resin mixture was accomplished by use of a paint roller. Several strokes with the roller ensured a nearly uniform distribution. The prepared material was then partially cured at 175°? for 2 hours. Upon cooling, the cloth was placed in a freezer to prevent fuither curing and to aid the handling characteristics.
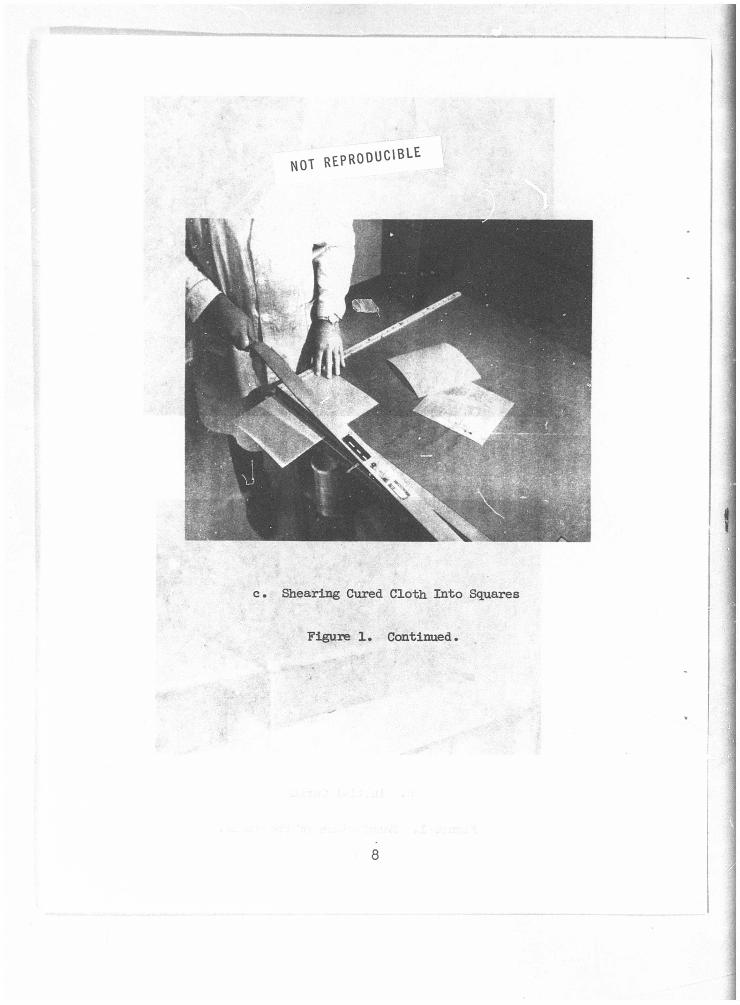
Upon removal from the freezer, the material was aligned with the desired fiber direction and sheared into 8^-inch squares. The primary or warp direction was marked on each square. When four squares of the same direction were obtained, they were inserted in a hydraulic press for the final curing process. Since the final product would lose all visual identification as to fiber direction, an additional examination of the orientation was made prior to insertion into the press. This inspection was easily accomplished by the use of standard triangles.
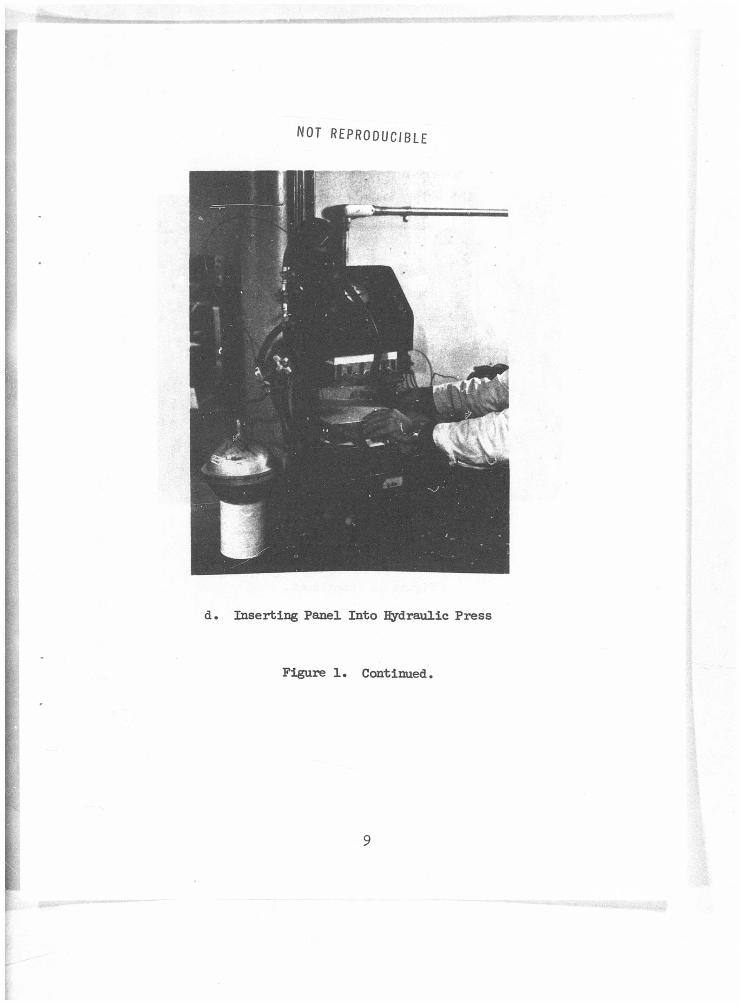
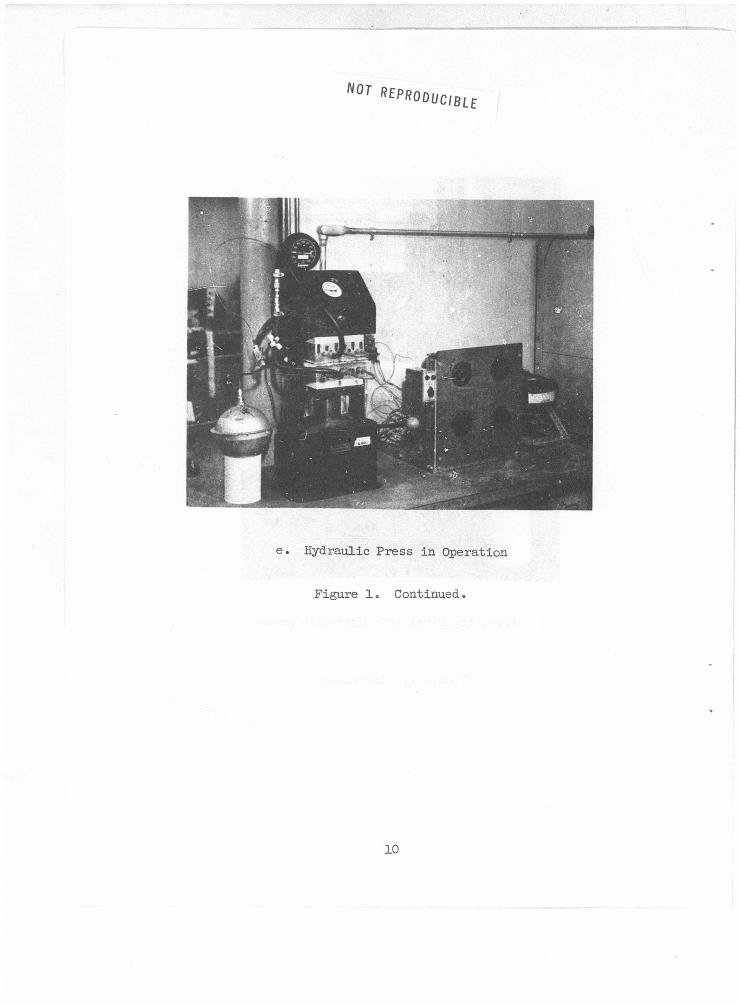
The hydraulic press, a standard laminating system, was of a constant pressure type regulated by an external accumulator. It consisted of two lapped, aluminum blocks, one of which was attached to the hydraulic cylinder. Heat was provided by rheostat-controlled thermal rods located under each block. The temperature was maintained by an off-on solenoid and monitored on a strip meter. A pressure of 50 psi was initially applied by a hand pump and maintained until the desired curing temperature of 300°? was achieved; this process required about 20 minutes. The final curing pressure of l60 psi was then applied for a total elapsed time of 3 hours.
The resulting panels had no internal stresses and appeared to be free of air bubbles and any significant warping, since the curing temperature was in excess of the heat distortion temperature for the resin system. Identifica- tion of the separate layers was not possible. Two panels were manufactured at one time; a brass plate separated them in the press.
The panels were then rough-cut to final size on a simple table saw. Final trim was accomplished on a vertical milling machine using an abrasive cutting disc to ensure squareness and uniformity in size. This enabled squareness to be maintained within 0.05 degree and size to within .10 inch.
The manufacturing stages and equipment axe shown in Figure 1.
a . Cutting Cloth Str ips
NOT REPRODUCIBLE
"b. Initial Curing
Figure 1. Manufacture of Specimens.
7
NOT REPRODUCIBLE
c. Shearing Cured Cloth Into Squares
Figure 1. Continued.
8
NOT REPRODUCIBLE
Insert ing Panel Into Hydraulic Press
Figure 1. Continued.
N0T REPRODUCIBLE
e. Hydraulic Press in Operation
Figure 1. Continued.
10
SPECIMEN PREPARATION AMT ASSEMBLI FOR TEST
The specimens, manufactured as described in the preceeding section, were first subjected to a series of physical and geometric examinations. Panels were inspected for excessive air bubbles and for discoloration due to ex- cessive air bubbles and for discoloration due to excessive heat. Any panels with extreme imperfections were discarded. The length and width of each were measured by a micrometer. In addition, the panels were weighed to the nearest 0.1 gram. Early attempts to iqeasure the thickness showed variations of up to .005 inch within each panel, and it was felt that the weight per unit area would be a more reasonable measure of the thickness than aty aver- aging technique. The results of these examinations are given in Table I. At this point, the panels were serialized to aid in "bookkeeping". Note that the first two digits of each serial number indicate the direction of the warp with respect to the intended loading dxrection.
Next, the strain gages were applied to the panel. Gages were cemented on both sides of each panel at the geometric center and were orientated parallel to the loading direction. Two types of gages were primarily used: Baldwin- Lima-Hamilton SR-k Type A-5 (G. F. 2.0l) and University Precision Type 1»0 (G. F. 2.0k), A few panels were equipped with Baldwin-Lima-Hamilton Type A-7 gages. Gage type assignments are shown in Table I.
When the SR-k cement had dried sufficiently, the panel was ready for assembly in the test rig. The sequence of assembly operations is shown in step-by- step form in Figure 2.
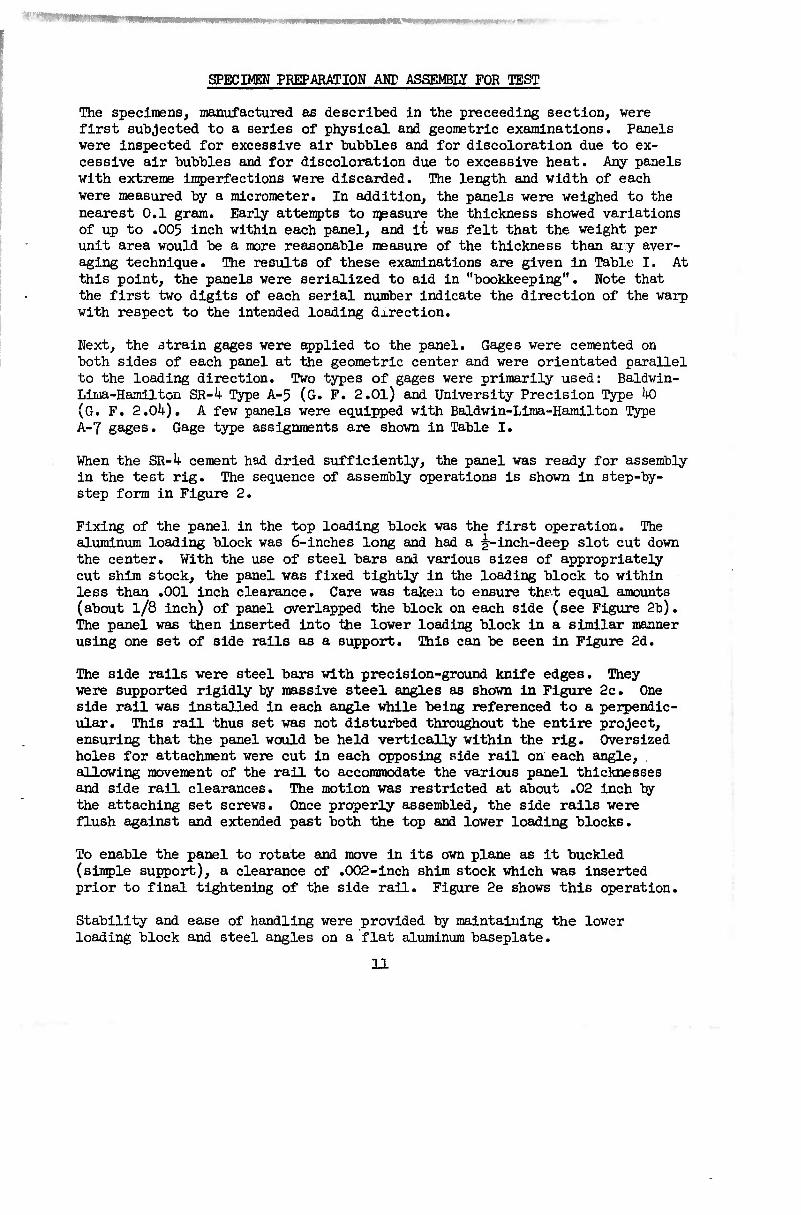
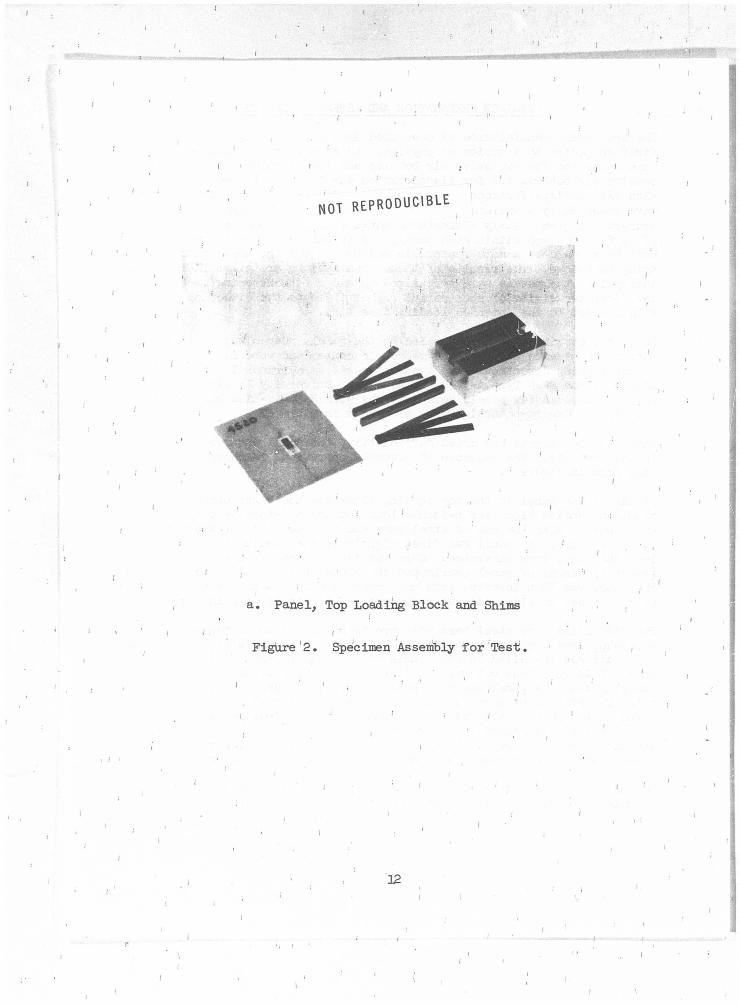
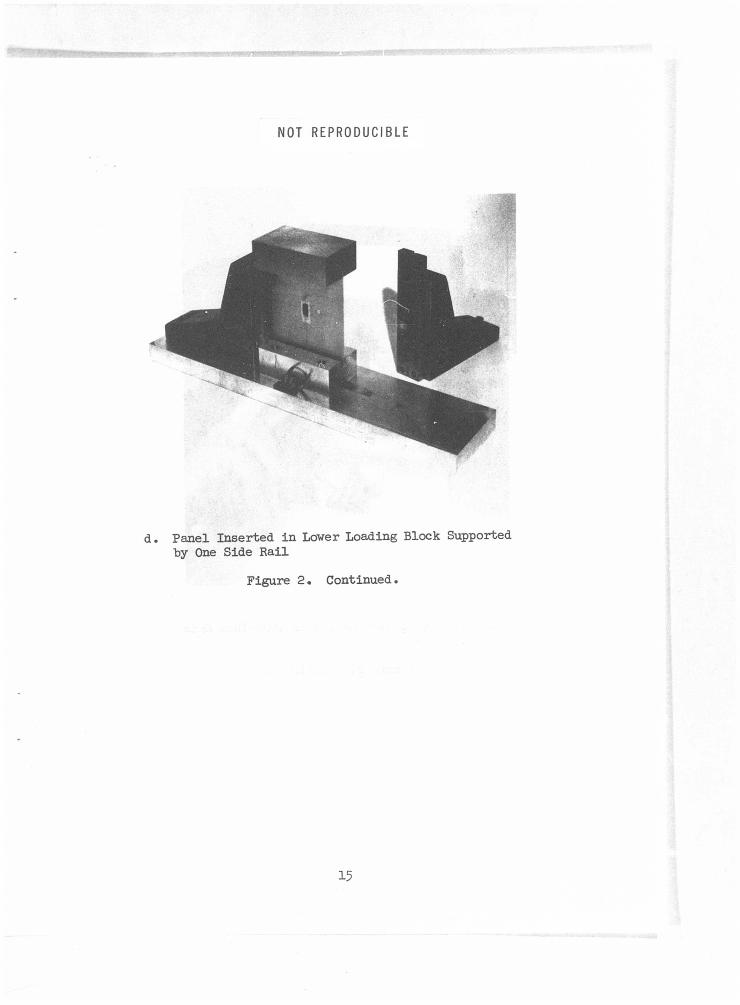
Fixing of the panel in the top loading block was the first operation. The aluminum loading block was 6-inches long and had a ^-inch-deep slot cut down the center. With the use of steel bars and various sizes of appropriately cut shim stock, the panel was fixed tightly in the loading block to within less than .001 inch clearance. Care was taken to ensure the.t equal amounts (about l/8 inch) of panel overlapped the block on each side (see Figure 2b). The panel was then inserted into the lower loading block in a similar manner using one set of side rails as a support. This can be seen in Figure 2d.
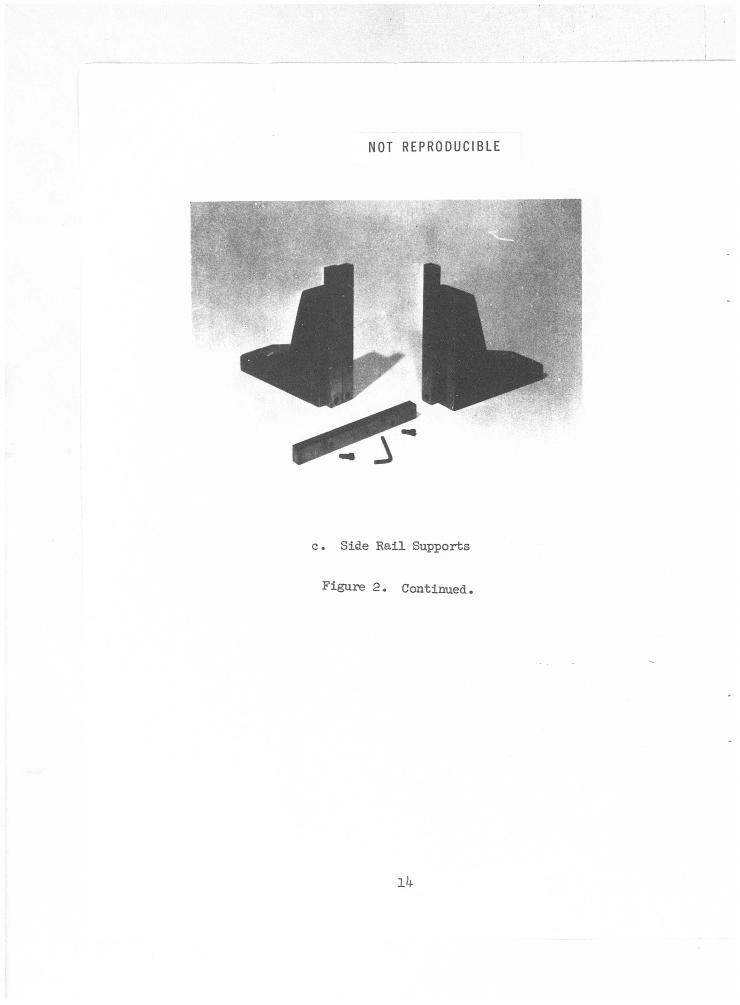
The side rails were steel bars with precision-ground knife edges. They were supported rigidly by massive steel angles as shown in Figure 2c. One side rail was installed in each angle while being referenced to a perpendic- ular. This rail thus set was not disturbed throughout the entire project, ensuring that the panel would be held vertically within the rig. Oversized holes for attachment were cut in each opposing side rail on each angle, allowing movement of the rail to accommodate the various panel thicknesses and side rail clearances. The motion was restricted at about .02 inch by the attaching set screws. Once properly assembled, the side rails were flush against and extended past both the top and lower loading blocks.
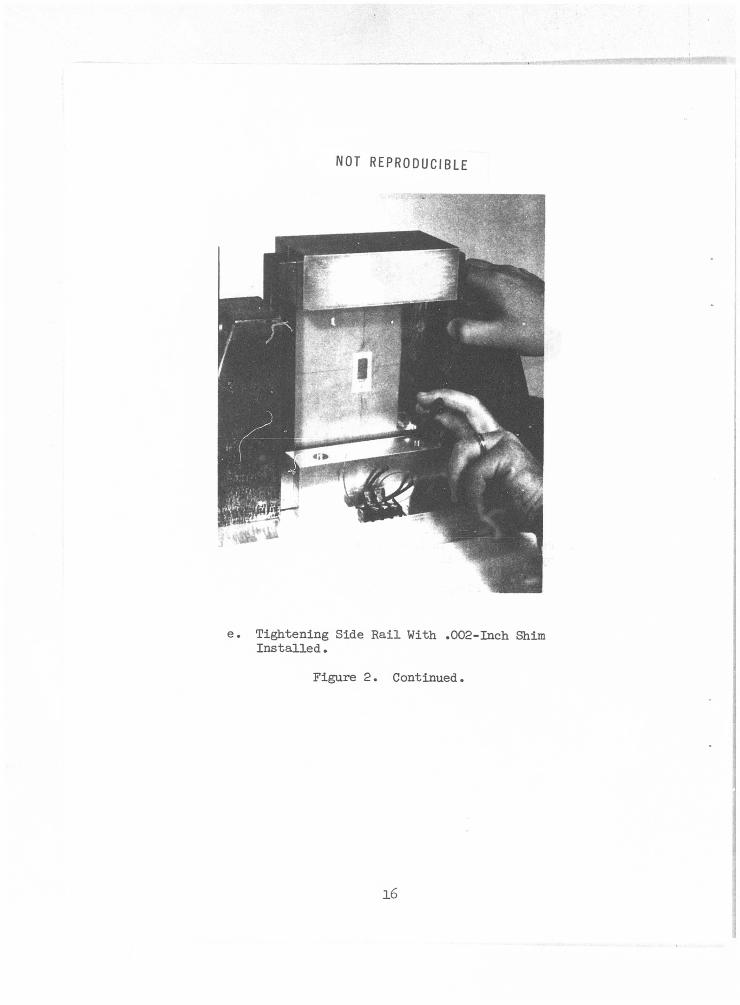
To enable the panel to rotate and move in its own plane as it buckled (simple support), a clearance of .002-inch shim stock which was inserted prior to final tightening of the side rail. Figure 2e shows this operation.
Stability and ease of handling were provided by maintaining the lower loading block and steel angles on a flat aluminum baseplate.
11
I
M wmrnmmmm*'11i
NOT REPRODUCIBLE
a. Panel, Top Loading Block and Shims
I
Figure 2. Specimen Assembly for Test.
12 I
Nor REPRODUCIBLE
1 1 i b. Panel Fixed in Top Loading Block With Lower Loading
1 Block and Base Plate. i
Figure 2. Continued.
i . . . i
i '
13
NOT REPRODUCIBLE
c. Side Rail Supports
Figure 2. Continued.
14
NOT REPRODUCIBLE
Panel Inserted in Lower Loading Block Supported "by One Side Rail
Figure 2. Continued.
15
NOT REPRODUCIBLE
e. Tightening Side Rail With .002-Inch Shim Installed.
Figure 2. Continued.
16
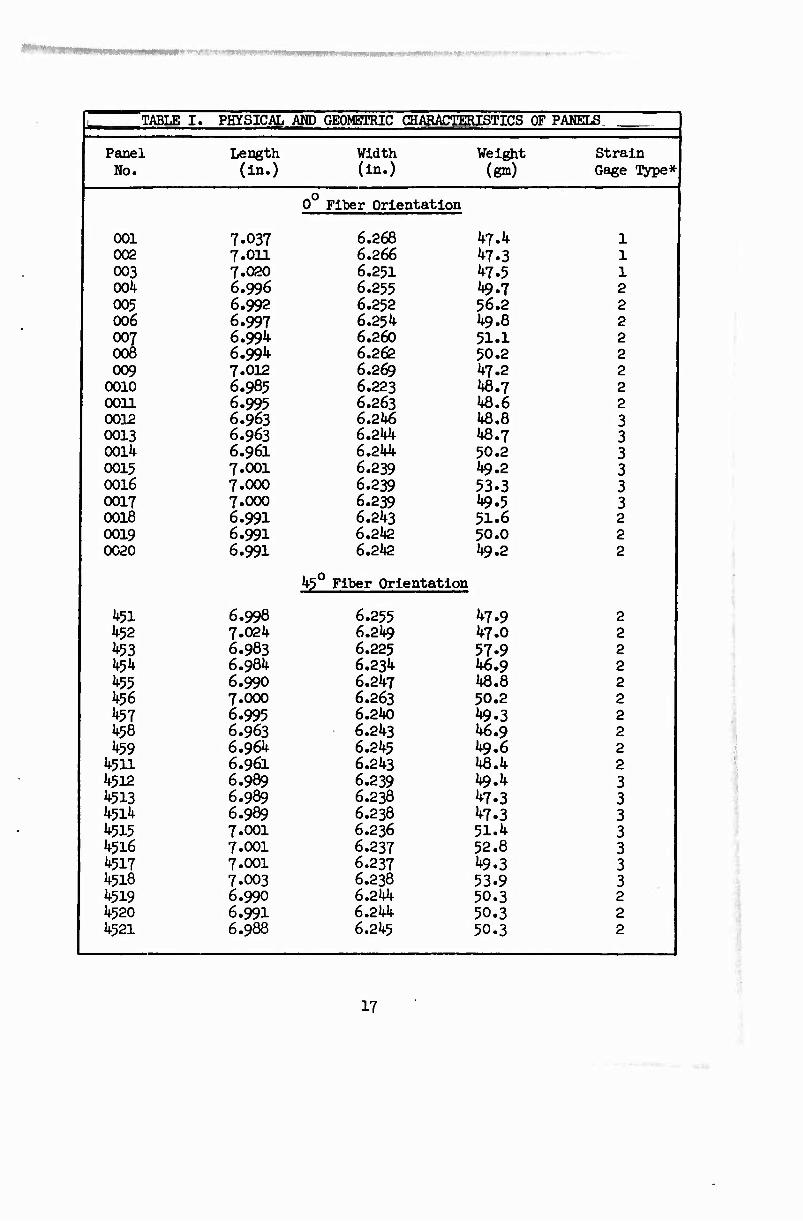
TABLE I. PHYSICAL AM) GEOMETRIC CHARACTERISTICS OF PAHELS
Panel No.
Length (in.)
Width (in.)
Weight (gm)
Strain Gage Type*
1*51 k32
k3Q ^59
4511 4512 4513 4514 4515 4516 4517 4518 4519 4520 4521
0 Fiber Orientation
001 7.037 6.268 47.4 l 002 7.011 6.266 ^7.3 l 003 7.020 6.251 ^7.5 l 004 6.996 6.255 »«9.7 2 005 6.992 6.252 56.2 2 006 6.997 6.254 49.8 2 007 008
6.991* 6.260 51.1 2 6.99^ 6.262 50.2 2
009 7.012 6.269 47.2 2 0010 6.985 6.223 48.7 2 0011 6.995 6.263 48.6 2 0012 6.963 6.246 48.8 3 0013 6.963 6.244 48.7 3 0014 6.961 6.244 50.2 3 0015 7.001 6.239 49.2 3 0016 7.000 6.239 53.3 3 0017 7.000 6.239 ^9.5 3 0018 6.991 6.243 51.6 2 0019 6.991 6.242 50.0 2 0020 6.991 6.2l»2
45° Fiber Orientatior
49.2
1
2
6.998 7.024 6.983 6.984 6.990 7.000 6.995 6.963 6.964 6.961 6.989 6.989 6.989 7.001 7.001 7.001 7.003 6.990 6.991 6.988
6.255 6.249 6.225 6.234 6.247 6.263 6.240 6.243 6.245 6.243 6.239 6.238 6.238 6.236 6.237 6.237 6.238 6.244 6.244 6.245
47.9 47.0 57.9 46.9 48.8 50.2 ^.3 46.9 49.6 48.4 49.4 ^7-3 ^7.3 51.4 52.8 ^9.3 53.9 50.3 50.3 50.3
2 2 2 2 2 2 2 2 2 2 3 3 3 3 3 3 3 2 2 2
17
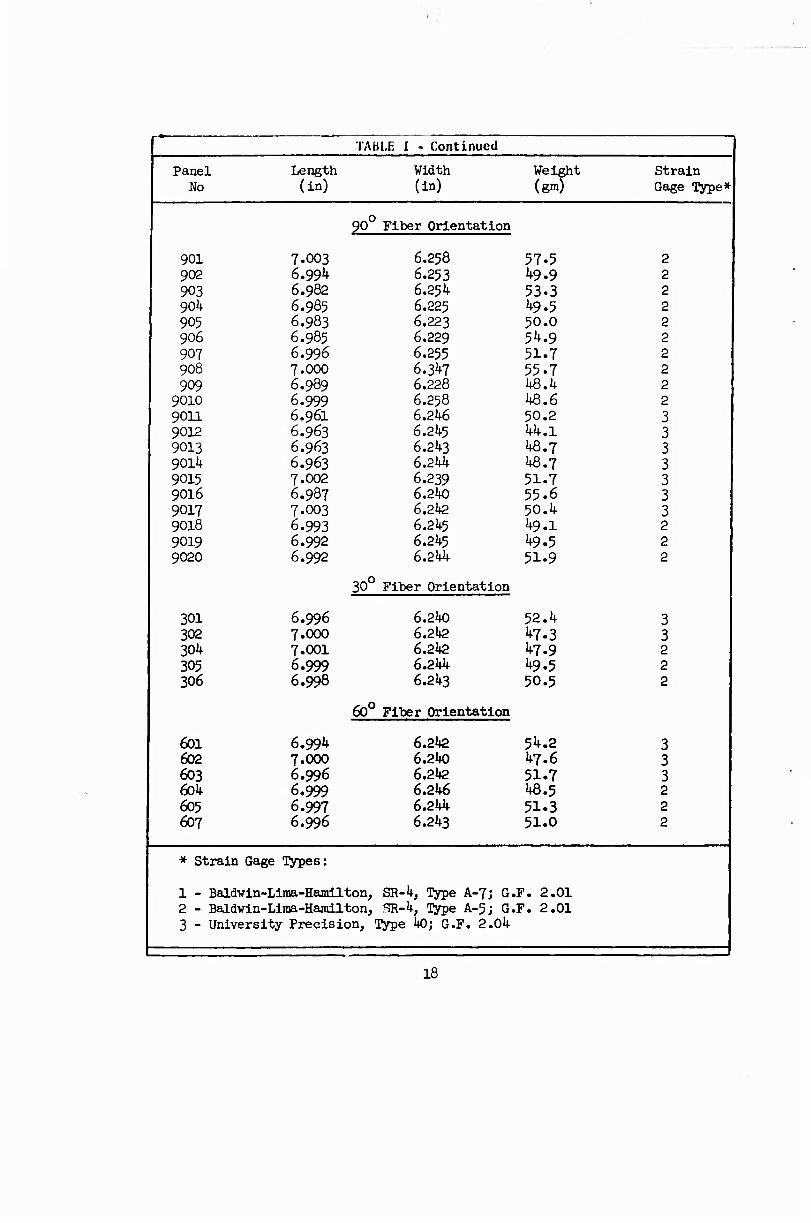
TABLE I - Continued
Panel No
Length (in)
Width (in)
Weight (gm)
Strain Gage Type*
90 Fiber Orientation
901 7.003 6.258 902 6.994 6.253 903 6.982 6.254 90^ 6.985 6.225 905 6.983 6.223 906 6.985 6.229 907 6.996 6.255 908 7.000 6.347 909 6.989 6.228
9010 6.999 6.258 9011 6.961 6.246 9012 6.963 6.245 9013 6.963 6.243 9014 6.963 6.244 9015 7.002 6.239 9016 6.987 6.240 9017 7.003 6.242 9018 6.993 6.245 9019 6.992 6.245 9020 6.992 6.244
30° Fiber Orientation
301 302 304 305 306
601 602 603 604 605 607
6.996 6.240 7.000 6.242 7.001 6.21)2 6.999 6.244 6.998 6.243
60° Fiber Orientation
6.994 6.242 7.000 6.240 6.996 6.242 6.999 6.246 6.997 6.244 6.996 6.243
57.5 49.9 53.3 49.5 50.0 54.9 51.7 55.7 4Ö.4 48.6 50.2 44.1 48.7 46.7 51.7 55.6 50.4 49.1 49.5 51.9
52.4 ^7-3 47.9 49.5 50.5
54.2 47.6 51.7 46.5 51.3 51.0
2 2 2 2 2 2 2 2 2 2 3 3 3 3 3 3 3 2 2 2
3 3 2 2 2
3 3 3 2 2 2
* Strain Gage Types:
1 - Baldwin-Lima-Hamilton, SR-4, Type A-7J G.F. 2.01 2 - Baldwin-Lima-Hamilton, SR-4, Type A-5; G.F. 2.01 3 - University Precision, Type kO; G.F. 2.04
18

Assembly was completed vhen the strain gage leads were soldered to wires leading from a terminal block on the baseplate. From the terminal block, cables were connected to the strain recording equipment.
19
■
■ • ■■MPI
TEST PROCEDURE AND INSTRUMENTATION
All tests were made in a Tinius-Olsen mechanical drive test machine. Since the loading rate was excessive for this type of test, the main drive pulley- was turned by hand. This allowed a controlled loading rate of about 100 pounds per minute, which was slow enough for strain gage response and re- cording.
Since the load levels anticipated were small, and since accuracy to the pound was required, the loads were determined by a load cell. This load cell, shown in Figure 3^ was an aluminum block into which a circular hole had been cut. The wall of the block was gaged with semiconductor gages. These were used in a bridge circuit excited by 5 volts dc. The response was .09675 milli- volt per pound of load.
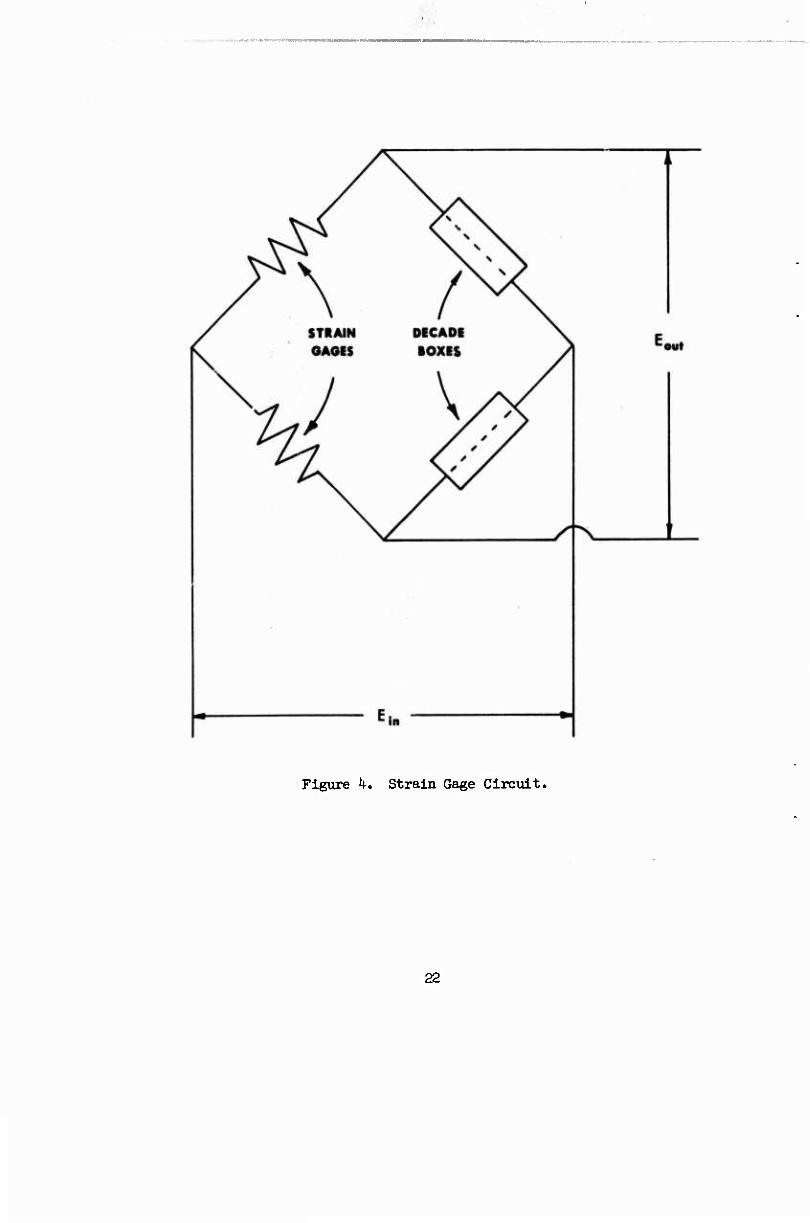
Panel strain gage circuitry is shown in Figure k. This arrangement of the bridge provided a signal voltage which was proportional to bending strain only; the axial compression strain was cancelled. It was anticipated that several types of strain gages would be used throughout the project. For this reason, two standard laboratory decade resistance boxes were used as the "dunmy gages" in the bridge. This seemed feasible since the change in strain over only a relatively short period of time was desired; thus, temp- erature change would not be a factor.
Initially, the load was recorded on a sly- channel Sanborn Model 100 BW pen recorder using a Sanborn Model l800 stabilized preamplifier. A Sanborn Model 1100 carrier preamplifier was used in conjunction with the panel strain gages. Later tests in the project used a Hewlett-Packard (Mosley Division) Model 7000 A X-Y recorder to display a direct record of load versus panel strain (deflection). In this case, the panel gages were excited by 5 volts.
The load cell was attached directly to the top loading head of the test machine so that the load was applied directly through it.
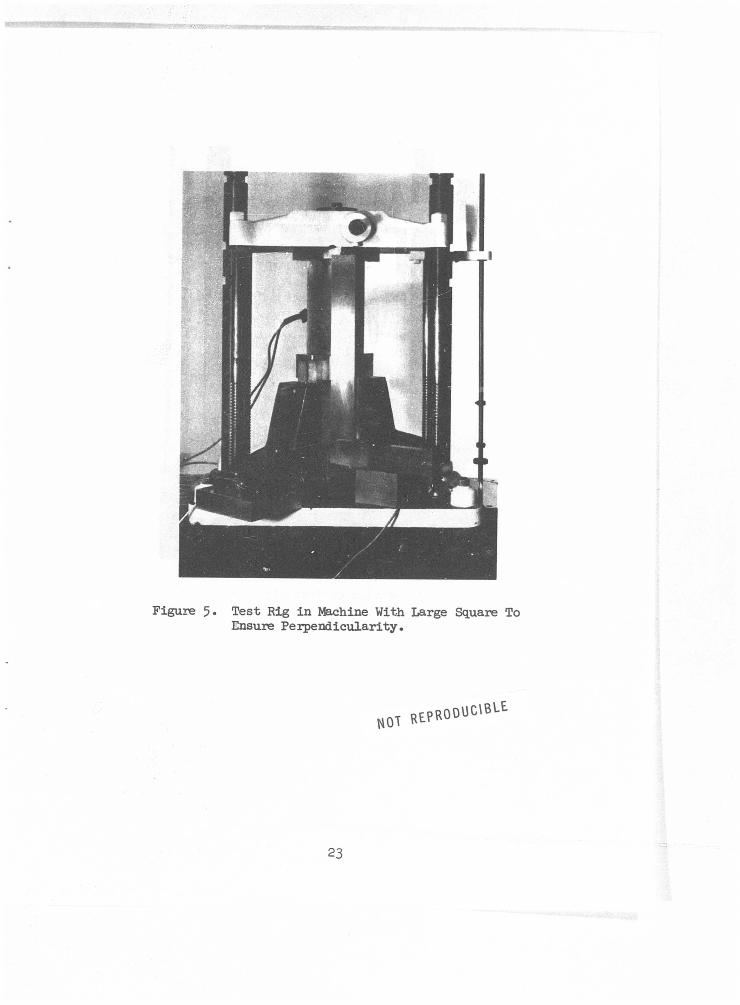
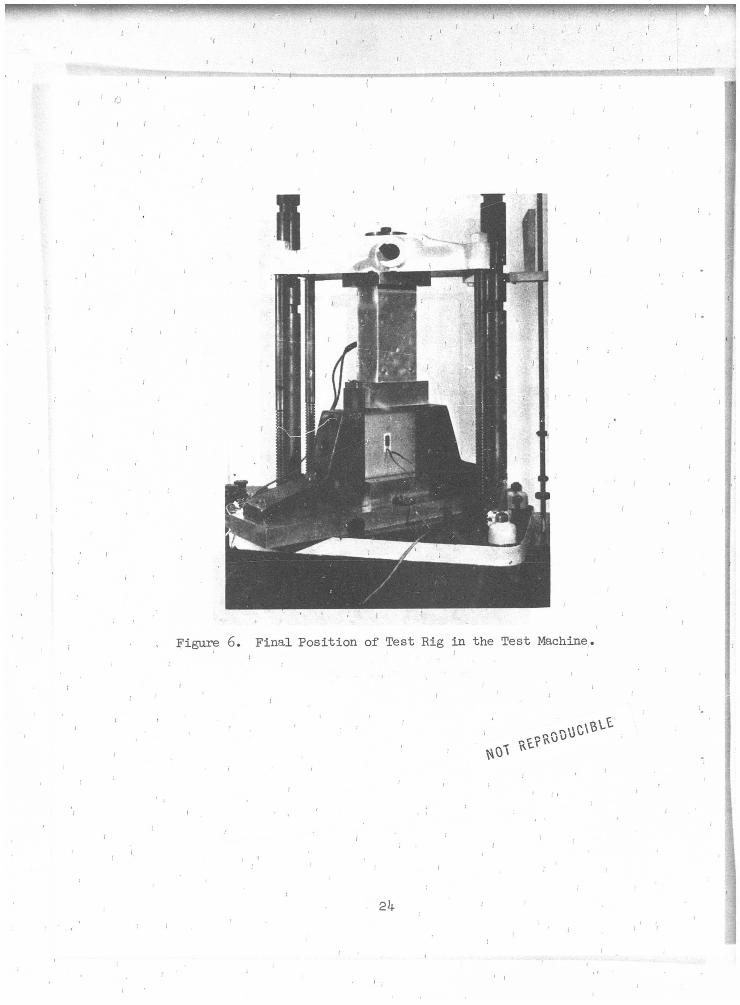
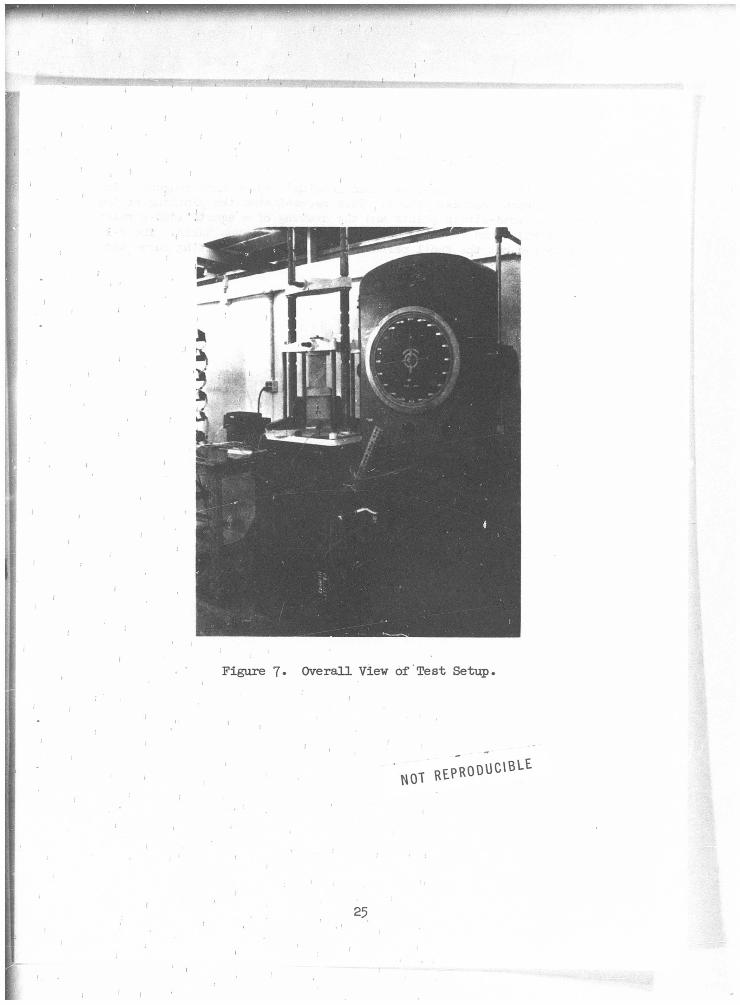
The test rig was placed in the test machine and aligned to fixed scribe marks on the loading platform. At this point, the load cell was lowered until it nearly touched the top loading block. A large square was then placed up against the top loading block to gain perpendicularity of this block with respect to the test machine table. With the block being held in this manner (see Figure 5), small pieces of shim stock were placed between it and the load cell to ensure a uniform distribution of load. Figures 6 and 7 show the final position of the rig in the test machine.
As stated previously, the actual loading was accomplished by hand turning the drive pulley of the test machine. The load was applied slowly until strain readings exceeded the recorder capability; in general, loads of greater than 200 pounds were not required to effect this. This provided all the necessary data for the Southwell analysis and minimized any possibility of damaging the panel. Of course, greater loads were used for the later large deflection tests.
At least two test runs were made on each panel to check repeatability. In a number of cases, the panel was completely retested; no damage to the panel
20
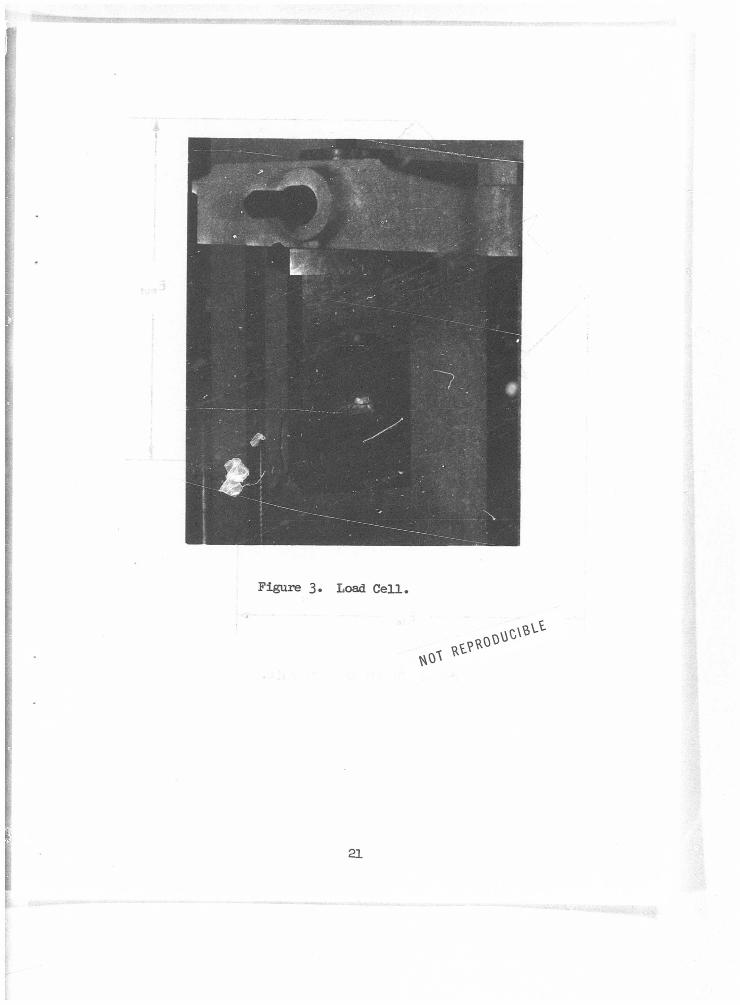
Figure 3 . Load C e l l .
21
•
Figure k. Strain Gage Circuit.
22
MHMCMH
Figure 5- Test Rig in Machine With Large Square To Ensure Perpendicularity.
NOT REPRODUCIBLE
23
in".11"! iMvqmi - - ™ - mm— ;•
Figure 6. Final Position of Test Rig in the Test Machine.
l
mpupp
Figure 7* Overall View of Test Setup
NOT RtPR0°uc,BLE

was apparent in any of these teets.
The irregularities introduced by "hand loading" caused some roughness in the early Sanbom recorder traces. This necessitated the plotting of the corresponding load-strain point« and the drawing of a smooth load-strain curve, from which the required Southwell information was taken. The X-Y recorder damped out the small perturbations, and the resulting curve was quite smooth.
26
PRELIMINARY TESTS
Prior to the commencement of the main project, several preliminary tests of a procedural nature were made. Of these, the most significant were a determination of the effect of human irregularities in test rig assembly on the final results and a check on the validity of using bending strain meas- urements as a direct measure of the panel's lateral deflection.
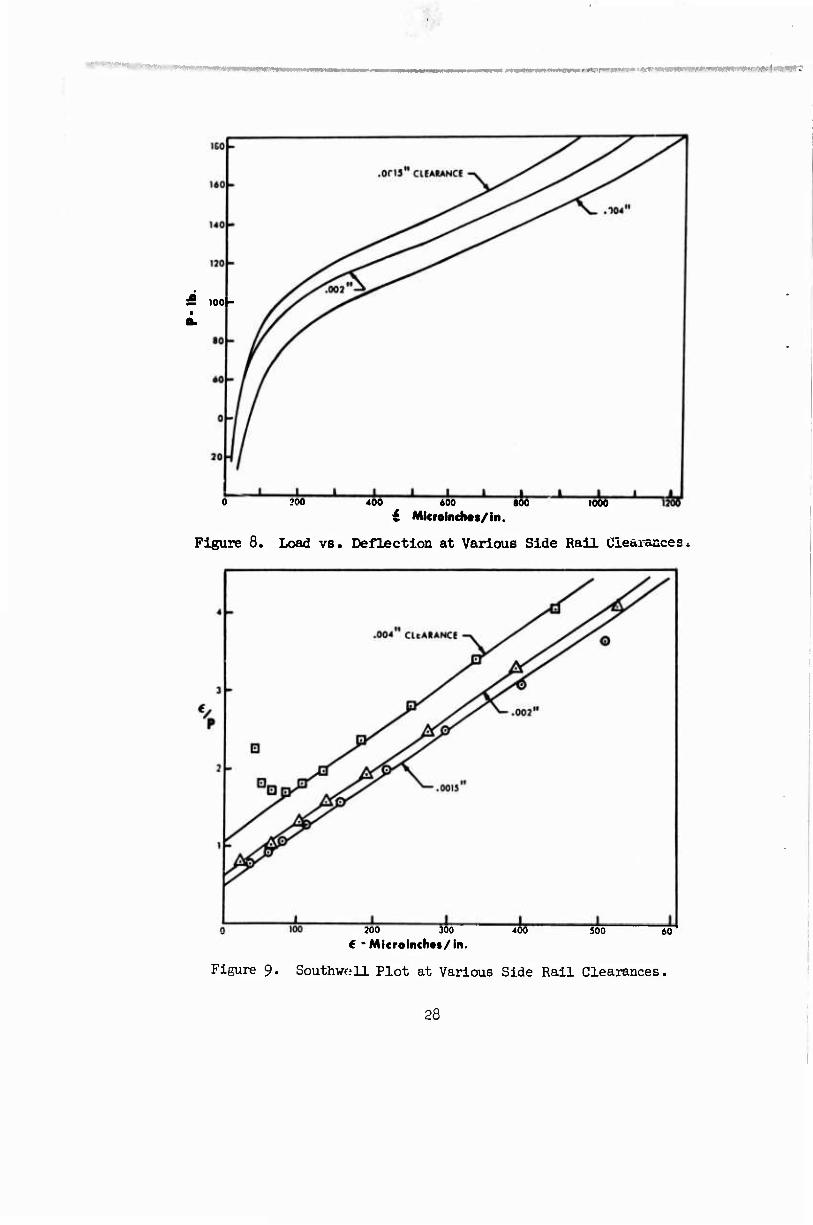
To determine the human influence on the test results, a single panel was assembled, tested, and disassembled several times. In addition, variable side rail clearances were used to introduce some obvious irregularities. The resulting load-strain curves indicated these variations plainly; but as expected, the variations were manifested in the Southwell analysis as "initial imperfections". The slope, and thus the critical load, remained essentially the same in all such tests, (see Figures 8 and 9)» Thus, any artificial irregularities introduced by inconsistency in specimen preparation are automatically accounted for in the Southwell analysis and do not material- ly affect the results as long as they are kept small.
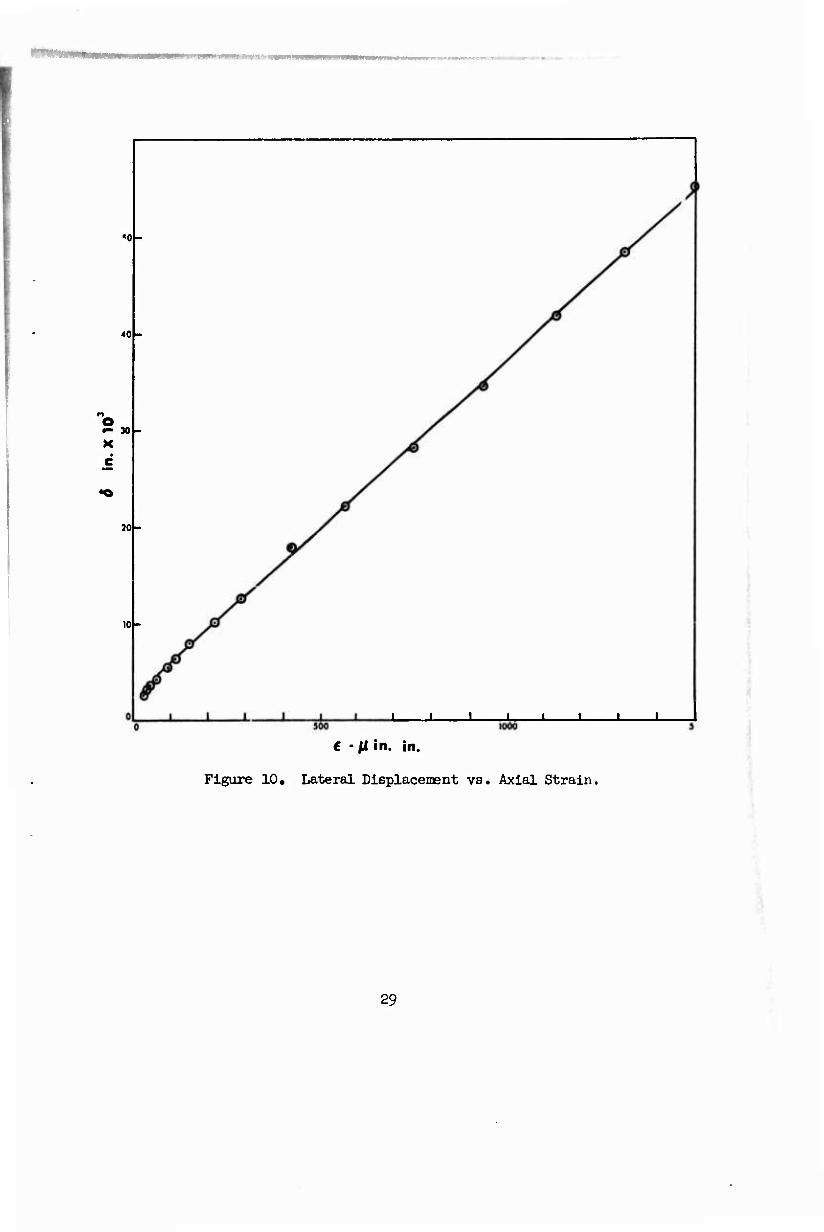
The contention that the lateral deflection can be determined directly by measuring the bending strain caused by the deflection was confirmed. Lateral deflection was measured by a l/lOOO dial gage and correlated with strain readings taken concurrently. It is seen from Figure 10 that the relationship between strain and deflection is indeed linear. Of interest here is that the deflections encountered were approximately .050 inch, i.e., of the order of panel thickness.
27
S looh
400 400 »00
i Micreinch«>/in. 1000
Figure 8. Load vs. Deflection at Various Side Rail uiearances.
200 300
€ -Microinchat/in. 4Ö0 500 60
Figure 9. Southwell Plot at Various Side Rail Clearances.
28
«0
40
o •- JO
20-
10-
J I I L J I L
€ •/! in. in.
Figure 10, Lateral Displacement vs. Axial Strain.
29
STIFFNESS MEASUHEMEin?
Upon completion of several tests, it became apparent that considerable scatter existed in the critical loads. This was not unexpected, since the critical load is dependent upon the cube of the thickness and since it had already- been determined that the variation in this quantity was substantial.
It was also felt that a modulus of elasticity difference could exist between the panels, thus contributing to additional irregularities in the results. Standard references on fiber glass plate instability^ state that the critical load is proportional to /£.£_ t^, where E., and E2 are the moduli measured in the principal (axial) and secondary (antiäxial) directions, and t is the panel thickness.
In an effort to gain a measurement of these quantities, the panels were sub- jected to a series of deflection tests. With the panel supported as a simple beam and a distributed load applied across the panel width, the center de- flection was measured. The deflection of a simply supported beam loaded as such is proportional to l/EI; and with panels of the same width, this ratio becomes l/Et3.
The stiffness tester is shown in Figure 11, Opposing l/lOOO dial gages were used to offset any deflection caused by the dial's probe. End supports were furnished by Teflon-covered knife edges, and the load was applied by two steel rods that extended past both sides of the panel. Care was taken to orientate all the panels and to apply the loads in the same position within the tester by use of fixed guide rails and pins. Each panel was so tested in both the principal and the secondary directions. Furthermore, both sides of the panel were tested. In some cases, a difference in the deflection existed from one side to the other due to a smaller amount of warping. The deflections in these cases were averaged.
30
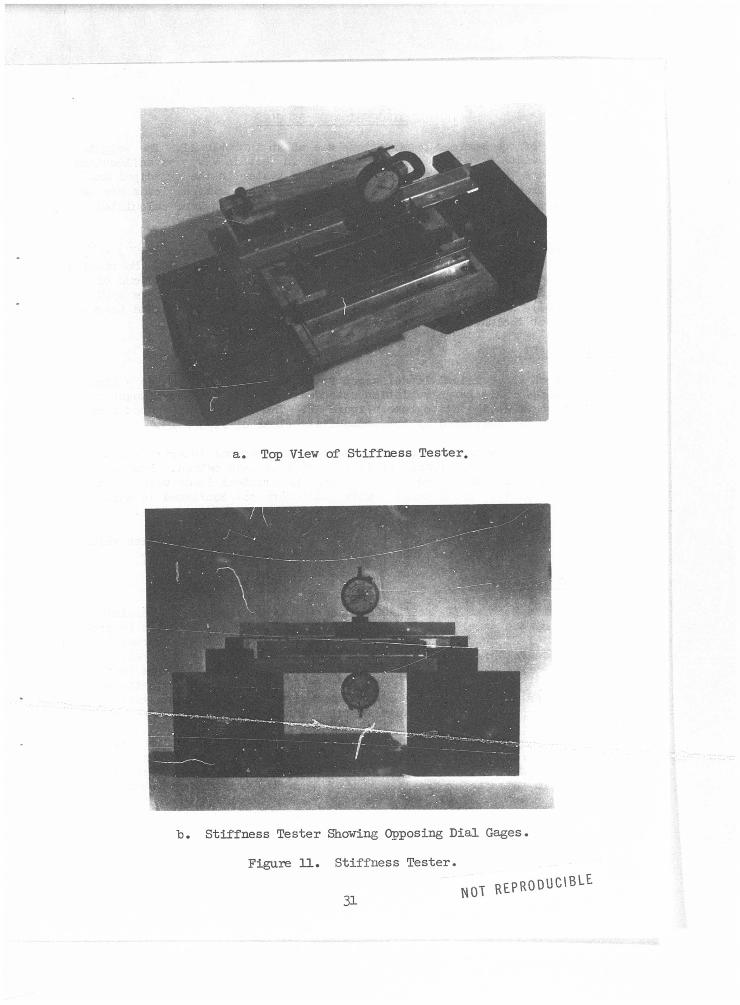
a. Top View of Stiffness Tester.
b. Stiffness Tester Showing Opposing Dial Gages.
Figure 11. Stiffness Tester.
NOT REPRODUCIBLE
.
DISCUSSION OF RESULTS
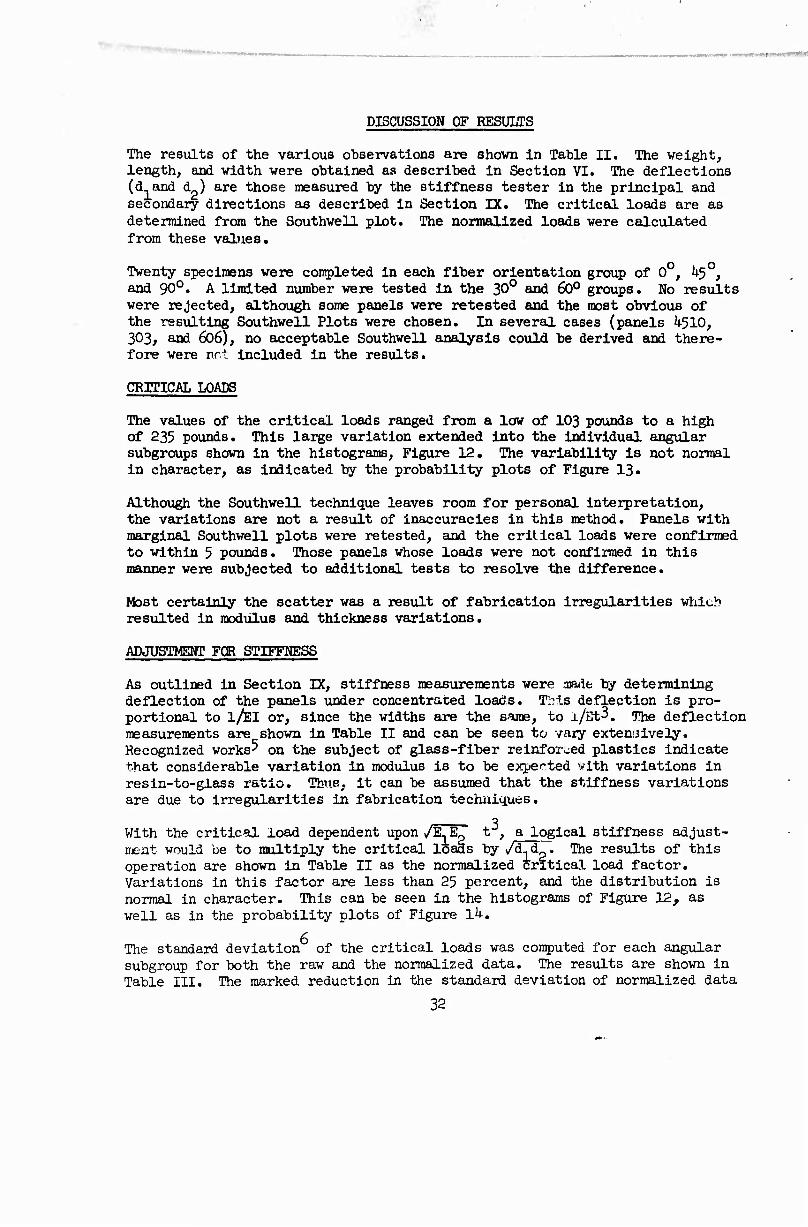
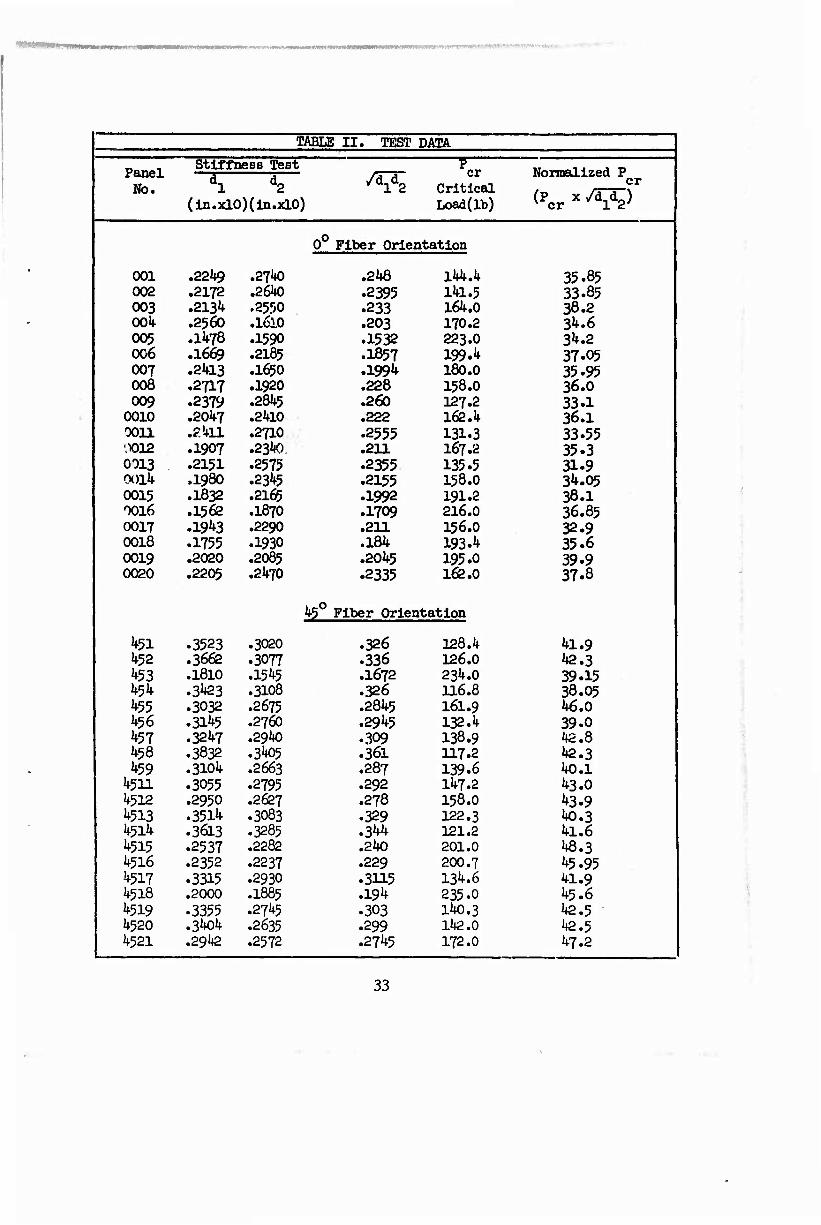
The results of the various observations are shown In Table II. The weight, length, and width were obtained as described in Section VI. The deflections (d and d ) are those measured by the stiffness tester in the principal and secondary directions as described in Section IX. The critical loads are as determined from the Southwell plot. The normalized loads were calculated from these values.
Twenty specimens were completed in each fiber orientation group of 0°, ^5°, and 90°. A limited number were tested in the 30° and 60° groups. No results were rejected, although some panels were retested sind the most obvious of the resulting Southwell Plots were chosen. In several cases (panels V?10, 303, and 606), no acceptable Southwell analysis could be derived and there- fore were not included in the results.
CRITICAL LOADS
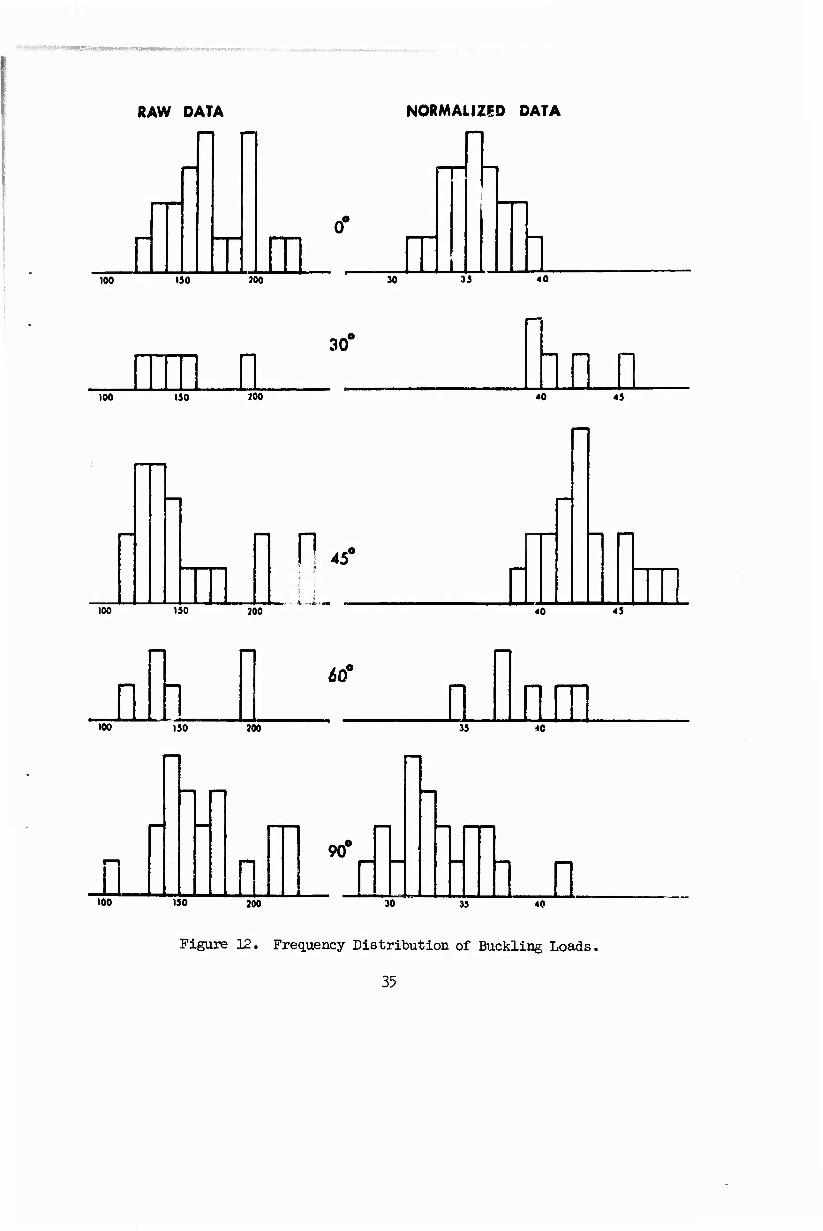
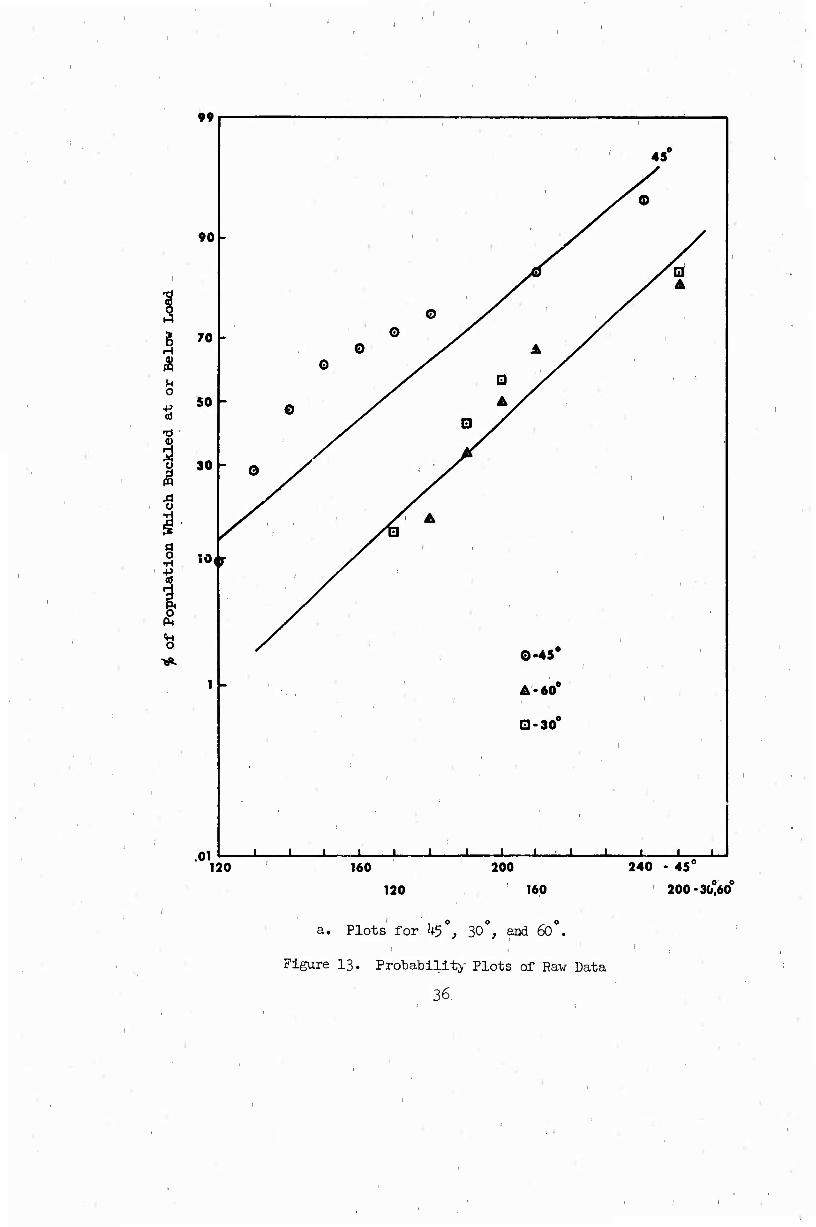
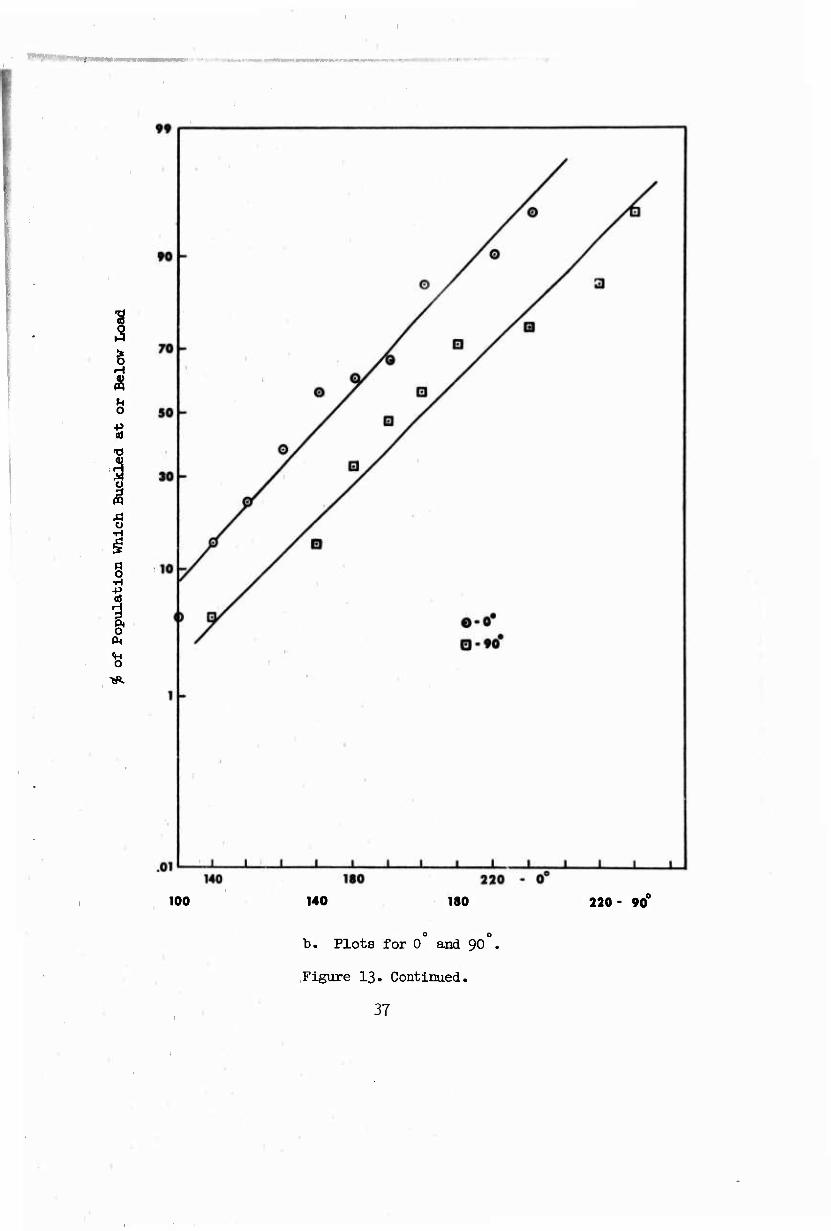
The values of the critical loads ranged from a low of 103 pounds to a high of 235 pounds. This large variation extended into the individual angular subgroups shown in the histograms, Figure 12. The variability is not normal in character, as indicated by the probability plots of Figure 13.
Although the Southwell technique leaves room for personell interpretation, the variations are not a result of inaccuracies in this method. Panels with marginal Southwell plots were retested, and the critical loads were confirmed to within 5 pounds. Those panels whose loads were not confirmed in this manner were subjected to additional tests to resolve the difference.
Most certainly the scatter was a result of fabrication irregularities which resulted in modulus and thickness variations,
ADJUSTMENT FOR STIFFNESS
As outlined in Section IX, stiffness measurements were made by determintag deflection of the panels under concentrated loads. Ts.Xa deflection is pro- portional to l/EI or, since the widths are the same, to x/Et3. The deflection measurements are shown in Table II and can be seen to vary extenaively. Recognized works^ on the subject of glass-fiber reinforced plastics indicate that considerable variation in modulus is to be expected vith variations in resin-to-glass ratio. Thus, it can be assumed that the stiffness variations are due to irregularities in fabrication technlq.ues.
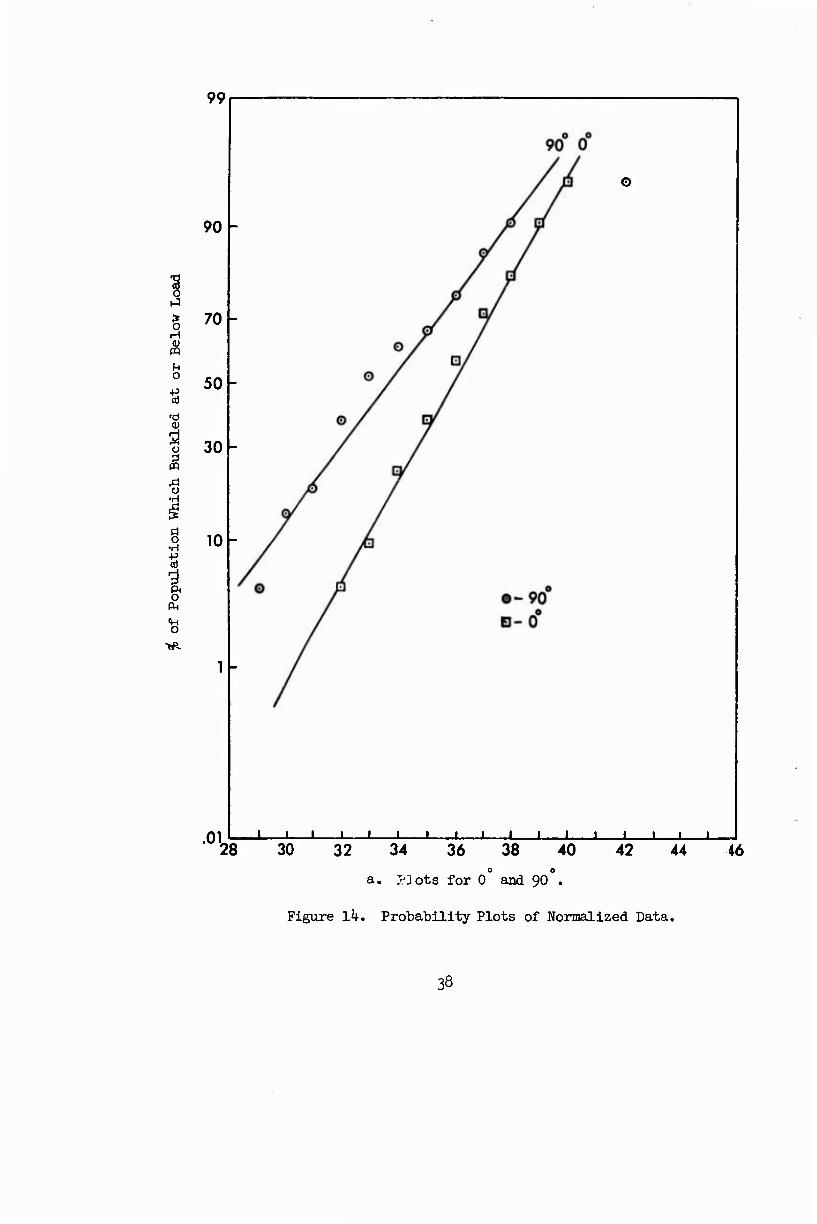
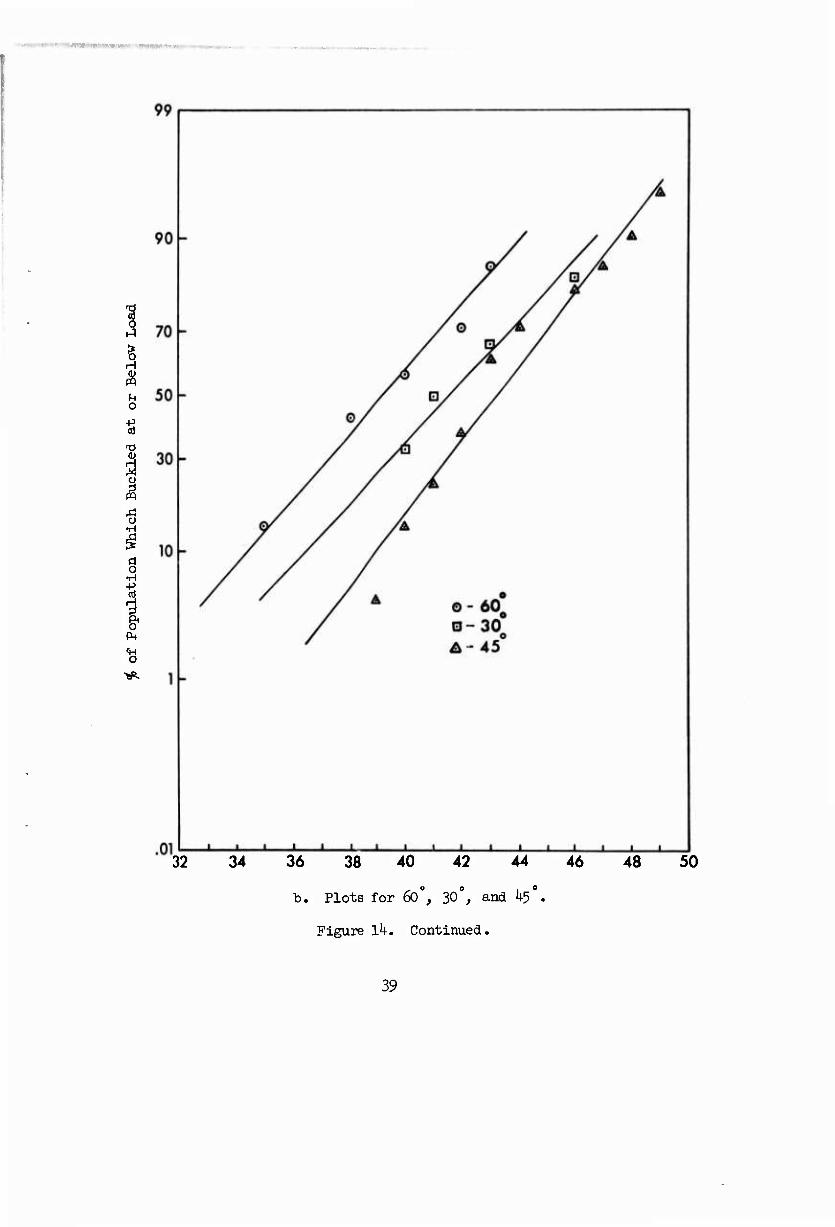
. 3 With the critical load dependent upon /K.E? t , a logical stiffness adjust- ment would be to multiply the critical loads by »/d^d . The results of this operation are shown in Table II as the normalized critical load factor. Variations in this factor are less than 25 percent, and the distribution is normal in character. This can be seen in the histograms of Figure 12, as well as in the probability plots of Figure lh.
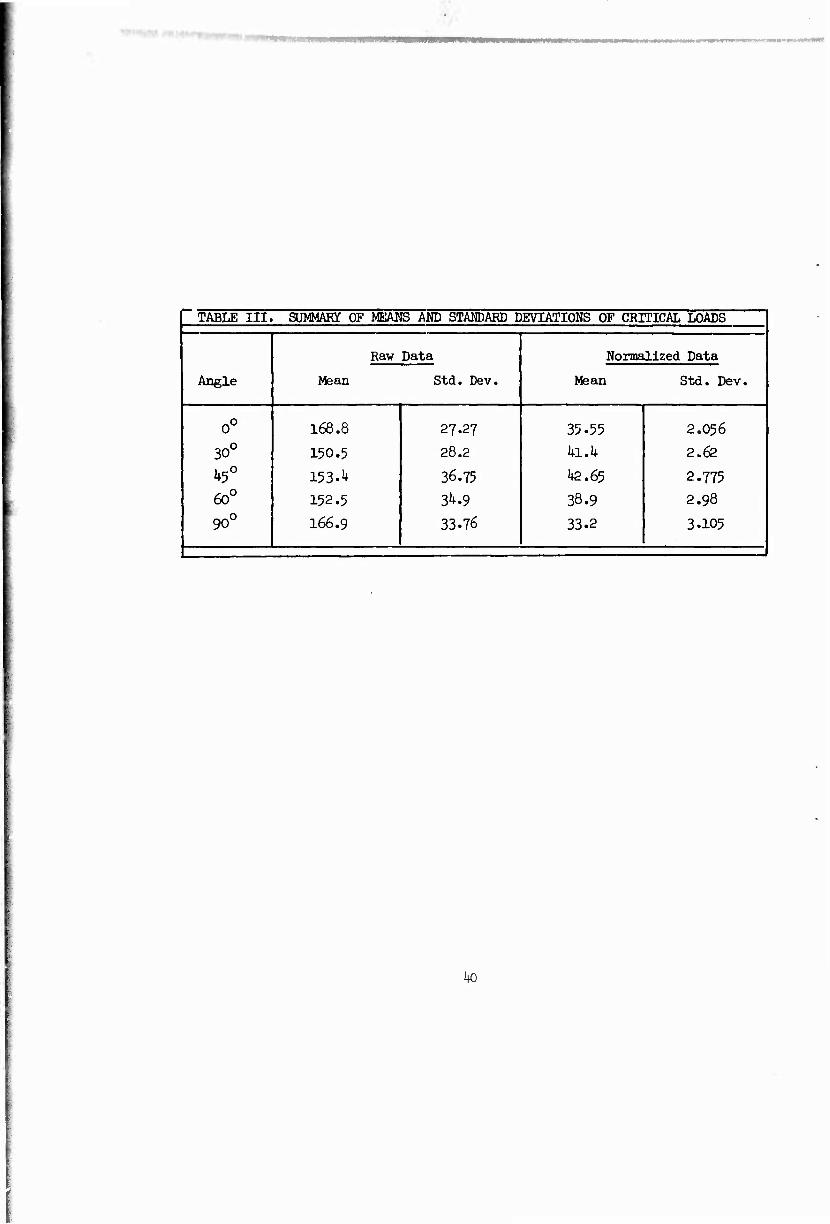
The standard deviation of the critical loads was computed for each angular subgroup for both the raw and the normalized data. The results are shown in Table III. The marked reduction in the standard deviation of normalized data
32
■
TABLE II. TEST DATA f 1
Panel Stiffness Test —a 3— /a^ ^cr Normalized F
No. "1 u2 Critical (Pcr x /d^) (in.xlO)(in.xlO) Load(lb)
0^ Fiber Orientation
001 .221(9 .27l*0 ,2k& 144.4 35.85 002 .2172 .261« .2395 141.5 33.85 003 .2134 .2550 .233 164.0 38.2 OOh .2560 .1610 .203 170.2 34.6 005 .1478 .1590 .1532 223.O 34.2 006 .1669 .2185 .1857 199.4 37.05 007 .2413 .I65O .1994 180.0 35.95 008 .2717 .1920 .228 158.O 36.0 009 .2379 .281*5 .260 127.2 33.1
0010 .2047 .2410 .2?? 162.4 36.1 0011 .2'411 .2710 .2555 131.3 33.55 '."1012 .1907 .231K) .211 167.2 35-3 0013 .2151 .2575 .2355 135.5 31.9 OOllf .1980 .2345 .2155 158.0 34.05 0015 .1832 .2165 .1992 191.2 38.1 0016 .1562 .1870 .1709 216.0 36.85 0017 .1943 .2290 .211 156.0 32.9 0018 .1755 .1930 .184 193.4 35.6 0019 .2020 .2085 .2045 195.0 39.9 0020 .2205 .2470 .2335 162.0 37-8
isl Fiber Orientation
451 .3523 .3020 .326 128.4 41.9 k52 .3662 .3077 .336 126.0 1*2.3 h53 .1810 .1545 .1672 234.0 39.15 k5k .3^3 .3108 .326 116.8 38.05 ^55 .3032 .2675 .28^5 161.9 46.0 456 .3145 .2760 .2945 132.1* 39.0 457 .3247 .29l«0 .309 138.9 1*2.8 458 .3832 .31*05 .361 117.2 1*2.3 459 .3104 .2663 .287 139.6 1*0.1
4511 .3055 .2795 .292 147.2 43.0 4512 .2950 .2627 .278 158.0 43.9 4513 •3514 .3083 .329 122.3 1*0.3 4514 .3613 .3285 .344 121.2 41.6 4515 .2537 .2282 .21*0 201.0 1*8.3 4516 .2352 .2237 .229 200.7 45.95 4517 .3315 .2930 .3115 134.6 41.9 ^518 .2000 .1885 .194 235.0 45.6 4519 • 3355 .2745 .303 11*0.3 1*2.5 4520 .3^*04 .2635 .299 11*2.0 1*2.5 4521 .29^ .2572 .2745 172.0 47.2
33
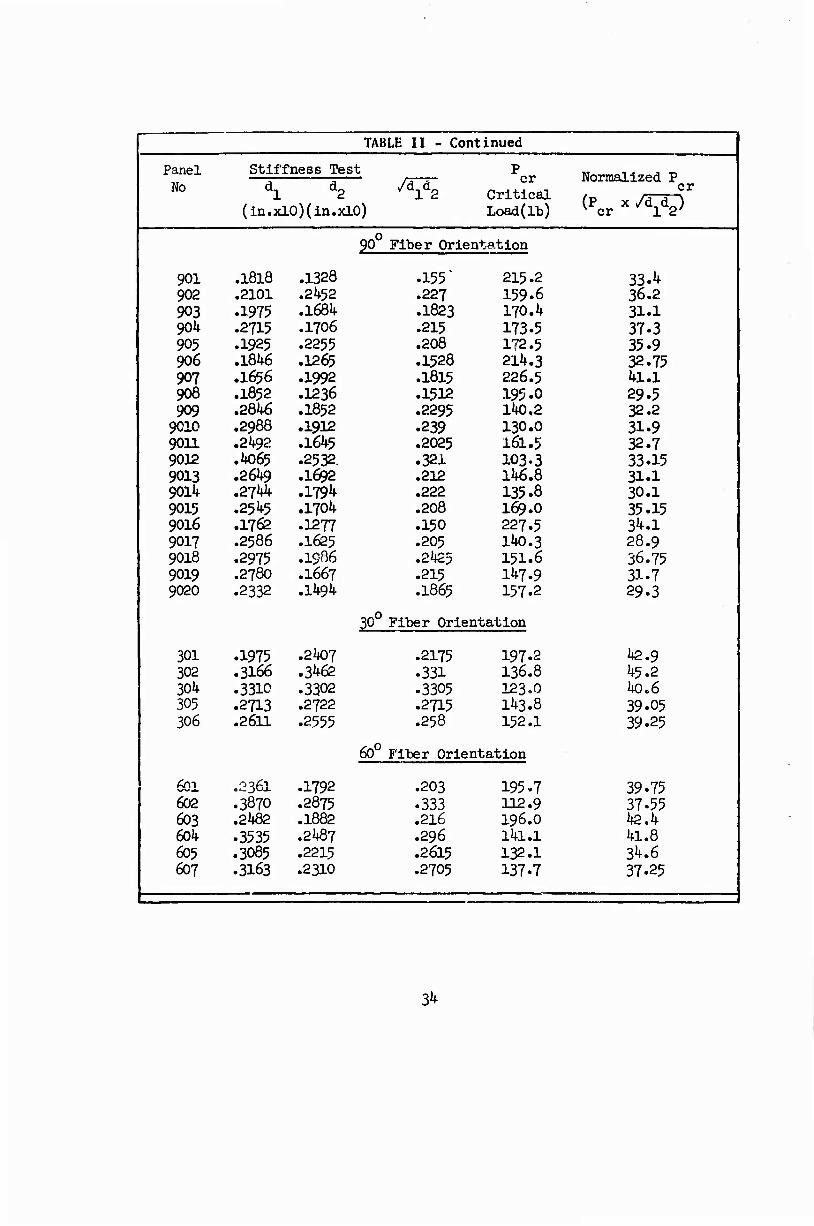
TABLE 11 - Continued j
Panel Stiffness Test ydlä2
P or Normalized P No dl d2
(In.xl0)(in.xl0) Critical Load(lb)
cr (Pcr x M^)
90° Fiber Orientation
901 .I8l8 .1328 .155" 215.2 33'h 902 .2101 .2452 .227 159.6 36.2 903 .1975 .1684 .1823 170.4 31.1 90k .2715 .1706 .215 173.5 37.3 905 .1925 .2255 .208 172.5 35.9 906 .1846 .1265 .1528 214.3 32.75 907 .1656 .1992 .1815 226.5 4l.l 908 .1852 .1236 .1512 195.0 29.5 909 .2846 .1852 .2295 140.2 32.2
9010 .2988 .1912 .239 130.0 31.9 9011 .2492 .1645 .2025 l6l.5 32.7 9012 .4065 .2532. .321 103.3 33.15 9013 .2649 .1692 .212 146.8 31.1 9014 .2744 .179^ .222 135.8 30.1 9015 .2545 .1704 .208 169.O 35.15 9016 .1762 .1277 .150 227.5 34.1 9017 .2586 .1625 .205 140.3 28.9 9018 .2975 .1506 .2425 151.6 36.75 9019 .2780 .1667 .215 147.9 31.7 9020 .2332 .1494 .1865 157.2 29.3
?0o Fiber Orientation
301 .1975 .2407 .2175 197.2 42.9 302 .3166 .3462 .331 136.8 45.2 30k .3310 .3302 .3305 123.0 40.6 305 .2713 .2722 .2715 143.8 39.05 306 .2611 .2555 .258 152.1 39.25
60° Fiber Orientation
601 .2361 .1792 .203 195.7 39.75 602 .3870 .2875 .333 112.9 37.55 603 .2482 .1882 .216 196.0 42.4 604 .3535 .2487 .296 141.1 41.8 605 .3085 .2215 .2615 132.1 34.6 607 .3163 .2310 .2705 137.7 37.25
1 ~ — , _. i
34
,
RAW DATA
Ü tOO ISO 200
NORMALIZED DATA
30 1
33 40
100 150 100
30"
40 45
45'
100 150 200 n
40 45
Ü 1 60°
100 J30 200 QJln
35 40
n 100 150 200
90'
r 30 35
LLQ 40
Figure 12. Frequency Distribution of Buckling Loads,
35
99
H
U o
•H
O
90
70 -
50 -
30 -
I -
.01
i
' 1 '
43° y
' i X
.
0 >
/
" 0 0
0
/
/ 1
0
y /
/ *y f
r
o
/
/
/
/
/
^
/ A
■
/
i
0-45*
I
1
1 ' '
1 I
—1_ 1
i
i
l .
i
L_
A-60°
□ •30° f
i 1 1 1— 120 160 200 240 - 45t
120 160 200-30°60O
a. Plots for ^5 , 30 , and 60 .
Figure 13. Probability Plots of Raw Data
36
H & U O
'S •H
8 ■H
's
220
100 140 180 220- 90°
b. Plots for 0' and 90"
Figure 13. Continued.
37
99
o H
U o -p cd
o
8 •H
CM
'S
90
70 -
50 -
30 -
10
o
011—l i—i i i i i i i I i '■'''' ' 28 30 32 34 36 38 40 42 44 46
a. Plots for 0 and 90 .
Figure Ik. Probability Plots of Normalized Data.
38
I o
g H
o
Ü
o •H
a o •H -p H
I P4
fH O
32 34 36 38 40 42 44 46
b. Plots for 60°, 30°, and 45°.
Figure 1^. Continued.
48 50
39
• ■ ■ ■
'-W^
i TABLE III. SUMMARY OF MEANS AND STAMDARD DEVIATIONS OF CRITICAL LOADS ! [ ■ i
Raw Data Normalized Data
Angle Mean Std. Dev. Mean Std. Dev.
0° 168.8 27.27 35-55 2.056
30° 150.5 28.2 kl.k 2.62
^5° 153. ^ 36.75 te.65 2.775 60° 152.5 3^.9 38.9 2.98
90° 166.9 33.76 33-2 3.105
1 . 1
ko
—«^
correlates and amplifies the validity of the stiffness tests. The arith- metic mean of each angle is also given in Table III.
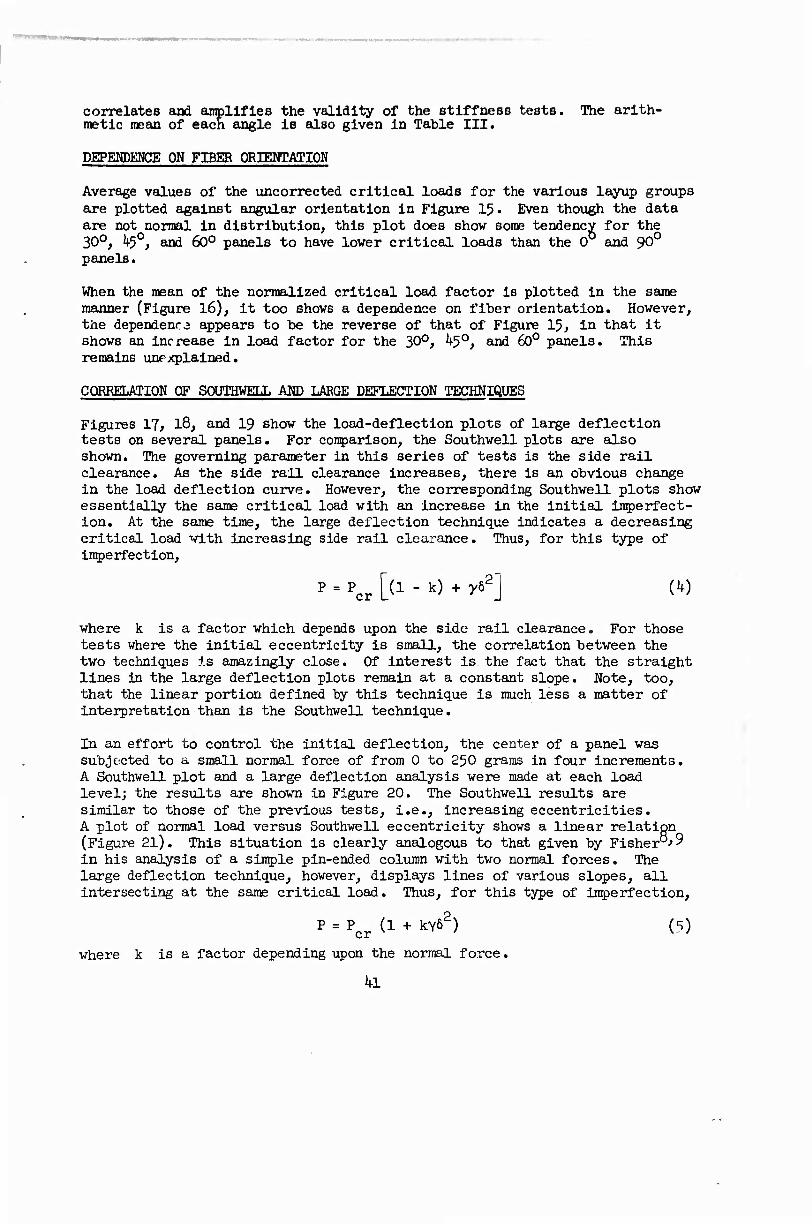
DEPEMDEMCE ON FIBER ORIEMTATION
Average values of the uncorrected critical loads for the various layup groups are plotted against angular orientation in Figure 15. Even though the data
for the and 90c
panels,
are not normal in distribution, this plot does show some tendency . 30°, 45°, and 60° panels to have lower critical loads than the 0 -
When the mean of the normalized critical load factor is plotted in the same manner (Figure 16), it too shows a dependence on fiber orientation. However, the dependence appears to be the reverse of that of Figure 15, in that it shows an increase in load factor for the 30°, ^5°, and 60° panels. This remains unexplained.
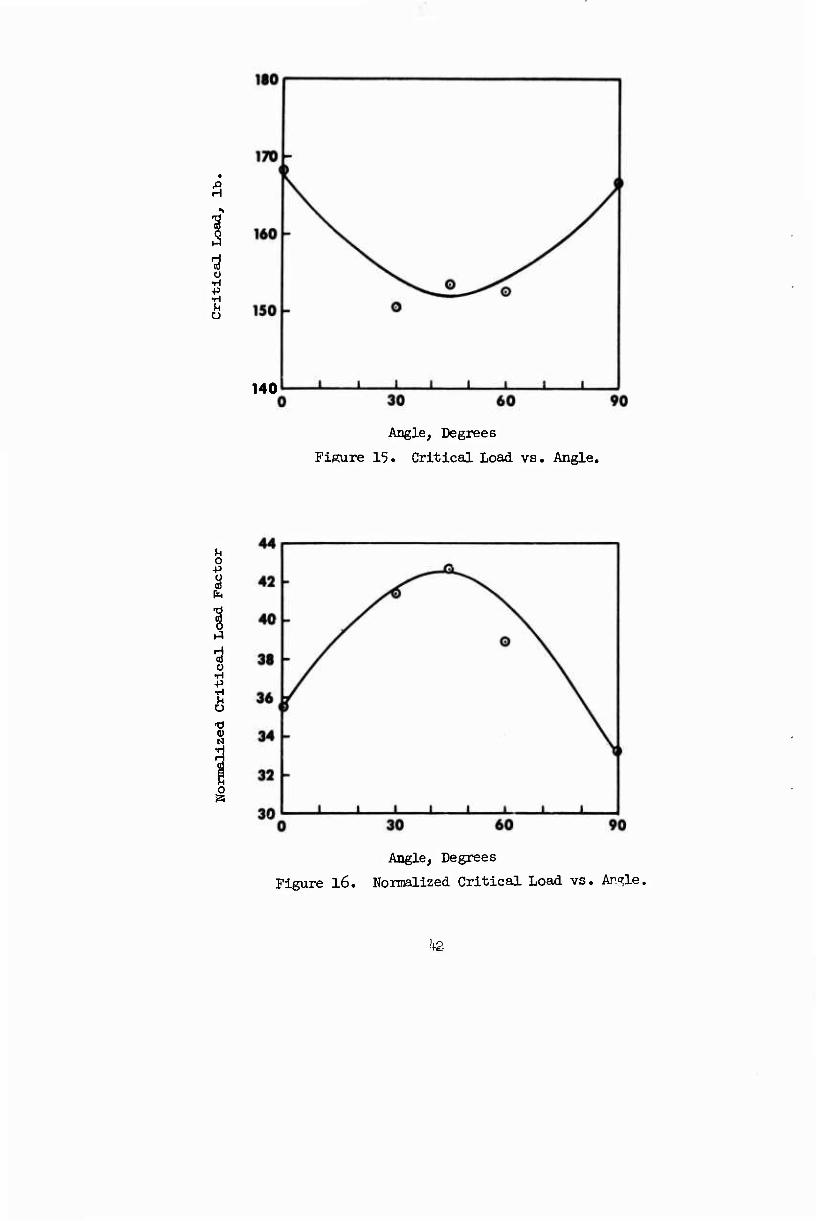
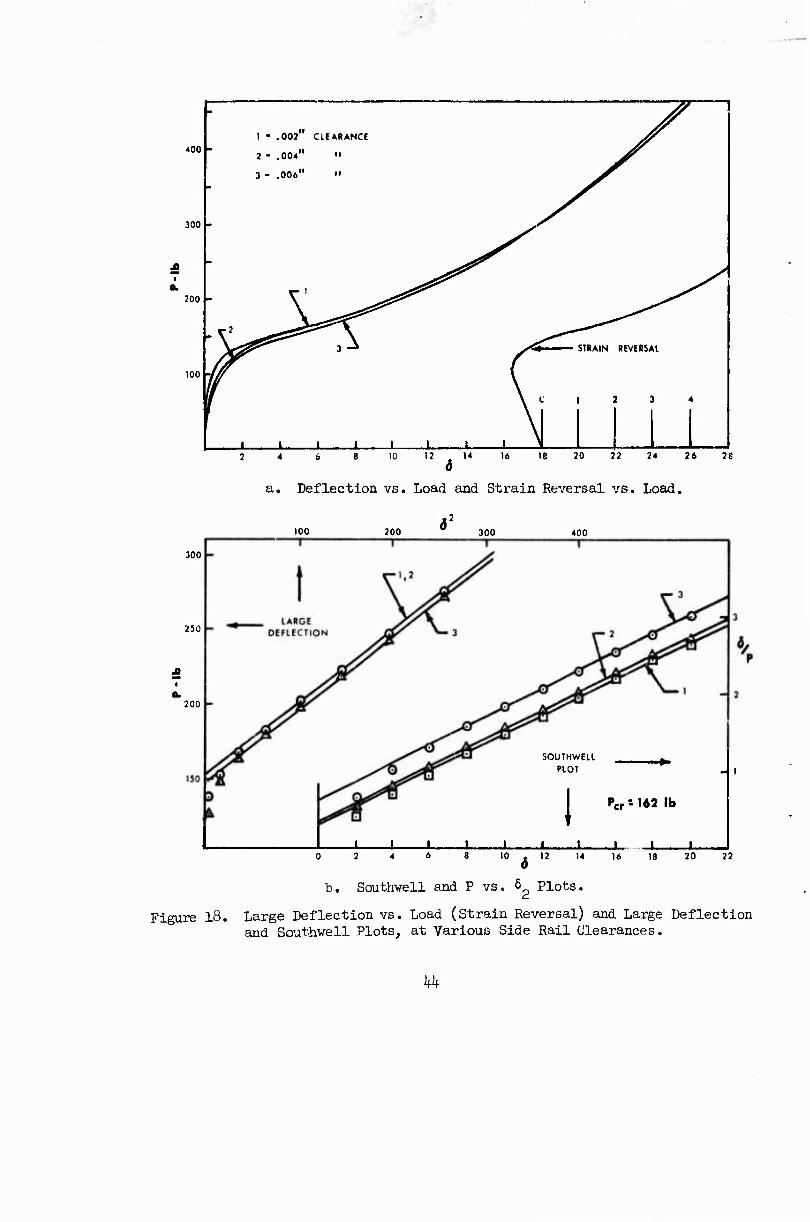
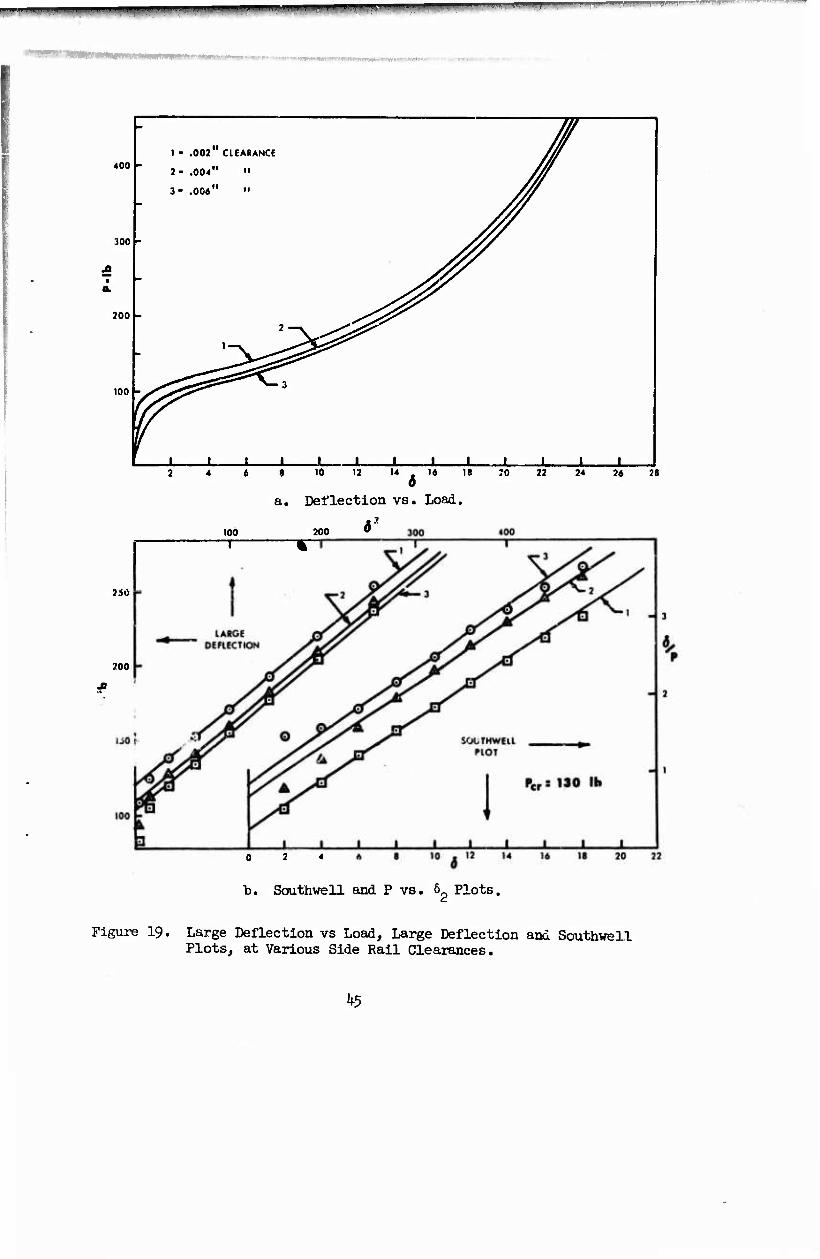
CORRELATION OF SOUTHWELL AMD LARGE DEFLECTION TECHNIQUES
Figures 17, l8, and 19 show the load-deflection plots of large deflection tests on several panels. For comparison, the Southwell plots are also shown. The governing parameter in this series of tests is the side rail clearance. As the side rail clearance Increases, there is an obvious change in the load deflection curve. However, the corresponding Southwell plots show essentially the same critical load with an increase in the initial imperfect- ion. At the same time, the large deflection technique indicates a decreasing critical load with increasing side rail clearance. Thus, for this type of imperfection,
P cr [(1 - k) + y62] (10
where k is a factor which depends upon the side rail clearance. For those tests where the initial eccentricity is small, the correlation between the two techniques is amazingly close. Of interest is the fact that the straight lines in the large deflection plots remain at a constant slope. Note, too, that the linear portion defined by this technique is much less a matter of interpretation than is the Southwell technique.
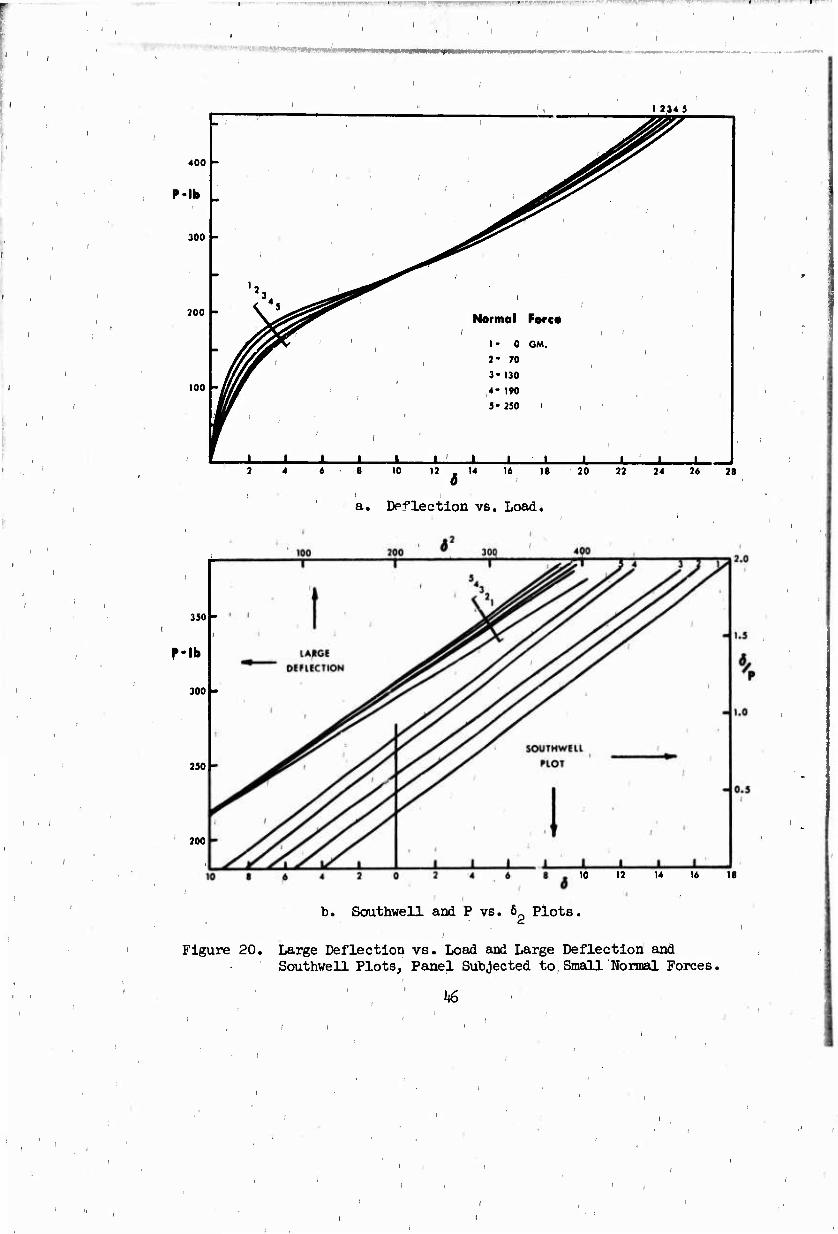
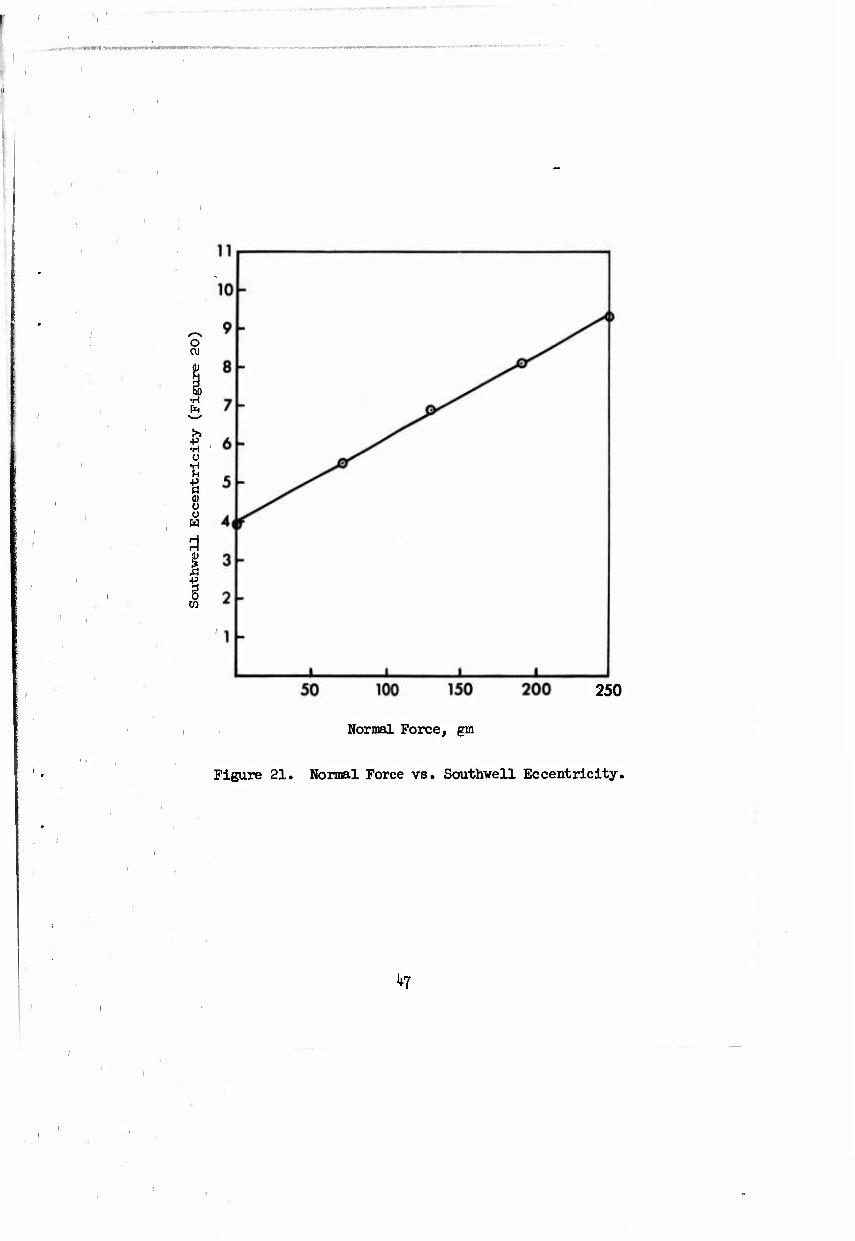
In an effort to control the initial deflection, the center of a panel was subjected to a small normal force of from 0 to 250 grams in four increments. A Southwell plot and a large deflection analysis were made at each load level; the results are shown in Figure 20. The Southwell results are similar to those of the previous tests, i.e., increasing eccentricities. A plot of normal load versus Southwell eccentricity shows a linear relation (Figure 2l). This situation is clearly analogous to that given by Fisher°' 9 in his analysis of a simple pin-ended column with two normal forces. The large deflection technique, however, displays lines of various slopes, all intersecting at the same critical load. Thus, for this type of imperfection,
P = Pcr (1 + kY62) (5)
where k is a factor depending upon the normal force.
ü •H +> •H U Ü
140
Angle, Degrees
Figure 15. Critical Load vs. Angle,
u o •p
H 0) o
■P
u Ü
o
Figure l6.
Angle, Degrees
Normalized Critical Load vs. Ariele.
te
400
300
200
1- .002 CLEARANCE
2- .004" "
3- .006" "
16 IB 20 22 24
a. Deflection vs. Load and Strain Reversal vs. Load. .2
too 200 300 400
Pcr : 156 lb
26 28
b. Southwell and P vs. 6 Plots.
Figure 17. Large Deflection vs. Load (Strain Reversal) and Large Deflection and Southwell Plots, at Various Side Rail Clearances.
43
-
1 - .002" CLEARANCE
^ -,
400 2 - .004"
3 - .006"
ii
ii
300
200
K5 3 -J
*s ^
100 f (
\ I 1 3
1 «
• • 1 1 1 1 .. L,.,. , \
300
250
200
10 12 . M 16 IE 20 22 24 26 28
a. Deflection vs. Load and Strain Reversal vs. Load.
Ö7 100 200 300 400
SOUTHWELL PLOT
PCr s 162 lb
.0 ö 12 14 16 18 20 22
Figure 18,
b. Southwell and P vs. 6 Plots.
Large Deflection vs. Load (Strain Reversal) and Large Deflection and Southwell Plots, at Various Side Rail Clearances.
kh
,11 ■"Hill H.iiiii HIHI. I.f i"" m ' Miipt-nwii. "^^fl"f"^
i mmm
-
1 • .002" CLEARANCE i ^
400
.
2- .004" "
3- .006" "•
//
/
300 -
S ̂
^
f 200
:
2—^
1—y ^^ ^ ^ ^
f
100 ^r
^^^^^^^g^^~2
1 1 i 1 ,
i 1 \ „1 .-.1... 1 • •
2i0
200
2 4 « 8 10 12 14 16 d
18 ?0 22 24 26 28
100 -T
a. Deflection vs. Load.
200 ^
—r
0 2 4
"b. Southwell and P vs. 6 Plots.
Figure 19. Large Deflection vs Load, Large Deflection and Southwell Plots, at Various Side Rail Clearances.
^5
t iiWI»|l|imHl.llW!'WW^''!'ll*l|w".'*<iw»,"y't''w- ' ' ^
" 1 2,34 S
- ■ i
^ 0*
400 - i
■
^ ^
P-lb - . i
^^
^ f
300 - i
■
■i
^ ̂
(
(
200
- ^
i
■
i
i
Normal Ferco i
1- 0 CM.
2- 70
3- 130
;
i
i
/
\
100
r ( i
4- 190
5- 250 I '
i r • • i i IL_ _ L.:, 1 1 1 _J • 1 1
8 10 12 14 0
16 18 20 22 24 24 28
a. Dpflection vs. Load.
330 -
Mb
300 -
230
200
10 12 14 16 18
b. Southwell and P vs. 6 Plots.
Figure 20. Large Deflection vs. Load and Large Deflection and Southwell Plots, Panel Subjected to: Small Normal Forces.
k6
--'>-■T•■a-/rl■^^l'■
O CV)
•H
•H Ü •H U
Ü
I I
250
Normal Force, gm
Figure 21. Normal Force vs. Southwell Eccentricity.
47
■
aa« vßtmmm mm i .-. ■
STRAIN REVERSAL TECHNIQUE
Strain reversal-load plots are also included in Figures 17 and 18. The reversal point is clearly defined in most cases and is dependent upon side rail clearance. However,, in no case does this point or any other easily definable point approach the critical loads obtained by the Southwell technique or the large deflection technique. Further discussion of its applicability is useless.
1*8
,.,„,.■ n,,- T,,i- -^—.in!«!««''»»111 I™1'1»«'»»*"1»"'-1 W1««"1 '— .WP1*' iimnwinfiipii i ü ■—" '■"•""
i Wii '■~*<~m '^Wli^liiPlli—<■—WWW—I—IW—(Ijp^—HWMBt»
COMCLUSIONS
The experimental program reported herein has demonstrated in a conclusive fashion that the so-called strain reversal technique has no value in the interpretation of test data on panels in compression. It shows in an equally positive manner that the Southwell technique and the large displace- msnt technique give identical results which could be associated with theory. Of the two successful techniques, the large displacement technique appears to be preferable due to its ease of use and more positive definition of the straight line. Initial imperfections do not materially affect either technique as long as they are kept small. It appears that boundary conditions somewhat affect the large displacement technique.
There seems little question that orientation of fiber direction has some influence on load capability, but it does not appear by any means as sig- nificant as the variation between nominally identical panels. There can be little doubt that developments in resin mixing, application, and curing are needed if the test specimens are to be of uniform character.
^9
i
REFERENCES
1. Coan, J. M., LARGE DEFI^CTION THEORY FOR PLATES WTIH SMALL INITIAL CURVATURE LOADED IN EDGE COIfRESSION, Journal of Applied Mechanics. June 1951, PP« 1^3-151.
2. Donnell, L. H., ON THE APPLICATION OF SOUTHWELL'S METHOD FOR THE ANALYSIS OF BUCKLING TESTS, Stephen Tlmoshenko 60th Anniversary Volume McGraw-Hill Book Co., 1938, &>. 27-38.
3. Southwell, R. V., ON THE ANALYSIS OF EXPERIMENTAL OBSERVATIONS IN PROBLEMS OF ELASTIC STABILITY, Proceedings of the Royal Society. A Vol. 135, 1932, pp. 6OI-616.
h. Horten, V, H., and Cundarl, F. L., ON THE APPLICABILITY OF THE SOUTHWELL PLOT TO THE INTERPRETATION OF TEST DATA FROM INSTABILITY STUDIES OF SHELL BODIES, Report under preparation as a SUDAAR at Stanford University.
5. MIL-Handbook-17, PLASTICS FOR FLIGHT VEHICLES-PART I, as revised May 1, 1964.
_ 6. Bowker, A. H., and Llebennan, G. J., ENGINEERING STATISTICS, Prentice-
Hall, Inc., Englevood Cliffs, N. J., 1959.
?. Horten, W. H., Tennerllli, D., and Wllley, B. T., A COMPARISON OF SMALL AND LARGE ELASTIC DISPLACEMENT TESTS AS MEANS OF CORRELATING THEORY AND EXPERIMENT, Report under preparation as a SUDAAR at Stanford University, Stanford, California.
8. Fisher, H. R., AN EXTENSION OF SOUTHWELL'S METHOD OF ANALYZING EXPERI- MENTAL OBSERVATIONS IN PROBLEMS OF ELASTIC STABILITY, Proceedings of the Royal Society. A, Vol. ihh, 193K PP- 609-630. " '
9. Fisher, H. R., NOTE ON A METHOD OF REPRESENTING SPAR TESTS, A.R.C., Vol. II, R. and M. No. 1537, Februaiy 1933, p. 497-
50
1