brian james directed technologies, inc. 9 may 2007 · directed technologies, inc. ... database...
TRANSCRIPT

HyPro: Modeling the H2Transition
Brian JamesDirected Technologies, Inc.
9 May 2007
This presentation does not contain any proprietary, confidential, or otherwise restricted information

Directed Technologies, Inc.09 May 2007 2
Outline
Model OverviewResults SummaryCost & Methodology Assumptions

Directed Technologies, Inc.09 May 2007 3
Project Objectives
Overall Create a tool robust enough to test the impact of different assumptions on the development of hydrogen infrastructure and exercise it to determine the key drivers of the hydrogen transition.
2005 Develop a production database from H2A and an economic cost model to determine and compare discounted cash flows.
2006 Enhance model’s capabilities by adding DCF of delivery and dispensing and costs tables for results
Increase database options and sources of dataExercise the tool under different assumptions to understand the
infrastructure’s sensitivity to different parameters.2007 Model upgrades
Further sensitivity analysesAnalyze different scenariosDocument results

Directed Technologies, Inc.09 May 2007 4
Overall Approach
AssumptionsCostsTechnologies
Capital CostEfficiencyFeedstock pricesPlant Location
CostDatabase
HDSAM
H2AProductionUC
Davis
HYTRANS
Re-run model toassess impact
Cost Database
Modify parameters
DTI Model(Tool)Research Results &
Sensitivity
FPITTTransition
Team
Cheapest BuildH2 Profited CostStranded AssetsCapital Costs, Infrastructure
Determine net Demand
Calculate Cost Function for all available options at this
Demand
Select & Build Lowest Cost Option
Update Installed Capacity
Iterate next Year

Directed Technologies, Inc.09 May 2007 5
Analysis Methodology
Modify Excel databaseto imitateScenario
(1 – 10 min)
Generate Results,
Figures, & Files(1 min)
Run DCFcalculationin MatLab(3 min)
Load Exceldatabase into
MatLab(10 min)
AnalyzeResults
Determinenext scenarioto evaluate
Manual Steps
Automated Steps
ManualStep

Directed Technologies, Inc.09 May 2007 6
Key Analysis Assumptions
Demand is user enteredDemand is an input of the model and is assumed to be increasing every year.
Regional Model without Inter-regional feedbackInfluence of manufacturing learning factor from national build out is not currently modeled.
Perfect foresightAll investors have perfect foresight. Uncertainty is currently not modeled.
Analysis Period10 years for distributed production20 years for central production
Remote infrastructure pathways include production, terminal, delivery and dispensingDistributed infrastructure pathways include production and dispensingCapital Cost of 1.5 TPD Forecourt SMR Pathway
Range of costs projected by industry for this option is large and brackets cost of several other options.

Directed Technologies, Inc.09 May 2007 7
Objective Cost Function
Cost of Hydrogen [$/kg] at Pump = Production cost + Terminal cost + Delivery cost + Dispensing
cost + Other Costs
All component costs are determined by NPV calculations performeddynamically.Component costs include effects from;
State of technology development,Infrastructure capacity, andVarying plant utilization
ProductionProduction includes feedstock, capital, and O&M. Plants are point designs.TerminalsTerminals are the transport staging area converting 300 psi H2 to the appropriate pressure and state for transport.DeliveryDelivery encompasses the various types of trucks and pipeline transport.DispensingDispensing includes all the equipment needs at the station to convert delivered H2 into the form accepted by vehicles.Other costsOther costs are credits and taxes which can be quantified in $/kg can applied to a specific segment or the complete infrastructure.
Directed Technologies, Inc.09 May 2007 8
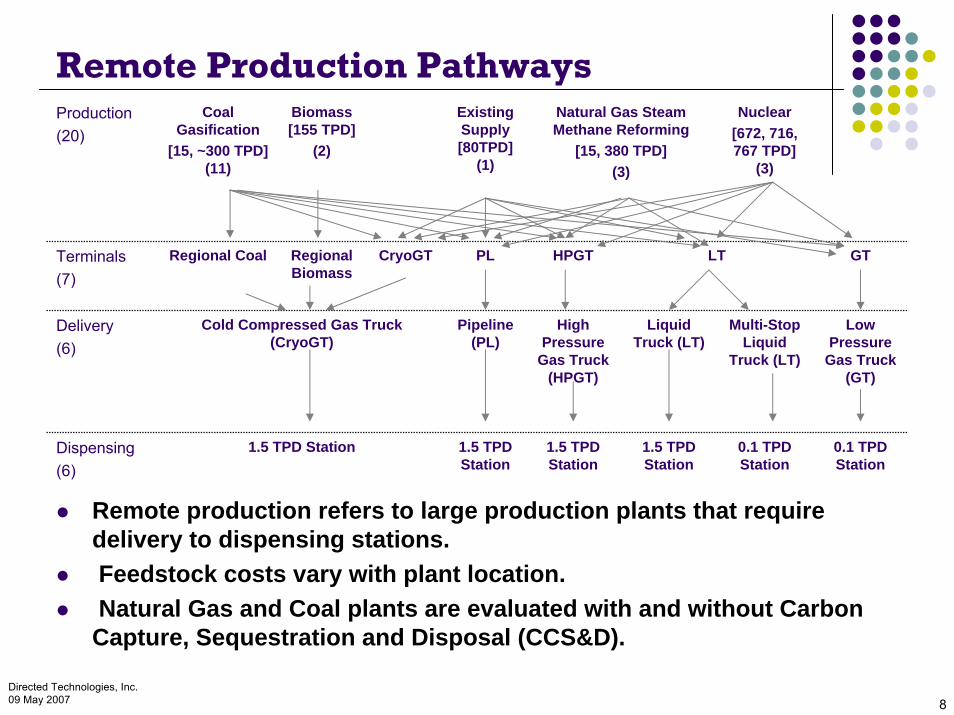
Remote Production PathwaysProduction(20)
Coal Gasification
[15, ~300 TPD] (11)
Biomass [155 TPD]
(2)
Existing Supply [80TPD]
(1)
Natural Gas Steam Methane Reforming
[15, 380 TPD] (3)
Nuclear [672, 716, 767 TPD]
(3)
Terminals(7)
Regional Coal Regional Biomass
CryoGT PL HPGT LT GT
Low Pressure
Gas Truck (GT)
0.1 TPD Station
Delivery(6)
Cold Compressed Gas Truck (CryoGT)
Pipeline (PL)
High Pressure
Gas Truck (HPGT)
Liquid Truck (LT)
Multi-Stop Liquid
Truck (LT)
Dispensing(6)
1.5 TPD Station 1.5 TPD Station
1.5 TPD Station
1.5 TPD Station
0.1 TPD Station
Remote production refers to large production plants that requiredelivery to dispensing stations. Feedstock costs vary with plant location.Natural Gas and Coal plants are evaluated with and without Carbon Capture, Sequestration and Disposal (CCS&D).
Directed Technologies, Inc.09 May 2007 9
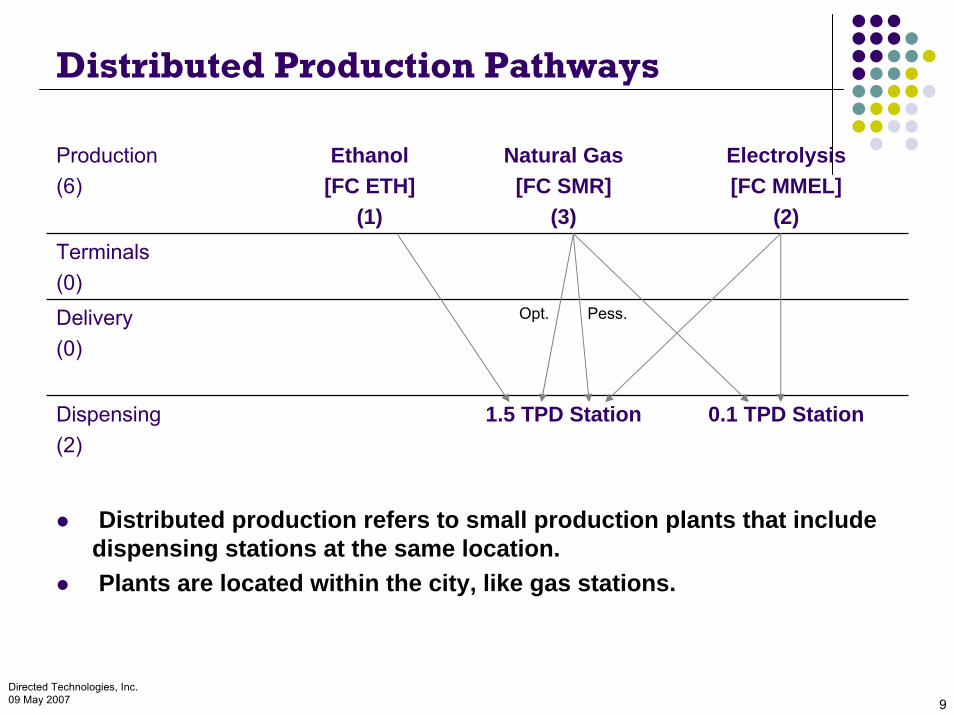
Distributed Production Pathways
Production (6)
Ethanol [FC ETH]
(1)
Natural Gas [FC SMR]
(3)
Electrolysis [FC MMEL]
(2)Terminals (0)Delivery (0)
Dispensing (2)
1.5 TPD Station 0.1 TPD Station
Opt. Pess.
Distributed production refers to small production plants that include dispensing stations at the same location. Plants are located within the city, like gas stations.

Directed Technologies, Inc.09 May 2007 10
Input Database
Excel database consists of a Globalworksheet, a City worksheet, Technologyworksheets, and any number of Supplemental worksheets (in that order)Global worksheet contains data relevant to all technologies in a given workbook (e.g. Feedstock Prices)City worksheets contain data relevant to demand and city geography (e.g. Central Plant Distance)Technology worksheets contain data relevant to a certain technology of the appropriate type (e.g. FC NG-SMR for the Production option)Each production, terminal, delivery, and dispensing method is on a separate Technology worksheet.
Sentech contributed greatly to this research effort.
Design Philosophy: User modifies production/terminal/delivery/dispensing parameters in Excel, and MatLab code reads and extracts necessary data for calculations.
Results Summary

Directed Technologies, Inc.09 May 2007 12
Baseline Scenario Parameters
City of Choice: Los AngelesDOE Demand Scenario 2 for LA
Demand reaches 15% of maximum by 2025, maximum by 2050Initially city must have 40 dispensing stationsVary utilization of pathways with increasing penetrationHeld feedstock prices constant at 2005 valuesCoal Production facilities must have CO2 SequestrationEvaluate all pathways throughout the analysis period, 2012 - 2050Technology jumps in compression and storage occur in 2020Cold Compressed Gas Trucks [CryoGT] are available in 2020Pipelines [PL] are available in 2025
Directed Technologies, Inc.09 May 2007 13
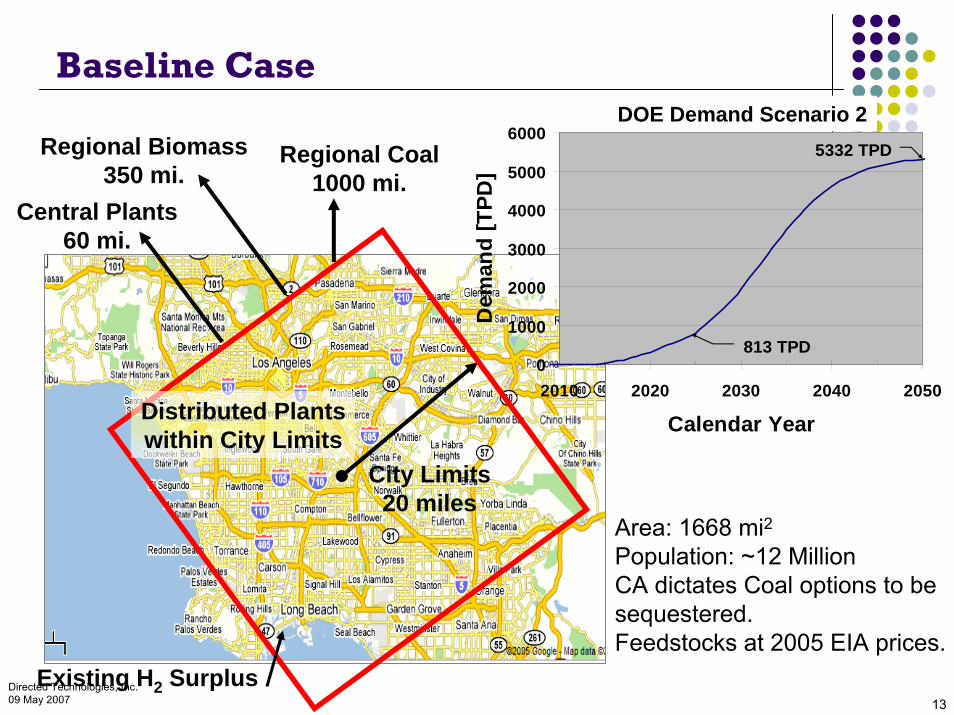
Baseline Case
City Limits20 miles
Area: 1668 mi2Population: ~12 MillionCA dictates Coal options to be sequestered.Feedstocks at 2005 EIA prices.
Central Plants60 mi.
Regional Coal1000 mi.
Regional Biomass350 mi.
Distributed Plantswithin City Limits
Existing H2 Surplus
0
1000
2000
3000
4000
5000
6000
2010 2020 2030 2040 2050
Calendar Year
Dem
and
[TPD
]
813 TPD
5332 TPD
DOE Demand Scenario 2
Directed Technologies, Inc.09 May 2007 14
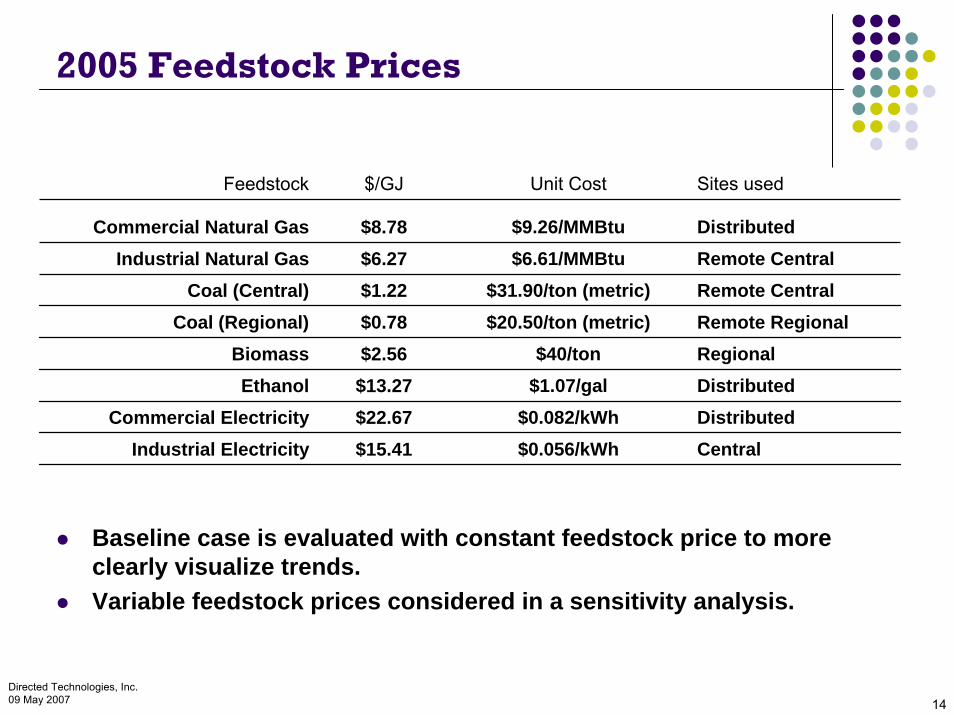
2005 Feedstock Prices
Feedstock $/GJ Unit Cost Sites used
Commercial Natural Gas $8.78 $9.26/MMBtu DistributedIndustrial Natural Gas $6.27 $6.61/MMBtu
$31.90/ton (metric)$20.50/ton (metric)
$40/ton$1.07/gal
$0.082/kWh$0.056/kWh
Remote CentralCoal (Central) $1.22 Remote Central
Coal (Regional) $0.78 Remote RegionalBiomass $2.56 RegionalEthanol $13.27 Distributed
Commercial Electricity $22.67 DistributedIndustrial Electricity $15.41 Central
Baseline case is evaluated with constant feedstock price to moreclearly visualize trends.Variable feedstock prices considered in a sensitivity analysis.

Directed Technologies, Inc.09 May 2007 15
Infrastructure Build outBaseline
1.5 TPD SMR (Optimistic)
Build out assuming1.5 TPD SMR (Pessimistic)
2010 2020 2030 2040 20500
1000
2000
3000
4000
5000
6000
Year
Dem
and
(TPD
)
1 1 1 1 1 1281281 281 281
28126
28126184
28126184
28126184
28126184
281261841
2812618411
2812618411
28126184111
281261841111
2812618411111
28126184111111
2812618411
1
1
1
1
281261841
1
11
11
1
2812618411
111
111
28126184111111111
1261841111111111
26184111111111111
126841
1
1
1
1
11
1
1
1
1
1
126841111111111111
1841
1
1
1
1
1
1
1
1
11
1
1
111111111111111
11
1111
1111
111
11
1
1
11
11
1
11
11
1
11
1
1
1
1
1
1
1
1
1
1
1
11
1
1
1
1111111111111111
1111111111111111
111111
1111111111
111
11111
11111
111
11
111
1111
111
1111
Central SMR + Liquid Truck
Central SMR + Pipeline
Existing H2 + Liquid Truck
2010 2020 2030 2040 20500
1000
2000
3000
4000
5000
6000
Year
Dem
and
(TPD
)
1.5 TPD SMR (Opt)
Existing H2 + Liquid Truck[2012 - 2017]
If Optimistic 1.5 TPD SMR is available it is the lowest cost option after 2017.If Pessimistic 1.5 TPD SMR exists the build out is:
Existing H2 (2012) 1.5 TPD SMR (2017) Central SMR + Liquid Truck (2022) Central SMR + Pipeline (2026)
In an unrestricted market, the cost of the 1.5 TPD Natural Gas SMR option will determine which infrastructure is built.

Directed Technologies, Inc.09 May 2007 16
Lowest Cost Pathways
2010 2020 2030 2040 20502
3
4
5
6
Year
Cos
t with
Ret
urn
[$/k
g H
2] Lowest Infrastructure Cost Options
1.5 TPD SMR (Opt)
Regional Biomass + Pipeline
1.5 TPD Ethanol
There are several central plant infrastructure alternatives if the 1.5 TPD SMR (Opt) is not feasible.
Directed Technologies, Inc.09 May 2007 17
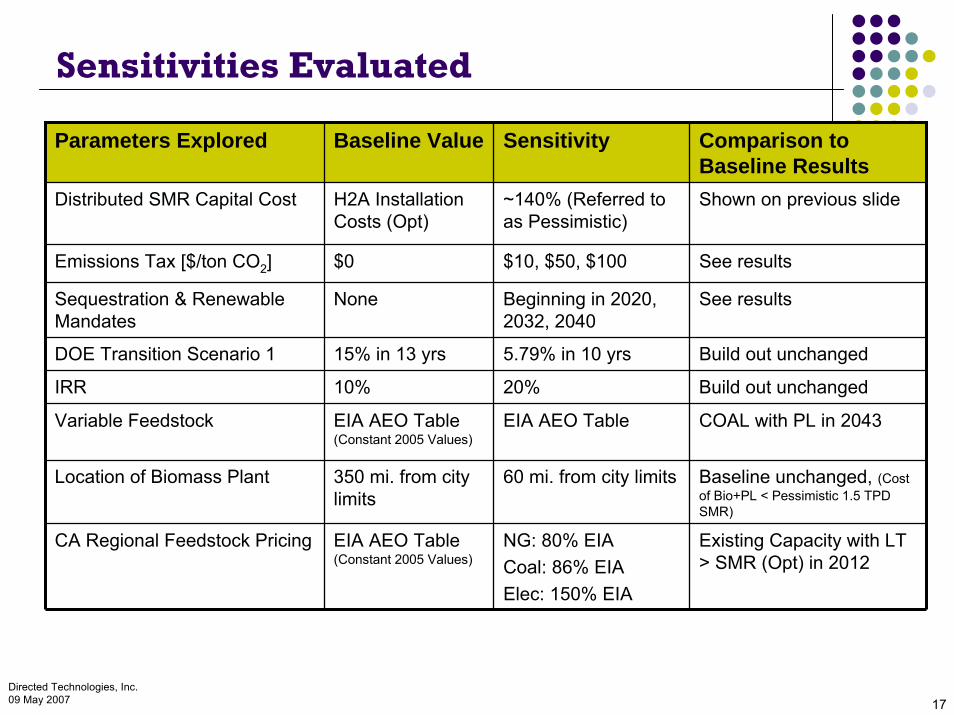
Sensitivities Evaluated
Parameters Explored Baseline Value Sensitivity Comparison to Baseline Results
Distributed SMR Capital Cost H2A Installation Costs (Opt)
Emissions Tax [$/ton CO2] $0 $10, $50, $100 See results
None
15% in 13 yrs
10%
Variable Feedstock EIA AEO Table (Constant 2005 Values)
EIA AEO Table COAL with PL in 2043
Location of Biomass Plant 350 mi. from city limits
60 mi. from city limits Baseline unchanged, (Cost of Bio+PL < Pessimistic 1.5 TPD SMR)
CA Regional Feedstock Pricing EIA AEO Table (Constant 2005 Values)
NG: 80% EIACoal: 86% EIAElec: 150% EIA
Existing Capacity with LT > SMR (Opt) in 2012
~140% (Referred to as Pessimistic)
Shown on previous slide
Sequestration & Renewable Mandates
Beginning in 2020, 2032, 2040
See results
DOE Transition Scenario 1 5.79% in 10 yrs Build out unchanged
IRR 20% Build out unchanged

Directed Technologies, Inc.09 May 2007 18
Impact of CCSD and CO2 Emission Tax ($50/ton)
w/o CCSD w/ CCSD
Forecourt SMR NA
Central SMR ~$0.24
CCSD Cost Adder[$/kg H2]
Carbon Tax Cost Adder at $50/ton CO2 [$/kg H2]
Central Coal ~$0.43
Forecourt SMR ~$0.58 NA
Central SMR ~$0.53 ~$0.43
Central Coal ~$1.38 ~$0.60
CCSD = Carbon Capture, Sequestration and Disposal$50/ton emission tax= $50 per metric ton of CO2released into atmosphere
2010 2020 2030 2040 20502
3
4
5
6
Year
Cos
t with
Ret
urn
[$/k
g H
2]
FC, SMR (Opt)
FC, Ethanol
FC, SMR (Pess)
FC, Electrolysis
C, COAL+CCSDC, SMR + CCSD C, SMR
Costs with $50/metric ton CO2 Emission Tax

Directed Technologies, Inc.09 May 2007 19
2020 Renewables Mandate
2020 Renewables Mandate:Existing + Liquid Truck 1.5 TPD SMR (Opt)
1.5 TPD Ethanol Biomass + Pipeline Nuclear + Pipeline
With a renewable mandate, Distributed Ethanol could play an interim role at low demands.
2010 2020 2030 2040 20500
1000
2000
3000
4000
5000
6000
Year
Dem
and
(TPD
)
Buildout with 2020 Renewables Mandate
Existing H2 + Liquid Truck
1.5 TPD SMR (Opt)
1.5 TPD Ethanol
Central Biomass + Pipeline
Central Nuclear + Pipeline
Directed Technologies, Inc.09 May 2007 20
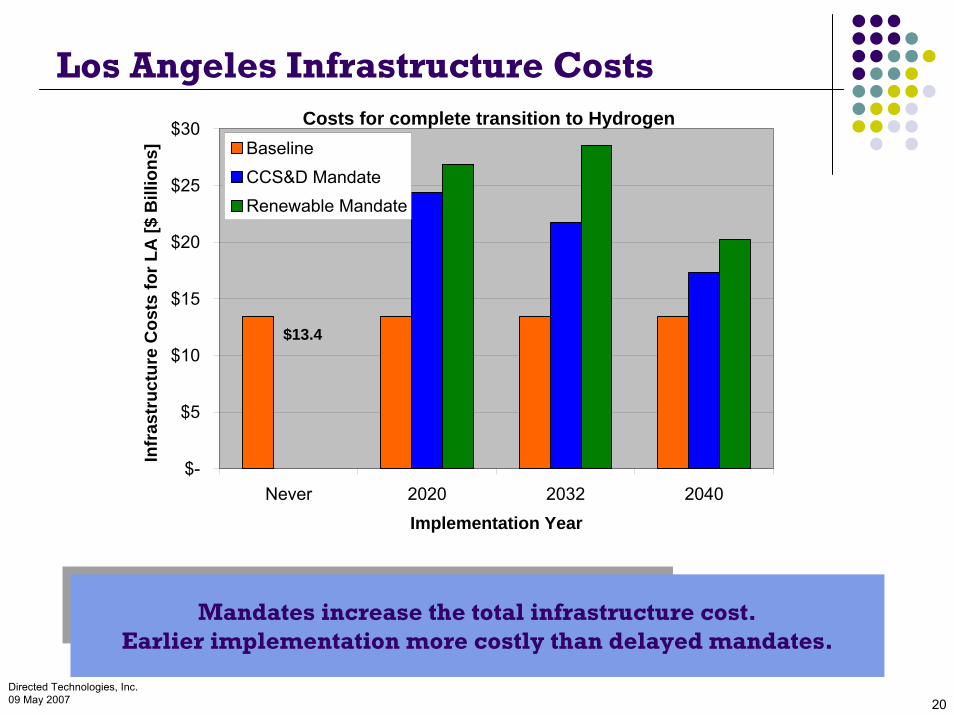
Los Angeles Infrastructure Costs
$13.4
$-
$5
$10
$15
$20
$25
$30
Never 2020 2032 2040Implementation Year
Infr
astr
uctu
re C
osts
for L
A [$
Bill
ions
] BaselineCCS&D MandateRenewable Mandate
Costs for complete transition to Hydrogen
Mandates increase the total infrastructure cost. Earlier implementation more costly than delayed mandates.
Directed Technologies, Inc.09 May 2007 21
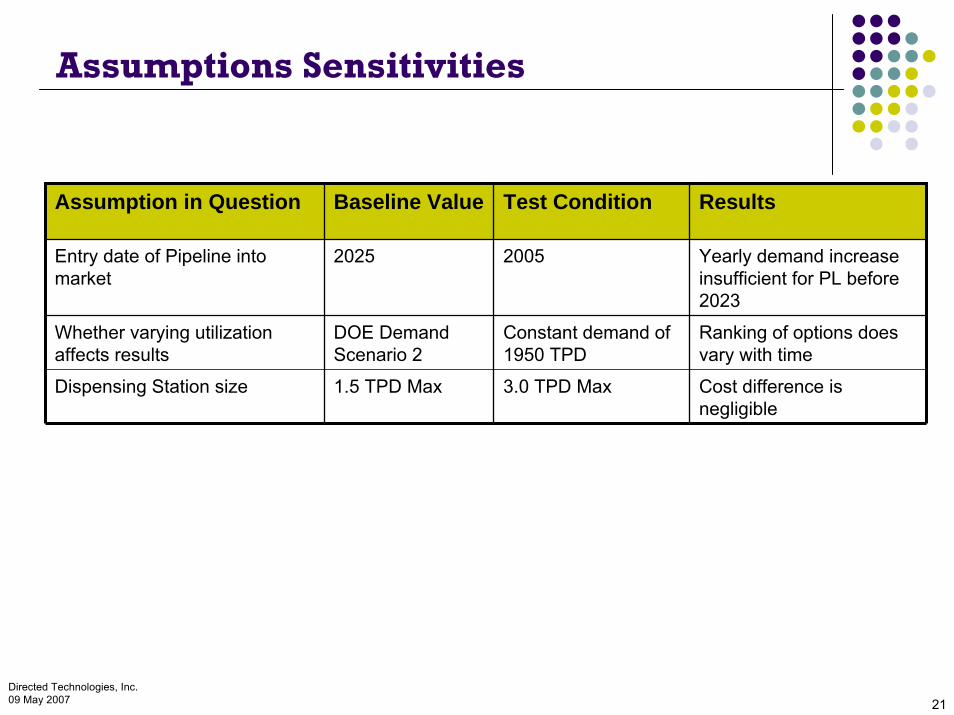
Assumptions Sensitivities
Assumption in Question Baseline Value Test Condition Results
Entry date of Pipeline into market
2025
Whether varying utilization affects results
DOE Demand Scenario 2
Constant demand of 1950 TPD
Ranking of options does vary with time
1.5 TPD Max
2005 Yearly demand increase insufficient for PL before 2023
Dispensing Station size 3.0 TPD Max Cost difference is negligible

Directed Technologies, Inc.09 May 2007 22
Pipeline Market Entry
2012 2014 2016 2018 2020 2022 2024 2026 2028 20302
3
4
5
6
7
8
9
10
11
Year
Cos
t with
Ret
urn
[$/k
g H
2]
2010 2015 2020 2025 2030 2035 2040 2045 20500
1000
2000
3000
4000
5000
6000
Year
Volu
me
(TPD
)
DOE Demand Scenario 2Los Angeles
Pipelines Available in 2007
1 1 1 1 1 128 128561285668
12856687312856687378
1285668737885
128566873788589
128566873788589107
128566873788589107115
128566873788589107115166
128566873788589107115166192
128566873788589107115166192219
128566873788589107115166192219
244
128566873788589107115166192219
244
266
128566873788589107115166192219
244
266
284
28566873788589107115166192219
244
266
2841
294
28566873788589107115166192219
244
266
2841
294
299
28566873788589107115166192219
244
266
2841
294
299
293
28566873788589107115166192219
244
266
2841
294
299
293
282
28566873788589107115166192219
244
266
2841
294
299
293
282
264
566873788589107115166192219244
266
2841
294
299
293
282
264
269
6873788589107115166192219
244
266
2841
294
299
293
282
264
269
271
73788589107115166192219
244
266
2841
294
299
293
282
264
269
271
256
788589107115166192219
244
266
2841
294
299
293
282
264
269
271
256
236
8589
107115166192219
244
266
2841
294
299
293
282
264
269
271
256
236216
89107115166192219
244
266
2841
294
299
293
282
264
269
271
256
236216200
107115166192219244
266
2841
294
299
293
282
264
269
271
256
236216200185
115166192219244
266
2841
294
299
293
282
264
269
271
256
236216200185186
166192219
244
266
2841
294
299
293
282
264
269
271
256
236216200185186180
192219244
266
2841
294
299
293
282
264
269
271
256
236216200185186180218
219244
266
2841
294
299
293
282
264
269
271
256
236216200185186180218234
244
266
2841
294
299
293
282
264
269
271
256
236
216200185186180218234
253
266
2841
294
299
293
282
264
269
271
256
236216200185186180218234
253
272
2841
294
299
293
282
264
269
271
256
236216200185186180218234
253
272
287
Pipelines Become Cheaper thanForecourts
Production LEGEND
- 1.5 TPD NG SMR (Pessimistic)
- Central NG SMR
- COAL, GASIF.
- Nuclear
* EX-H2 with LT
* EX-H2 with HPGT
Delivery LEGEND♦ LT◊ CCSD & LT+ PL x CCSD & PL
If Optimistic 1.5 TPD SMR is achievable it is the lowest cost option after 2017. The demand is not sufficiently high until 2023 for pipelines to be competitive with next lowest option, Pessimistic 1.5 TPD SMR
Directed Technologies, Inc.09 May 2007 23
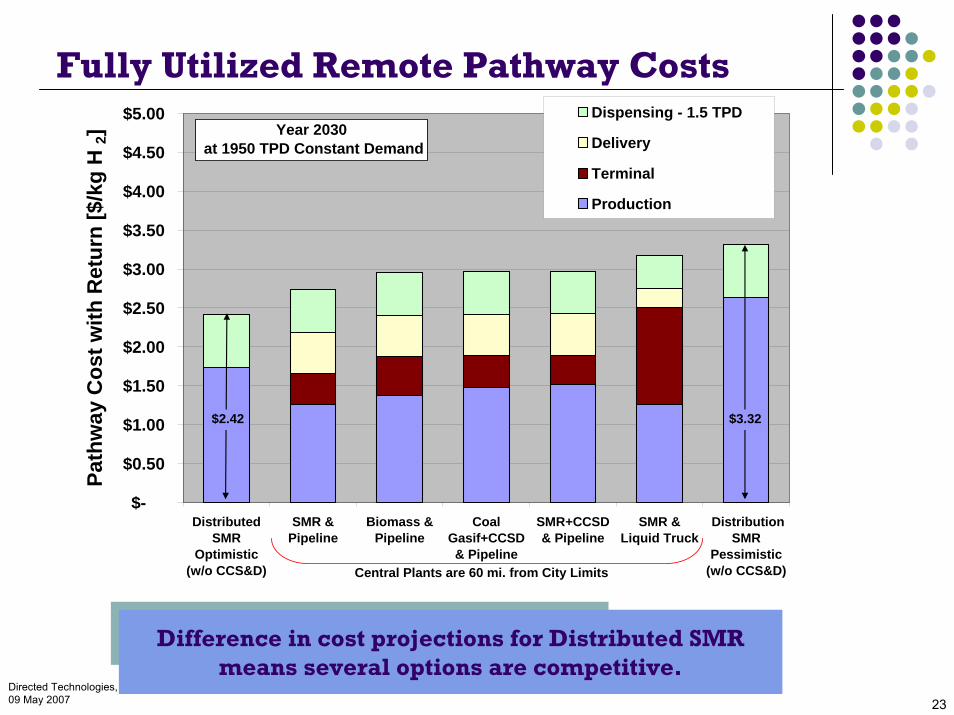
Fully Utilized Remote Pathway Costs
$-
$0.50
$1.00
$1.50
$2.00
$2.50
$3.00
$3.50
$4.00
$4.50
$5.00
DistributedSMR
Optimistic(w/o CCS&D)
SMR &Pipeline
Biomass &Pipeline
CoalGasif+CCSD& Pipeline
SMR+CCSD& Pipeline
SMR &Liquid Truck
DistributionSMR
Pessimistic(w/o CCS&D)
Path
way
Cos
t with
Ret
urn
[$/k
g H
2]Dispensing - 1.5 TPD
Delivery
Terminal
Production
Year 2030 at 1950 TPD Constant Demand
Central Plants are 60 mi. from City Limits
$2.42 $3.32
Difference in cost projections for Distributed SMR means several options are competitive.

Directed Technologies, Inc.09 May 2007 24
What about larger stations?
$1.74 $1.74
$2.58 $2.63 $2.84
$0.65 $0.68
$0.65 $0.68
$1.94
$-
$0.50
$1.00
$1.50
$2.00
$2.50
$3.00
$3.50
$4.00
$4.50
$5.00
3.0 TPD(Optimistic)
1.5 TPD(Optimistic)
3.0 TPD(Pessimistic)
1.5 TPD(Pessimistic)
0.1 TPD
Cos
t with
Ret
urn
[$/k
g H
2]
DispensingProduction - Distributed NG SMR
Costs of 1.5 TPD and 3.0 TPD are similar but with 1.5 TPD stations you get better coverage.Note, even fully utilized, 0.1 TPD dispensing and production are more costly alternatives.

Cost and Methodology Assumptions

Directed Technologies, Inc.09 May 2007 26
Production Database Features
Forecourt ethanol option availableRegional 2015 Coal Plant in WyomingLocated Biomass Plant at Regional rice fieldsCO2 system includes cost for Carbon Capture, Sequestration and Disposal
94 mile distance from remote plant to the sequestration site
HydrogenFuel
Gasificationor
SteamMethane
Reforming
CO2Compressors
CO2Pumps
CO2Transport (Pipe)
CO2Injection
UnavoidableEmissions
CO2Capture
Production Boundaries with CCSD
Directed Technologies, Inc.09 May 2007 27
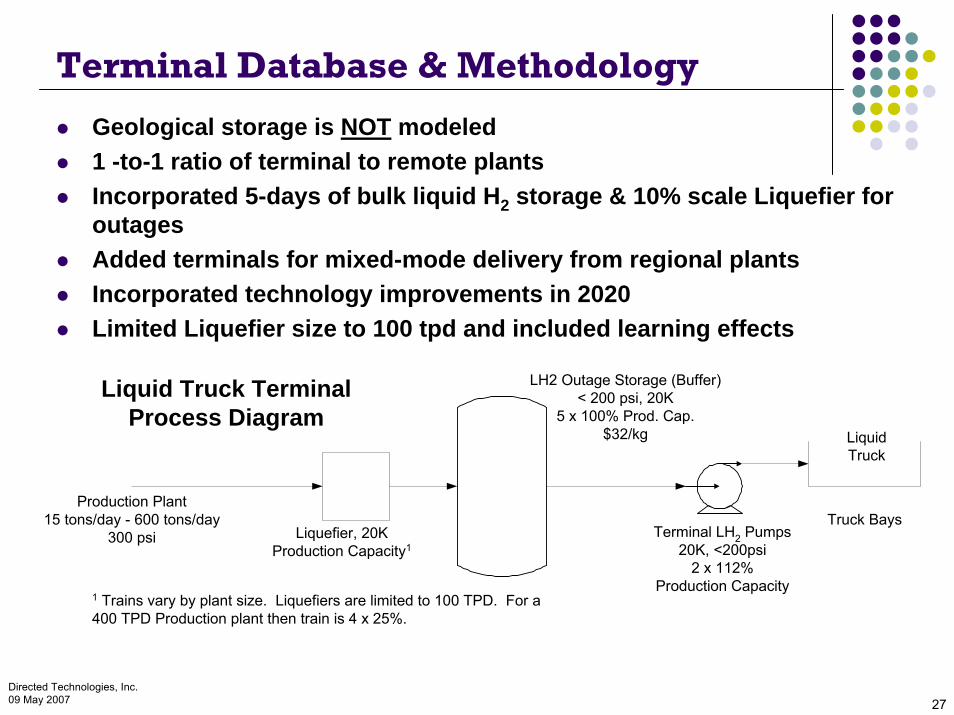
Terminal Database & Methodology
Geological storage is NOT modeled1 -to-1 ratio of terminal to remote plantsIncorporated 5-days of bulk liquid H2 storage & 10% scale Liquefier for outagesAdded terminals for mixed-mode delivery from regional plantsIncorporated technology improvements in 2020Limited Liquefier size to 100 tpd and included learning effects
Terminal LH2 Pumps20K, <200psi
2 x 112%Production Capacity
Liquefier, 20KProduction Capacity1
Truck BaysProduction Plant
15 tons/day - 600 tons/day300 psi
1 Trains vary by plant size. Liquefiers are limited to 100 TPD. For a400 TPD Production plant then train is 4 x 25%.
LH2 Outage Storage (Buffer)< 200 psi, 20K
5 x 100% Prod. Cap.$32/kg Liquid
Truck
Liquid Truck TerminalProcess Diagram
Directed Technologies, Inc.09 May 2007 28
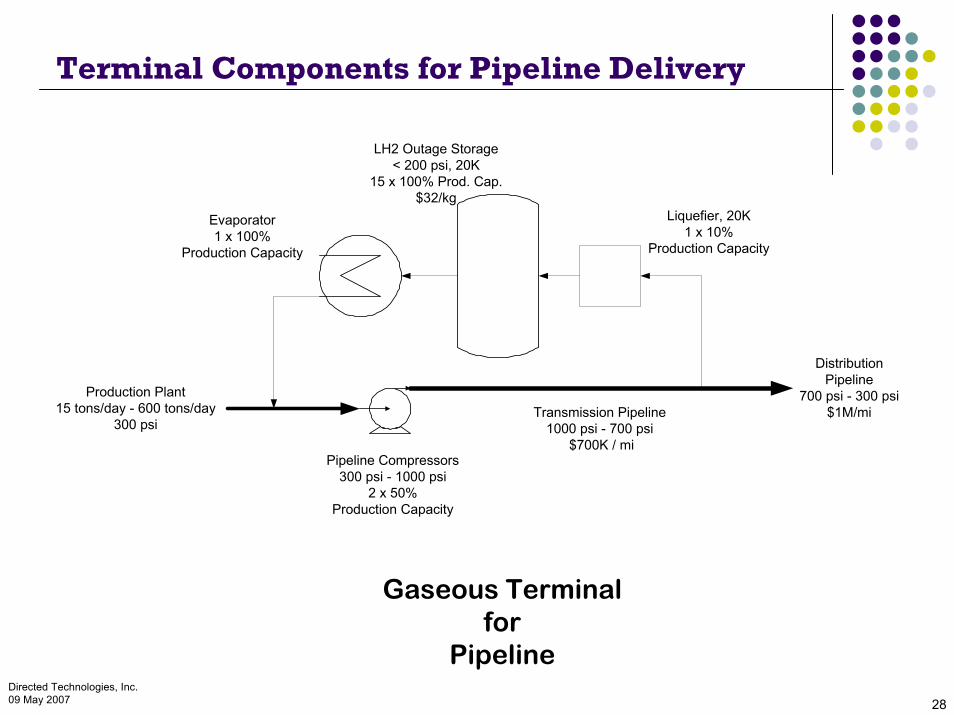
Terminal Components for Pipeline Delivery
Evaporator1 x 100%
Production Capacity
Pipeline Compressors300 psi - 1000 psi
2 x 50%Production Capacity
Transmission Pipeline1000 psi - 700 psi
$700K / mi
DistributionPipeline
700 psi - 300 psi$1M/mi
Production Plant15 tons/day - 600 tons/day
300 psi
Gaseous Terminalfor
Pipeline
LH2 Outage Storage< 200 psi, 20K
15 x 100% Prod. Cap.$32/kg
Liquefier, 20K1 x 10%
Production Capacity

Directed Technologies, Inc.09 May 2007 29
Terminal Parameters
Liquefier Power ConsumptionAll years: varies of liquefier size
~10kWh/kg H2 for 100tpd liquefier (full-scale liquefier for LH2 delivery)
~16kWh/kg H2 for 8tpd liquefier (sub-scale liquefier for bulk storage)
Cryo Cooler (ambient temperature to 80K)Electricity [kWh/kg H2] is 40% of full liquefierCapital cost is 50% of full liquefier
Pipeline & Storage Compressor Technology2005: cost factor 1.3 (NG), 1 on standby, 80% Efficient (no standby for storage)2020: cost factor 0.8 (NG), no standby, 80% Efficient
Gaseous Storage Costs2005: $818/kg (steel tanks)2020: $355/kg (composite tanks)
Pipelines 2020: Regional transmission lines ~$700K/mi matches DOT report guidelines2025: Urban distribution lines $1M/mi slightly higher than DOT report guidelines

Directed Technologies, Inc.09 May 2007 30
Delivery Database & Methodology
Incorporated H2A component model costs for DCF analysis in HyPro (allows for varying utilization over lifetime)Similar rules to HDSAM
No Pipeline to small dispensing stationsLiquid truck stops at 3 small stations or 1 large station
Distance CalculationsAverage Manhattan DistanceModified Min Spanning Tree algorithm for Pipeline
Added Cryogenic H2 trucks option for large dispensing station
Directed Technologies, Inc.09 May 2007 31
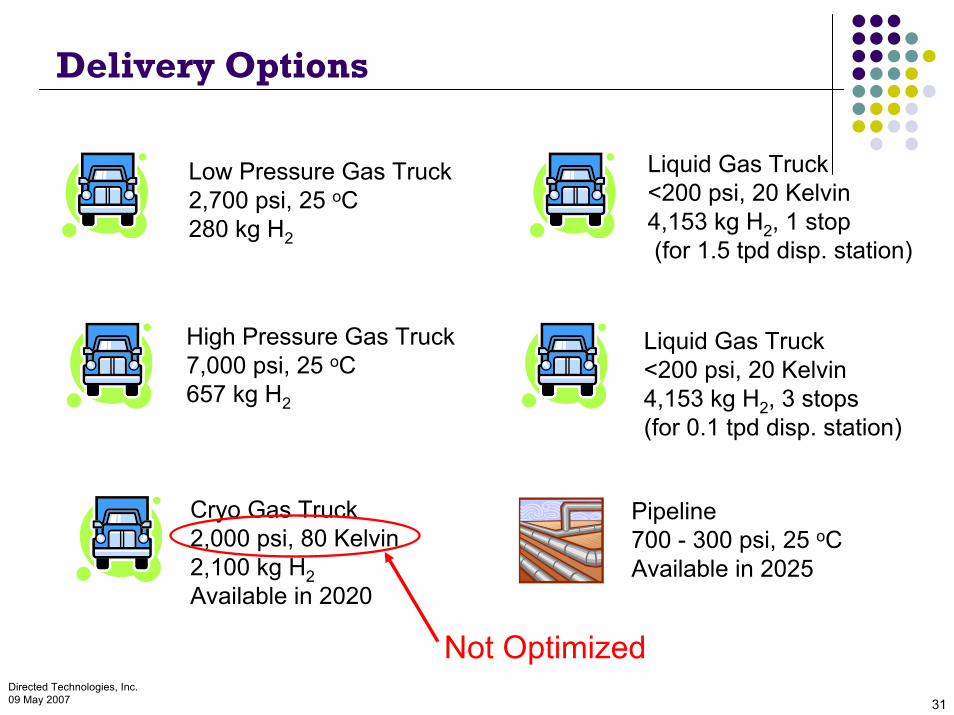
Delivery Options
Liquid Gas Truck<200 psi, 20 Kelvin4,153 kg H2, 1 stop(for 1.5 tpd disp. station)
Low Pressure Gas Truck2,700 psi, 25 oC280 kg H2
High Pressure Gas Truck7,000 psi, 25 oC657 kg H2
Liquid Gas Truck<200 psi, 20 Kelvin4,153 kg H2, 3 stops(for 0.1 tpd disp. station)
Pipeline700 - 300 psi, 25 oCAvailable in 2025
Cryo Gas Truck2,000 psi, 80 Kelvin2,100 kg H2Available in 2020
Not Optimized
Directed Technologies, Inc.09 May 2007 32
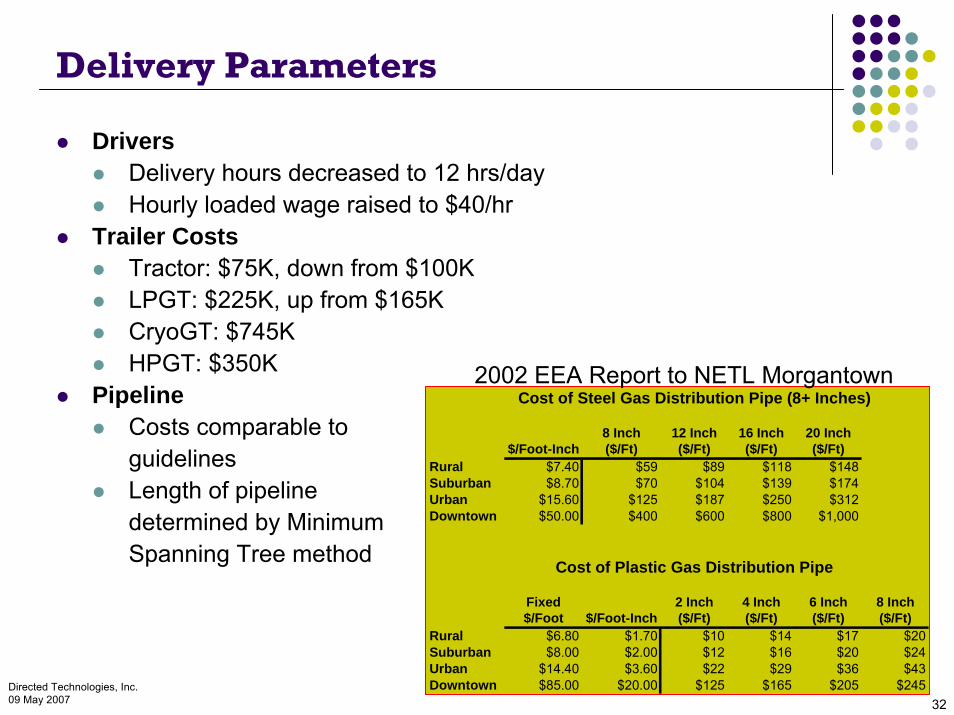
Delivery Parameters
DriversDelivery hours decreased to 12 hrs/dayHourly loaded wage raised to $40/hr
Trailer CostsTractor: $75K, down from $100KLPGT: $225K, up from $165KCryoGT: $745KHPGT: $350K
Pipeline Costs comparable to guidelinesLength of pipeline determined by Minimum Spanning Tree method
Cost of Steel Gas Distribution Pipe (8+ Inches)
8 Inch 12 Inch 16 Inch 20 Inch$/Foot-Inch ($/Ft) ($/Ft) ($/Ft) ($/Ft)
Rural $7.40 $59 $89 $118 $148Suburban $8.70 $70 $104 $139 $174Urban $15.60 $125 $187 $250 $312Downtown $50.00 $400 $600 $800 $1,000
Cost of Plastic Gas Distribution Pipe
Fixed 2 Inch 4 Inch 6 Inch 8 Inch$/Foot $/Foot-Inch ($/Ft) ($/Ft) ($/Ft) ($/Ft)
Rural $6.80 $1.70 $10 $14 $17 $20Suburban $8.00 $2.00 $12 $16 $20 $24Urban $14.40 $3.60 $22 $29 $36 $43Downtown $85.00 $20.00 $125 $165 $205 $245
2002 EEA Report to NETL Morgantown

Directed Technologies, Inc.09 May 2007 33
Dispensing Database & Methodology
Incorporated H2A component model costs for DCF analysis in HyPro (allows for varying utilization over lifetime)Sized storage & compressors appropriately to interface with the delivery meansIncorporated technology improvements in 2020
(300 psiGaseous)
HP Tank(358 kg)
Disp(1500 kg/d)
Comp(1500 kg/d)
PipelineStation
H2 from onsite
production unit
Comp(750 kg/d)
HP Tank(1193 kg)
Disp(1500 kg/d)
1.5 tpdForecourt Station

Directed Technologies, Inc.09 May 2007 34
Dispensing Parameters
HP Storage2005: $818/kg (steel tanks)2020: $355/kg (composite tanks)
Compressors2005: 65% Efficient, 3 x 50%, 1 on standby, 2005: $6300/kg/hr for 50 kg/d & $4580/kg/hr for 750 kg/d2020: 80% Efficient, 1 x 100%, no standby2020: $4100/kg/hr for 50 kg/d size & $3000/kg/hr for 750 kg/d
Dispensers2005: 5,000 psi2020: 10,000 psi (assumes no cost impact)
Maintenance & Repair 2005: 1.8%/year of initial capital cost 2020: 1.5%/year of initial capital cost
Initial Station Penetration set at 1% (40 stations for LA)

Directed Technologies, Inc.09 May 2007 35
Dispensing Options
(7000 psiGaseous)
(2700 psiGaseous)
(300 psiGaseous)
Trailer(280 kg)
Tube Drop(657 kg)
HP Tank(38 kg)
Comp(50 kg/d)
Disp(100 kg/d)
Disp(1500 kg/d)
Comp(750 kg/d)
HP Tank(358 kg)
Comp(1500 kg/d)
Disp(1500 kg/d)
HP Tank(358 kg)
Disp(1500 kg/d)
Comp(1500 kg/d)
6250 psi
HP Tank(358 kg)
Tube Drop(2100 kg)
Hydrogen(75 psi Liquid)
Sm or Lg Disp?
LH2 Tank(1496 kg)
LH2 Tank(4488 kg)
Cryo Pump(50 kg/d)
HP Tank(38 kg)
HP Tank(358 kg)
Cryo Pump(750 kg/d)
75 psi
Disp(1500 kg/d)
Disp(100 kg/d)
Sm
Lg
(2000 psi ColdGaseous)
Liquid H2Station
PipelineStation
CryoGTStation
HPGTStation
LPGTStation

Directed Technologies, Inc.09 May 2007 36
Dispensing Options (cont.)
HP Tank(80 kg)
Comp(50 kg/d)
Disp(100 kg/d)
H2 from onsite
production unit
“Small” (0.1 tpd)Forecourt Station
H2 from onsite
production unit
Disp(1500 kg/d)
Comp(750 kg/d)
HP Tank(1193 kg)
“Large” (1.5 tpd)Forecourt Station