brian bonnenfant - wordpress.com · current economic review april 16, 2014 brian bonnenfant project...
TRANSCRIPT
Current Economic Review April 16, 2014
Brian Bonnenfant Project Manager
Center for Regional Studies University of Nevada, Reno
784-1771 [email protected]
180,000
185,000
190,000
195,000
200,000
205,000
210,000
215,000
220,000
225,000
230,000
Jan-
06Fe
b-06
Mar
-06
Apr
-06
May
-06
Jun-
06Ju
l-06
Aug
-06
Sep-
06O
ct-0
6N
ov-0
6D
ec-0
6Ja
n-07
Feb-
07M
ar-0
7A
pr-0
7M
ay-0
7Ju
n-07
Jul-0
7A
ug-0
7Se
p-07
Oct
-07
Nov
-07
Dec
-07
Jan-
08Fe
b-08
Mar
-08
Apr
-08
May
-08
Jun-
08Ju
l-08
Aug
-08
Sep-
08O
ct-0
8N
ov-0
8D
ec-0
8Ja
n-09
Feb-
09M
ar-0
9A
pr-0
9M
ay-0
9Ju
n-09
Jul-0
9A
ug-0
9Se
p-09
Oct
-09
Nov
-09
Dec
-09
Jan-
10Fe
b-10
Mar
-10
Apr
-10
May
-10
Jun-
10Ju
l-10
Aug
-10
Sep-
10O
ct-1
0N
ov-1
0D
ec-1
0Ja
n-11
Feb-
11M
ar-1
1A
pr-1
1M
ay-1
1Ju
n-11
Jul-1
1A
ug-1
1Se
p-11
Oct
-11
Nov
-11
Dec
-11
Jan-
12Fe
b-12
Mar
-12
Apr
-12
May
-12
Jun-
12Ju
l-12
Aug
-12
Sep-
12O
ct-1
2N
ov-1
2D
ec-1
2Ja
n-13
Feb-
13M
ar-1
3A
pr-1
3M
ay-1
3Ju
n-13
Jul-1
3A
ug-1
3Se
p-13
Oct
-13
Nov
-13
Dec
-13
Jan-
14Fe
b-14
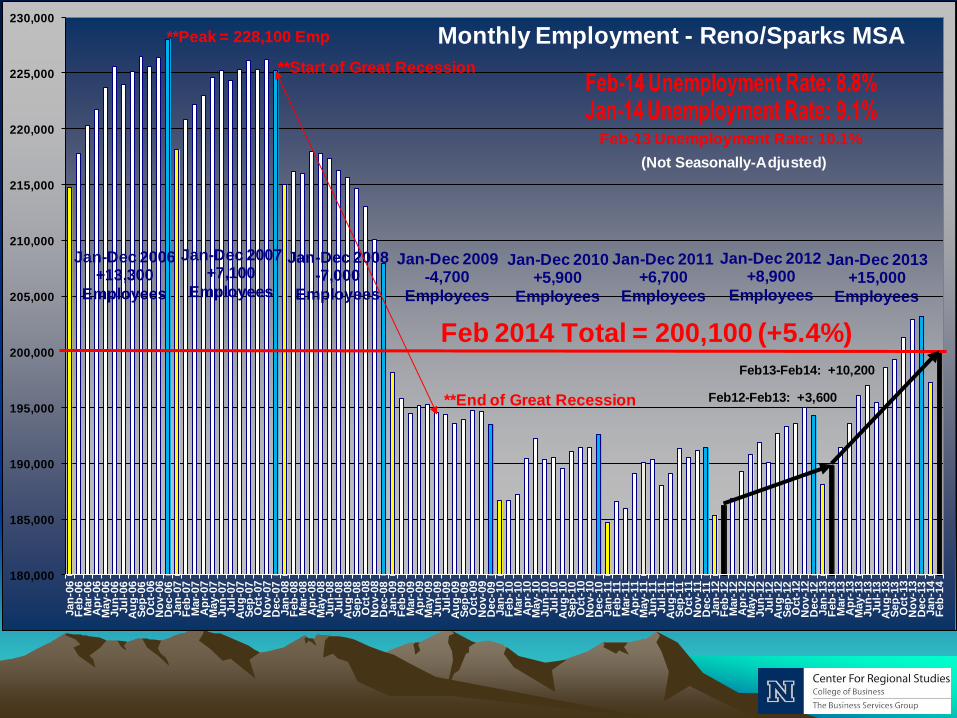
Monthly Employment - Reno/Sparks MSA
Feb 2014 Total = 200,100 (+5.4%)
Jan-Dec 2008-7,000
Employees
Jan-Dec 2007+7,100
Employees
Jan-Dec 2006+13,300
Employees
Jan-Dec 2009-4,700
Employees
Jan-Dec 2010+5,900
Employees
Feb12-Feb13: +3,600
Feb13-Feb14: +10,200
Feb-13 Unemployment Rate: 10.1%
**Peak = 228,100 Emp
**Start of Great Recession
**End of Great Recession
(Not Seasonally-Adjusted)
Jan-Dec 2011+6,700
Employees
Jan-Dec 2012+8,900
Employees
Jan-Dec 2013+15,000
Employees
-25,000
-20,000
-15,000
-10,000
-5,000
0
5,000
10,000
Jan-
07Fe
b-07
Mar
-07
Apr
-07
May
-07
Jun-
07Ju
l-07
Aug
-07
Sep-
07O
ct-0
7N
ov-0
7D
ec-0
7Ja
n-08
Feb-
08M
ar-0
8A
pr-0
8M
ay-0
8Ju
n-08
Jul-0
8A
ug-0
8Se
p-08
Oct
-08
Nov
-08
Dec
-08
Jan-
09Fe
b-09
Mar
-09
Apr
-09
May
-09
Jun-
09Ju
l-09
Aug
-09
Sep-
09O
ct-0
9N
ov-0
9D
ec-0
9Ja
n-10
Feb-
10M
ar-1
0A
pr-1
0M
ay-1
0Ju
n-10
Jul-1
0A
ug-1
0Se
p-10
Oct
-10
Nov
-10
Dec
-10
Jan-
11Fe
b-11
Mar
-11
Apr
-11
May
-11
Jun-
11Ju
l-11
Aug
-11
Sep-
11O
ct-1
1N
ov-1
1D
ec-1
1Ja
n-12
Feb-
12M
ar-1
2A
pr-1
2M
ay-1
2Ju
n-12
Jul-1
2A
ug-1
2Se
p-12
Oct
-12
Nov
-12
Dec
-12
Jan-
13Fe
b-13
Mar
-13
Apr
-13
May
-13
Jun-
13Ju
l-13
Aug
-13
Sep-
13O
ct-1
3N
ov-1
3D
ec-1
3Ja
n-14
Feb-
14
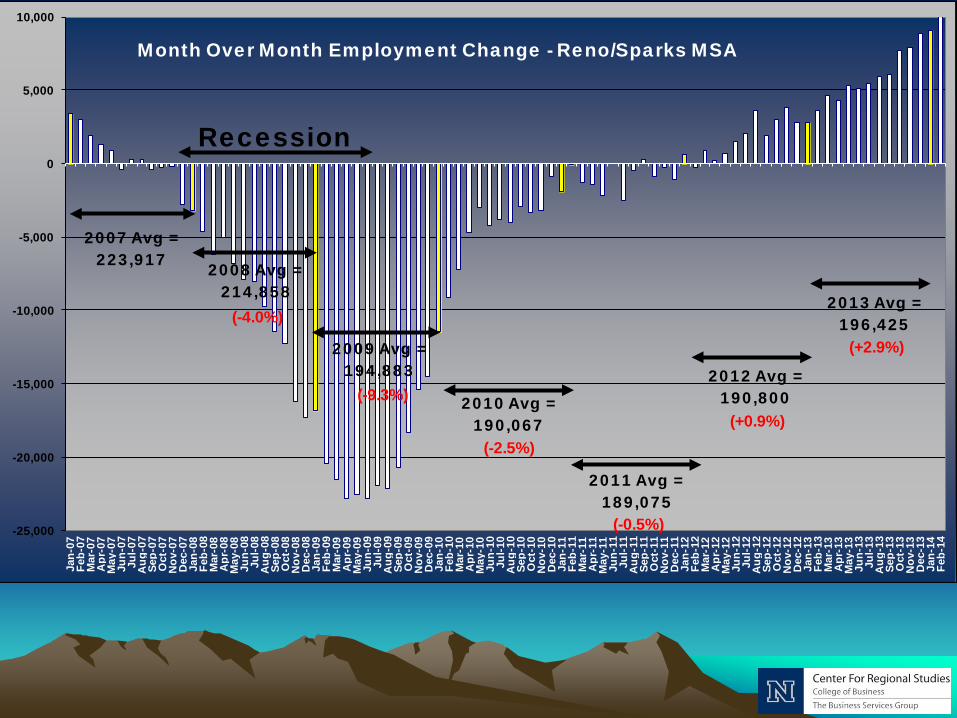
Recession
Month Over Month Employment Change - Reno/Sparks MSA
2012 Avg = 190,800
2011 Avg = 189,075
2010 Avg = 190,067
2009 Avg = 194,883
2007 Avg = 223,917 2008 Avg =
214,858(-4.0%)
(-9.3%)
(-2.5%)
(-0.5%)
(+0.9%)
2013 Avg = 196,425
(+2.9%)
(% of sector)
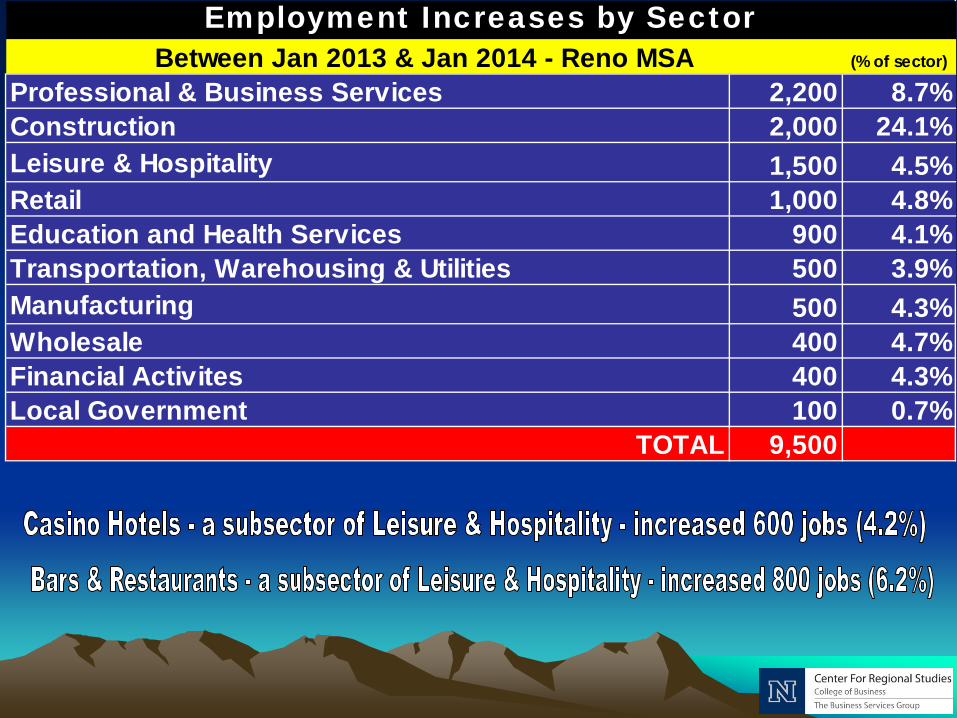
Professional & Business Services 2,200 8.7%Construction 2,000 24.1%Leisure & Hospitality 1,500 4.5%Retail 1,000 4.8%Education and Health Services 900 4.1%Transportation, Warehousing & Utilities 500 3.9%Manufacturing 500 4.3%Wholesale 400 4.7%Financial Activites 400 4.3%Local Government 100 0.7%
TOTAL 9,500
Between Jan 2013 & Jan 2014 - Reno MSAEmployment Increases by Sector
(% of sector)
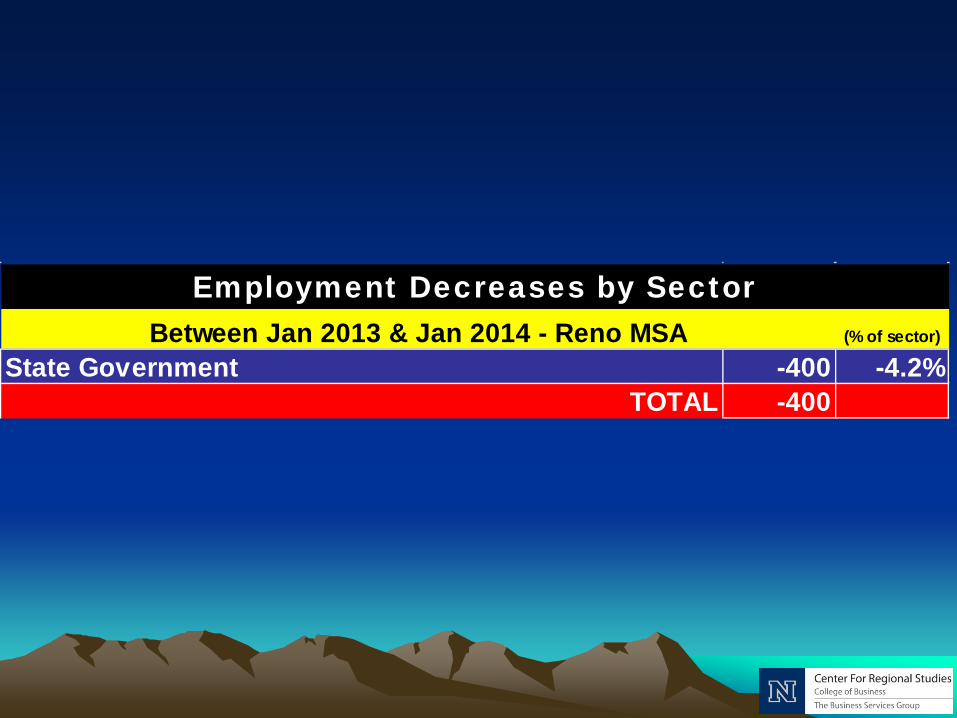
State Government -400 -4.2%TOTAL -400
Employment Decreases by SectorBetween Jan 2013 & Jan 2014 - Reno MSA
0
5000
10000
15000
20000
25000
30000
35000
40000
2002 2003 2004 2005 2006 2007 2008 2009 2010 2011 2012 2013
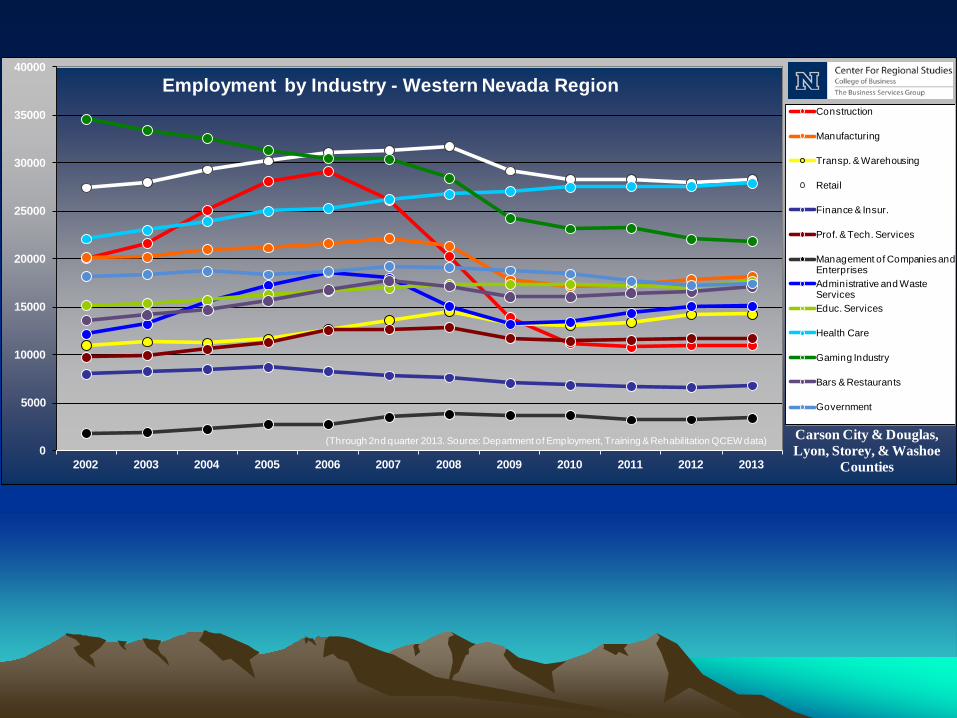
Employment by Industry - Western Nevada RegionConstruction
Manufacturing
Transp. & Warehousing
Retail
Finance & Insur.
Prof. & Tech. Services
Management of Companies and EnterprisesAdministrative and Waste ServicesEduc. Services
Health Care
Gaming Industry
Bars & Restaurants
Government
(Through 2nd quarter 2013. Source: Department of Employment, Training & Rehabilitation QCEW data) Carson City & Douglas, Lyon, Storey, & Washoe
Counties

Source: Department of Employment, Training, & Rehabilitation 2008-2013 3Q 2013 % of TotalIndustry 2008 2009 2010 2011 2012 2013* % Ch. Empl. Empl.Natural Resources and Mining 64,220$ 75,192$ 115,180$ 132,808$ 81,588$ 66,820$ 4.0% 342 0.2%Construction 49,660$ 49,348$ 48,100$ 48,672$ 49,556$ 47,545$ -4.3% 10,687 5.6%Manufacturing 53,924$ 52,936$ 51,896$ 53,560$ 53,300$ 51,619$ -4.3% 11,843 6.2%Trade, Transportation and Utilities 36,764$ 37,024$ 37,492$ 38,064$ 38,688$ 39,849$ 8.4% 42,567 22.4%Information 50,596$ 51,532$ 54,028$ 58,084$ 59,852$ 58,864$ 16.3% 1,930 1.0%Financial Activities 52,364$ 51,272$ 52,832$ 54,964$ 58,448$ 59,991$ 14.6% 9,115 4.8%Professional and Business Services 50,128$ 50,440$ 50,856$ 53,092$ 54,496$ 51,965$ 3.7% 27,026 14.2%Education and Health Services 48,776$ 48,828$ 48,672$ 48,932$ 50,128$ 48,412$ -0.7% 36,801 19.3%Leisure and Hospitality 22,256$ 21,840$ 21,788$ 22,152$ 21,944$ 22,325$ 0.3% 35,901 18.9%Other Services 31,148$ 33,072$ 33,904$ 34,684$ 36,244$ 36,157$ 16.1% 5,428 2.9%Public Administration 58,448$ 59,488$ 59,592$ 60,372$ 59,800$ 60,857$ 4.1% 8,608 4.5%Unclassified 58,240$ 66,456$ 72,176$ 72,644$ 59,852$ 65,815$ 13.0% 139 0.1%All Industries 42,172$ 42,224$ 42,380$ 43,004$ 43,576$ 43,229$ 2.5% 190,387 100.0%* Through 3rd Quarter 2013
> Inflation 31.1%Consumer Price Index (West; <1.5M) -0.6% 1.0% 3.0% 1.7% 1.1% 6.3% < Inflation 68.9%
2008-2013 Inflation
Wages, Inflation, & EmploymentWashoe County, Nevada
Wage Growth
Area Name
Per Capita Earned Income
(by Place of work)
US RANK
Per Capita Unearned
Income US
RANK
Per Capita Personal Income
US RANK
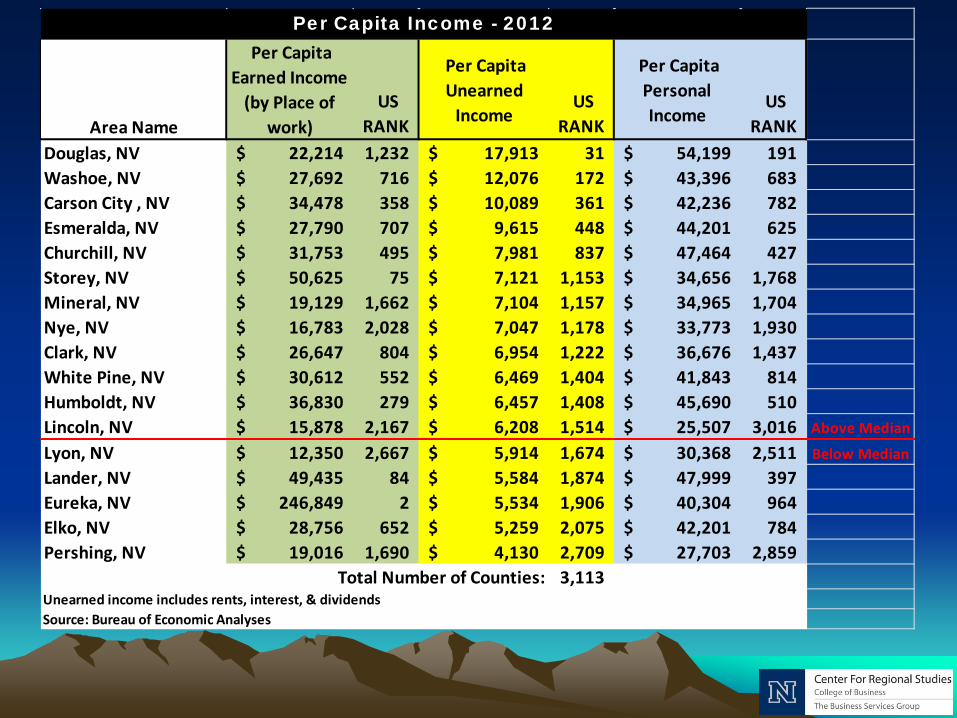
Douglas, NV 22,214$ 1,232 17,913$ 31 54,199$ 191 Washoe, NV 27,692$ 716 12,076$ 172 43,396$ 683 Carson City , NV 34,478$ 358 10,089$ 361 42,236$ 782 Esmeralda, NV 27,790$ 707 9,615$ 448 44,201$ 625 Churchill, NV 31,753$ 495 7,981$ 837 47,464$ 427 Storey, NV 50,625$ 75 7,121$ 1,153 34,656$ 1,768 Mineral, NV 19,129$ 1,662 7,104$ 1,157 34,965$ 1,704 Nye, NV 16,783$ 2,028 7,047$ 1,178 33,773$ 1,930 Clark, NV 26,647$ 804 6,954$ 1,222 36,676$ 1,437 White Pine, NV 30,612$ 552 6,469$ 1,404 41,843$ 814 Humboldt, NV 36,830$ 279 6,457$ 1,408 45,690$ 510 Lincoln, NV 15,878$ 2,167 6,208$ 1,514 25,507$ 3,016 Above Median
Lyon, NV 12,350$ 2,667 5,914$ 1,674 30,368$ 2,511 Below MedianLander, NV 49,435$ 84 5,584$ 1,874 47,999$ 397 Eureka, NV 246,849$ 2 5,534$ 1,906 40,304$ 964 Elko, NV 28,756$ 652 5,259$ 2,075 42,201$ 784 Pershing, NV 19,016$ 1,690 4,130$ 2,709 27,703$ 2,859
Total Number of Counties: 3,113 Unearned income includes rents, interest, & dividendsSource: Bureau of Economic Analyses
Per Capita Income - 2012
-25.0%
-15.0%
-5.0%
5.0%
15.0%
25.0%1Q
-20
05
1Q -
2006
1Q -
2007
1Q -
2008
1Q -
2009
1Q -
2010
1Q -
2011
1Q -
2012
1Q -
2013
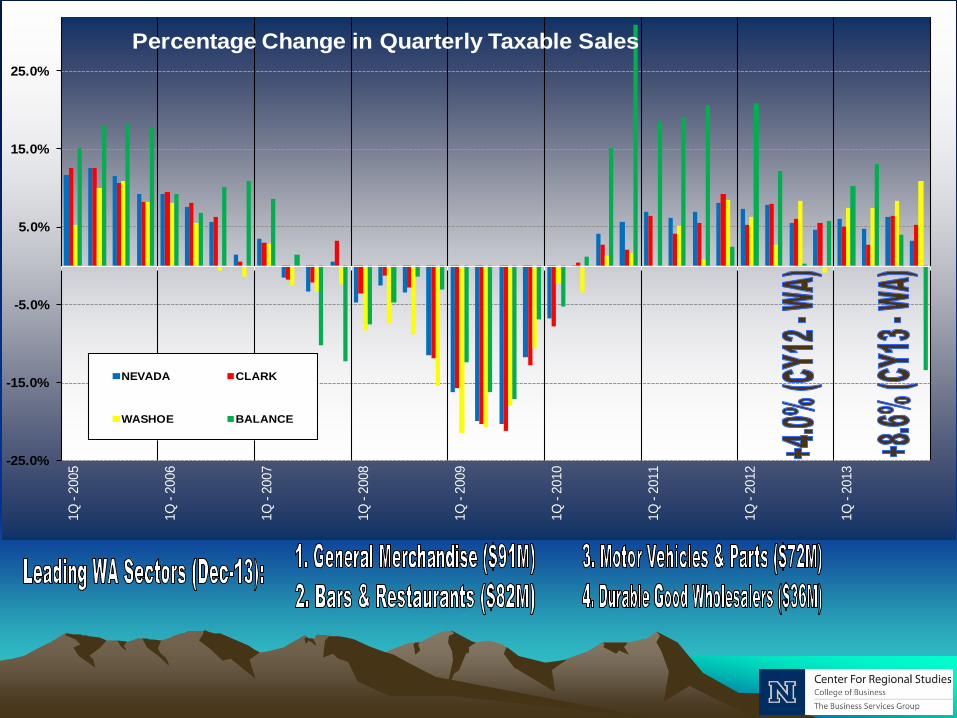
Percentage Change in Quarterly Taxable Sales
NEVADA CLARK
WASHOE BALANCE

Jan-14 = +0.5% Feb-14 = -2.6%
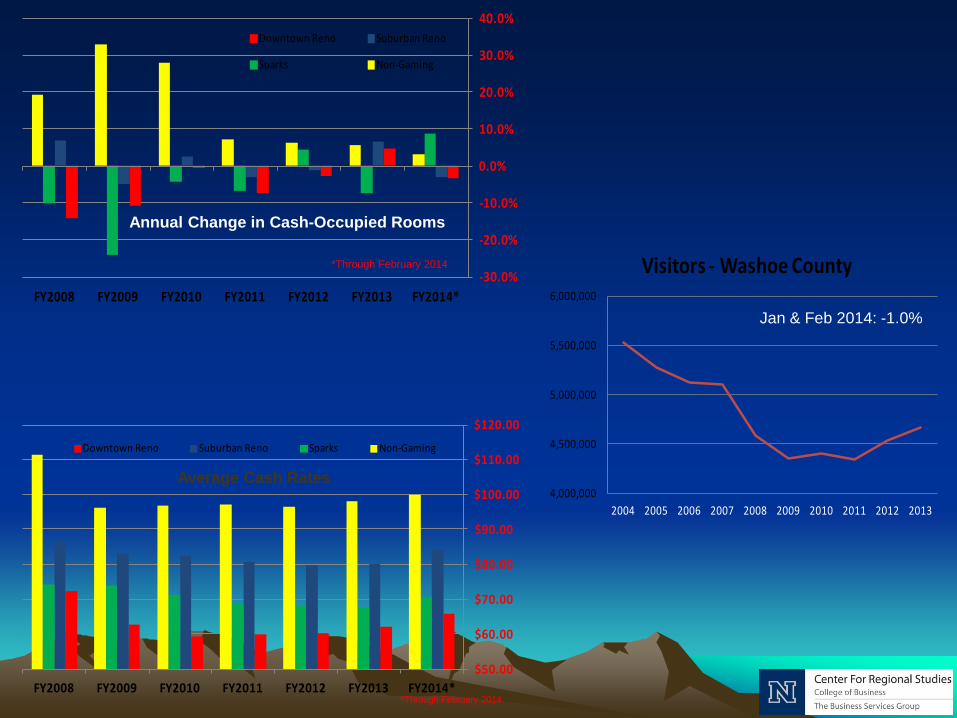
$50.00
$60.00
$70.00
$80.00
$90.00
$100.00
$110.00
$120.00
FY2014*FY2013FY2012FY2011FY2010FY2009FY2008
Downtown Reno Suburban Reno Sparks Non-Gaming
-30.0%
-20.0%
-10.0%
0.0%
10.0%
20.0%
30.0%
40.0%
FY2014*FY2013FY2012FY2011FY2010FY2009FY2008
Downtown Reno Suburban Reno
Sparks Non-Gaming
*Through February 2014
4,000,000
4,500,000
5,000,000
5,500,000
6,000,000
2004 2005 2006 2007 2008 2009 2010 2011 2012 2013
Visitors - Washoe County
Annual Change in Cash-Occupied Rooms
Jan & Feb 2014: -1.0%
*Through February 2014
Average Cash Rates
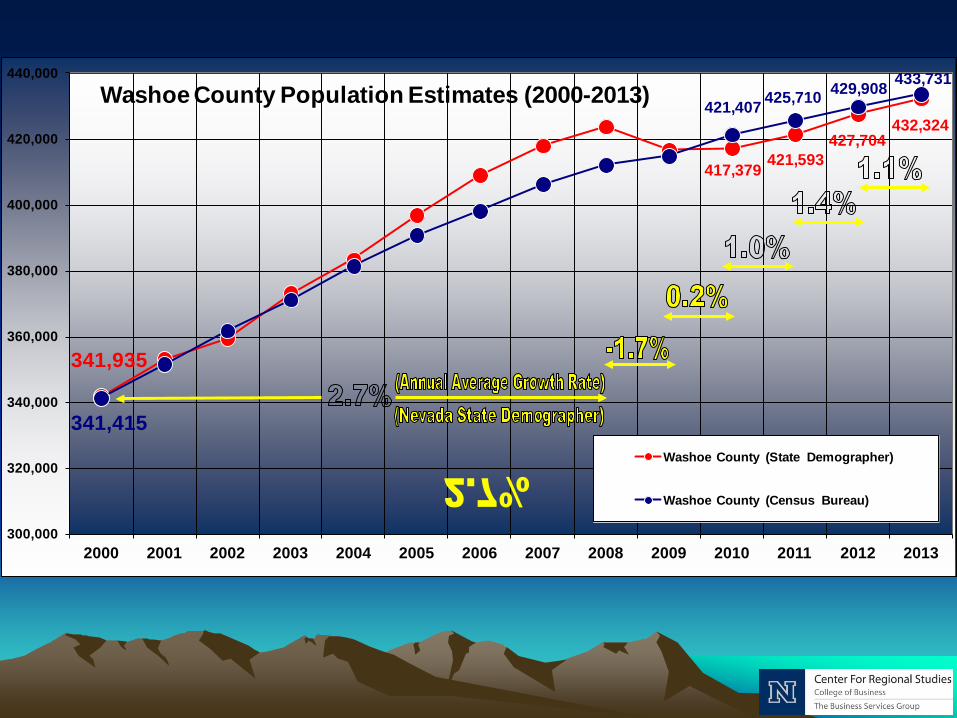
341,935
417,379 421,593427,704
432,324
341,415
421,407 425,710 429,908 433,731
300,000
320,000
340,000
360,000
380,000
400,000
420,000
440,000
2000 2001 2002 2003 2004 2005 2006 2007 2008 2009 2010 2011 2012 2013
Washoe County Population Estimates (2000-2013)
Washoe County (State Demographer)
Washoe County (Census Bureau)
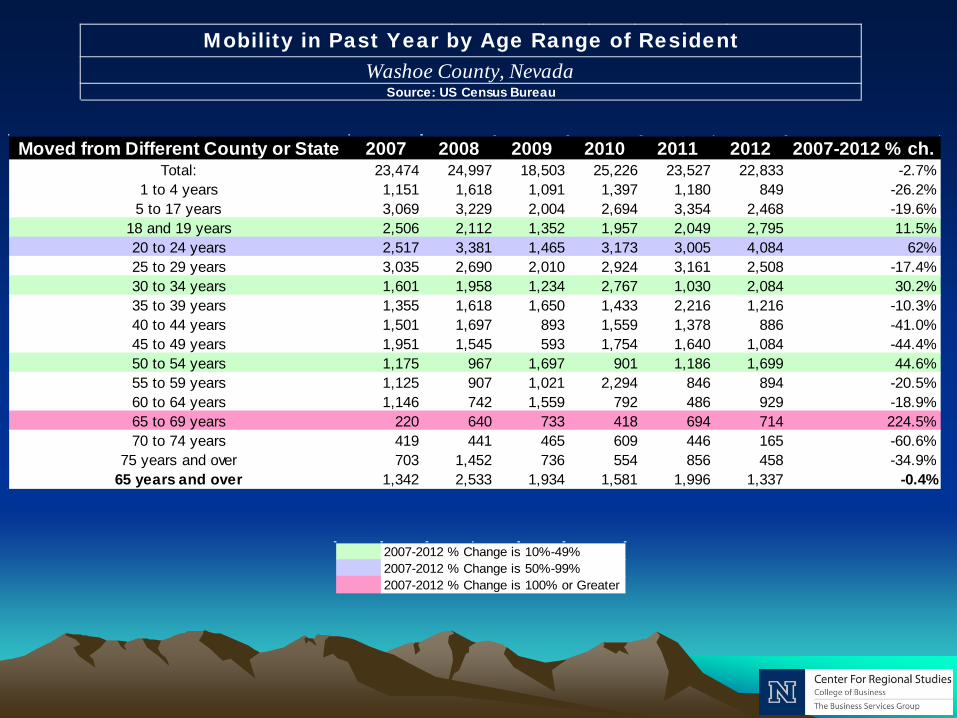
Mobility in Past Year by Age Range of ResidentWashoe County, Nevada
Source: US Census Bureau
2007-2012 % Change is 10%-49%2007-2012 % Change is 50%-99%2007-2012 % Change is 100% or Greater
Moved from Different County or State 2007 2008 2009 2010 2011 2012 2007-2012 % ch.Total: 23,474 24,997 18,503 25,226 23,527 22,833 -2.7%
1 to 4 years 1,151 1,618 1,091 1,397 1,180 849 -26.2%5 to 17 years 3,069 3,229 2,004 2,694 3,354 2,468 -19.6%
18 and 19 years 2,506 2,112 1,352 1,957 2,049 2,795 11.5%20 to 24 years 2,517 3,381 1,465 3,173 3,005 4,084 62%25 to 29 years 3,035 2,690 2,010 2,924 3,161 2,508 -17.4%30 to 34 years 1,601 1,958 1,234 2,767 1,030 2,084 30.2%35 to 39 years 1,355 1,618 1,650 1,433 2,216 1,216 -10.3%40 to 44 years 1,501 1,697 893 1,559 1,378 886 -41.0%45 to 49 years 1,951 1,545 593 1,754 1,640 1,084 -44.4%50 to 54 years 1,175 967 1,697 901 1,186 1,699 44.6%55 to 59 years 1,125 907 1,021 2,294 846 894 -20.5%60 to 64 years 1,146 742 1,559 792 486 929 -18.9%65 to 69 years 220 640 733 418 694 714 224.5%70 to 74 years 419 441 465 609 446 165 -60.6%
75 years and over 703 1,452 736 554 856 458 -34.9%65 years and over 1,342 2,533 1,934 1,581 1,996 1,337 -0.4%
0
200
400
600
800
1,000
1,200
Jan-
09Fe
b-09
Mar
-09
Apr
-09
May
-09
Jun-
09Ju
l-09
Aug
-09
Sep
-09
Oct
-09
Nov
-09
Dec
-09
Jan-
10Fe
b-10
Mar
-10
Apr
-10
May
-10
Jun-
10Ju
l-10
Aug
-10
Sep
-10
Oct
-10
Nov
-10
Dec
-10
Jan-
11Fe
b-11
Mar
-11
Apr
-11
May
-11
Jun-
11Ju
l-11
Aug
-11
Sep
-11
Oct
-11
Nov
-11
Dec
-11
Jan-
12Fe
b-12
Mar
-12
Apr
-12
May
-12
Jun-
12Ju
l-12
Aug
-12
Sep
-12
Oct
-12
Nov
-12
Dec
-12
Jan-
13Fe
b-13
Mar
-13
Apr
-13
May
-13
Jun-
13Ju
l-13
Aug
-13
Sep
-13
Oct
-13
Nov
-13
Dec
-13
Jan-
14Fe
b-14
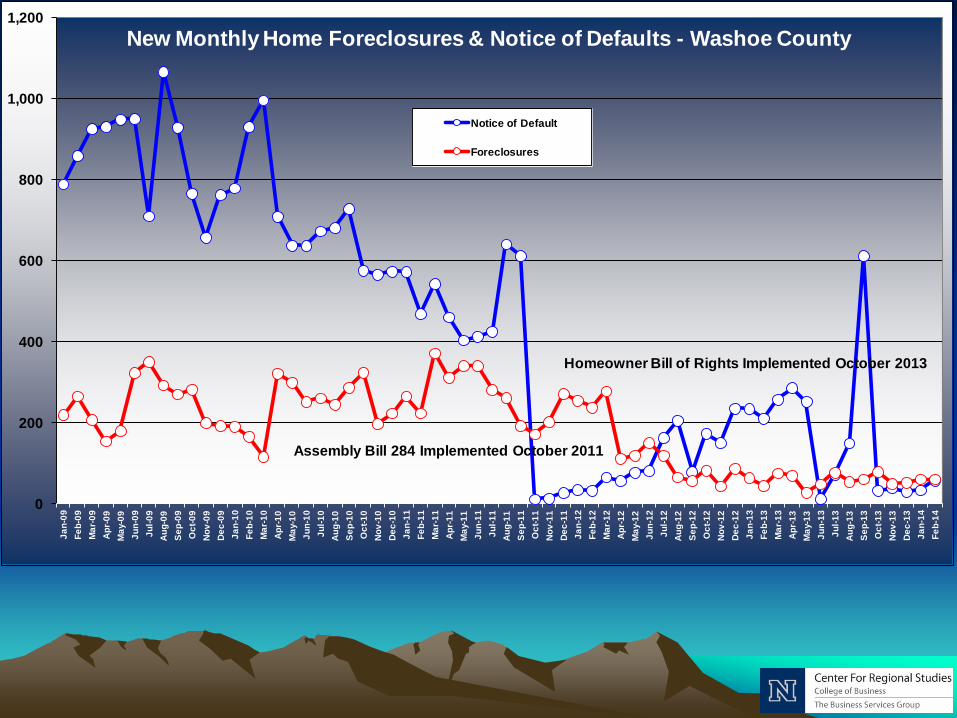
New Monthly Home Foreclosures & Notice of Defaults - Washoe County
Notice of Default
Foreclosures
Assembly Bill 284 Implemented October 2011
Homeowner Bill of Rights Implemented October 2013
$90,000
$100,000
$110,000
$120,000
$130,000
$140,000
$150,000
$160,000
$170,000
$180,000
$190,000
$200,000
$210,000
$220,000
$230,000
$240,000
$250,000
$260,000
$270,000
Jan -0
9Fe
b-09
Mar-0
9Ap
r-09
May-0
9Ju
n -09
Jul-0
9Au
g-09
Sep-0
9Oc
t-09
Nov-0
9De
c-09
Jan-1
0Fe
b-10
Mar-1
0Ap
r-10
May-1
0Ju
n-10
Jul-1
0Au
g-10
Sep-1
0Oc
t-10
Nov-1
0De
c-10
Jan-1
1Fe
b-11
Mar-1
1Ap
r-11
May-1
1Ju
n-11
Jul-1
1Au
g-11
Sep-1
1Oc
t-11
Nov-1
1De
c-11
Jan-1
2Fe
b-12
Mar-1
2Ap
r-12
May-1
2Ju
n-12
Jul-1
2Au
g-12
Sep-1
2Oc
t-12
Nov-1
2De
c-12
Jan-1
3Fe
b-13
Mar-1
3Ap
r-13
May-1
3Ju
n-13
Jul-1
3Au
g-13
Sep-1
3Oc
t-13
Nov-1
3De
c-13
Jan-1
4Fe
b-14
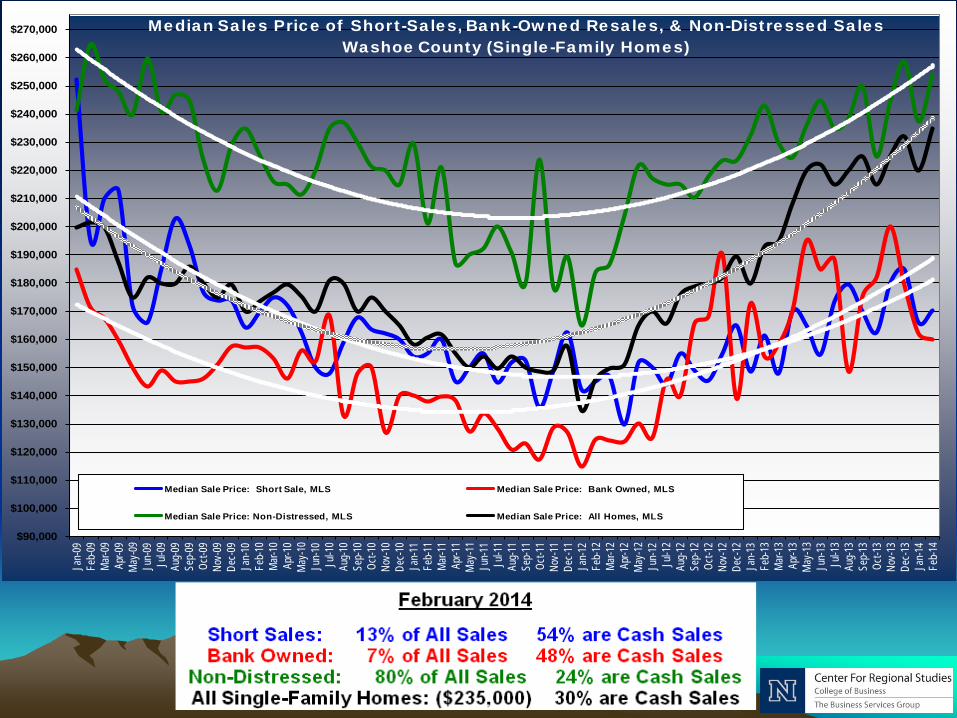
Median Sales Price of Short-Sales, Bank-Owned Resales, & Non-Distressed SalesWashoe County (Single-Family Homes)
Median Sale Price: Short Sale, MLS Median Sale Price: Bank Owned, MLS
Median Sale Price: Non-Distressed, MLS Median Sale Price: All Homes, MLS
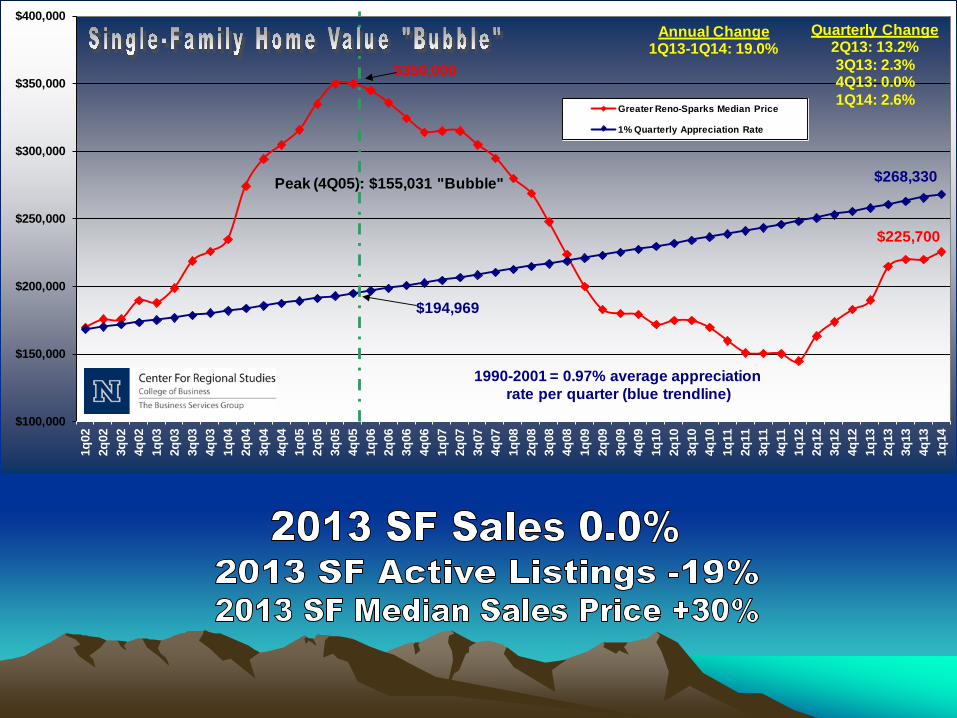
$350,000
$225,700
$194,969
$268,330
$100,000
$150,000
$200,000
$250,000
$300,000
$350,000
$400,000
1q02
2q02
3q02
4q02
1q03
2q03
3q03
4q03
1q04
2q04
3q04
4q04
1q05
2q05
3q05
4q05
1q06
2q06
3q06
4q06
1q07
2q07
3q07
4q07
1q08
2q08
3q08
4q08
1q09
2q09
3q09
4q09
1q10
2q10
3q10
4q10
1q11
2q11
3q11
4q11
1q12
2q12
3q12
4q12
1q13
2q13
3q13
4q13
1q14
Greater Reno-Sparks Median Price
1% Quarterly Appreciation Rate
Peak (4Q05): $155,031 "Bubble"
1990-2001 = 0.97% average appreciationrate per quarter (blue trendline)
Quarterly Change2Q13: 13.2%3Q13: 2.3%4Q13: 0.0%1Q14: 2.6%
Annual Change1Q13-1Q14: 19.0%
91
81
114
128131
111117
112
67
54
25
32
4040
646461
102
65
48
6966
73
47
2728
49
6158
77
2723
4044
4944
22
3833
29
454243
3236
21
47
39
2519
38
30
55
4448
72
52
5960
44
5253
34
45
52
74
98
90
7477
40
25
67
75
$0
$50,000
$100,000
$150,000
$200,000
$250,000
$300,000
$350,000
$400,000
0
20
40
60
80
100
120
140
Jan-
08F
eb-0
8M
ar-0
8A
pr-0
8M
ay-0
8Ju
n-08
Jul-0
8A
ug-0
8S
ep-0
8O
ct-0
8N
ov-0
8D
ec-0
8Ja
n-09
Feb
-09
Mar
-09
Apr
-09
May
-09
Jun-
09Ju
l-09
Aug
-09
Sep
-09
Oct
-09
Nov
-09
Dec
-09
Jan-
10F
eb-1
0M
ar-1
0A
pr-1
0M
ay-1
0Ju
n-10
Jul-1
0A
ug-1
0S
ep-1
0O
ct-1
0N
ov-1
0D
ec-1
0Ja
n-11
Feb
-11
Mar
-11
Apr
-11
May
-11
Jun-
11Ju
l-11
Aug
-11
Sep
-11
Oct
-11
Nov
-11
Dec
-11
Jan-
12F
eb-1
2M
ar-1
2A
pr-1
2M
ay-1
2Ju
n-12
Jul-1
2A
ug-1
2S
ep-1
2O
ct-1
2N
ov-1
2D
ec-1
2Ja
n-13
Feb
-13
Mar
-13
Apr
-13
May
-13
Jun-
13Ju
l-13
Aug
-13
Sep
-13
Oct
-13
Nov
-13
Dec
-13
Jan-
14F
eb-1
4
Median New
Home Sales PriceNu
mbe
r of N
ew H
ome
Sale
s
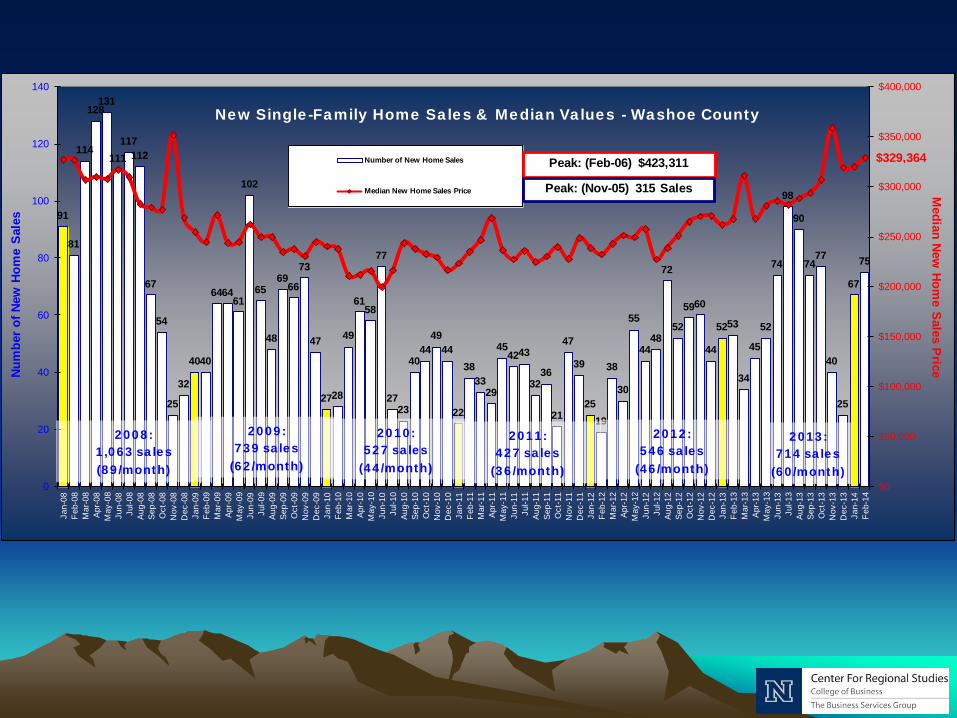
New Single-Family Home Sales & Median Values - Washoe County
Number of New Home Sales
Median New Home Sales Price
Peak: (Feb-06) $423,311
Peak: (Nov-05) 315 Sales
2008:1,063 sales (89/month)
2009:739 sales
(62/month)
2010:527 sales
(44/month)
2011:427 sales
(36/month)
2012:546 sales
(46/month)
$329,364
2013:714 sales
(60/month)
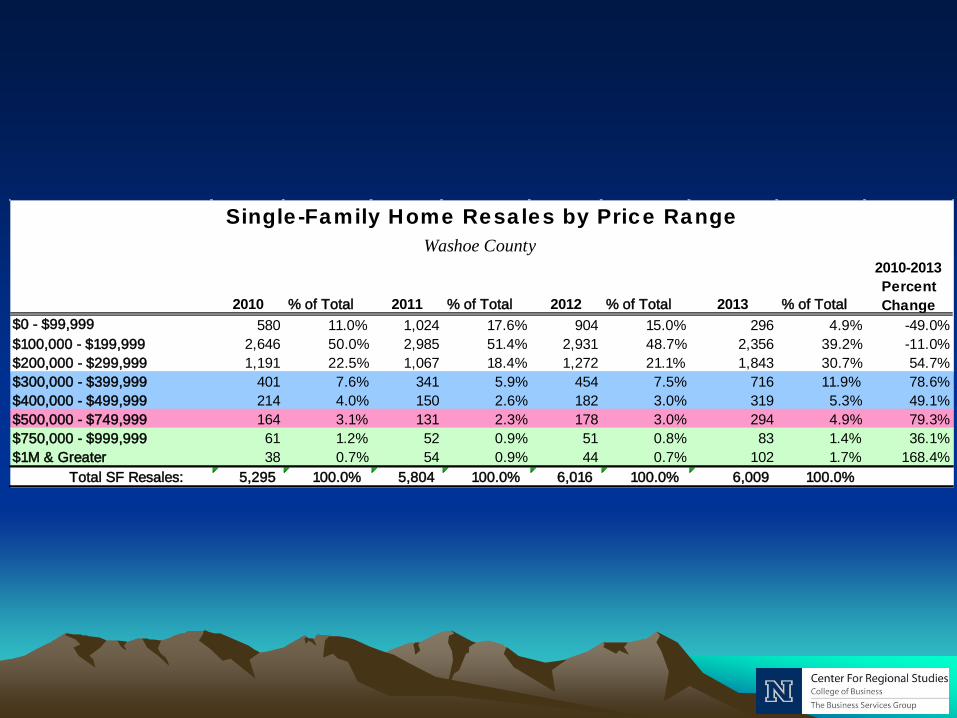
2010 % of Total 2011 % of Total 2012 % of Total 2013 % of Total$0 - $99,999 580 11.0% 1,024 17.6% 904 15.0% 296 4.9% -49.0%$100,000 - $199,999 2,646 50.0% 2,985 51.4% 2,931 48.7% 2,356 39.2% -11.0%$200,000 - $299,999 1,191 22.5% 1,067 18.4% 1,272 21.1% 1,843 30.7% 54.7%$300,000 - $399,999 401 7.6% 341 5.9% 454 7.5% 716 11.9% 78.6%$400,000 - $499,999 214 4.0% 150 2.6% 182 3.0% 319 5.3% 49.1%$500,000 - $749,999 164 3.1% 131 2.3% 178 3.0% 294 4.9% 79.3%$750,000 - $999,999 61 1.2% 52 0.9% 51 0.8% 83 1.4% 36.1%$1M & Greater 38 0.7% 54 0.9% 44 0.7% 102 1.7% 168.4%
Total SF Resales: 5,295 100.0% 5,804 100.0% 6,016 100.0% 6,009 100.0%
2010-2013 Percent Change
Washoe CountySingle-Family Home Resales by Price Range
Questions?
Thank You