brexit impact on indian economyphdcci.in/live_backup/image/data/research bureau... · brexit impact...
TRANSCRIPT

BREXIT Impact on Indian Economy
Working Paper No. 43
July 2016 PHD RESEARCH BUREAU PHD CHAMBER OF COMMERCE AND INDUSTRY PHD House, 4/2 Siri Institutional Area, August Kranti Marg, New Delhi 110016 Phone: 91-11-49545454, Fax 91-11-49545451 Email: [email protected], Website www.phdcci.in

BREXIT Impact on Indian Economy
PHD Research Bureau
2
Executive Summary
Britain's exit from European Union would result in several economic and financial implications not only for European Union or advanced economies, emerging and developing economies but for the entire world economy. The BREXIT has already resulted in financial markets volatility across the world and could also spur a number of other risks through various trade, finance and confidence channels. The weakness in European economy could also hurt world exports as weakening European currencies might put renewed downward pressure on major exporting countries. Therefore, at this juncture, the present World situation will largely depend on the kind of trade deal Britain negotiates with the EU along with no big reductions in its access to the single market. There is no significant impact of the BREXIT is seen on any sector of the Indian Economy. Though, lot of diversification has taken place in India’s exports from advanced economies of Europe and America towards emerging and developing economies of Asia, Africa and Middle East, EU is still India’s significant trade partner and UK and Germany are among the top ten export destinations of India and Germany is also in India’s top ten sources of imports. The pace of India-EU and India-UK exports and imports will continue and achieving new growth trajectories in the coming times. India-EU trade is expected to touch USD 100 billion in the next two years by FY2018 of which India-UK trade would post a USD 20 billion trade trajectory. Though financial markets volatility cannot be ruled out, India’s economic resilience has been strengthened on account of big bang economic reforms undertaken by the Government to boost up investment sentiments in the economy. Despite adverse international economic developments during the last eight years, India is not only the fastest moving economy but its economic share in the world GDP is also increasing at a significant pace from 1.77% in the year 2005 to 2.86% in the year 2015. Notwithstanding, the slowdown in the world economy; growth in India remained robust, buoyed by strong investor sentiment and a recent fall in international commodity prices. India posted a higher growth of 7.6% in 2015-16 as compared to 7.3% in 2014-15, 6.9% in 2013-14 and 5.1% in 2012-13. Growth in India is expected to remain1 steady at 8% in 2016-17 on account of continuous pace of economic reforms and a good monsoon scenario. India’s economic resilience has strengthened during the recent times on account of factors such as announcements of big bang FDI reforms and a significant jump in FDI inflows, narrowing current account deficit, declining trade balance due to fall in 1 Projections by PHD Research Bureau of PHD Chamber of Commerce and Industry.

BREXIT Impact on Indian Economy
PHD Research Bureau
3
commodity prices. India’s strong macroeconomic fundamentals and conducive policy measures undertaken by the government will help in mitigating the impact of adverse international economic developments, going forward. India attracted FDI equity inflows at about USD 40 billion during 2015-16 as against USD 30.9 billion during the corresponding period of last year, posting a robust growth of about 29%. The Current Account Deficit (CAD) narrowed to 1.1% of GDP in 2015-16 from 1.3% in 2014-15 is more or less manageable at this juncture. India’s foreign exchange reserves are at about USD 361 billion as on 24th June 2016 as against around USD 355 billion as on 26th June 2015 have been improved significantly. Trade balance has also declined to around (-) USD 118.6 billion during 2015-16 as compared to (-) USD 137.6 billion for 2014-15. The inward FDI equity inflows from Europe are around 14.1% of India’s top ten investing countries in the year 2015-16. The investment inflows from EU to India will remain steady as India’s growth trajectory would remain promising in the coming times The recently announced plethora of economic reforms such as Make in India, digital India and opportunities for start ups would attract more and more investments, going forward. India-EU: Select economic indicators
S.No Particular In percentage 1 Share of EU in India’s total trade (2015-16) 13.75% 2 Share of EU in India’s total exports (2015-
16) 16.98%
3 Share of EU in India’s Imports (2015-16)
11.53%
4 Share of EU in India’s FDI equity inflows (2015-16)
14.5%
5 EU countries in India’s top ten export destinations
UK and Germany
6 EU countries in India’s top ten sources of imports
Germany
7 Share of EU in India’s top ten items of exports
15.53%
8 Share of EU in India’s top ten sources of imports
9.43%
Source: PHD Research Bureau, compiled from various sources

BREXIT Impact on Indian Economy
PHD Research Bureau
4
Table of Contents
S.No. Content Page Number 1 Growth Synchronization of advanced, emerging
and developing economies 5
2 India’s growth story continues… 8 3 BREXIT: Retrospective and Prospective
9
4 India- United Kingdom bilateral economic relations
10
5 Impact of BREXIT on India
18
6 Conclusions
23
BREXIT Impact on Indian Economy
PHD Research Bureau
5
1. Growth Synchronization of advanced, emerging and
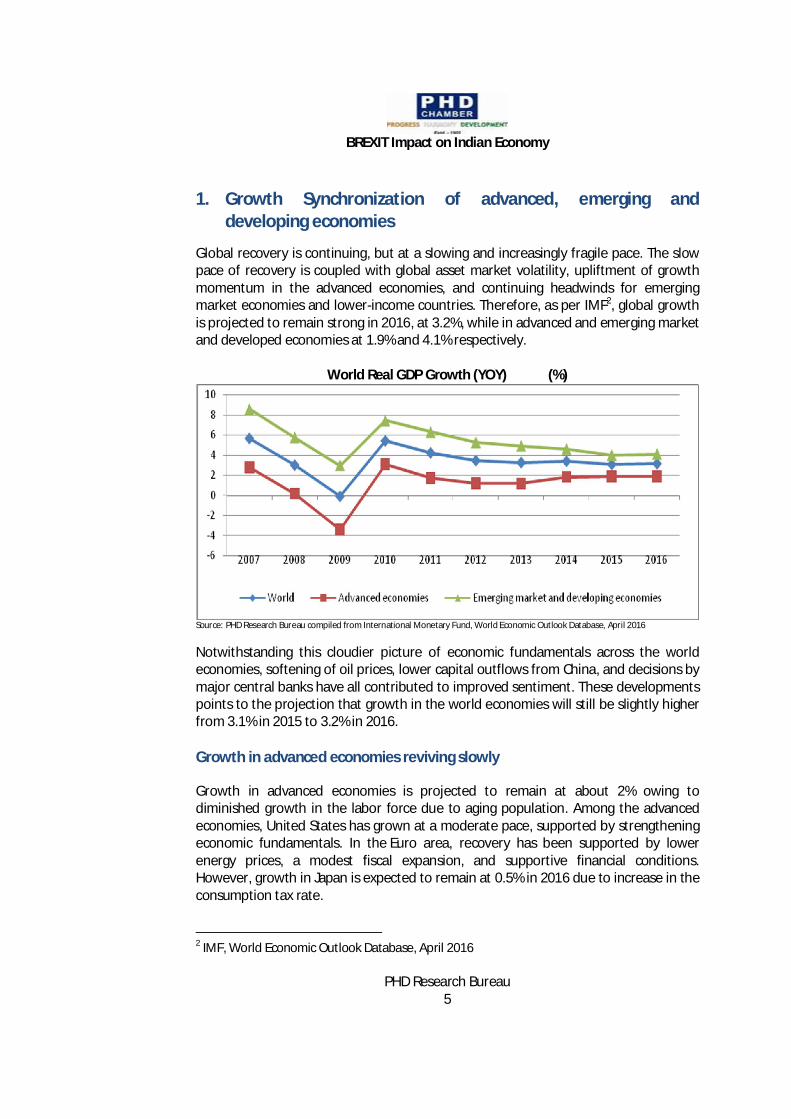
developing economies Global recovery is continuing, but at a slowing and increasingly fragile pace. The slow pace of recovery is coupled with global asset market volatility, upliftment of growth momentum in the advanced economies, and continuing headwinds for emerging market economies and lower-income countries. Therefore, as per IMF2, global growth is projected to remain strong in 2016, at 3.2%, while in advanced and emerging market and developed economies at 1.9% and 4.1% respectively.
World Real GDP Growth (YOY) (%)
Source: PHD Research Bureau compiled from International Monetary Fund, World Economic Outlook Database, April 2016
Notwithstanding this cloudier picture of economic fundamentals across the world economies, softening of oil prices, lower capital outflows from China, and decisions by major central banks have all contributed to improved sentiment. These developments points to the projection that growth in the world economies will still be slightly higher from 3.1% in 2015 to 3.2% in 2016. Growth in advanced economies reviving slowly
Growth in advanced economies is projected to remain at about 2% owing to diminished growth in the labor force due to aging population. Among the advanced economies, United States has grown at a moderate pace, supported by strengthening economic fundamentals. In the Euro area, recovery has been supported by lower energy prices, a modest fiscal expansion, and supportive financial conditions. However, growth in Japan is expected to remain at 0.5% in 2016 due to increase in the consumption tax rate.
2 IMF, World Economic Outlook Database, April 2016

BREXIT Impact on Indian Economy
PHD Research Bureau
6
Moderate performance in emerging and developing economies
Although, emerging market and developing economies have accounted for the lion’s share of world growth in 2015, yet their growth rate is projected to increase only modestly in 2016. There growth is projected to increase from 4% in 2015, the lowest rate since the 2008–09 financial crises to 4.1% in 2016. There are immediate challenges particularly for emerging market and developing economies. These common challenges center on dealing with slowing growth and increased vulnerabilities after a decade of optimistic activity and credit expansion. Therefore, in this global environment, with the continued weakness of growth and unfavorable macroeconomic policies in many economies, a three-pronged approach of structural reforms, fiscal support and fiscal stimulus, monetary policy measures are required to stimulate growth, going forward. According to IMF, Growth in India is projected at 7.5% in 2016. Growth will continue to be driven by private consumption, which has benefited from lower energy prices and higher real incomes. With the revival of sentiment and pickup in industrial activity, a recovery of private investment is expected to further strengthen growth. GDP growth rates (YOY) (%)
Source: PHD Research Bureau compiled from International Monetary Fund, World Economic Outlook Database, April 2016 Macroeconomic fundamentals of select world economies
It is seen that the growth rate of GDP at 4% in the year 2015 for emerging and developing economies is the highest and reflects the robust macroeconomic policies of their respective Governments. Further, the debt to GDP percentage is the lowest for BRICS3 economies (Russia has 17.9%) and highest for European PIIGS4 economies (Greece at 177%) which reflects that BRICS economies are growing at a faster pace owing to its young population, lower tax rates and less public expenditure. On the other hand (as per Table below), interest rates are considerably higher in BRICS economies (Brazil at 14.2%) and lowest in advanced economies (ranges between 0 to 3 BRICS stands for Brazil, Russia, India, China and South Africa 4 PIIGS refers to economies such as Portugal, Ireland, Italy, Greece and Spain

BREXIT Impact on Indian Economy
PHD Research Bureau
7
1%) which reflects the efforts of central banks of emerging and developing economies’ to contain inflation by imposing higher interest rates. Also, the current account balance of European PIIGS economies is positive whereas negative for most of the BRICS economies except Russia (5%) and China (2.7%) which indicates towards strong external position of advanced economies. The unemployment rate is highest in the European PIIGS economies (Italy at 24.14 percent) and lowest in BRICS economies (4.1% and 4.9% for China and India) except South Korea where the rate is 26.7%. However, fiscal position of Canada and Germany is positive at 0.1% and 0.7% which reflects the prudent fiscal policies and their respective governments.
Macroeconomic snapshot of select world economies Region GDP
Billion GDP
growth Govt debt
as% of GDP
Int Rate (%)
Infl Rate (%)
CAB (% of GDP)
Unemp rate (%)
Fiscal Deficit (as%
of GDP)
United States
17,947 2.4 104 0.5 0.1 -2.6 5.2 -2.5
Canada 1,552 1.2 91.5 0.5 1.1 -3.3 6.9 0.1 Japan 4,123 0.5 229 -0.1 -0.4 2.9 3.2 -6
Euro Area United Kingdom
2,849 2.3 89.2 0.5 0.3 -4.3 5 -4.4
Germany 3,358 1.5 71.2 0 0.3 8.5 6.1 0.7 France 2,422 1.1 96.1 0 0.2 -0.1 10.2 -3.6 Netherlands 1.9 65.1 0 0 10.9 6.3 -1.8
European PIIGS Portugal 199 1.5 129 0 0.3 0.5 12.4 -4.4 Ireland 238 7.8 93.8 0 0 4.5 7.8 -2.3 Italy 1,816 0.8 133 0 -0.4 2.1 11.7 -2.6 Greece 195 -0.2 177 0 -0.9 0 24.14 -7.2 Spain 1,200 3.2 99.2 0 -0.8 1.4 21 -5.1
BRICS Countries Brazil 1,773 -3.9 66.23 14.25 9 -3.3 6.8 -10.3 Russia 1,325 -3.8 17.92 10.5 15.5 5 5.6 -3.5 India 2,091 7.3 67.2 6.5 5.9 -1.3 4.9 -3.9 China 10,983 6.9 43.9 4.35 1.4 2.7 4.1 -2.3 South Korea 313 1.3 35.12 1.25 -4.4 -4.4 26.7 -4.2
Source: PHD Research Bureau, compiled from various sources. Note: CAB stands for Current Account Balance, Int stands for Interest Rate, Infl stands for Inflation rate, Unemp stands for employment rate
BREXIT Impact on Indian Economy
PHD Research Bureau
8
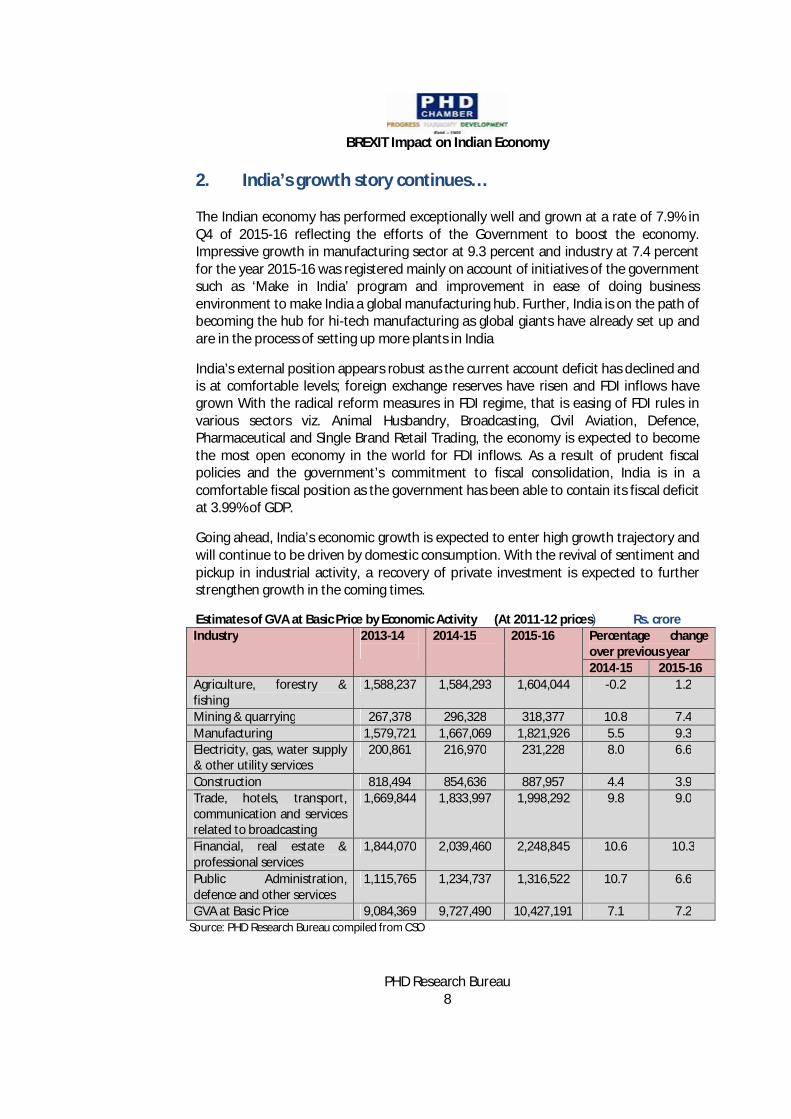
2. India’s growth story continues… The Indian economy has performed exceptionally well and grown at a rate of 7.9% in Q4 of 2015-16 reflecting the efforts of the Government to boost the economy. Impressive growth in manufacturing sector at 9.3 percent and industry at 7.4 percent for the year 2015-16 was registered mainly on account of initiatives of the government such as ‘Make in India’ program and improvement in ease of doing business environment to make India a global manufacturing hub. Further, India is on the path of becoming the hub for hi-tech manufacturing as global giants have already set up and are in the process of setting up more plants in India
India’s external position appears robust as the current account deficit has declined and is at comfortable levels; foreign exchange reserves have risen and FDI inflows have grown With the radical reform measures in FDI regime, that is easing of FDI rules in various sectors viz. Animal Husbandry, Broadcasting, Civil Aviation, Defence, Pharmaceutical and Single Brand Retail Trading, the economy is expected to become the most open economy in the world for FDI inflows. As a result of prudent fiscal policies and the government’s commitment to fiscal consolidation, India is in a comfortable fiscal position as the government has been able to contain its fiscal deficit at 3.99% of GDP. Going ahead, India’s economic growth is expected to enter high growth trajectory and will continue to be driven by domestic consumption. With the revival of sentiment and pickup in industrial activity, a recovery of private investment is expected to further strengthen growth in the coming times. Estimates of GVA at Basic Price by Economic Activity (At 2011-12 prices) Rs. crore Industry 2013-14
2014-15
2015-16 Percentage change over previous year 2014-15 2015-16
Agriculture, forestry & fishing
1,588,237 1,584,293 1,604,044 -0.2 1.2
Mining & quarrying 267,378 296,328 318,377 10.8 7.4 Manufacturing 1,579,721 1,667,069 1,821,926 5.5 9.3 Electricity, gas, water supply & other utility services
200,861 216,970 231,228 8.0 6.6
Construction 818,494 854,636 887,957 4.4 3.9 Trade, hotels, transport, communication and services related to broadcasting
1,669,844 1,833,997 1,998,292 9.8 9.0
Financial, real estate & professional services
1,844,070 2,039,460 2,248,845 10.6 10.3
Public Administration, defence and other services
1,115,765 1,234,737 1,316,522 10.7 6.6
GVA at Basic Price 9,084,369 9,727,490 10,427,191 7.1 7.2 Source: PHD Research Bureau compiled from CSO

BREXIT Impact on Indian Economy
PHD Research Bureau
9
India is not only the fastest moving economy but its economic share in the world GDP is also increasing at a significant pace from 1.77% in the year 2005 to 2.86% in the year 2015. Notwithstanding, the slowdown in the world economy; growth in India remained robust, buoyed by strong investor sentiment and a recent fall in international commodity prices. India posted a higher growth of 7.6% in 2015-16 as compared to 7.3% in 2014-15, 6.9% in 2013-14 and 5.1% in 2012-13. Growth in India is expected to remain5 steady at 8% in 2016-17 on account of continuous pace of economic reforms and a good monsoon scenario. India’s economic resilience has strengthened during the recent times on account of factors such as announcements of big bang FDI reforms and a significant jump in FDI inflows, narrowing current account deficit, declining trade balance due to fall in commodity prices. India’s strong macroeconomic fundamentals and conducive policy measures undertaken by the government in the recent times will help in mitigating the impact of adverse international developments, going forward. India attracted FDI equity inflows at about USD 40 billion during 2015-16 as against USD 30.9 billion during the corresponding period of last year, posting a robust growth of about 29%. The Current Account Deficit (CAD) narrowed to 1.1% of GDP in 2015-16 from 1.3% in 2014-15 is more or less manageable at this juncture. India’s foreign exchange reserves are at about USD 361 billion as on 24th June 2016 as against around USD 355 billion as on 26th June 2015 have been improved significantly. Trade balance has also declined to around (-) USD 118.6 billion during 2015-16 as compared to (-) USD 137.6 billion for 2014-15. The recently announced plethora of economic reforms such as Make in India, digital India and opportunities for start- ups would attract more and more investments, going forward. 3. BREXIT: Retrospective and Prospective
The UK voted by 52% to 48% to leave the European Union after 43 years in an historic referendum. The referendum turnout was 71.8% with more than 30 million people voting and the highest turnout at a UK election since 1992. London and Scotland voted strongly to stay in the EU but the remaining vote has been undermined by poor results in the north of England. Also, Britain is the first country to leave the EU since its formation, but a leave vote will not immediately mean Britain ceases to be a member of the 28-nation bloc.
5 Projections by PHD Research Bureau of PHD Chamber of Commerce and Industry.

BREXIT Impact on Indian Economy
PHD Research Bureau
10
The process of exit could take a minimum of two years and expected to be completed by 2020 - the date of the next scheduled general elections. However, the Prime Minister of Britain will have to decide when to trigger Article 50 of the Lisbon Treaty, which would give the UK two years to negotiate its withdrawal, but once Article 50 has been triggered a country cannot rejoin without the consent of all member states as well as curbs the power of EU judges and limits the free movement of workers, potentially in breach the UK's treaty obligations. Also, the British government will have to negotiate its future trading relationship with the EU and fix trade deals with non-EU countries. Britain is going to lose access of ‘free movements’ to the single market-with which it conducts nearly-half of its’ trade. Unless any agreement comes into being, Britain will have to trade with EU according to the WTO Rules which endow various tariff/non-tariff barriers. Around three million people living in the UK in 2014 were citizens of another EU country. That’s about 5 per cent of the UK population. The figures for 2015 suggest that 1.2 million people born in the UK live in other EU countries.
4. India- United Kingdom bilateral economic relations India and the United Kingdom share close and friendly ties. The bilateral relationship that was upgraded to a strategic partnership during PM’s Narendra Modi’s visit to the UK in November 2015 during which the foundation for enhanced Partnership for the future was laid. The key commercial announcements made during the visit includes in the areas of energy management business for efficient, clean and economical energy, healthcare, financial institutions, pharmaceuticals, MoU to foster joint collaborations on bond and equity issuance, with a strong focus on green infrastructure finance, telecommunication and to deepen research and development exchanges. The India-UK economic engagement was further reinforced by several important initiatives during PM’s visit to UK. It was agreed that the City of London could play an important role in channeling investments into Indian infrastructure projects, leveraging its capital and expertise. Government of India announced its intention to issue the first Government-backed Rupee Bond in London and announced their plans to raise finance through the City of London. The inaugural meeting of the revived India-UK CEO Forum was convened by the two Prime Ministers. Commercial deals worth over £9.3 billion between Indian and British companies were announced. It was decided to establish a fast-track mechanism to
The long awaited referendum of Britain has stated its results of choosing to opt out of the European Union. Although, the formal process of leaving the European Union is supposed to take two years, but the effect on almost all the sectors of the global economy were and will continue to be envisaged for quite a long-term.

BREXIT Impact on Indian Economy
PHD Research Bureau
11
facilitate UK’s investments into India and to set up an India-UK Partnership fund under the National Infrastructure Investment Fund (NIIF) to facilitate global investments through the City of London for Indian infrastructure projects. UK has announced its interest in partnering with India in the development of Smart Cities in Indore, Pune and Amravati. In addition, India and UK have a number of bilateral dialogue mechanisms in place, covering a wide spectrum of areas including political, trade, education, science & technology, defence etc. The significant ones are Economic and Financial Dialogue at Finance Minister-level, Joint Economic & Trade Committee at Commerce Minister-level, Strategic Dialogue at NSA-level, Foreign Office Consultations at Foreign Secretary-level, Defence Consultative Group at Defence Secretary-level, Cyber and Counter-Terrorism Dialogues at Senior Officials-level and other thematic dialogues between the two Foreign Offices.
4.1 Trade Relations
India’s total trade with UK has registered 1.6 fold increase over the past decade. The total trade of India with UK was at about USD 8,989 million in 2005-06, which scaled up to about USD 14,023 million in 2015-16. On the other hand, the share of UK’s trade in India’s total trade has declined from 3.56% in 2005-06 to 2.18% in 2015-16. Trade balance of India with UK has remained favorable for our economy since 2005-06. The trade balance of India’s with UK was at about USD 1128.98 million in 2005-06, which scaled up to USD 3635.68 million in 2015-16.
India – UK bilateral trade vis-a-vis its share in India’s total trade
Year India's exports to
UK (USD
Million)
India's imports from UK
(USD Million)
Trade Balance
(USD Million)
India’s total trade
with UK(USD Million)
Share of UK trade in
India’s total trade (%)
2005-06 5,059.28 3,930.30 1128.98 8989.58 3.56 2006-07 5,622.93 4,177.87 1445.06 9800.8 3.14 2007-08 6,705.50 4,953.68 1751.82 11659.18 2.81 2008-09 6,649.53 5,872.32 777.21 12521.85 2.56 2009-10 6,221.39 4,461.67 1759.72 10683.06 2.29 2010-11 7,284.96 5,396.78 1888.18 12681.74 2.05 2011-12 8,589.93 7,134.30 1455.63 15724.23 1.98 2012-13 8,612.54 6,293.09 2319.45 14905.63 1.88 2013-14 9,779.07 6,045.10 3733.97 15824.17 2.07 2014-15 9,319.73 5,018.28 4301.45 14338.01 1.89 2015-16 8,829.29 5,193.61 3635.68 14022.9 2.18
Source: PHD Research Bureau, compiled from Ministry of Commerce and Industry, Government of India

BREXIT Impact on Indian Economy
PHD Research Bureau
12
4.1.1 India’s top 10 export items to UK India’s main exports to the UK are apparel and clothing accessories, machinery and mechanical appliances, footwear and leather, pharmaceuticals and marine products, Electrical machinery and equipments, manufactures of metals, gems and jewellery, etc. The share of top ten items in India’s total exports to UK stands at 62.08% in 2015-16. Rank Exporting Items 2015-16 (USD
million) % share in total
exports in 2015-16
1 Articles of apparel and clothing accessories, not knitted or crocheted.
905.7 10.26
2 Articles of apparel and clothing accessories, knitted or corcheted.
896.64 10.16
3 Nuclear reactors, boilers, machinery and mechanical appliances; parts thereof.
684.78 7.76
4 Natural or cultured pearls, precious or semiprecious stones, pre.metals,clad with pre.metal and articles of jewellery
539.22 6.11
5 Vehicles other than railway or tramway rolling stock, and parts and accessories thereof.
526.91 5.97
6 Footwear, gaiters and the like; parts of such articles.
476.59 5.40
7 Pharmaceutical products 463.34 5.25 8 Electrical machinery and equipment
and parts thereof; sound recorders and reproducers, television image and sound recorders and reproducers, and parts.
408.99 4.63
9 Articles of iron or steel 291.11 3.30 10 Articles of leather, saddlery and
harness; travel goods, handbags and similar cont.articles of animal gut (other than silk-warm) gut.
288.2 3.26
Sum of exports of top ten items 5481.48 62.08 Source: PHD Research Bureau, compiled from Ministry of Commerce and Industry, Government of India

BREXIT Impact on Indian Economy
PHD Research Bureau
13
4.1.2 India’s top 10 import items from UK The main imports items from the UK to India are precious and semiprecious stones, machinery and mechanical appliances, Electrical machinery and equipments, aluminium, aircrafts parts, plastic products, etc. Further, the share of top ten items in India’s total imports from UK stands at 78.48% in 2015-16. Rank Importing Items 2015-16
USD million % share in total
imports in 2015-16
1 Natural or cultured pearls, precious or semiprecious stones, pre.metals, clad with pre.metal and articles
1,504.97 28.97
2 Nuclear reactors, boilers, machinery and mechanical appliances; parts thereof.
723.74 13.93
3 Iron and steel 398.02 7.66
4 Electrical machinery and equipment and parts thereof; sound recorders and reproducers, television image and sound recorders and reproducers,and parts.
341.34 6.57
5 Optical, photographic cinematographic measuring, checking precision, medical or surgical inst. And apparatus parts and accessories thereof;
266.06 5.12
6 Aluminium and articles thereof. 213.34 4.10 7 Beverages, spirits and vinegar. 204.27 3.93
8 Aircraft, spacecraft, and parts thereof. 170.72 3.28
9 Plastic and articles thereof. 136.22 2.62
10 Vehicles other than railway or tramway rolling stock, and parts and accessories thereof.
117.4 2.26
Sum of imports of top ten items 4076.08 78.48 Source: PHD Research Bureau, compiled from Ministry of Commerce and Industry, Government of India
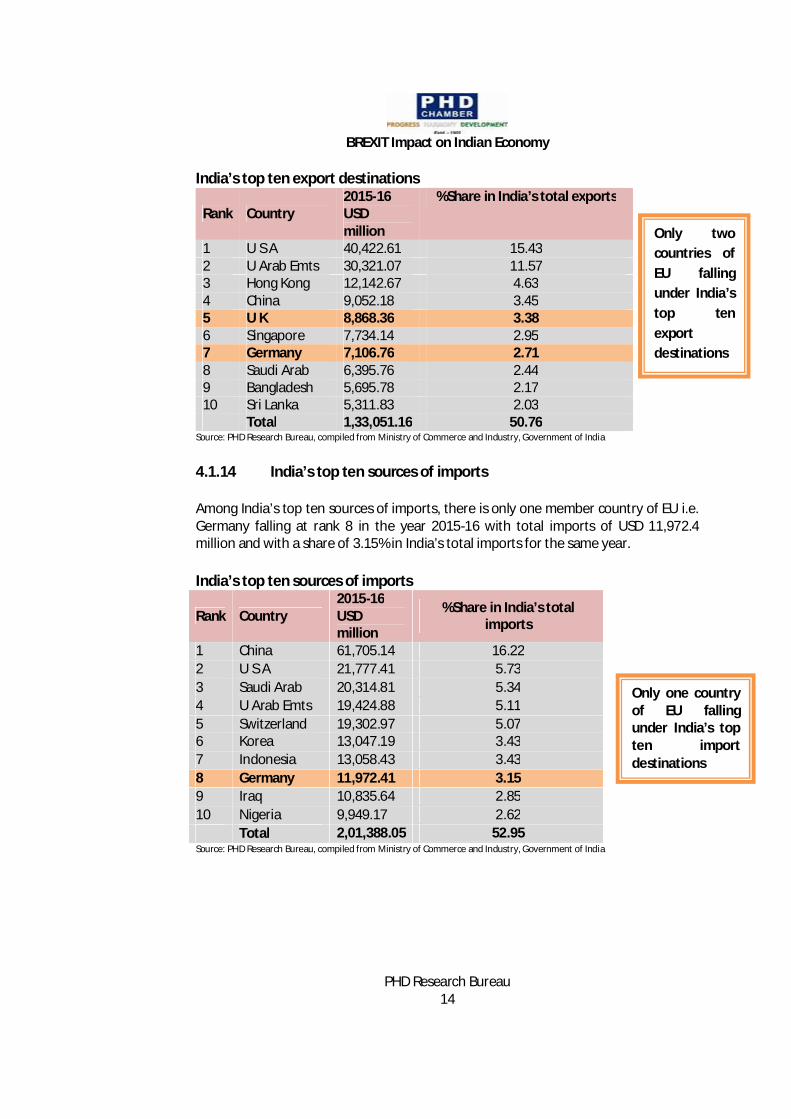
4.1.3 India’s top ten export destinations Amongst India’s leading top ten export destinations, there are only two countries i.e. UK and Germany which stands at rank 5 and 7 respectively in the year 2015-16. In terms of volume and share, India’s total exports to UK stands at about USD 8,868.36 million with a share of 3.38% in India’s total exports and with Germany stands at USD 7,107 million with a share of 2.71% in India’s total exports for the same year.
BREXIT Impact on Indian Economy
PHD Research Bureau
14
India’s top ten export destinations
Rank Country 2015-16 USD million
%Share in India’s total exports
1 U S A 40,422.61 15.43 2 U Arab Emts 30,321.07 11.57 3 Hong Kong 12,142.67 4.63 4 China 9,052.18 3.45 5 U K 8,868.36 3.38 6 Singapore 7,734.14 2.95 7 Germany 7,106.76 2.71 8 Saudi Arab 6,395.76 2.44 9 Bangladesh 5,695.78 2.17 10 Sri Lanka 5,311.83 2.03 Total 1,33,051.16 50.76
Source: PHD Research Bureau, compiled from Ministry of Commerce and Industry, Government of India
4.1.14 India’s top ten sources of imports Among India’s top ten sources of imports, there is only one member country of EU i.e. Germany falling at rank 8 in the year 2015-16 with total imports of USD 11,972.4 million and with a share of 3.15% in India’s total imports for the same year. India’s top ten sources of imports
Rank Country 2015-16 USD million
%Share in India’s total imports
1 China 61,705.14 16.22 2 U S A 21,777.41 5.73 3 Saudi Arab 20,314.81 5.34 4 U Arab Emts 19,424.88 5.11 5 Switzerland 19,302.97 5.07 6 Korea 13,047.19 3.43 7 Indonesia 13,058.43 3.43 8 Germany 11,972.41 3.15 9 Iraq 10,835.64 2.85 10 Nigeria 9,949.17 2.62 Total 2,01,388.05 52.95 Source: PHD Research Bureau, compiled from Ministry of Commerce and Industry, Government of India
Only two countries of EU falling under India’s top ten export destinations
Only one country of EU falling under India’s top ten import destinations

BREXIT Impact on Indian Economy
PHD Research Bureau
15
4.1.5 India’s bilateral trade with UK and EU
The total trade of India’s with UK was at about USD 14905.63 million in 2012-13 with a growth of (-) 5.21%, followed by total trade of USD 15824.17 million in 2013-14 with growth of 6.16%, USD 14338.01 million of total trade in 2014-15 with growth of (-) 9.39% and about USD 14022.9 million of total trade in 2015-16 with growth of (-) 2.2%. While, India’s total trade with EU was at about USD 102696.18 million in 2012-13, with growth of (-) 6.15%, followed by trade of USD 101532.25 million in 2013-14 with growth of (-) 1.13%, USD 98523.09 million of total trade in 2014-15 with growth of (-) 2.96% and about USD 88410.29 million of total trade in 2015-16 with growth of (-) 10.26%.
India’s total trade with UK and EU
Year
India’s total trade with UK
(USD Million)
Growth (Y-O-Y %)
India’s total trade with EU(USD Million)
Growth (Y-O-Y %)
2012-13 14905.63 -5.21 102696.18 -6.15 2013-14 15824.17 6.16 101532.25 -1.13 2014-15 14338.01 -9.39 98523.09 -2.96 2015-16 14022.9 -2.20 88410.29 -10.26
Source: PHD Research Bureau, compiled from Ministry of Commerce and Industry, Government of India
4.1.6 India’s top ten exporting items to the World vis-à-vis UK and EU
The top ten exporting items from India to the world are petroleum products, pearl, precious, semi-precious stones, drug formulations, biologicals, gold and other precious metal jewellery, rmg Cotton including accessories, motor vehicle or cars, products of iron and steel, gold and cotton fabrics, madeups etc. In the basket of top ten exporting items, India is exporting all top ten items to UK. While, with EU, India is exporting all the top ten items with the exception of gold.
Source: PHD Research Bureau, compiled from Ministry of Commerce and Industry, Government of India Note: 1 signifies that India is exporting the commodity and 0 signifies India is not exporting the commodity
Rank Exporting Item United Kingdom European Union 1 Petroleum products 1 1 2 Pearl, Precs, Semiprecs Stones 1 1 3 Drug Formulations, Biologicals 1 1 4 Gold and Other Precs Metal Jewellery 1 1 5 Rmg Cotton Incl Accessories 1 1 6 Motor Vehicle/Cars 1 1 7 Products Of Iron And Steel 1 1 8 Iron And Steel 1 1 9 Gold 1 0 10 Cotton Fabrics, Madeups Etc. 1 1
BREXIT Impact on Indian Economy
PHD Research Bureau
16
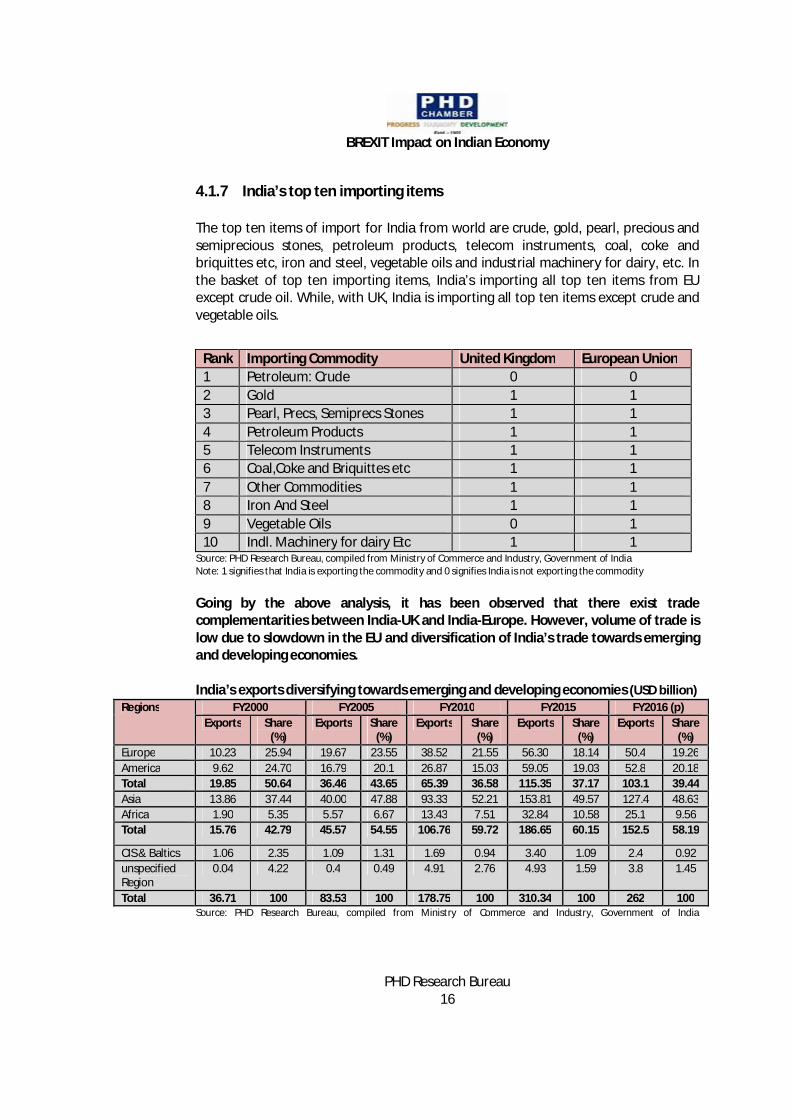
4.1.7 India’s top ten importing items The top ten items of import for India from world are crude, gold, pearl, precious and semiprecious stones, petroleum products, telecom instruments, coal, coke and briquittes etc, iron and steel, vegetable oils and industrial machinery for dairy, etc. In the basket of top ten importing items, India’s importing all top ten items from EU except crude oil. While, with UK, India is importing all top ten items except crude and vegetable oils.
Rank Importing Commodity United Kingdom European Union 1 Petroleum: Crude 0 0 2 Gold 1 1 3 Pearl, Precs, Semiprecs Stones 1 1 4 Petroleum Products 1 1 5 Telecom Instruments 1 1 6 Coal,Coke and Briquittes etc 1 1 7 Other Commodities 1 1 8 Iron And Steel 1 1 9 Vegetable Oils 0 1 10 Indl. Machinery for dairy Etc 1 1
Source: PHD Research Bureau, compiled from Ministry of Commerce and Industry, Government of India Note: 1 signifies that India is exporting the commodity and 0 signifies India is not exporting the commodity Going by the above analysis, it has been observed that there exist trade complementarities between India-UK and India-Europe. However, volume of trade is low due to slowdown in the EU and diversification of India’s trade towards emerging and developing economies. India’s exports diversifying towards emerging and developing economies (USD billion)
Regions FY2000 FY2005 FY2010 FY2015 FY2016 (p) Exports Share
(%) Exports Share
(%) Exports Share
(%) Exports Share
(%) Exports Share
(%) Europe 10.23 25.94 19.67 23.55 38.52 21.55 56.30 18.14 50.4 19.26 America 9.62 24.70 16.79 20.1 26.87 15.03 59.05 19.03 52.8 20.18 Total 19.85 50.64 36.46 43.65 65.39 36.58 115.35 37.17 103.1 39.44 Asia 13.86 37.44 40.00 47.88 93.33 52.21 153.81 49.57 127.4 48.63 Africa 1.90 5.35 5.57 6.67 13.43 7.51 32.84 10.58 25.1 9.56 Total 15.76 42.79 45.57 54.55 106.76 59.72 186.65 60.15 152.5 58.19
CIS & Baltics 1.06 2.35 1.09 1.31 1.69 0.94 3.40 1.09 2.4 0.92 unspecified Region
0.04 4.22 0.4 0.49 4.91 2.76 4.93 1.59 3.8 1.45
Total 36.71 100 83.53 100 178.75 100 310.34 100 262 100 Source: PHD Research Bureau, compiled from Ministry of Commerce and Industry, Government of India

BREXIT Impact on Indian Economy
PHD Research Bureau
17
4.1.8 India-EU: Potential Trade Trajectory Though lot of diversification has taken place in India’s exports from advanced economies of Europe and America towards emerging and developing economies of Asia, Africa and Middle East, EU is still India’s significant trade partner and UK and Germany are among the top ten export destinations of India and Germany is also in India’s top ten sources of imports. The pace of India-EU and India-UK exports and imports will continue and achieving new growth trajectories in the coming times. India-EU trade is expected to touch USD 100 billion in the next two years by FY2018 of which India-UK trade would post a USD 20 billion trade trajectory.
India-EU: Potential Trade Trajectory Year Total Trade
(Values in USD billion) 2011-12 109 2012-13 102 2013-14 101 2014-15 98 2015-16 88 2016-17 95* 2017-18 106*
Source: PHD Research Bureau, compiled from Ministry of Commerce and Industry, Government of India. * PHD Research Bureau projections Though financial markets volatility cannot be ruled out, India’s economic resilience has been strengthened on account of big bang economic reforms undertaken by the Government to boost up investment sentiments in the economy. Economic reforms have increased the resilience of the Indian economy to mitigate the impact of adverse international economic developments 4.2 Investment relations
India and EU share a friendly and cordial investment relationship and have been working in the direction to deepen trade and investment ties. Many European Union member countries have been investing in India over the last many years and entering into several agreements to boost bilateral investments. Presently, India’s Inward FDI equity inflows from Europe are around 14.1% of India’s top ten investing countries in the year 2015-16.
BREXIT Impact on Indian Economy
PHD Research Bureau
18
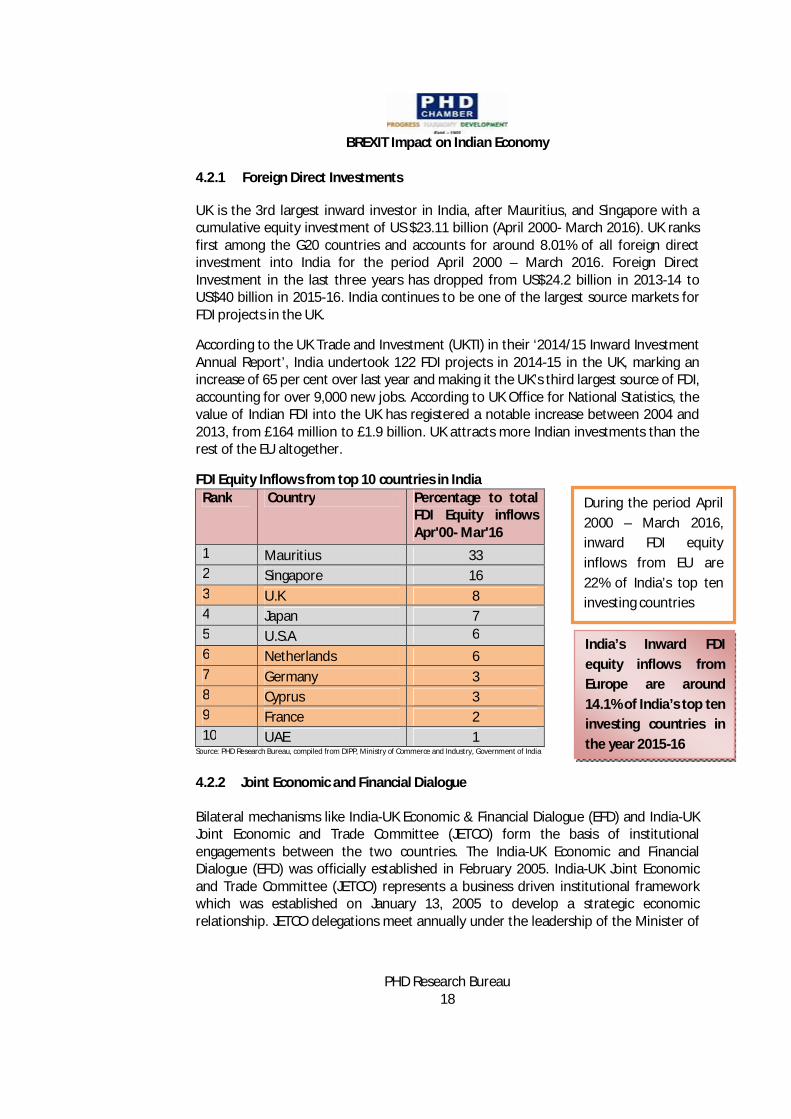
4.2.1 Foreign Direct Investments
UK is the 3rd largest inward investor in India, after Mauritius, and Singapore with a cumulative equity investment of US $23.11 billion (April 2000- March 2016). UK ranks first among the G20 countries and accounts for around 8.01% of all foreign direct investment into India for the period April 2000 – March 2016. Foreign Direct Investment in the last three years has dropped from US$24.2 billion in 2013-14 to US$40 billion in 2015-16. India continues to be one of the largest source markets for FDI projects in the UK.
According to the UK Trade and Investment (UKTI) in their ‘2014/15 Inward Investment Annual Report’, India undertook 122 FDI projects in 2014-15 in the UK, marking an increase of 65 per cent over last year and making it the UK’s third largest source of FDI, accounting for over 9,000 new jobs. According to UK Office for National Statistics, the value of Indian FDI into the UK has registered a notable increase between 2004 and 2013, from £164 million to £1.9 billion. UK attracts more Indian investments than the rest of the EU altogether.
FDI Equity Inflows from top 10 countries in India Rank Country Percentage to total
FDI Equity inflows Apr'00- Mar'16
1 Mauritius 33 2 Singapore 16 3 U.K 8 4 Japan 7 5 U.S.A 6 6 Netherlands 6 7 Germany 3 8 Cyprus 3 9 France 2 10 UAE 1
Source: PHD Research Bureau, compiled from DIPP, Ministry of Commerce and Industry, Government of India
4.2.2 Joint Economic and Financial Dialogue Bilateral mechanisms like India-UK Economic & Financial Dialogue (EFD) and India-UK Joint Economic and Trade Committee (JETCO) form the basis of institutional engagements between the two countries. The India-UK Economic and Financial Dialogue (EFD) was officially established in February 2005. India-UK Joint Economic and Trade Committee (JETCO) represents a business driven institutional framework which was established on January 13, 2005 to develop a strategic economic relationship. JETCO delegations meet annually under the leadership of the Minister of
During the period April 2000 – March 2016, inward FDI equity inflows from EU are 22% of India’s top ten investing countries
India’s Inward FDI equity inflows from Europe are around 14.1% of India’s top ten investing countries in the year 2015-16

BREXIT Impact on Indian Economy
PHD Research Bureau
19
Commerce and Industry (CIM) and the Secretary of State for Business, Innovation and Skills (BIS), alternately in Delhi and London. The 10th JETCO meeting was held on January 19, 2015 in London which witnessed both industry and Government stakeholders coming together for productive discussions in three Working Groups constituted on the themes of Education & Skill Development, Smart Cities and Technological Collaboration, Advanced Manufacturing and Engineering.
5. Impact of BREXIT on India
1. Economy- In the wake of current developments in the world economy such as BREXIT, India’s economic resilience has strengthened during the recent times on account of factors such as announcements of big bang FDI reforms and a significant jump in FDI inflows, narrowing current account deficit, declining trade balance due to fall in commodity prices and several measures undertaken by the Government to boost up investments sentiments in the economy. Therefore, India’s strong macroeconomic fundamentals and conducive policy measures undertaken by the government in the recent times will help in mitigating the impact of adverse international developments.
2. Trade - At present, India’s trade with Britain stands at around US$ 14 billion.
Britain’s exit could also mean Britain and EU could compete for trading with India and enter into long term relationships with increased growth of trade.
3. Trade Creation for Indian Businesses- India’s export to the UK is expected to
increase as there may be trade diversion in favour of India from other (remaining) EU countries. Similarly, India’s import from the UK is expected to increase as there may be more incentive to British exporters to further explore the Indian market. Overall, there exits opportunities of trade creation for India due to possibility of decreasing intra regional trade among the EU countries.
4. Bilateral Trade and Investment Agreements- It is expected that the EU will
take a more favourable look to complete its negotiations with India to conclude the EU-India Bilateral Trade and Investment Agreement (BTIA).
5. Services- With the enhancement of bilateral trade in services, there could be generation of employment opportunities for skilled and unskilled workforce in the services sector in merchanting, other trade related services between related enterprises, professional, management consulting and R&D services. India-UK bilateral trade in services6 is approx. £2.5 billion - £3 billion in the recent years.
6 Trade in Services excludes travel, transport and banking

BREXIT Impact on Indian Economy
PHD Research Bureau
20
6. Investment and Capital Flows-The investment inflows from EU to India will continue and are also not expected to be impacted by the BREXIT vis-a-vis India’s growth resilience and promising potential growth trajectory. On account of BREXIT and expected depreciation of the British Pound, in future, Indian investors in the UK may get more favourable investment opportunities. The British investors may like to divert their investment to India and other such countries where they expect to get better returns. Overall, there could be investment creation for India and strengthening of the capital markets of both the nations. Further, BREXIT may result in slowdown in real estate prices and with a depreciating Pound; the UK will provide longer term investment opportunities in the real estate sector to India.
7. Migration and employment opportunities- With BREXIT, the UK will no longer
be obliged to offer quota-based jobs to the citizens of the EU countries. This might open up the market for skilled and semi-skilled labour for Indian migrants, including temporary workers, in the UK.
8. Tourism- In response to Brexit's impacts, travelling to the UK will become
cheaper, facilitating increase in tourist movements and educational travel with the big drop in the value of the Pound, and then we could see a surge in leisure tourism to Britain, as travelling may become cheaper.
9. Financial Market- The impact of BREXIT on financial markets was short lived due to strong macroeconomic fundamentals of the Indian economy and markets have regained their stability in due course of time.
10. Currency- The fluctuations in currency markets will be for a shorter period on account of India’s decent FOREX reserves position and strong policy measures taken by the central bank in the recent times. However, volatility in the currency markets cannot be ruled out as and when the negotiation of the UK breakout from EU progresses.
To sum up, BREXIT will not have much impact on Indian economy primarily because India is run by domestic demand and supply; although a few effects, both positive and negative can be envisaged in some industries individually.
BREXIT Impact on the United Kingdom and European Union will be felt though decreased intra-regional trade decreased FDI inflows and outflows, change in Industrial policy, tightened immigration, trade disputes, decreased international influence and decreased budget.
On breakout of UK from EU, there might have a little impact on trading scenario of top trade partners of EU countries. Further, it may also impact trading scenario of these trading partners with other economies of the world.

BREXIT Impact on Indian Economy
PHD Research Bureau
21
BREXIT Impact on the United Kingdom and European Union S.No Variables Impact on United Kingdom Impact on European Union
1 Intra-regional
trade With growing regulatory divergence, the cost of trade will increase impacting trade volumes and the UK place in supply chains.
EU trade matters more for the UK than UK trade for the EU. The UK accounts for just one sixth of the EU economy and only one-tenth of EU exports are to the UK, whereas half of UK exports are to the EU. However, the imbalance in the trade relationship is such that the UK is an important source of demand for the rest of the EU.
2 Foreign direct investment
The UK will become unattractive as a gateway to Europe, as a base for corporate HQs and as a location for investment from Europe
With BREXIT, the businesses will find it costly to relocate investment from the UK
3 Liberalization and regulation
The UK will lose influence over EU regulation without gaining much freedom to regulate independently.
The balance in the European Council may shifts away from liberalization and it becomes harder to form a blocking minority against illiberal measures.
4 Industrial policy
The UK will gain flexibility over industrial policy, but will lose the benefits from scale and influence in some areas.
There could be a weakening of competition policy, looser collaboration in education and research and public procurement
5 Immigration Immigration will be tightened, damaging competitiveness, particularly of London.
Some countries will be affected by the impact on remittances or diverted migration, with the extent of political contagion a big challenge.
6 Financial services
The UK has a strong competitive edge, but will lose business as it becomes harder to provide certain services to EU markets.
One or two financial centres may benefit, but businesses and households will suffer from the loss of liquidity and increased cost of financial services
7 Trade policy The UK has less leverage, is a lower priority partner in trade negotiations and will find it harder to resolve trade disputes.
The EU is a less attractive trade partner without the UK in the deal and loses a member state that may put its political weight behind negotiations.
8 International influence
The UK loses the benefit from being able to influence both in and through the EU, impacting on economic and foreign policy interests
The EU loses substantial soft and hard power assets, but may be able to act more coherently externally and in international institutions

BREXIT Impact on Indian Economy
PHD Research Bureau
22
9 Budget The UK gains financially, but how much depends on variation in the net impact across the UK regions
The EU loses a budget participant and a major net contributor, with the gap needing to be filled by higher contributions or less spending
10 Uncertainty BREXIT is a protracted process lasting several years with uncertainty over the endpoint, impacting on businesses
Uncertainty is bad for business in the EU, but there could be risk of domino effect of BREXIT on remaining EU countries
Source: PHD Research Bureau, Compiled from various sources, June 2016
EU’s top trading partners
EU’s top ten exporting partners are USA, China, Switzerland, Turkey, Russia, Japan, Norway, UAE, South Korea and Saudi Arabia. The top ten exporting destinations of EU contribute exports of about Euro 10,87,692 million in 2015 and about 61% share in EU’s total exports. While, EU’s top ten importing partners are China, USA, Russia, Switzerland, Norway, Turkey, Japan, South Korea, India and Brazil. The top ten importing partners of EU contributes imports of nearly Euro 11,45,392 million and 66.3% share in EU’s total imports in 2015. India’s stands at ninth rank in EU’s sources of imports in 2015 contributing 2.3% share in EU’s total imports. EU’s top trading partners (2015)
EU’s top 10 exporting partners EU’s top ten sources of imports Rank
EU exporting destinations
EU’s exports (euro million)
% share in EU’s total exports
EU sources of imports
EU’s imports (euro million)
% share in EU’s total imports
1 USA 371,223 20.7 China 350,424 20.3 2 China 170,484 9.5 USA 248,437 14.4 3 Switzerland 150,875 8.4 Russia 135,711 7.9 4 Turkey 79,107 4.4 Switzerland 102,323 5.9 5 Russia 73,911 4.1 Norway 74,260 4.3 6 Japan 56,550 3.2 Turkey 61,607 3.6 7 Norway 48,869 2.7 Japan 59,768 3.5 8 UAE 48,512 2.7 South Korea 42,347 2.5 9 South Korea 47,901 2.7 India 39,448 2.3 10 Saudi Arabia 40,260 2.2 Brazil 31,067 1.8 Total Exports 10,87,692 60.7 Total imports 11,45,392 66.3 Source: PHD Research Bureau compiled from EUROSTAT, European Commission, UAE stands for United Arab Emirates. Also, as the EU is China's largest trading partner, a slowdown in the EU's economy will hamper China's growth and it will be hit by the risk-off sentiment which is apparent from the total trade figures (Table below) wherein trade has become stagnant in the year 2015.

BREXIT Impact on Indian Economy
PHD Research Bureau
23
Bilateral trade between United Kingdom and China (USD billion) Category
2006 2007 2008 2009 2010 2011 2012 2013 2014 2015
UK exports to China
6.03 7.58 9.07 8.05 11.29 14.09 15.69 18.12 26.24 27.62
UK imports from China
41.83 53.23 58.22 52.10 61.73 66.04 56.27 57.59 64.15 62.98
Total Trade
47.86 60.81 67.29 60.15 73.03 80.13 71.96 75.71 90.38 90.60
Source: PHD Research Bureau, compiled from ITC
In a nutshell, India stands at rank 9th in EU’s top ten sources of imports, while China is the largest sources of imports for EU and second largest exports destination. Therefore, India’s trade may not feel the major impact on account of BREXIT. 6. Conclusions Global recovery is continuing, but at a slowing and increasingly fragile pace. The slow pace of recovery is coupled with global asset market volatility, upliftment of growth momentum in the advanced economies, and continuing headwinds for emerging market economies and lower-income countries. Therefore, as per IMF7, global growth is projected to remain strong in 2016, at 3.2%, while in advanced and emerging market and developed economies at 1.9% and 4.1% respectively. India is not only the fastest moving economy but its economic share in the world GDP is also increasing at a significant pace from 1.77% in the year 2005 to 2.86% in the year 2015. Notwithstanding, the slowdown in the world economy; growth in India remained robust, buoyed by strong investor sentiment and a recent fall in international commodity prices. India posted a higher growth of 7.6% in 2015-16 as compared to 7.3% in 2014-15, 6.9% in 2013-14 and 5.1% in 2012-13. Growth in India is expected to remain8 steady at 8% in 2016-17 on account of continuous pace of economic reforms and a good monsoon scenario. The long awaited referendum of Britain has stated its results of choosing to opt out of the European Union. Although, the formal process of leaving the European Union is supposed to take two years, but the effect on almost all the sectors of the global economy were and will continue to be envisaged for quite a long-term. Britain's exit from European Union would result in several economic and financial implications not only for European Union or advanced economies, emerging and developing economies but for the entire world economy. The BREXIT has already resulted in financial markets
7 IMF, World Economic Outlook Database, April 2016 8 Projections by PHD Research Bureau of PHD Chamber of Commerce and Industry.

BREXIT Impact on Indian Economy
PHD Research Bureau
24
volatility across the world and could also spur a number of other risks through various trade, finance and confidence channels. The weakness in European economy could also hurt world exports as weakening European currencies might put renewed downward pressure on major exporting countries. Therefore, at this juncture, the present World situation will largely depend on the kind of trade deal Britain negotiates with the EU along with no big reductions in its access to the single market. India’s total trade with UK stands at about USD 14,023 million in 2015-16. While, India’s total trade with EU stands at about USD 88410.29 million of total trade in 2015-16. There is no significant impact of the BREXIT is seen on any sector of the Indian Economy. Though, lot of diversification has taken place in India’s exports from advanced economies of Europe and America towards emerging and developing economies of Asia, Africa and Middle East, EU is still India’s significant trade partner and UK and Germany are among the top ten export destinations of India and Germany is also in India’s top ten sources of imports. The pace of India-EU and India-UK exports and imports will continue and achieving new growth trajectories in the coming times. India-EU trade is expected to touch USD 100 billion in the next two years by FY2018 of which India-UK trade would post a USD 20 billion trade trajectory. Despite adverse international economic developments during the last eight years, India is not only the fastest moving economy but its economic share in the world GDP is also increasing at a significant pace from 1.77% in the year 2005 to 2.86% in the year 2015. Notwithstanding, the slowdown in the world economy; growth in India remained robust, buoyed by strong investor sentiment and a recent fall in international commodity prices. India posted a higher growth of 7.6% in 2015-16 as compared to 7.3% in 2014-15, 6.9% in 2013-14 and 5.1% in 2012-13. Growth in India is expected to remain9 steady at 8% in 2016-17 on account of continuous pace of economic reforms and a good monsoon scenario. The top ten exporting items from India to the world are petroleum products, pearl, precious, semi-precious stones, drug formulations, biologicals, gold and other precious metal jewellery, rmg Cotton including accessories, motor vehicle or cars, products of iron and steel, gold and cotton fabrics, madeups etc. In the basket of top ten exporting items, India is exporting all top ten items to UK. While, with EU, India is exporting all the top ten items with the exception of gold. The top ten items of import for India from world are crude, gold, pearl, precious and semiprecious stones, petroleum products, telecom instruments, coal, coke and briquittes etc, iron and steel, vegetable oils and industrial machinery for dairy, etc. In
9 Projections by PHD Research Bureau of PHD Chamber of Commerce and Industry.

BREXIT Impact on Indian Economy
PHD Research Bureau
25
the basket of top ten importing items, India’s importing all top ten items from EU except crude oil. While, with UK, India is importing all top ten items except crude and vegetable oils. It has been observed that there exist trade complementarities between India-UK and India-Europe. However, volume of trade is low due to slowdown in the EU and diversification of India’s trade towards emerging and developing economies. Though financial markets volatility cannot be ruled out, India’s economic resilience has been strengthened on account of big bang economic reforms undertaken by the Government to boost up investment sentiments in the economy. At investment front, the inward FDI equity inflows from Europe are around 14.1% of India’s top ten investing countries in the year 2015-16. The investment inflows from EU to India will remain steady as India’s growth trajectory would remain promising in the coming times At present, India’s trade with Britain stands at around US$ 14 billion. Britain’s exit could also mean Britain and EU could compete for trading with India and enter into long term relationships with increased growth of trade. Further, it is expected that the EU will take a more favourable look to complete its negotiations with India to conclude the EU-India Bilateral Trade and Investment Agreement (BTIA). With BREXIT, the UK will no longer be obliged to offer quota-based jobs to the citizens of the EU countries. This might open up the market for skilled and semi-skilled labour for Indian migrants, including temporary workers, in the UK. In response to Brexit's impacts, travelling to the UK will become cheaper, facilitating increase in tourist movements and educational travel with the big drop in the value of the Pound, and then we could see a surge in leisure tourism to Britain, as travelling may become cheaper. The impact of BREXIT on financial markets was short lived due to strong macroeconomic fundamentals of the Indian economy and markets have regained their stability in due course of time. The fluctuations in currency markets will be for a shorter period on account of India’s decent FOREX reserves position and strong policy measures taken by the central bank in the recent times. However, volatility in the currency markets cannot be ruled out as and when the negotiation of the UK breakout from EU progresses. To sum up, BREXIT will not have much impact on Indian economy primarily because India is run by domestic demand and supply; although a few effects, both positive and negative can be envisaged in some industries individually. Further, the recently announced plethora of economic reforms such as Make in India, digital India and opportunities for start-ups would attract more and more investments, going forward.

BREXIT Impact on Indian Economy
PHD Research Bureau
26
Annexure-I
India: Statistical snapshot
Indicators FY12 FY13 FY14 FY15 FY16 FY17 GDP at FC - Constant prices (Rs cr) 8736039 9226879 9839434 10552151 11350249 - GDP at FC-Constant prices growth YOY (%) 6.7 5.6 6.6 7.2* 7.6* - Agriculture growth 5.0 1.5 4.2 (-)0.2* 1.2* - Industry growth 7.8 3.6 5 5.9* 7.4* - Services growth 6.6 8.1 7.8 10.3* 8.9* - Consumption (% YOY) 8.9 5.2 4.7 - - - Private consumption (% YOY) 9.3 5.5 6.8 6.2 7.4 - Gross domestic savings as % of GDP 31.4 30.1 30.5 30.6”’ - - Gross Fixed Capital Formation as % of GDP 34.3 34.1 33 32.3 31.2 - Gross fiscal deficit of the Centre as a % GDP 5.7 4.9 4.5 4.1’’ 3.9 3.5*@ Gross fiscal deficit of the states as a % GDP 1.9 1.9 2.5 2.3’’ - - Gross fiscal deficit of Centre & states as a % GDP 8.1 7.2 6.7 6.6’’ - - Merchandise exports (US$Bn) 305.7 300.2 312.35 310.5 261.14 22.1^^^^ Growth in exports 21.9 -1.8 3.98 (-)1.2 (-)15.9 (-)0.79^^^^ Imports (US$Bn) 489.1 490.3 450.94 447.5 379.59 28.4^^^^ Growth in imports (YOY) 32.4 0.2 -8.1 -0.59 (-)15.3 (-)13.2^^^^ Trade deficit (US$Bn) 183.4 190.1 138.6 137 118.46 6.3^^^^ Net invisibles US$Bn 111.6 107.5 115.0 - 107.9^^ - Current account deficit US$Bn 78.2 88.2 32.4 26.8^^ 22.1^^ - Current account deficit as % of GDP 4.2 4.8 1.7 1.3 1.1^^ - Net capital account US$Bn 67.8 94.2 33.3^^ 11.8 - - Overall balance of payments US$Bn 12.8 3.8 15.5^^ 6.9 - - Foreign exchange reserves US$Bn 294.9 292.04 304.22 316.2 355.56~~ 363.2~~~ External debt - Short term US$Bn 78.2 96.7 89.2`` 86.4`` ̀ 83.6&&& - External debt - Long term US$Bn 267.5 293.4 351.4`` 376.4``` 398.6&&& - External debt - US$Bn 345.8 392.1 441`` 462``` 480.18&&& - Money supply growth 13.5 13.6 13.2 11.1&& 11.3&&&& 10.4&&&& Bank credit growth 16.8 13.5 14 8.6 9~~~~ 8.4^^^^ WPI inflation 8.9 7.4 5.7# 2.1 (-
)0.85^^^ 0.79^^^^
CPI inflation 6.0 10.2 9.8 6.4 4.83^^^ 5.76^^^^ Exchange rate Rs/US$ annual average 47.9 54.4 60.68 61.14 66.43@@ 67.41@@@
Source: PHD Research Bureau compiled from various sources, *Data pertains to Provisional Estimates of National Income 2015-16 from MOSPI, ‘’ Handbook of Statistics of Indian Economy 2014-15 from RBI, ‘’’ Data pertains to Annual Report of RBI 2013-14, *@Data pertains to Budget Estimates of 2016-17, **’’ Data pertains to GVA at Basic Prices at constant prices for Q3 2015-16, ”’Data pertains to the new Series Estimates from economic survey 2014-15, ** Data pertains to Provisional estimates of National income, 2014-15, MOSPI, ***Data pertains to Q2 2014-15. ^^Data pertains to India’s Balance of payment for 2015-16 from RBI, ^^^Data pertains to March 2016, ``India’s external debt end Dec 2013 from RBI, `` ̀Data pertains to end Dec 2014 from RBI, # Data pertains to Mar 2013, ~ Data pertains to 2014-15 from the Economic Survey, ~~Data as on week ending 25th March 2016 from RBI, ~~~ Data as on week ending 10th June 2016 from RBI, ~~~~Data pertains to March 2016 & Projections from RBI for FY2016 from October 2015 RBI Bulletin, && Data pertains to March 2015, &&& External debt at end December 2015 (Quick Estimates), @@ Data pertains to 13th April 2016 from RBI, @@@Data pertains to February 2015, #Data pertains to November 2014, ^^^^Data pertains to May 2016, @@@ Data as on 20th June 2016 from RBI, &&&& Y-o-Y Growth of Money Supply, 2015-16 from RBI,

BREXIT Impact on Indian Economy
PHD Research Bureau
27
Key economic and fiscal indicators of select world economies
Country GDP
(Billion) GDP growth
(YOY) Int Rate (%) Infl Rate
(%) Jobless rate Govt. Budget Debt/GDP Current
Account United States 17419 2.10% 0.50% 1.00% 4.70% -2.50% 104.17% -2.7 Euro Area 13410 1.70% 0.00% 0.10% 10.20% -2.10% 90.70% 3.7 China 10355 6.70% 4.35% 2.00% 4.04% -2.30% 43.90% 2.7 Japan 4601 0.10% -0.10% -0.30% 3.20% -6.00% 229.20% 2.9 Germany 3868 1.30% 0.00% 0.30% 6.10% 0.70% 71.20% 8.8 United Kingdom 2989 2.00% 0.50% 0.30% 5.00% -4.40% 89.20% -5.2 France 2829 1.30% 0.00% 0.20% 10.20% -3.60% 96.10% -1.4 Brazil 2417 -5.40% 14.25% 9.32% 11.20% -10.30% 66.23% -3.32
Italy 2141 1.00% 0.00% -0.40% 11.70% -2.60% 132.70% 2.2
India 2067 7.90% 6.50% 5.76% 4.90% -3.90% 67.20% -1.25
Russia 1861 -1.20% 10.50% 7.30% 5.60% -2.40% 17.92% 3.1
Canada 1785 1.10% 0.50% 1.50% 6.90% 0.10% 91.50% -3.3
Australia 1455 3.10% 1.75% 1.30% 5.70% -2.40% 36.80% -4.6
South Korea 1410 2.80% 1.25% 0.80% 3.70% -3.00% 35.12% 7.7
Spain 1381 3.40% 0.00% -0.80% 21.00% -5.10% 99.20% 1.5
Mexico 1295 2.60% 3.75% 2.60% 4.00% -3.50% 43.20% -2.8
Indonesia 889 4.92% 6.50% 3.33% 5.50% -2.53% 27.00% -2.06
Netherlands 870 1.50% 0.00% 0.00% 6.30% -1.80% 65.10% 9.1
Turkey 798 4.80% 7.50% 6.58% 10.10% -1.20% 32.90% -4.5
Saudi Arabia 746 3.60% 2.00% 4.10% 5.60% -2.30% 1.60% -8.2
Switzerland 701 0.70% -0.75% -0.40% 3.30% 0.00% 34.40% 11
Sweden 571 4.20% -0.50% 0.60% 7.60% 0.00% 43.40% 5.4
Poland 545 3.00% 1.50% -0.90% 9.10% -2.60% 51.30% -0.2
Belgium 532 1.50% 0.00% 2.16% 8.70% -2.60% 106.00% 1.6
Taiwan 524 -0.68% 1.38% 1.24% 3.96% -1.50% 31.70% 14.5
Venezuela 510 -7.10% 21.07% 180.90% 7.30% -11.50% 49.80% 1.4
Norway 500 0.70% 0.50% 3.40% 4.60% 5.70% 31.70% 9
Austria 436 1.60% 0.00% 0.60% 8.60% -1.20% 86.20% 2.6
Thailand 405 3.20% 1.50% 0.46% 1.04% -2.50% 44.40% 3.8 United Arab Emirates 399 3.90% 1.25% 1.60% 4.20% 5.00% 15.68% 5.8
South Africa 350 -0.20% 7.00% 6.10% 26.70% -4.20% 50.10% -4.4
Denmark 342 0.30% -0.65% 0.10% 4.30% -2.10% 40.20% 7.1
Malaysia 338 4.20% 3.25% 2.00% 3.60% -3.20% 54.00% 3
Singapore 308 1.80% 0.23% -1.60% 1.90% -1.20% 104.70% 19.7
Hong Kong 291 0.80% 0.75% 2.60% 3.40% 1.30% 32.00% 3.1
Finland 272 1.60% 0.00% 0.30% 10.80% -2.70% 63.10% 0
Ireland 251 9.20% 0.00% 0.00% 7.80% -2.30% 93.80% 4.9 Greece 236 -1.30% 0.00% -0.90% 24.14% -7.20% 176.90% -1.8 Portugal 230 0.90% 0.00% 0.30% 12.40% -4.40% 129.00% 0.7
Source: PHD Research Bureau, compiled from various sources. Note: CAB stands for Current Account Balance, Int stands for Interest Rate, Infl stands for Inflation rate, Unemp stands for employment rate
BREXIT Impact on Indian Economy
PHD Research Bureau
28
Study/Project Team
Dr. S P Sharma Chief Economist & Director of Research
Ms. Rashmi Singh Ms. Surbhi Sharma Associate Economist Sr. Research Officer
Disclaimer “BREXIT Impact on Indian Economy” is prepared by PHD Chamber of Commerce and Industry to provide a broad view of global level developments. This paper may not be reproduced, wholly or partly in any material form, or modified, without prior approval from the Chamber. It may be noted that this paper is for guidance and information purposes only. Though due care has been taken to ensure accuracy of information to the best of the PHD Chamber’s knowledge and belief, it is strongly recommended that readers should seek specific professional advice before taking any decisions. Please note that the PHD Chamber of Commerce and Industry does not take any responsibility for outcome of decisions taken as a result of relying on the content of this paper. PHD Chamber of Commerce and Industry shall in no way, be liable for any direct or indirect damages that may arise due to any act or omission on the part of the reader or user due to any reliance placed or guidance taken from any portion of this publication. Copyright 2016 PHD Chamber of Commerce and Industry ALL RIGHTS RESERVED. No part of this publication including the cover, shall be reproduced, stored in a retrieval system, or transmitted by any means, electronic, mechanical, photocopying, recording or otherwise, without the prior written permission of, and acknowledgement of the publisher (PHD Chamber of Commerce and Industry).

BREXIT Impact on Indian Economy
PHD Research Bureau
29
PHD Research Bureau
PHD Research Bureau; the research arm of the PHD Chamber of Commerce and Industry was constituted in 2010 with the objective to review the economic situation and policy developments at sub-national, national and international levels and comment on them in order to update the members from time to time, to present suitable memoranda to the government as and when required, to prepare State Profiles and to conduct thematic research studies on various socio-economic and business developments
The Research Bureau has been instrumental in forecasting various lead economic indicators national and sub-national. Many of its research reports have been widely covered by media and leading business newspapers.
Research Activities Comments on Economic Developments
Newsletters Consultancy
Research Studies Macro Economy
Economic Affairs
Newsletter (EAC)
Trade & Inv. Facilitation Services (TIFS)
Research Projects
States Development
Economic & Business Outlook (EBO)
Business Research Consultancy
Research Proposals Infrastructure Global Economic
Monitor (GEM) Forex Helpline
State Profiles Foreign exchange market Forex Newsletter
Investment Advisory Services
Impact Assessments
International Trade
Trade & Inv. Facilitation Services (TIFS)
Thematic Research Reports
Global Economy State Development Monitor (SDM)
Releases on Economic Developments

BREXIT Impact on Indian Economy
PHD Research Bureau
30
Team, PHD Research Bureau
Dr. S P Sharma Chief Economist & Director of Research
Email id: [email protected]
Macro Economic
Developments & Policy Environment
Global Economic Developments & India’s
International Trade
Banking, Taxation & Financial Markets
Ms. Megha Kaul Associate Economist
Ms. Smriti Sharma Research Assistant
Ms. Rashmi Singh Associate Economist
Ms. Kanika Krishnani Research Trainee
Ms. Surbhi Sharma Sr. Research Officer
Secretarial Assistant Ms. Sunita Gosain

BREXIT Impact on Indian Economy
PHD Research Bureau
31
Studies Undertaken by PHD Research Bureau A: Thematic research reports 1. Comparative study on power situation in Northern and Central states of India (September 2011) 2. Economic Analysis of State (October 2011) 3. Growth Prospects of the Indian Economy, Vision 2021 (December 2011) 4. Budget 2012-13: Move Towards Consolidation (March 2012) 5. Emerging Trends in Exchange Rate Volatility (Apr 2012) 6. The Indian Direct Selling Industry Annual Survey 2010-11 (May 2012) 7. Global Economic Challenges: Implications for India (May 2012) 8. India Agronomics: An Agriculture Economy Update (August 2012) 9. Reforms to Push Growth on High Road (September 2012) 10. The Indian Direct Selling Industry Annual Survey 2011-12: Beating Slowdown (March 2013) 11. Budget 2013-14: Moving on reforms (March 2013) 12. India- Africa Promise Diverse Opportunities (November 2013) 13. India- Africa Promise Diverse Opportunities: Suggestions Report (November 2013) 14. Annual survey of Indian Direct Selling Industry-2012-13 (December 2013) 15. Imperatives for Double Digit Growth (December 2013) 16. Women Safety in Delhi: Issues and Challenges to Employment (March 2014) 17. Emerging Contours in the MSME sector of Uttarakhand (April 2014) 18. Roadmap for New Government (May 2014) 19. Youth Economics (May 2014) 20. Economy on the Eve of Union Budget 2014-15 (July 2014) 21. Budget 2014-15: Promise of Progress (July 2014) 22. Agronomics 2014: Impact on economic growth and inflation (August 2014) 23. 100 Days of new Government (September 2014) 24. Make in India: Bolstering Manufacturing Sector (October 2014) 25. The Indian Direct Selling Industry Annual Survey 2013-14 (November 2014) 26. Participated in a survey to audit SEZs in India with CAG Office of India (November 2014) 27. Role of MSMEs in Make in India with reference to Ease of Doing Business in Ghaziabad (Nov 2014) 28. Exploring Prospects for Make in India and Made in India: A Study (January 2015) 29. SEZs in India: Criss-Cross Concerns (February 2015) 30. Socio-Economic Impact of Check Dams in Sikar District of Rajasthan (February 2015) 31. India - USA Economic Relations (February 2015) 32. Economy on the Eve of Union Budget 2015-16 (February 2015) 33. Budget Analysis (2015-16) 34. Druzhba-Dosti: India's Trade Opportunities with Russia (April 2015) 35. Impact of Labour Reforms on Industry in Rajasthan: A survey study (July 2015) 36. Progress of Make in India (September 2015) 37. Grown Diamonds, A Sunrise Industry in India: Prospects for Economic Growth (November 2015) 38. Annual survey of Indian Direct Selling Industry 2014-15 (December 2015) 39. India’s Foreign Trade Policy Environment Past, Present and Future (December 2015) 40. Revisiting the emerging economic powers as drivers in promoting global economic growth (February 2016) 41. Bolstering MSMEs for Make in India with special focus on CSR (March 2016) B: State profiles 42. Rajasthan: The State Profile (April 2011) 43. Uttarakhand: The State Profile (June 2011) 44. Punjab : The State Profile (November 2011) 45. J&K: The State Profile (December 2011) 46. Uttar Pradesh: The State Profile (December 2011) 47. Bihar: The State Profile (June 2012) 48. Himachal Pradesh: The State Profile (June 2012) 49. Madhya Pradesh: The State Profile (August 2012) 50. Resurgent Bihar (April 2013) 51. Life ahead for Uttarakhand (August 2013) 52. Punjab: The State Profile (February 2014) 53. Haryana: Bolstering Industrialization (May 2015) 54. Progressive Uttar Pradesh: Building Uttar Pradesh of Tomorrow (August 2015) 55. Suggestions for Progressive Uttar Pradesh (August 2015)

BREXIT Impact on Indian Economy
PHD Research Bureau
32