bree.gov.au economic outlook for australian resources: prices, investments and volumes professor...
TRANSCRIPT

bree.gov.au
Economic Outlook for Australian Resources:
Prices, Investments and Volumes
Professor Quentin GraftonExecutive Director/Chief Economist
Bureau of Resources and Energy Economics (BREE)
Presentation to AMEC4 September 2012

bree.gov.au
Overview
1. The ‘Big Picture’2. Price Trends3. Investment Trends- CAPEX- Exploration- Major Mining projects- Investment Futures4. Volume Trends
bree.gov.au
1. The Big Picture

bree.gov.au
Terms of Trade
Source: BREE; RBA
bree.gov.au
2. Price Trends
bree.gov.au
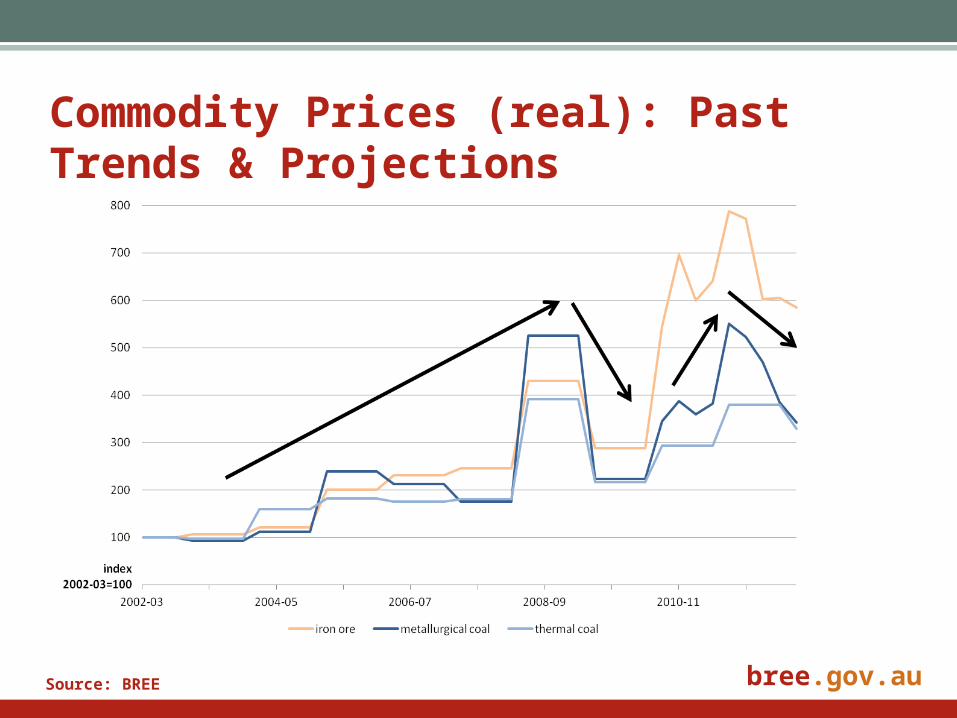
Commodity Prices (real): Past Trends & Projections
Source: BREE

bree.gov.au
Index of weekly metals prices (1)

bree.gov.au
Index of weekly metals prices (2)

bree.gov.au
Key Messages
• With some exceptions, most resource
prices have peaked (2011) and expected
to decline relative to these highs.
• Notwithstanding current market
uncertainties (Euro hangover) ‘downs
and ups’, price reductions likely to be
substantial in longer term due to large
supply responses from Australian
competitors.
bree.gov.au
3. Investment Trends
bree.gov.au
Factors Affecting Investment• Factors common to investment decision across the economy:
• Macroeconomic conditions (interest rates, exchange rate, etc.)
• Government policies
• Factors specific to the mining sector or commodity:• probability of discovering an economic mineral deposit
or extending the resource base of a known deposit; • current and expected future prices; • mining and processing technologies; and • input costs

bree.gov.au
CAPEX investment activity in Australia(Real, deflated by CPI)
Source: BREE; ABS
100
200
300
400
500
600
700
800
1966-67 1971-72 1976-77 1981-82 1986-87 1991-92 1996-97 2001-02 2006-07 2011-12
Index2002-03=100
Total Non-mining Mining

bree.gov.au
Australia: Annual capital expenditure of private enterprises
Source: BREE; ABS
2007–08 2008–09 2009–10 2010–11 2011–12 1991-92 to 2001-2002
2001-02 to 2010-11
At 2011-12 prices $m $m $m $m $m $m $m
Gross fixed capital formation 372,505 377,044 373,630 378,067 - 204,088 325,578
Mining 48,961 56,556 51,898 64,813 - 15,579 36,755
Manufacturing 27,947 26,030 22,991 21,014 - 18,118 25,118
1991-92 to 2001-2002
2001-02 to 2011-12
New capital expenditure 107,239 121,562 112,398 121,477 155,025 62,397 99,913
Mining 32,339 40,782 36,924 47,685 82,081 10,586 30,650
Manufacturing 14,431 13,560 12,322 12,941 13,719 13,278 13,925
Period average

bree.gov.au
Ratio of mining to non-mining CAPEX investment in Australia (Real)
Source: BREE; ABS

bree.gov.au
CAPEX as Percentage of GDP
bree.gov.au
Exploration

bree.gov.au
Australia: private exploration expenditure (Nominal $)
2006-07 2007-08 2008-09 2009-10 2010-11 2011-12
$m $m $m $m $m $m
Energy Petroleum Onshore 498 494 492 749 757 920 Offshore 1,727 2,541 3,318 2,746 2,559 2,277 Total 2,226 3,035 3,811 3,494 3,315 3,197
Coal 193 235 297 321 520 834 Uranium 114 232 185 169 214 154 Total 2,533 3,501 4,293 3,984 4,049 4,185 Metals and other minerals Gold 456 593 438 575 652 768 Iron ore 285 450 589 524 665 1,151 Base metals, silver and cobalt 555 783 519 457 670 796
Mineral sands 37 37 31 na na na Diamonds 27 22 10 na na na Other 47 111 154 147 196 na Total metals and other minerals 1,407 1,995 1,741 1,742 2,218 2,965
Total expenditure 3,940 5,496 6,034 5,727 6,267 7,150
bree.gov.au
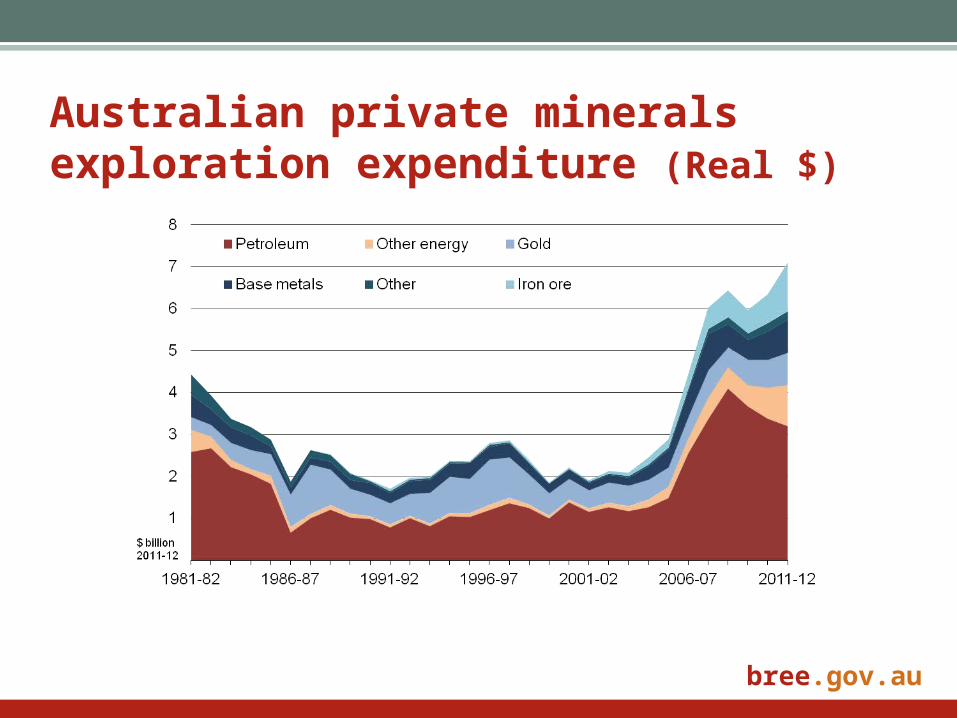
Australian private minerals exploration expenditure (Real $)
bree.gov.au
Major Mining Projects
bree.gov.au
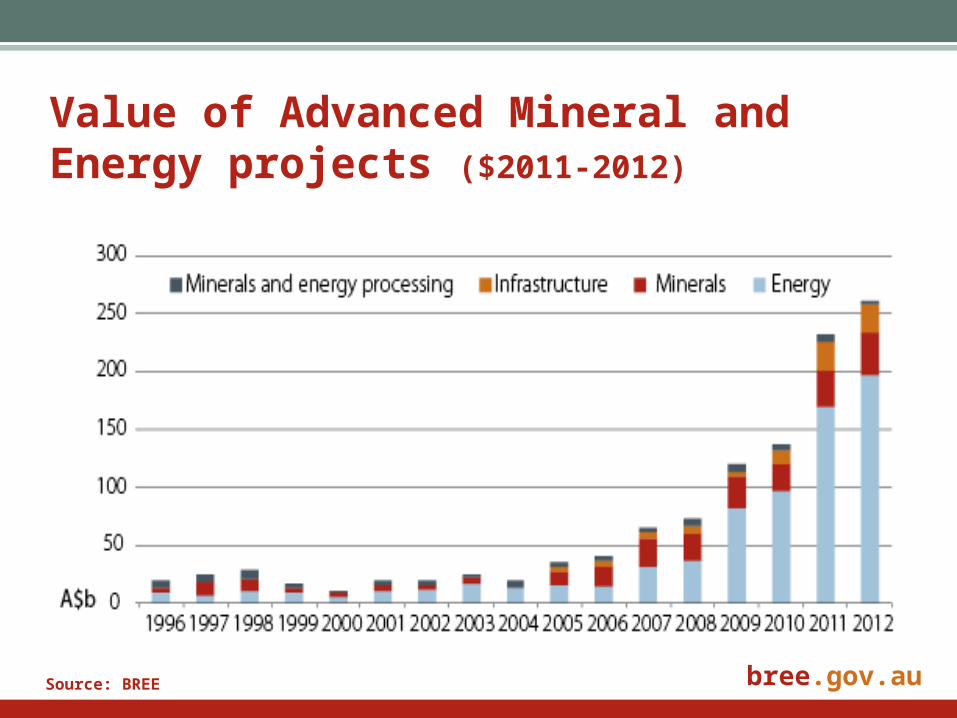
Value of Advanced Mineral and Energy projects ($2011-2012)
Source: BREE
bree.gov.au
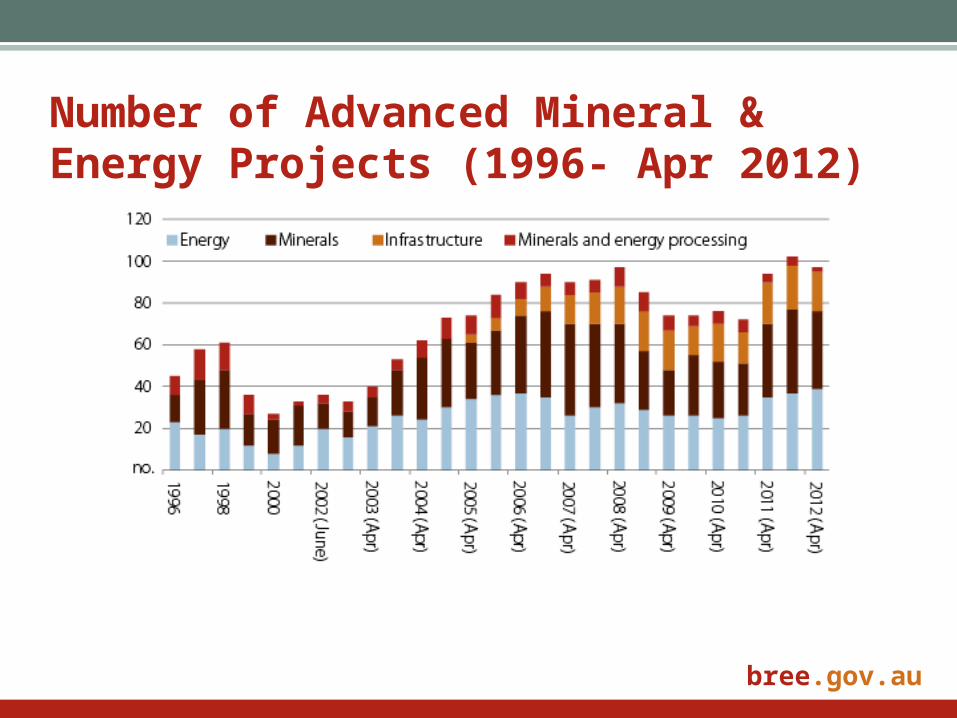
Number of Advanced Mineral & Energy Projects (1996- Apr 2012)

bree.gov.au
Value of advanced projects by commodity 2002 vs 2012
Source: BREE

bree.gov.au
Advanced Metals Projects

bree.gov.au
Value of advanced projects by state 2002 vs 2012
Source: BREE
bree.gov.au
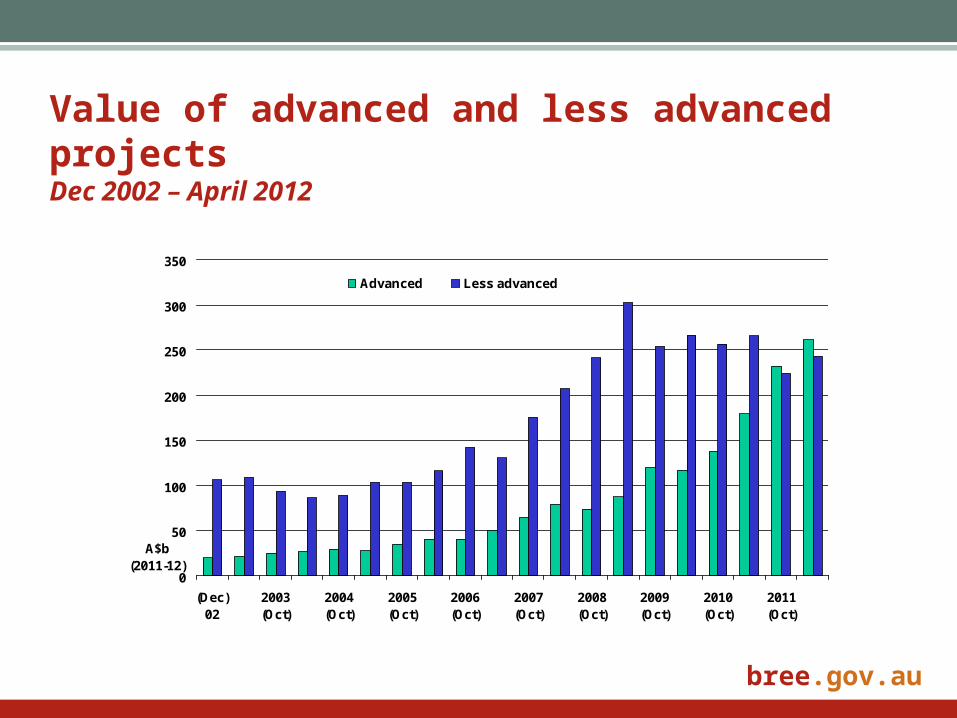
Value of advanced and less advanced projectsDec 2002 – April 2012
0
50
100
150
200
250
300
350
(Dec)02
2003(Oct)
2004(Oct)
2005(Oct)
2006(Oct)
2007(Oct)
2008(Oct)
2009(Oct)
2010(Oct)
2011(Oct)
A$b (2011-12)
Advanced Less advanced

bree.gov.au
Key Messages• Capital expenditures in mining industry totalled about
$82 billion in 2011-12 ─ highest ever, 70% higher than in
2010-11 and about six times greater than annual average
over past 30 years.• Historically high levels of investment (real $) will last for next
few years given the time it will take for some very large
projects to reach completion.• Over the longer term high levels of investment unlikely to be
maintained if resource commodity prices continue to fall.

bree.gov.au
Investment Futures

bree.gov.au
Prospects: Value of advanced projects if no new projects were announced
Source: BREE
bree.gov.au
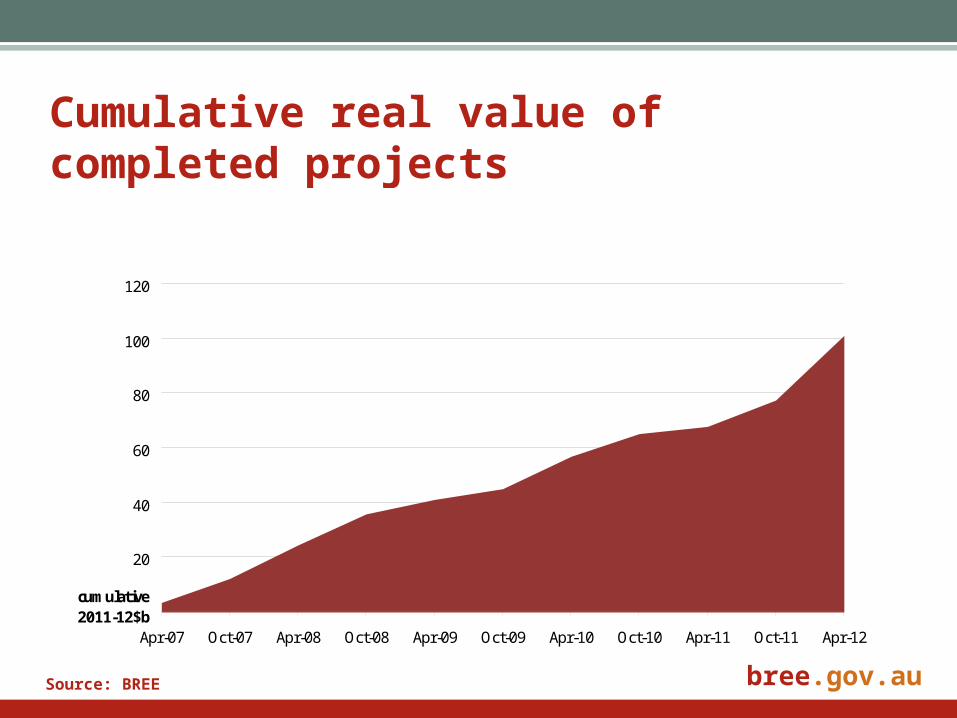
Cumulative real value of completed projects
20
40
60
80
100
120
Apr-07 Oct-07 Apr-08 Oct-08 Apr-09 Oct-09 Apr-10 Oct-10 Apr-11 Oct-11 Apr-12
cumulative2011-12$b
Source: BREE

bree.gov.au
4. Volume Trends

bree.gov.au
Commodity Production: Past Trends
50
100
150
200
250
300
2002-03 2005-06 2008-09 2011-12
Index2002-03 = 100
Iron Ore Metallurgical Coal LNG Thermal Coal
Source: BREE
bree.gov.au
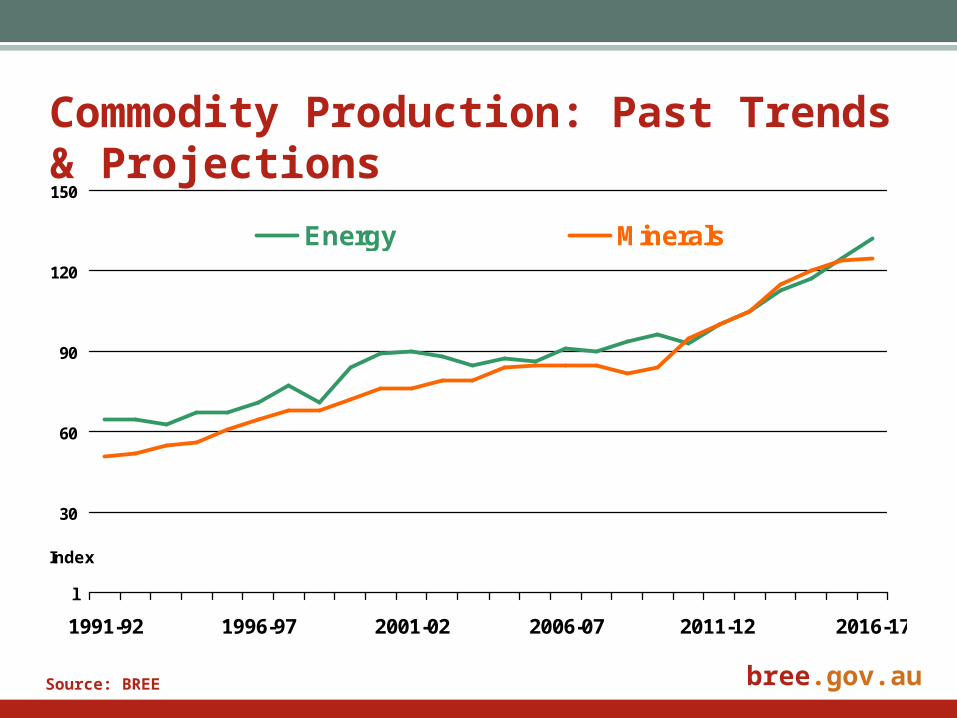
Commodity Production: Past Trends & Projections
l
30
60
90
120
150
1991-92 1996-97 2001-02 2006-07 2011-12 2016-17
Index
Energy Minerals
Source: BREE

bree.gov.au
Bulk Commodities

bree.gov.au
Key Messages• Large volume increases expected with bulk
commodities.• Substantial increases in volume of some metals
(gold, copper, and alumina), but declines or no
change in others.
