breast mri - the american association of physicists in medicine
TRANSCRIPT
Breast MRI: Using Physics to Maximize Its Sensitivity and Specificity to Breast Cancer
R. Edward Hendrick, Ph.D., FACR
Research Professor and Director, Breast Imaging Research Lynn Sage Comprehensive Breast Center and Department of Radiology
Northwestern University’s Feinberg School of Medicine Chicago, IL
e-mail: [email protected]
Abstract
This article discusses the underlying physics and technical requirements for high-
quality breast magnetic resonance imaging (BMRI). It begins with a brief discussion of MR pulse sequences used for breast imaging. Ten pre-requisites for maximizing the sensitivity of contrast-enhanced BMRI are discussed, along with the underlying practical issues and physical concepts behind these technical requirements. Some additional imaging and spectroscopic techniques to improve the specificity of breast MRI are discussed, such as diffusion imaging, perfusion imaging, choline spectroscopy, and spectroscopic imaging. Each topic contains references to more detailed descriptions in reference the peer-reviewed literature. Introduction MRI studies in the early to mid-1980s investigated the separation of malignant breast lesions from normal breast tissues and benign breast lesions based on inherent tissue longitudinal relaxation times (T1), transverse relaxation times (T2), and hydrogen spin densities (N[H]).1-4 Malignant breast lesions were found to have higher T1 and T2 values than normal breast tissues, but shorter T1 and T2 values than some benign breast lesions such as fibroadenomas (Table 1). The overlap in T1 and T2 values between benign and malignant breast lesions, however, discouraged the use of non-contrast breast MRI for cancer detection and diagnosis. This approach was recently revisited with modern scanning techniques and a multi-spectral approach to separate benign from malignant lesions.5,6 In spite of reasonable success in separating lesions, it is generally considered that high sensitivity to breast cancer requires imaging without and with a paramagnetic contrast agent such as gadopentetate dimeglumine, Gd-DTPA (Magnevist, Berlex Laboratories, Wayne, NJ and Schering Laboratories, Munich, Germany).
For over 15 years, contrast-enhanced breast MRI (CE-BMRI) has been investigated as a method for breast cancer detection and diagnosis.7-13 The addition of Gd-DTPA to breast MRI dramatically increased its sensitivity to breast cancer. Studies of CE-BMRI among asymptomatic high-risk women report sensitivities to breast cancer between 71% and 100%. Reported specificities, however, have varied widely (37-99%) depending on techniques and criteria for cancer detection.

Breast MRI: Using Physics to Maximize Sensitivity and Specificity Hendrick
Table 1: Breast Tissue T1 and T2 Values at 1.5 Tesla
Tissue Nsamples Mean T1 + Std. Dev Mean T2 + Std. Dev.
Fat 28 265+2 58+1
Normal Breast Tissue 23 796+21 63+4
Malignant Lesions 11 876+29 75+4
Benign Lesions 17 1049+40 89+8
Data from TE Merchant, et al (reference 4). The standard dosage of 0.1 mmol of Gd-DPTA per kilogram of body mass
(mmol/kg) was established on the basis of safety, not on the basis of optimized lesion detection. Heywang-Kobrunner et al studied the effect of Gd-DTPA concentration on lesion detection in the breast. They found that increasing the standard dose of 0.1 mmol/kg to 0.16 mmol/kg, while simultaneously increasing the uptake criterion for cancer from 20% above pre-contrast signal value to 60% above pre-contrast value, increased sensitivity from 94% to 100% without decreasing estimated specificity.14 They used a three-dimensional Fourier transform (3DFT) fast low-angle shot (FLASH) pulse sequence (explained later) with 4 mm slices. The 3 cancers detected only with the higher dose were all smaller than the slice thickness. Others have studied increasing the dosage of Gd-DTPA to up to 0.3 mmol/kg for brain neoplasms, demonstrating that higher doses consistently improve lesion conspicuity and reader confidence, without compromising patient safety.15
Elemental gadolinium is toxic; the chelated form of gadolinium renders it non-
toxic while it remains in the human body. After venous injection, Gd-chelates circulate in the bloodstream and collect in extracellular spaces where blood vessels are “leaky”, especially in the vicinity of rapidly proliferating tissues. Gd-chelates are filtered out of the bloodstream by glomerular filtration in the kidneys with an elimination half-life of a few hours.15
Since the mid-1990’s, several different versions of gadolinium-chelated contrast agents have been developed and approved for clinical use. Gd-DTPA is marketed as Magnevist (Berlex Laboratories, Wayne, NJ), Gd-DTPA-BHA is marketed as Omniscan (Nycomed Amersham, Oslo, Norway), and Gd-HP-DO3A is marketed as ProHance (Bracco Diagnostics, Inc., Princeton, NJ).15 All are relatively small molecules; the molecular weight of Gd-DTPA is 938 atomic mass units (amu). All of these molecules work as contrast agents because of the paramagnetic properties of the Gd atom, which has 3 unpaired electrons in its outer electron shell. The magnetic dipole moments of these unpaired electrons make the gadolinium atom highly paramagnetic, which means that the magnetic dipole moment of the gadolinium atom aligns with an externally applied magnetic field, adding to it, but exhibits no magnetic effects when not in a magnetic field.
2

Breast MRI: Using Physics to Maximize Sensitivity and Specificity Hendrick
The effect of paramagnetic contrast agents is to shorten the T1, T2, and T2* relaxation times of hydrogen nuclei in water. As hydrogen nuclei come into the vicinity of the Gd-DTPA molecule or as water binds briefly to the Gd-chelate molecule, the T1, T2, and T2* of hydrogen are shortened. Because the fractional change in relaxation times is greater for T1 than for T2, T1-weighted sequences have traditionally been used in conjunction with Gd-chelates.16 Since shorter T1 values make tissues brighter, Gd-chelates are a positive contrast agents, making enhancing lesions brighter on T1-weighted pulse sequences. By subtracting pre-contrast images from post-contrast images, vessels and extracellular spaces in the vicinity of vascular lesions are highlighted as bright compared to tissues that have little or no uptake of contrast agent. Previous Approaches to CE-BMRI
In the early 1990’s, two competing approaches to CE-BMRI emerged. One approach was to emphasize high spatial resolution, imaging once before and once after contrast injection, to be as sensitive as possible to lesions showing uptake of contrast agent. This approach based diagnosis primarily on the morphology of enhancing breast lesions, including their detailed shape, edge characteristics, and internal structure. This approach is typified by the rotating delivery of excitation off-resonance (RODEO) pulse sequence developed by Harms and coworkers.17, 18 RODEO acquires a unilateral 3DFT dataset using 128 slices with a 256x256 matrix over an 18 x 18 cm to obtain 1.4 mm x 0.7 mm x 0.7 mm voxels in an acquisition time of approximately 5 minutes each for pre- and post-contrast scans. A fundamental element of the RODEO pulse sequence is to use a special series of chemically-selective radiofrequency (rf) pulses to suppress the high signal from fat on T1-weighted scans. Fat saturation minimizes bright regions of signal from fat that can confound subtle regions of contrast enhancement on post-contrast T1-weighted sequences.
One of the virtues of the nearly isotropic voxels (voxels of approximately the
same size in the slice thickness direction and in each in-plane direction) achieved by RODEO, is that the 3D volume of image data covering the breast can be reformatted in any orientation by post-processing software. This can provide depiction of enhancing lesions in all three orthogonal directions (or from any oblique angle) in post-contrast or subtracted images, rather than being restricted to viewing 2D planar images or a maximum intensity projection (MIP) of the breast only in the projection of the original plane of acquisition.
A competing approach to breast MRI was to collect dynamic information about
the uptake and washout of contrast agent to attempt to improve the specificity of the exam. In early implementations of dynamic CE-BMRI, either high spatial resolution or full coverage of the breast was sacrificed so that higher temporal resolution could be obtained. For example, the approach used by Bootes et al, was to use a turboFLASH sequence to obtain 60 sequential images once every 2.3 seconds, confining image acquisition to a single 2D slice through the area of interest in the breast.19 Using a definition of malignancy that included lesions enhancing within 11.5 seconds after aorta opacification, they obtained a sensitivity of 95% and specificity of 86%. Another
3

Breast MRI: Using Physics to Maximize Sensitivity and Specificity Hendrick
dynamic approach, used by Kuhl et al, employed 2DFT FLASH imaging without fat suppression to obtain 21 4-mm thick contiguous slices through the breast with an acquisition time of 42 seconds for all 21 slices.20 One pre-contrast and 9 post-contrast scans were obtained to provide a 10-point dynamic study of enhancement and washout. In this method, axial slices were obtained in a rectangular format to obtain bilateral images with a 250-320 mm field of view (FOV) and 192 x 256 matrix. Thus, voxel volume was approximately 1 mm x 1.3 mm x 4 mm. Using this technique, Kuhl et al were able to use lesion morphology combined with dynamic curve shape to obtain 91% sensitivity and 83% specificity for dynamic contrast-enhanced breast MRI. 20
New developments in MR gradient systems and pulse sequence techniques have made it possible to combine these two approaches, so that both high spatial resolution and good temporal resolution are obtained simultaneously in CE-BMRI. One of the current limitations of CE-BMRI is lack of standardization of imaging sequences, contrast agent administration, image post-processing, and image review. One major step forward has been the standardization of reporting terminology through introduction of the fourth edition of the American College of Radiology’s Breast Imaging Reporting and Data System (BI-RADSTM), which includes breast MRI as well as mammography and breast ultrasound.21
A goal of this article is to suggest some standards for high-quality breast MRI in light of these technical improvements. Because of different scanner hardware and software, the capabilities of MR scanners vary widely. This article suggests some imaging techniques that transcend specific MR scanner capabilities, and provides the methods and rationale to achieve consistently high-quality CE-BMRI. These techniques are summarized as 10 prerequisites for high-quality CE-BMRI which follow. Pulse Sequences Used in Breast MRI Spin-echo Sequences Early investigations of breast MRI were based primarily on spin-echo pulse sequence developed by Hahn in 1950 for MR spectrocopy.4, 22 The basic spin-echo pulse sequence consists of a 90o pulse, followed by a 180o pulse, followed by the resultant signal echo during which measurement occurs (Figure 1). The basic pulse sequence is repeated nearly identically, except for the degree of phase encoding applied between the 90o pulse and signal measurement on each repetition. These different degrees of phase encoding on each repetition permit the resolution of individual voxels in the phase encoding direction, while application of the same gradient (the “read gradient” or frequency-encoding gradient) during each spin-echo provides separation of signal in the frequency encoding direction. Consequently, finer spatial resolution (more voxels for the same field-of-view) in the phase encoding direction requires more repetitions of the pulse sequence.
4

Breast MRI: Using Physics to Maximize Sensitivity and Specificity Hendrick
Figure 1: 2D spin-echo pulse sequence diagram. The horizontal axis represents time, with increasing time to the right. The top line of the diagram represents radiofrequency (RF) pulses sent into the patient by the transmit coil: a 90o RF pulse followed a time TE/2 later by a 180o RF pulse. The second line indicates the timing of the slice-select gradient: it is turned on in the positive direction while RF pulses are sent into the patient, so that the 90o and 180o RF pulses act only on a single slice of tissue. In between positive applications of the slice-select gradient, it is reversed to minimize dephasing of transverse magnetization due to the gradients themselves. The third line indicates the timing of the phase-encoding gradient, which is applied in an orthogonal direction to the slice-select gradient, along one of the two in-plane directions. The phase encoding gradient is turned on with a different strength for the same time duration (indicated by the horizontal hatchmarks) for each repetition of the basic pulse sequence (only two repetitions of 128, 192, or 256 are shown) to provide a different degree of phase encoding on each repetition. The fourth line shows the timing of the frequency-encoding or “readout” gradient, which is turned on during signal measurement to separate signal in the second in-plane direction, which is perpendicular to both the slice-select and frequency-encoding direction. The bottom line shows the signal out of the selected slice, which has a maximum echo signal at a time TE after the initial 90o pulse. Ts is the total sampling time, during which the signal is measured by the breast receiver coil and during which a constant frequency-encoding gradient is applied. At a time TR after the start of the 90o pulse, the pulse sequence is repeated identically, except for a different strength of phase-encoding gradient being applied. The basic sequence is repeated 128, 192, or 256 times, or more, to form a single image.
Spin-echo pulse sequences have the virtue of forming a robust signal that minimizes the effect of static magnetic field non-uniformities and magnetic susceptibility effects by using a 180o pulse to form the signal echo (Figure 2).23 The spin-echo signal from each voxel depends primarily on hydrogen density (N[H]), T1, and T2 through the following equation:
SSE(TR,TE) = N[H] (e-TE/T2)(1 – 2e-(TR-TE/2)/T1 + e-TR/T1),
where SSE is the spin-echo signal, TR is the basic sequence repetition time, and TE is the time between 90o pulse and peak echo signal (Figure 1). The two user-selectable timing parameters are TR and TE. T1, T2, and N[H] are the inherent tissue parameters for each voxel of tissue. Table 2 illustrates the selection of TR and TE values to weight spin-echo
5

Breast MRI: Using Physics to Maximize Sensitivity and Specificity Hendrick
pulse sequences toward T1, T2, or N[H]. T1-weighting in spin-echo imaging is maximized by setting TR to be similar to, or slightly shorter than, the T1-values of the tissues of interest, while setting TE as short as possible. From Table 1, it is evident that the T1 values of breast tissues range from approximately 250 ms for fat to 900 ms for breast cancers and slightly higher for benign breast lesions. Thus, TR values in the 300 – 600 ms range yield strongly T1-weighted SE images. To minimize T2 effects in T1-weighted spin-echo imaging, TE should be set short compared to the T2 values of breast tissues (under 20 ms, and preferably as short as possible). Keeping TE short has the added benefit of yielding higher signal because short TE leaves little time for T2-decay in any tissues.
CA
ats
po
m
t
FED
IHG
Figure 2: Behavior of the longitudinal and transverse magnetization during the spin-eThe main static magnetic field, Bo, is directed vertically (not shown). The longitudina single voxel is shown by the vertical arrow in each diagram. The transverse magneto Bo) is shown by the horizontal arrow in each diagram. A key point to understandinequences is that only transverse magnetization can be measured, due to the time-vary
caused by the transverse magnetization precessing at the Larmor frequency in the tranlacing the patient in the static magnetic field, tissue magnetization in each voxel is mriented along Bo, where it is not measurable. B. The 90o pulse rotates all longitudinal
transverse magnetization. Immediately after then 90o pulse, transverse magnetizationeasured at this point. C. During the time TE/2 after the 90o pulse, dephasing of the t
magnetization occurs because different protons sit in different local magnetic field envvoxel, some experiencing slightly stronger magnetic fields and precessing faster, othefields and precessing more slowly. These different precessional frequencies within thdephasing of the net transverse magnetization from that voxel. D. At the time TE/2, aapplied, which reorients each component of the transverse magnetization. The 180o pransverse magnetic dipoles that were precessing slightly faster reorient to the directio
6
B
cho pulse sequence. l magnetization from ization (perpendicular g MR pulse ing signal that is sverse plane. A. After aximal and is magnetization into is maximal, but is not ransverse ironments within the
rs in weaker magnetic e voxel cause 180o pulse is
ulse makes the n of slower

Breast MRI: Using Physics to Maximize Sensitivity and Specificity Hendrick
transverse magnetic dipoles and vice versa. Although the directions of magnetic dipoles have changed, the local magnetic inhomogeneities have not changed; thus the dipoles that previously precessed faster still precess faster. E. Therefore, aside from the dephasing that results from true irreversible T2 effects, there is a rephasing: The faster magnetic dipoles continue to precess faster and catch up, and the slower dipoles continue to precess more slowly and fall back. E. In a single instant, a maximum number of dipoles are rephased as they precess, forming an echo at time TE/2 after the 180-degree pulse (F). The signal is measured for a time period (Ts) just before, during, and just after peak echo formation. G. As time progresses, the transverse magnetization continues to rapidly dephase to zero (H), and the longitudinal magnetization slowly regrows (H and I), reflecting the fact that T2* is much shorter than T1. The remaining time until the next repetition of the pulse sequence is required to permit sufficient recovery of the longitudinal magnetization (I), taking a total time of TR from one 90-degree pulse to the next. If TR is long, there is greater recovery of the longitudinal magnetization prior to the next 90o pulse, and therefore less T1-weighting to the subsequently measured signal. Table 2: TR and TE of Spin-echo Pulse Sequences to Achieve T1, T2, or N[H]
Weighting Sequence Weighting
TR Setting
TE Setting
T1 200-600 ms as short as possible
T2 > 3 seconds 50 – 100 ms
Spin Density > 3 seconds as short as possible
T2-weighting can be achieved in spin-echo imaging by setting TE to be similar to the T2 values of tissues of interest (50-90 ms for breast tissues), while minimizing T1-effects by making TR long relative to the T1 values of breast tissues (TR > 3 seconds). Spin-density weighting can be achieved by minimizing both T1 and T2 weighting. T1 weighting is minimized by making TR long (> 3 seconds) and by making TE short (< 20 ms).
In spin-echo imaging, the total imaging time is: Ttotal = (TR)(Npe)(Nacq), where Npe is the number of phase encoding steps (typically 128, 192, or 256), and Nacq is the number of times each phase-encoding step is acquired (usually 1 or 2). In low-field MRI, Nacq was typically higher (2-8) to increase the signal-to-noise ratio per voxel (SNR) of the resultant image; at 1.5T, Nacq is usually set to 1. For a T1-weighted image, TR can be set relatively short to emphasize the T1 differences among tissues (eg, TR=500 ms), and for a 256x256 matrix image with Nacq = 1, the total acquisition time would be: Ttotal = (TR)(Npe)(Nacq) = (0.5s)(256)(1) = 128 s = 2.1 minutes. During that total acquisition time, multislice planar (2D) MR techniques collect not just a single slice, but up to several dozen slices, in the 2.1 minute time period, making it
7

Breast MRI: Using Physics to Maximize Sensitivity and Specificity Hendrick
possible to perform high-resolution MRI efficiently. For T2-weighted scans, TR typically is set to be 2.5 seconds or greater to minimize T1 differences among tissues, so the total acquisition time would be: Ttotal = (TR)(Npe)(Nacq) = (2.5s)(256)(1) = 640 s = 10.7 minutes. Again, a large number of 2D slices can be obtained in this total acquisition time using multislice imaging techniques. Fast Spin-echo or Turbo Spin-echo Sequences The evolution of MR pulse sequences and the desire for faster imaging led to the development of faster “spin-echo” sequences, originally called RARE (for rapid acquisition with relaxation enhancement) by Hennig et al in 1986 and subsequently called fast spin-echo (FSE) or turbo spin-echo (TSE) by MR manufacturers.24-26 In FSE/TSE sequences, rather than measuring a single echo after each 90o - 180o combination, multiple echoes are formed and measured by adding several 180o pulses and measuring a spin-echo signal after each one, each providing a different phase-encoding view of the same tissue by applying a different amount of phase encoding before each spin-echo is measured (Figure 3). The echo train length (ETL) is the number of echoes formed and measured after each 90o pulse, which is the factor by which the total imaging time is reduced. This speeds data collection so that the total scan time is: Ttotal = (TR)(Npe)(Nacq)/(ETL).
Figure 3: A schematic of the fast spinphase-encoding gradient is applied befencoding view (a different line in k-sp For example, replacing the T2-wwith a FSE/TSE sequence with E2.7 minutes), without a correspothan 8 result in too few slices be
-echo or turbo spin-echo pulse sequence with ETL = 4. Note that a ore each echo, so that each echo contributes a different phase-ace) to the FSE/TSE image.
eighted spin-echo sequence above that took 10.5 minutes TL=4 would result in a 4-fold reduction in scan time (to
nding reduction in SNR. Typically, ETL values greater ing obtained or result in excessive blurring, due to the
8
Breast MRI: Using Physics to Maximize Sensitivity and Specificity Hendrick
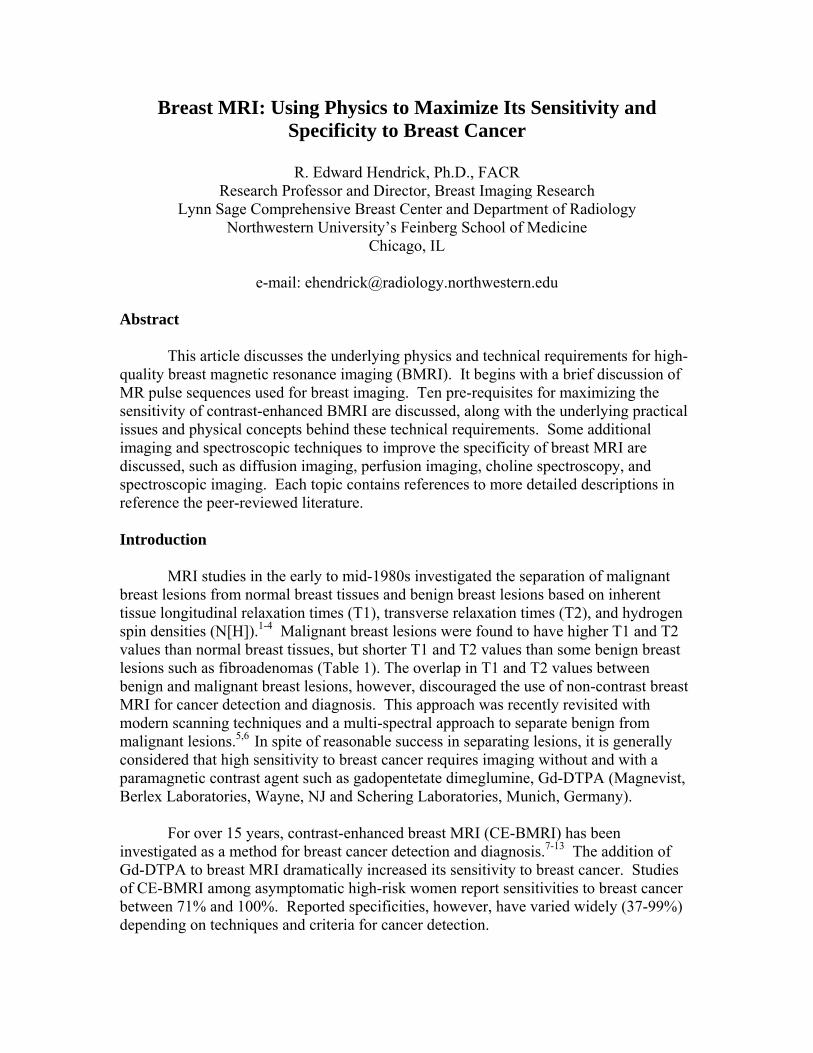
accumulation of signals with different TE values to the same image. As pointed out later, T2-weighted sequences are a useful adjunct to T1-weighted CE-BMRI sequences to help identify cysts based on their bright appearance on T2-weighted scans due to their long T2 values. FSE/TSE sequences provide a time-efficient way to collect these heavily T2-weighted scans. To achieve T2-weighting in FSE/TSE, and effective TE greater than 60 ms, and a TR greater than 3 seconds is used, the former to accentuate T2 effects, the latter to minimize T1 effects. Longer TR values are often chosen to accommodate collection of more slices, at least when 2D multislice imaging (with relatively long total echo times) is used. Gradient-echo Sequences Gradient echo pulse sequences were introduced by Frahm and Haase in 1986 as a way to speed image acquisition.27,28 Gradient echo sequences are similar to spin-echo sequences, with two modifications: 1) use of an initial θo pulse (θ < 90o), rather than the 90o pulse used in spin echo, and 2) use of a gradient reversal, instead of a 180o pulse to form an echo (a gradient-echo instead of a spin-echo) (Figures 4 and 5). These two modifications enable a substantial amount of longitudinal magnetization to remain in the direction of the static magnetic field, without being removed by either a 90o or 180o pulse (Figure 5). This eliminates the need to wait to allow re-growth of the longitudinal magnetization.
Figure 4: 2D gradient-echo pulse sequence diagram. Each line of the diagram has the same explanation as in Figure 1. Note that the 90o pulse in SE is replace by a θo pulse, and the 180o pulse in SE is replaced by reversal of the frequency-encoding gradient at time TE/2. The signal echo still occurs at time TE, and TR is still the time for one repetition of the basic pulse sequence. This sequence is repeated 128, 192, or 256 times, each with a different amount of phase encoding gradient, to produce a single 2D gradient-echo image.
9

Breast MRI: Using Physics to Maximize Sensitivity and Specificity Hendrick
A CB
Figseqmalon(Mis pethemamadu
ecsefaofac
imofab
an
FED
ure 5: Behavior of the longitudinal and transverse magnetization during the gradient-echo puuence A. Initially, magnetization is along +z direction. B. θo pulse tips some fraction of longignetization into the transverse plane. If θ is less than 90o, some magnetization will remain in tgitudinal direction. For example, immediately after a 30o RF pulse, the transverse magnetizatisin(30o)) of the original longitudinal magnetization (M), while the remaining longitudinal mag
87% (Mcos(30o)) of its original value. C. Transverse component of magnetization dephases duriod TE/2. D. At time TE/2 after the θ-degree pulse, some transverse dephasing is reversed by frequency-encoding gradient from negative to positive. E. During the second TE/2 period, tragnetization rephrases. F. At time TE after the θ-degree pulse, a rephased gradient echo of tragnetization occurs. Signal is measured just before, during, and just after formation of the gradring the time interval Ts.
The same formula applies to the total acquisition time in gradient-echo as
ho imaging, but the repetition time (TR) of the pulse sequence can be shorteneveral hundred milliseconds to a few milliseconds, decreasing total acquisition tctor of a hundred or more. Thus, a complete image can be acquired in seconds minutes. For example, for TR = 10 ms, Npe = 256, and Nacq = 1, the total imaquisition time for a single slice is:
Ttotal = (TR)(Npe)(Nacq) = (0.01s)(256)(1) = 2.6 s.
In 2D gradient echo imaging, multiple slices are acquires serially, so the taging time for multislice 2D gradient-echo imaging is in proportion to the tota slices. For example, for gradient-echo imaging of 25 slices with the parameterove, the total imaging time would be (2.6s)(25) = 65 seconds.
Gradient echo imaging has three user-selectable parameters: TR, TE, and
gle, θ. Gradient echo imaging also has slightly different pulse sequence versio
10
lse tudinal he on is half netization ring initial switching nsverse
nsverse ient echo,
in spin-d from ime by a instead ge
otal l number s listed
flip ns,

Breast MRI: Using Physics to Maximize Sensitivity and Specificity Hendrick
termed “spoiled” and “unspoiled”. The term “spoiled” refers to the fact that no transverse magnetization remains just prior to the next repetition of the pulse sequence. This spoiling occurs naturally due to T2* decay for long TR values (greater than 100-200 ms). For shorter TR values, steps are taken in spoiled gradient echo imaging after signal measurement and before the next repetition of the pulse sequence to ensure that no transverse magnetization remains. The signal for spoiled gradient-echo imaging as a function of TR, TE, and θ is:
SGEspoiled = N[H](e-TE/T2*)[(1 - e-TR/T1)sinθ]/[1 − e-TR/T1cosθ].
Note that T2*, not T2, governs the decay of transverse magnetization, the result of forming a gradient echo rather than a spin echo. Also note that the flip angle, θ, enters the formula in a slightly complicated way. The new parameter θ, in combination with TR, controls the T1 weighting of the pulse sequence through the term in square brackets. Table 3 describes the TR, TE, and settings needed to weight spoiled gradient-echo imaging toward T1, T2*, or N[H]. One common feature often overlooked in spoiled gradient-echo imaging is that to maximize SNR and contrast-to-noise ratio (CNR) between tissues, as TR is decreased (to reduce to imaging time), θ also should be decreased. Table 3: TR, TE, and θ Settings of Spoiled Gradient-echo Pulse Sequences to
Achieve T1, T2*, or N[H] Weighting Sequence Weighting
TR Setting
TE Setting
Flip Angle, θ Setting
T1 < 500 ms As short as possible 15o - 90o depending on TR
T2* Any setting
As long as possible up to 2TR/3 or 100 ms
10o – 30o
Spin Density < 50 ms As short as possible < 10o
The unspoiled version of gradient-echo imaging, which can occur only for very
short TR values, is a steady-state precession version of the sequence: eg, GRASS (gradient recalled steady-state), SSFP (steady-state free precession), and refocused-FLASH are terms used for this version of gradient-echo. Here, the goal is to preserve transverse magnetization and allow it to feed into the longitudinal magnetization on the next repetition of the sequence. Since it is not commonly used in breast MRI, the reader is referred elsewhere for more complete descriptions of this pulse sequence.23,26,28
3DFT (Volume) Imaging One of the most common applications of spoiled gradient-echo imaging, and one used frequently in breast MRI, is to enable 3DFT (volume) acquisitions. In 3DFT imaging, an entire volume of data is excited by each θo pulse and signal is collected from
11

Breast MRI: Using Physics to Maximize Sensitivity and Specificity Hendrick
the entire volume rather than a single slice. This makes for more efficient signal collection, since signal is being collected from a larger volume of tissue. In 3DFT (volume) imaging, one direction is resolved by frequency encoding, the second direction is resolved by multiple phase-encoding steps, and the third direction (what would be the slice select direction in 2D imaging) also requires multiple phasing encoding steps. Thus, the penalty for collecting more signal per unit time in 3DFT imaging is that additional imaging time must be taken to resolve individual voxels in the third direction. The total imaging time in 3DFT imaging is: Ttotal = (TR)(Npe-x) )(Npe-z) (Nacq). So to break the volume up in to 128 equally spaced slices with TR = 10 ms and Npe-x = 256, the total imaging time is: Ttotal = (TR)(Npe-x) )(Npe-z) (Nacq) = (0.01s)(256)(128)(1) = 300 s = 5 minutes.
For the same slice thickness and in-plane spatial resolution, the approximate gain in SNR from 3DFT acquisitions compared to 2DFT is proportional to the square root of the number of phase-encoding steps in the slice select (z) direction, so the SNR for 3D imaging should be a factor of (128)1/2 = 11.4 greater than that for 2D gradient-echo imaging with the same in-plane spatial resolution.
3DFT imaging has another advantage. 2DFT acquisition slice profiles are approximately Gaussian, with maximum signal acquired at the center, and decreasing signal acquired from the edges, of each slice (Figure 6A). Because 2D slice profiles are approximately Gaussian, there is a small amount of cross-talk between adjacent slices. 2DFT acquisitions often have a small gap placed between slices, making 2DFT slices even less contiguous. 3DFT acquisition slice profiles are rectangular, increasing the total signal from each voxel in 3D, compared to 2D, acquisitions with the same nominal slice thickness (Figure 6B). Both 2DFT and 3DFT acquisitions are used in breast imaging. Typically, most non-contrast pulse sequences, such as preliminary T1 and T2-weighted scans are acquired in 2D mode, while pre- and post-contrast T1-weighted scans are acquired in 3D mode. Some sites still use 2D mode for all imaging, including CE scans. This is typically done because of the desire to obtain CE scans quickly and scanner limitations for 3D acquisitions, or under the mistaken impression that 2D acquisitions offer a SNR advantage over 3D acquisitions. We turn next to a list of prerequisites for high quality CE-BMRI.
12

Breast MRI: Using Physics to Maximize Sensitivity and Specificity Hendrick
Figure 6A: Gaussian signal profiles of 2D slices (solid curves) versus the prescribed slice locations (dashed rectangles). Because of some cross-talk between 2D slices, a small gap is often prescribed between 2D slices, as shown. Even with contiguously prescribed slices, there is signal loss at the edges of 2D slices due to the slice signal profile.
Figure 6B: 3D slices have rectangular profiles, due to the acquisition of a volume of data rather than individual slices. Additional phase-encoding and additional signal acquisitions are required to separate the slices in a 3D volume acquisition.
Slice-select Direction
Frequency-encoding Direction
Phase-encoding Direction
3D Volume Acquisition
Signal
2D Multislice Acquisition
Slice-Select Position
13

Breast MRI: Using Physics to Maximize Sensitivity and Specificity Hendrick
Pre-requisites for Making CE-BMRI Sensitive and Specific to Breast Cancer
Table 4 lists 10 steps for making CE-BMRI both sensitive and specific to breast cancer. A more complete explanation of each step is listed below. Table 4: Ten Pre-requisites for Maximizing the Sensitivity and Specificity of
Contrast-enhanced Breast MRI 1. High magnetic field strength MRI system with good magnetic field homogeneity across both breasts. 2. Bilateral imaging with a prone-positioning bilateral breast coil and breast immobilization. 3. A pre-contrast T2-weighted sequence for identifying cysts. 4. A 3DFT gradient-echo T1-weighted pulse sequence for contrast-enhanced imaging. 5. Good fat suppression over both breasts. 6. Adequately thin image slices of 3 mm or less thickness. 7. Pixel sizes of less than 1 mm in each in-plane direction. 8. Selection of the phase-encoding direction to minimize artifacts across the breasts. 9. Gd-DTPA administration: 0.1 to 0.2 mmol/kg followed by a 20 ml saline flush. 10. A total 3DFT acquisition time for both breasts of less than 2 minutes.
1. High magnetic field strength and high homogeneity: Above a few tenths of a Tesla, image signal-to-noise ratio (SNR) goes up approximately linearly with magnetic field strength.26,29 Therefore, high magnetic field strength (Bo) provides high SNR for the same voxel volume, assuming appropriate pulse sequences are used. Higher SNR per unit volume means that higher spatial resolution may be obtained in an adequately short scan time. A second reason for requiring high magnetic field strength is to ensure adequately high magnetic field homogeneity over the area being imaged. High magnetic field homogeneity for breast imaging means that the static magnetic field strength should not vary significantly across a field size that includes both breasts. Since protons in water and fat differ in resonant frequencies by approximately 3.5 parts per million, the magnetic field homogeneity must be significantly better than 3.5 ppm over the field-of-view of the breasts to achieve good chemically-selective fat suppression (suppression of proton signals from fat (primarily CH2), while preserving proton signals from water(H2O)). The standard criterion is that magnetic field homogeneity should be less than 1 part per million (1 ppm) to ensure that chemically-selective fat suppression is effective. Since good chemically-selective fat suppression is needed across both breasts, the magnetic field homogeneity should be less than about 1 ppm across a FOV that includes both breasts (30-35 cm). This is generally not possible for low to mid-field
14

Breast MRI: Using Physics to Maximize Sensitivity and Specificity Hendrick
scanners (less than 1.0 Tesla), and is a challenge even for high-field scanners, since the locations of the breasts in prone-positioned breast MRI are not at the isocenter (the center in x, y, and z) of the magnet. 2. Bilateral imaging with prone positioning and breast immobilization: Bilateral imaging is recommended for at least 3 reasons. Clinically, comparing images of both breasts is as important in BMRI as it is in mammography. Bilateral comparison helps identification of focal enhancement and helps prevent overcalling spurious enhancement, which tends to occur bilaterally in pre-menopausal women and some post-menopausal women on hormone replacement therapy. Moreover, data from recent BMRI studies indicate that when a breast cancer occurs, there is a 3-5% chance that BMRI will detect a cancer in the contralateral breast.30,31 Finally, unilateral imaging in the transaxial or coronal plane can incur wrap-around artifacts from the contralateral breast, especially if phase encoding is set left-to-right. While this is more likely to occur with a bilateral breast coil when the receiver coil for the contralateral breast coil is left on, some image wrap from the contralateral breast can occur even with the use of a unilateral breast coil.
Bilateral imaging is usually achieved by using the body coil as the transmit coil and a prone-positioned bilateral breast coil as the receiver coil (Figure 7). Modern breast coils use multiple channels for the receiver elements. The received signals are recorded simultaneously using multiple amplifier and analog-to-digital converter systems. Four-channel quadrature breast receiver coils are common and a 7-channel breast receiver coil has recently been introduced (MRI Devices, Waukesha, WI) (Figure 8). Until recently, these receiver channels were all used to acquire the same dataset for image reconstruction.
Figure 7A: An axial bilateral scan showing the slice prescription of two separate 3D blocks of data, one on each breast, to be acquired in the sagittal plane. In this case, 120 1 mm slices were acquired on each breast. B. A single 1 mm slice acquired on the left breast shows an enhancing 4-5 mm invasive ductal carcinoma just distal to a silicone breast implant.
15

Breast MRI: Using Physics to Maximize Sensitivity and Specificity Hendrick
Figure 8: Three different breast coils used on 1.5 Tesla systems
A. Siemens bilateral 4-channel imaging coil. B. MRI Devices 4 channel bilateral imaging and biopsy coil.
C. MRI Devices 7-channel bilateral imaging and biopsy coil. A new technique called parallel imaging (which goes by acronyms such as iPAT,
PPA (partially parallel array), SMASH, GRAPPA, and SENSE), modifies conventional image acquisition so that each channel simultaneously acquires different lines in k-space or a different section of the image, rather than all coils acquiring the same line in k-space or the same image.32 Some of these techniques, such as iPAT, PAT, PPA, SMASH, and GRAPPA, have each coil element acquiring a different line in k-space. Others, such as SENSE, have different coil elements acquiring a different piece of the image in image space. In either case, prior knowledge of each coils’ spatial sensitivity profile is needed to piece back together the different datasets collected by each coil element. This accelerated method of data collection uses more complex reconstruction software than conventional 2DFT or 3DFT techniques to recombine the different partial datasets acquired by each coil element. Parallel imaging has the potential to speed up image acquisitions and reduce some image artifacts such as image wraparound artifacts. In the breast, parallel imaging permits simultaneous acquisition of images of each breast, halving the total acquisition time. Parallel imaging techniques are just becoming
16

Breast MRI: Using Physics to Maximize Sensitivity and Specificity Hendrick
available on the latest generation of MR scanners and results are limited, but suggest that the decrease in scan time afforded with parallel imaging causes a decrease in signal-to-noise per voxel.
Mild compression applied in the lateral-to-medial direction decreases the extent of breast tissue to be imaged in the left-right or lateral-medial direction. This is helpful where scanning is performed in the sagittal plane, since lateromedial compression limits the number of slices, shortening acquisition time for 3DFT acquisitions. It also minimizes breast motion during imaging and between pre- and post-contrast scans, which causes misregistration in subtracted breast images. 3. A pre-contrast T2-weighted sequence for identifying cysts. Breast cysts have extremely long T1 and T2 values relative to other breast tissues, and similar to those of cerebrospinal fluid (CSF), due to their high water content. Cysts typically have few macromolecules to shorten T1, and lack of cellular structure to shorten T2. Thus, cysts appear slightly darker than other breast tissues on heavily T1-weighted sequences due to their longer T1 values, although the higher hydrogen density of cysts offsets the T1-weighted contrast between cysts and other breast tissues. Cysts appear much brighter than other breast tissues on T2-weighted sequences due to their longer T2 values and higher hydrogen densities, both of which act in concert to make cysts bright (Figure 9). Cysts are therefore more easily identified as bright areas on fat-suppressed T2-weighted sequences such as spin-echo or fast-spin-echo with long TR (several seconds) and long TE (of 80 ms or greater). STIR sequences performed with a TI that nulls the signal from fat (a TI value of about 150 ms at 1.5T) have the unique property that tissues with longer T1 values, longer T2 values, and higher spin densities all contribute coherently to making those tissues bright. Thus, cysts are easily identified as being the brightest regions on a STIR sequence (with TR > 4 seconds and TE > 60 ms). FSE/TSE scans with TR > 2 seconds, TE > 60 ms also yield heavy T2-weighting to make cysts bright. Figure 9: T2-weighted fast-spin echo image showing cysts as bright uniform signal areas in the left breast. 4. A 3DFT gradient-echo T1-weighted pulse sequence for CE imaging. As noted previously, T1-weighted pulse sequences are used in CE-BMRI because Gd-chelates, while shortening both T1 and T2 of water, cause a greater fractional change in T1 than in
17

Breast MRI: Using Physics to Maximize Sensitivity and Specificity Hendrick
T2.16 In gradient-echo imaging, T1 weighting is achieved by using a short TR, very short TE, and a moderate flip angle.28 An added benefit is that the T1 shortening caused by Gd-DTPA makes lesions brighter than most surrounding breast tissues (other than fat). Thus enhancing lesions appear bright in both fat-suppressed post-contrast scans and in properly subtracted CE studies, where pre-contrast scans are subtracted from post-contrast scans (Figure 10).
A B C D E
Figure 10: T1-weighted fat-suppressed contrast-enhanced imaging. A. Precontrast sagittal image of a single slice. B. Postcontrast image of the same slice as A, showing a spiculated enhancing lesion. C. Precontrast sagittal image of another slice in the same breast. D. Postcontrast image of the same slice as in C, showing a second enhancing spiculated lesion. E. Maximum intensity projection of the entire set of sagittal slices, showing both enhancing lesions.
As previously mentioned, 3DFT sequences have a signal-to-noise advantage over 2DFT pulse sequences because signal is acquired from a volume instead of a single plane. Thus, more signal is collected on each data measurement. 3DFT sequences require more phase encoding steps, however, not only to resolve one direction of the 2D (planar) data, but also to resolve the 3D volume into individual slice elements (Figure 6).
18

Breast MRI: Using Physics to Maximize Sensitivity and Specificity Hendrick
5. Good fat suppression over both breasts. In T1-weighted 3DFT imaging, fat suppression is achieved by applying a frequency-selective 90o saturation pulse that acts only on the hydrogen in fat (primarily CH2). This narrow-band saturation pulse is applied to the entire volume of tissue in the body coil. If applied uniformly across both breasts, the 90o pulse effectively eliminates fat signal from the subsequent pulse sequence that follows. Fat suppression is useful, as it reduces the signal from both pre- and post-contrast scans. Lack of fat suppression and even a small amount of mis-registration between pre- and post-contrast scans can create artifacts in subtraction images that complicate interpretation and, in some cases, can simulate enhancing lesions (Figure 11). Good fat suppression has the potential to minimize misregistration artifacts and permit the detection of small enhancing lesions. A B C Figure 11: A. Precontrast T1-weighted image without fat suppression. B. Post-contrast T1-weighted image of the same slice as in A. C. Subtracted image of the same slice, showing the enhancing lesion along with artifacts due to misregistration of fat between pre- and post-contrast images. 6. Adequately thin image slices of 3 mm or less thickness. Slice thickness sets the limit on the smallest visible lesion: roughly, to be sensitive to a lesion of 3 mm diameter, a slice thickness of 3 mm or less must be used. Even then, partial voluming of a low-contrast lesion could make the lesion difficult to detect (Figure 12). Fortunately, most enhancing breast lesions are not low-contrast in either post-contrast or subtracted images, due to the shortening of T1 in enhancing lesions. Adequately thin slices, however, make CE-BMRI more sensitive to small areas of distributed enhancement in non-mass lesions such as ductal carcinoma in-situ (DCIS).
19

Breast MRI: Using Physics to Maximize Sensitivity and Specificity Hendrick
Figuremore b 7. Pixincreabettermany unifor
bilater256 ximagipixelswith a
8. SelThe mpropaThere
A. 1 mm slice thickness B. 2 mm slice thickness
C. 3 mm slice thickness D. 4 mm slice thickness
12: Effect of slice thickness on tissue visibility. Note the increased partial volume effect, causing lurring of tissues, as slice thickness is increased.
el sizes of less than 1 mm in each in-plane direction. Smaller pixel sizes se the amount of fine detail available to the radiologist. Smaller pixels provide definition of lesion margins and better visibility of fine spiculations associated with invasive breast cancers. Without small pixels, details of lesion margins, non-m enhancement, and spiculations can be missed.
Pixel sizes of less than 1 mm in each in-plane direction can be achieved in al imaging by selecting the sagittal plane and using a FOV of 20 cm or less, with a
256 matrix. This yields a pixel size of 0.78 x 0.78 mm. If transaxial or coronal ng is performed, a FOV of 32-36 cm can be used, with a 384 x 384 matrix, yielding of slightly less than 1 mm on a side. It is also possible to use a rectangular FOV, reduced FOV in the phase-encoding direction, reducing imaging time.
ection of the phase-encoding direction to minimize artifacts across the breasts. ain source of artifacts is cardiac and respiratory motion. These motion artifacts
gate across the image in the in-plane phase-encoding direction (Figure 13). fore, it is essential to orient the in-plane phase-encoding direction to minimize
20

Breast MRI: Using Physics to Maximize Sensitivity and Specificity Hendrick
artifacts across the breast. This means the phase encoding direction should never be anterior-posterior. A good rule of thumb is to put the frequency encoding direction in the AP direction. For sagittal plane imaging, this means orienting the phase-encoding direction head-to-foot (superior-inferior). For transaxial plane imaging, phase-encoding should be oriented left-to-right. For coronal plane imaging, phase encoding should be oriented in the superior-inferior directions, since moving tissues are neither above or below the breasts when the patient is properly positioned.
A B C D Figure 13: A. T1-weighted axial image with phase-encoding improperly selected to be in the anterior-posterior direction, showing significant cardiac and respiratory artifacts propagating across the breasts (vertical) direction. B. T1-weighted axial image of a different patient with phase-encoding properly selected to be in the left-right (horizontal) direction. C. Subtracted, contrast-enhanced sagittal image showing significant motion and image wrap artifacts (vertical banding). The phase-encoding direction was correctly chosen to be head-foot, but there was patient motion during imaging. D. A later subtracted, contrast-enhanced sagittal image on the same subject and location as C, without motion artifacts. Some slight cardiac motion and image wrap artifacts are still visible in the superior portion of the breast near the chest wall, but image quality is improved in the distal portions of the breast.
21

Breast MRI: Using Physics to Maximize Sensitivity and Specificity Hendrick
9. Gd-DTPA administration of 0.1 to 0.2 mmol/kg followed by 20 ml of saline. The standard Gd-DTPA administration for brain and spine is 0.1 mmol/kg. For a 110 lb (50 kg) woman, the recommended administration is 5 mmol. Since the concentration of Gd-DTPA in standard dosage is 0.5 mmol per ml, 5 mmol is contained in 10 ml (or 10 cc) of contrast agent. Some sites administer a fixed dose of contrast agent (usually 20 ml), which amounts to 0.2 mmol/kg for a 110 lb woman but would vary in dose per body mass and may be lower than 0.1 mmol/kg for a woman in excess of 100 kg (220 lbs). Some sites administer a double dose of 0.2 mmol/kg, based on patient body mass.
The previously mentioned paper by Heywang-Kobrunner, et.al., compared the use of 0.1 and 0.16 mmol/kg doses in CE-BMRI, with improved lesion detection with the higher dose, based on the additional detection of 3 of 54 carcinoma with the higher dose.14 This paper used a 3DFT FLASH pulse sequence with 4 mm slices, and the 3 cancers detected only with the higher dose were all smaller than the slice thickness.
Just as important as total amount of Gd-DTPA injected is the rate and method of
injection. A recent abstract demonstrated that enhancement rates and time to peak enhancement are strongly affected by injection rate.33 They compared injection rates of 0.5 ml/second and 2 ml/second for administration of fixed 20 ml doses of Gd-DTPA by injecting 27 women with two doses administered on different days. They found that breast cancers demonstrated a more rapid enhancement rate and earlier time to peak enhancement with the higher injection rate. Mean enhancement rates were 6.2 signal units per second for the 0.5 ml/s injection rate and 12.9 signal units per second for the 2.0 ml/s injection rate. Mean times to peak enhancement were 209 s for 0.5 ml/s and 113 s for 2.0 ml/s. Surprisingly, peak enhancement factors of cancers, the ratio of peak post-contrast lesion signal to pre-contrast signal, did not differ significantly for the two injection rates: enhancement factors were 2.4 for 0.5 ml and 1.71 for 2.0 ml (p = 0.08).
Power injection is recommended to maintain consistent injection rate and timing.
A 20 ml saline flush immediately after injection is recommended to ensure that all prescribed contrast agent clears the injection tubing and circulates in the patient’s blood stream.
10. A total 3DFT acquisition time for both breasts of less than 2 minutes. The temporal resolution needed for breast MRI is determined by the time course of contrast agent uptake (Figure 14). Peak contrast enhancement in malignant lesions typically occurs between 90 and 180 seconds after injection, so accurately capturing lesion dynamics requires a temporal resolution of approximately 2 minutes or less. For bilateral imaging, this means that both breasts must be imaged in this time period. Typically, a pre-contrast image set and several post-contrast image sets are acquired with identical acquisition parameters so that subtraction of pre- from post-contrast images reveals only temporal changes. This means that it is important to keep scanning parameters, including center frequency, transmitter gain, and receiver gain identical for pre-contrast and all post-contrast scans. Allowing the MR system to auto-pretune for pre- and each post-contrast sequence will defeat this requirement.
22

Breast MRI: Using Physics to Maximize Sensitivity and Specificity Hendrick
Figure 14: Typical time enhancement curve (solid line) and two different sampling rates due to different temporal resolution of contrast-enhanced scanning.
A. Temporal resolution of 4 minutes fails to capture peak enhancement and washout (dashed curve). Time (min)
Signal
0 1 2 3 4 5 6 Pre- B. Temporal resolution of 1.25 minutes accurately captures the peak enhancement and washout of the
lesion signal.
23
Breast MRI: Using Physics to Maximize Sensitivity and Specificity Hendrick
C. Time-enhancement curves of two malignant lesions and several other normal tissues obtained with a
temporal resolution of 1.25 minutes.
Tissue Signal Values - Bilateral Exam
0
50
100
150
200
250
0 50 100 150 200 250 300 350
Time (seconds)
Sign
al V
alue
s
Primary Lesion
Secondary Lesion
Fat
Muscle
Implant
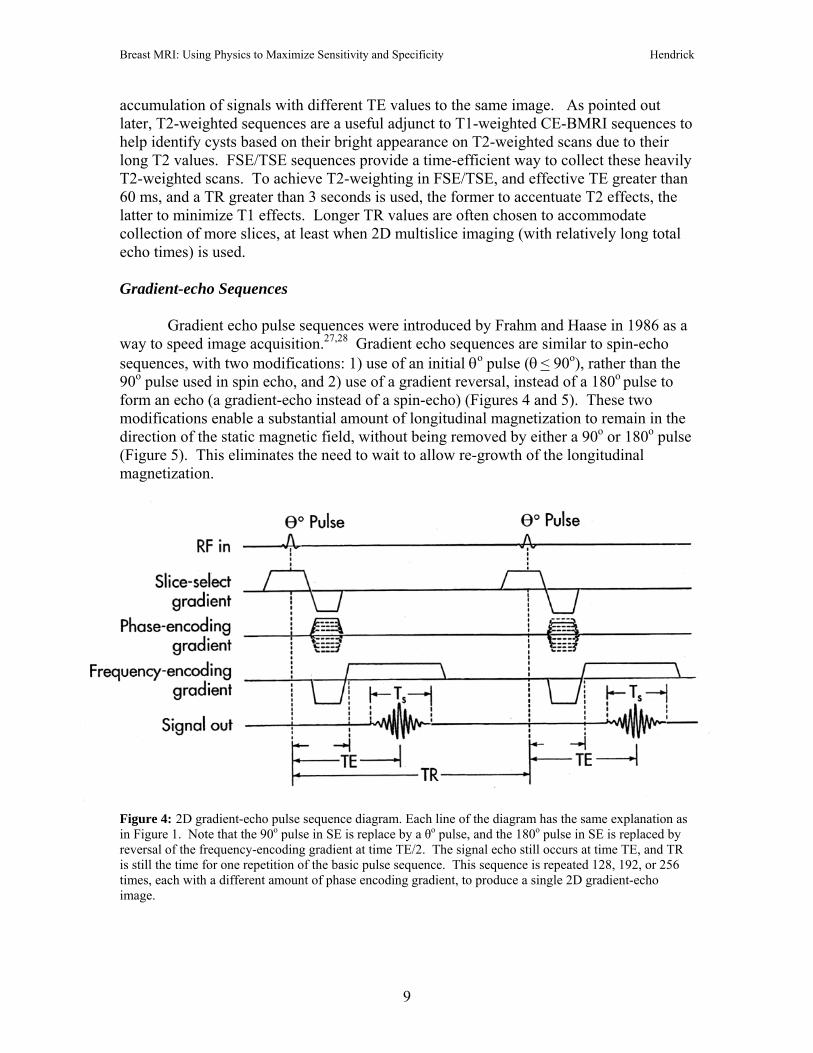
Imaging for 6-8 minutes after contrast injection is typically long enough to determine the detailed shape of the contrast curve and to determine whether enhancement is continuous (Type 1), plateau (Type 2), or washout (Type 3) (see Figure 15).
Time (minutes)
Signal
0 1 2 3 4 5 6
Type 1: Continuous IncreaseType 3: Washout
Type 2: Plateau Figure 15: Enhancement curves for two primary lesions that were biopsy-proven invasive carcinomas (primary and secondary lesions), normal tissues, and silicone implant.
24

Breast MRI: Using Physics to Maximize Sensitivity and Specificity Hendrick
Kuhl, et.al., demonstrated in a limited study group that only 6% of lesions with Type 1 curves were malignant, 65% of lesions with Type 2 curves were malignant, and 87% of lesions with Type 3 curves were malignant.20 This and other works indicate that accurately capturing information not just about morphology, but about the time-enhancement pattern, adds specificity to CE-BMRI.31,32 Thus, it is important to collect data with adequate temporal resolution to accurately portray the time course of lesion enhancement, as long as adequate SNR and detailed lesion morphology are not sacrificed.
Current High-field Scanners Can Achieve Both High Spatial Resolution and Adequate Temporal Resolution
For the past 4 years, we have used 1.5T systems to obtain 3DFT fat-suppressed acquisitions covering both breasts in 70-80 seconds. In each case, 61-73 2 mm thick slices are obtained in the sagittal plane on each breast. An additional 59 to 71 2 mm thick slices are determined by interpolation between the originally acquired slices, yielding a total of 120-144 slices at 1 mm intervals on each breast. Each slice has 0.78 mm x 0.94 mm in-plane spatial resolution using a 15 x 20 cm FOV and 192 x 256 matrix. The TR and TE used were 3.8 to 4.6 ms and 1.6 to 1.8 ms, respectively.
In our routine imaging protocol, one pre-contrast acquisition is obtained followed
immediately by injection of 0.1-0.2 mmol/kg Gd-DTPA at an injection rate of 2 ml/s, followed by a 20 ml saline flush injected at 2 ml/s, followed immediately by acquisition of a total of 4 or more post-contrast acquisitions, out to approximately 7 minutes after contrast injection.
Pre-contrast images are routinely subtracted from each set of post-contrast images to create a series of subtracted volume datasets showing only the changes in image data due to contrast agent uptake (Figure 15). Like RODEO, obtaining nearly isotropic 3DFT images (with voxel volumes of 0.78 mm x 0.94 mm x 1 mm = 0.73 mm3) permits reconstruction of the original or subtracted 3D dataset in any projection. Maximum-intensity projection (MIP) reconstructions of the subtracted 3D dataset reveal the brightest regions of the volume, which are arteries, veins, enhancing lesions, and lymph nodes in the breast. Breast immobilization leaves 3D datasets free from motion artifacts. The combination of fat-suppression and subtraction of pre- from post-contrast images leaves 3D datasets free from fat-misregistration artifacts and chemical shift artifacts. The main task left for the radiologist is to separate enhancing lesions from the vascular system of the breast and enhancing lymph nodes.
To aid in determining the level of suspicion of enhancing lesions, time-
enhancement curves are constructed in all areas of the breast showing significant enhancement. Most breast MRI sites set the level of significant enhancement between 50% and 100% signal values compared to pre-contrast signals, depending on the quantity and rate of Gd-chelate contrast agent administered. To construct time-enhancement curves, signal values are taken from the original, unsubtracted images. Lesions showing
25

Breast MRI: Using Physics to Maximize Sensitivity and Specificity Hendrick
significant enhancement from pre- to maximum post-contrast images, showing spiculated or irregular margins, showing rim enhancement, and showing a plateau (Type II) or washout (Type III) time-enhancement curve during the 6-8 minutes post-contrast are most suspicious for cancer. Lesions showing weak enhancement, with smooth margins, and with continual increase of signal during the 6-8 minutes post-contrast (Type I) are less suspicious for cancer (see Figure 15).20
Techniques to Improve the Specificity of CE-BMRI Several interesting techniques beyond CE-BMRI are being investigated to try to improve the specificity of breast MRI. Some of the most interesting are diffusion imaging, perfusion imaging, measurement of the choline peak in proton spectroscopy, and spectroscopic imaging. Each is discussed briefly below. Diffusion Imaging of the Breast Diffusion-weighted imaging is achieved by using a set of MR pulse sequences that can measure the apparent diffusion coefficient (ADC) of water in tissue voxels in-vivo.34 Diffusion-sensitizing gradients can be applied in one or multiple directions to weight the pulse sequence by the ADC of water. In the one-dimensional measurement, a pair of gradients is applied along a single axis to alter the signal of diffusing water. In the absence of diffusion or other motion, the signal is unaffected by the pair of gradients. In the presence of diffusion or motion along the selected direction, the signal is reduced exponentially in proportion to the ADC: Smeasured = Soe
-bg(ADC) , where, So is the signal without diffusion and bg is a term determined by the diffusion gradient strength and time duration.35 The ADC is determined by repeating this sequence using several different known values of bg and fitting the signal in each voxel to determine the ADC for each voxel. While the measured ADC is affected by diffusion, it is not identical to the diffusion coefficient measured in water-containing tissues in a test tube, which depends entirely on the random thermal motion of water. In-vivo measurements of the ADC have the complicating effects of blood flow, tissue vibrations caused by systolic motion, and subject motion. Typically, to remove directionality, the average ADC in x, y, and z, known as the diffusion trace, is measured by separately determining and combining the ADC values measured by sensitizing the pulse sequence to diffusion along the x, y, and z directions: ADCav = ADCtrace = ADCxx + ADCyy + ADCzz . The in-vivo measurement of ADC depends on having pulse sequences fast enough to reduce the effects of physiologic motion. This has required using echo-planar techniques, which collect all phase-encoding views by repeated signal measurements,
26

Breast MRI: Using Physics to Maximize Sensitivity and Specificity Hendrick
each with a different amount of phase-encoding, immediately after a single 90o pulse.24-26
While echo-planar imaging is fast, it typically lacks the high spatial resolution of CE-BMRI and suffers some geometric distortion. Echo-planar images typically require larger FOVs (20-25 cm) and limited matrix sizes (128 x 128 is typically maximal), yielding larger pixel sizes than state-of-the-art CE-BMRI. Measurements of ADCav by Sinha, et.al., showed a distinction between mean ADCav values for fibroglandular tissues (2.37x10⁻³ mm2/s), cysts (2.65x10⁻³ mm2/s), benign lesions (2.01x10⁻³ mm2/s), and malignant lesions (1.60x10⁻³ mm2/s).35,36 Some overlap existed between ADCav values, however, and the numbers of measurements in each tissue type was limited: 16 measurements in normal tissue, 6 cysts, 6 benign lesions, and 17 malignant lesions. Still, this method holds some promise for providing adjunctive information that may help separate benign from malignant enhancing lesions. Perfusion Imaging of the Breast Perfusion imaging can be performed with or without a contrast agent. Without a contrast agent (endogenous perfusion imaging), perfusion is measured by spin labeling that saturates incoming intravascular protons in water.37,38 The measurement of the subsequent blood signal combines the effect of the saturated blood (which should produce no signal) with unsaturated blood (which has maximum signal). The measured signal is the combined effect of black blood and visible blood, which gives information about the perfusion of the saturated into the unsaturated blood pool. This method does not require contrast agents, but produces relatively small effects, especially in tissues like breast lesions, where blood volume in vessels and perfusion in lesions is limited. Perfusion measurement with a contrast agent requires very high temporal resolution (on the order of a few seconds) to be sensitive to the rapid changes in signal that occur as contrast agents enter the pre-selected region of interest, in this case an enhancing breast lesion. The basic concept is that during the first bolus of perfusing contrast agent, the magnetic susceptibility (T2*) of protons in the blood is shortened, thus decreasing the signal observed in T2*-weighted imaging sequences. To be sensitive to the effect of Gd-chelates on magnetic susceptibility, either gradient-echo or gradient echo-planar imaging techniques are used. Voxels with more signal loss on T2*-weighted sequences during the Gd-chelate bolus would indicate areas with greater vascular perfusion.39,40 Kuhl, et.al., compared T2*-weighted perfusion imaging of the breast to T1-weighted CE-BMRI in a study of 18 subjects.41 They found that malignant lesions showed a strong perfusion-related signal loss due to T2* shortening on gradient-echo imaging compared to benign lesions such as fibroadenomas. An animal study in rats demonstrated that T2*-weighted first pass perfusion imaging allowed differentiation between implanted fibroadenomas and breast carcinomas, where T1-weighted dynamic CE-BMRI sequences failed to reveal a difference between the two lesion types.42
27

Breast MRI: Using Physics to Maximize Sensitivity and Specificity Hendrick
A larger clinical study by Kvistad, et.al., involving 130 subjects compared the effect of Gd-DTPA-BHA (Omniscan, Nycomed Amersham) on separation between benign and malignant lesions using both T1-weighted gradient-echo and T2*-weighted gradient-echo sequences.43 Using separate injections of 0.1 mmol/kg followed by 20 ml of saline, they found that the average T1-based signal increase was 83% + 74% for benign lesions and 179% + 87% for malignant lesions. This yielded a significant difference in average signal changes between benign and malignant lesions (p<0.001), but there was significant signal overlap between the two groups. When the same lesions were studied with first pass perfusion T2*-weighted imaging, the mean signal loss was 9% + 7% for benign lesions and 31% + 15% for malignant lesions. This difference was also highly significant (p<0.001), and signal change between benign and malignant had less overlap, in that +/- one standard deviation error bars were distinct for T2*-weighted first pass perfusion imaging, but were not distinct for T1-weighted imaging. The time scale of signal increase in breast cancers using T1-weighted sequences was on the order of 1-2 minutes after contrast agent administration, while the time scale of signal loss in breast cancers using T2*-weighted sequences was within 15-20 seconds of contrast agent administration.43 The authors concluded that two different biological processes were at work. The signal increase of cancers on T1-weighted sequences was attributed to Gd-chelates entering the extravascular spaces in the vicinity of breast cancers due to leaky vessels. The signal decrease of cancers on T2*-weighted sequences was due to magnetic susceptibility effects of Gd-chelates within the vascular bed of cancers. This difference in biological process (extravascular vs. intravascular) may explain the longer time scale of T1 effects compared to T2*-effects. Another recent study by Delille, et.al., used gradient echo-planar imaging on 13 subjects to measure blood flow and blood volume.44 They found that both blood flow and blood volume were increased in malignant lesions compared to normal breast tissues, but did not test improved specificity from this technique by comparing its results on both benign and malignant lesions. Choline Peak in Proton Spectroscopy
An interesting new technique to increase the specificity of CE-BMRI choline
spectroscopy. It is well established that phosphocholine (PC) and total choline (tCho) are elevated in prostate, liver, brain, and breast cancers. In vitro 1H and 31P spectroscopy have demonstrated high levels of PC in tissue extracts from breast cancers, while low levels were measured in extracts from normal and benign breast tissues. For example, Gribbestad, et.al, 1999, analyzed human breast tissue extracts using 1H spectroscopy, finding PC levels of 0.79 +/- 0.55 mM in cancer tissue extracts, compared to 0.029 +/- 0.027 mM in normal breast tissue extracts.45 Total choline from 1H spectroscopy was 1.19 +/-0.64 mM in breast cancer extracts, compared to 0.082 +/- 0.062 mM in normal breast extracts. 31P spectroscopy has been used to measure PC, phosphoehanolamine
28

Breast MRI: Using Physics to Maximize Sensitivity and Specificity Hendrick
(PE), and phosphomonoesters (PME) at elevated levels in breast cancer extracts compared to normal breast tissues.46,47
The increase in total choline signal measured in 1H spectrospcopy, is believed to
be the result of a switch in the phenotype of phosphocholines that occurs as cells become malignant. Studies using human breast cell lines indicate that the glycerophosphocholine (GPC) in normal cells is transformed to PC as cells become malignant, with a stepwise increase in PC as tissues progress through the stages of invasive breast cancer.48 As PC increases, the total choline peak increases, as measured by 1H spectroscopy. 31P spectroscopy measures a change in the levels of phosphomonoesters (PME) and phosphodiesters (PDE), but 31P spectroscopy measuring PME and PDE appears to be less sensitive to changes between benign and malignant cells than 1H spectroscopy measuring tCho. Moreover, 1H spectroscopy can be performed with the same receiver coils and narrowband amplifiers used for proton imaging, while 31P spectroscopy requires separate coils and separately tuned or broadband amplifiers that are less commonly available. Table 5: Summary of 1H Choline Spectroscopy Studies Author Number of (Yr Pub) Subjects Sensitivity Specificity Roebuck et.al. (1998) 17 70% 86% Gribbestad et.al. (1998) 12 (cancer cases only) Kvistad et.al. (1999) 22 82% 82% Yeung et.al. ( 2001) 30 92% 83% Jagannathan et.al. (2001) 67 78% 86% Thomas et.al. (2001) 8 67% (only 2 benign lesions) Cecil et.al. (2001) 38 83% 87% Katz-Brull (2002)* 153 83%* 85%* (92%)** (92%)** Notes: * summary of all previous studies listed
** results when technical failures were excluded A number of in vivo 1H spectroscopy studies have been performed to assess the
sensitivity and specificity of choline spectroscopy to breast cancer.49-56 Almost all have been performed at 1.5 T using single-voxel spectroscopy with minimum voxel sizes of 1 cm on a side. Most used the criterion of a discernable choline peak as indication of malignancy. Most have been performed on small study groups that including larger than average breast lesions. Table 5 presents a summary of these studies, along with their sensitivities and specificities. The paper by Katz-Brull, et.al., summarizes the data from the previous 7 studies listed in Table 5. 57
Another study by Yeung, et.al, investigated the use of a choline peak in proton
spectroscopy to evaluate the presence of metastatic cancer in axillary lymph nodes.58
29

Breast MRI: Using Physics to Maximize Sensitivity and Specificity Hendrick
Their results for choline (SNR>2) as a marker of metastatic cancer in lymph nodes were: sensitivity: 65%, specificity, 100%, compared to histopathology after excisional biopsy.
Preliminary results of in vivo proton spectroscopy at 4.0T on patients before and
24 hours after the start of neoadjuvant therapy suggest that tCho signal may be a sensitive early predictor of tumor response to treatment.59 In a study presented at RSNA 2003, 12 women with biopsy-confirmed breast cancer were examined prior to, and within 24 hours after, initiation of doxorubicin-based chemotherapy by 1H spectroscopy. Among the 6 subjects that showed decreased total choline within 24 hours, 100% showed smaller tumor size by MRI after 12 weeks of treatment.59 The two patients with constant or elevated tCho at 24 hours failed to have an anatomic tumor response to chemotherapy.55
Advances in acquisition methods using variable TE and spatial-spectral selective
pulses show that artifacts produced by large lipid signals can be reduced significantly.56,57 As spectroscopic techniques improve, quantitation of in vivo spectra can be done more reliably.60-63 This permits replacement of the criterion of seeing or not seeing a choline peak with quantitative criteria for judging a breast lesion to be malignant. Spectroscopic Imaging
To date, only one study has been published on spectroscopic imaging of breast
lesions.64 This study was done at 1.5T using a 12 minute single plane spectroscopic imaging technique (1 cm3 voxels) through the most suspicious enhancing region. The acquisition was made in a single 1-cm thick plane with an 18 x 18 cm FOV, yielding an 18 x 18 spectroscopic image based on the total choline 1H signal (Figure 16). A quantitative criterion of total choline SNR > 4 was used to attempt to separate malignant from benign lesions, with promising results (Figure 17). This criterion led to a sensitivity of 87% and a specificity of 85%. Among the 18 study subjects, there were 3 technical failures due to patient motion, inadequate lipid suppression, and computer failure.
Figure 16: Water, choline, and lipid images derived from 1H spectroscopic data. Reprinted from reference 64, with permission from the Journal of Magnetic Resonance Imaging.
30

Breast MRI: Using Physics to Maximize Sensitivity and Specificity Hendrick
Figure 17: Choline SNR in 1H spectroscopic imaging at 1.5T. Results indicate that a criterion of SNR > 4 provides good separation of malignant from benign lesions. Reprinted from reference 64, with permission from the Journal of Magnetic Resonance Imaging.
While these new techniques hold the promise of increased specificity to breast cancer, the current gold standard for specificity, once a lesion has been identified, is core biopsy. There are a number of MR-compatible systems available for core biopsy guided by breast MRI, which are covered elsewhere in this syllabus. Conclusions Properly performing breast MRI increases its sensitivity to breast cancer. This requires careful attention to technical details to maximize image quality, lesion conspicuity, and the probability of detecting breast cancer when it is present. In this article, I have presented ten steps to maximize the sensitivity and specificity of high quality breast MRI to cancer detection. In addition, we have mentioned some of the techniques currently under investigation that may help add specificity to breast MRI. Currently, however, to maximize specificity, there is no substitute for image-guided core biopsy of suspicious breast lesions seen on mammography, ultrasound, or breast MRI.
31

Breast MRI: Using Physics to Maximize Sensitivity and Specificity Hendrick
References: 1. Ross RJ, Thompson JS, Kim K, et al: Nuclear magnetic resonance imaging and evaluation of human breast tissue: preliminary clinical trials. Radiology 1982; 143: 195-205. 2. El Yousef SJ, Alfidi RJ, Duchesnau RH, et al: Initial experience with nuclear magnetic resonance (NMR) imaging of the human breast, J Comput Assist Tomogr. 1983; 7: 215. 3. McSweeney MB, Small WC, Cerny V, et al: Magnetic resonance imaging in the diagnosis of breast disease: use of transverse relaxation times, Radiology 1984; 153: 741-744. 4. Merchant TE, Thelissen GR, deGraaf PW, et.al. Application of a mixed imaging sequence for MR imaging characterization of human breast disease. Acta Radiologica 1993; 34(4): 356-361. 5. Kuhl CK, Klaschik S, Mielcarek P, et.al. Do T2-weighted pulse sequences help with the differential diagnosis of enhancing lesions in dynamic breast MRI? J. Magn. Reson. Imaging 1999; 9:187-196. 6. Jacobs MA, Barker PB, Bluemke DA, et.al. Benign and malignant breast lesions: diagnosis with multiparametric MR imaging. Radiology 2003; 229: 225-232. 7. Heywang SH, Hahn D, Schmidt H, et.al. MR imaging of the breast using Gd-DTPA. J. Comput. Assist. Tomogr. 1986; 10: 615-620. 8. Heywang SH, Bassermann R, Fenzl G, et.al. MRI of the breast: histopathologic correlation. Eur J Radiol 1987; 7: 175-182. 9. Weinreb JC, Newstead G. MR imaging of the breast. Radiology 196: 593-610, 1995. 10. Davis PL, McCarty KS Jr. Sensitivity of enhanced MRI for detection of breast cancer: new, multicentric, residual, and recurrent. Eur. Radiol. 1997; 7: S289-S298. 11. Orel SG, Schnall MD. MR imaging of the breast for the detection, diagnosis, and staging of breast cancer. Radiology 2001; 220: 13-30. 12. Heywang-Kobrunner SH, Dershaw DD, Schreer I. Diagnostic Breast Imaging. Stuttgart, New York: Thieme Publishing Co., 2001. 13. Morris EA. Breast cancer imaging with MRI. Radiol Clin North Am 2002; 40: 443-466.
32

Breast MRI: Using Physics to Maximize Sensitivity and Specificity Hendrick
14. Heywang-Koebrunner SH, Haustein J, Pohl C, et.al. Contrast-enhanced MRI of the breast: comparison of two dosages. Radiology 1994; 191: 639-646. 15. Runge VM, Nelson KL. Contrast agents. In DD Stark and WG Bradley, eds. Magnetic Resonance Imaging, 3rd Edition. St. Louis: C. V. Mosby Publishing Co., 1999, 257-275. 16. Hendrick RE, Haake EM. Basic physics of contrast agents and maximization of image contrast. J. Magn. Reson. Imaging 1993; 3: 137-148. 17. Harms SE, Flamig DP, Hensley KL, et al. MR imaging of the breast with rotating delivery of excitation off-resonance: clinical experience with pathologic correlation. Radiology 1993; 187: 493-501. 18. Harms SE. Staging for breast cancer treatment. In DD Stark and WG Bradley, eds. Magnetic Resonance Imaging, 3rd Edition. St. Louis: C.V. Mosby Publishing Co., 1999; 321-333. 19. Bootes C, Barentsz JO, Mus RD, et al. MR characterization of suspicious breast lesions with a gadolinium-enhanced turbo-FLASH subtraction technique. Radiology 1994; 193: 777-781. 20. Kuhl CK, Mielcarek P, Klaschik S, et al. Dynamic breast MR imaging: are signal intensity time course data useful for differential diagnosis of enhancing lesions? Radiology 1999; 211: 101-110.
21. American College of Radiology (ACR). ACR BI-RADSR – Magnetic Resonance Imaging. In ACR Breast Imaging Reporting and Data System, Breast Imaging Atlas. Reston, VA. American College of Radiology; 2003. 22. Hahn EL. Spin echoes. Phys. Rev. 1950; 80; 580. 23. Hendrick RE. Image Contrast and Noise, In DD Stark and WG Bradley, eds. Magnetic Resonance Imaging, 3rd Edition. St. Louis: C.V. Mosby Publishing Co., 1999; 66-83. 24. Hennig J, Nauerth A, Friedburg H. RARE imaging: a fast imaging method for clinical MR. Magn. Reson. Med. 1986; 3: 823-828. 25. Bradley WG, Chen D-Y, Atkinson J, Edelman RE. Fast spin-echo and echo-planar imaging. In DD Stark and WG Bradley, eds. Magnetic Resonance Imaging, 3rd Edition.St. Louis: C.V. Mosby Publishing Co., 1999; 125-157. 26. Haacke EM, et.al. Magnetic resonance imaging: physical principles and sequence design. New York: Wiley-Liss, 1999. See especially Chapters 8-10, p. 111-204.
33

Breast MRI: Using Physics to Maximize Sensitivity and Specificity Hendrick
27. Hasse A, Frahm J, Matthaei D,et al. FLASH imaging: rapid NMR imaging using low flip angle pulses. J. Magn. Reson. 1986; 67: 258-262. 28. Frahm J, Haenicke W. Rapid scan techniques. In DD Stark and WG Bradley, eds. Magnetic Resonance Imaging, 3rd ed. St. Louis: C.V. Mosby Publishing Co., 1999; 87-124. 29. Edelstein WA, Glover GH, Hardy CJ, Redington RW. The intrinsic signal-to-noise ratio in NMR imaging. Magn. Reson. Med. 1986; 3: 604-610. 30. Fischer U, Kopka L, Grabbe E. Breast carcinoma: effect of preoperative contrast-enhanced MR imaging on the therapeutic approach. Radiology 1999; 213; 881-888. 31. Liberman L, Morris EA, Kim CM, et.al. MR imaging findings in the contralateral breast of women with recently diagnosed breast cancer. Am. J. Roentgenol., 2003; 180: 333 - 341. 32. Dietrich O, Nikolaou K, Wintersperger BJ, et.al. iPAT: Application for fast and cardiovascular MR imaging. Electromedica 2002; 70: 133-145. 33. Joe BN, Bae KT, Chen VY, et.al. Dynamic MR contrast enhancement characteristics of breast cancer: effect of contrast injection rate (Abstract). Radiology 2003; RSNA Annual Meeting Abstracts, p. 289. 34. Le Bihan D, et.al. Diffusion MR imaging: clinical application. Am. J. Roentgenol. 1992; 159: 591-599. 35. Sinha S, Sinha U. Functional magnetic resonance of human breast tumors: diffusion and perfusion imaging. Ann NY Acad Sci 2002; 980: 95-115. 36. Sinha S, Lucas-Quesada FA, Sinha U, et.al. In-vivo diffusion-weighted MRI of the breast: potential for lesion characterization. J. Magn. Reson. Imaging 2002; 15: 693-704. 37. Detre JA et.al. Tissue specific perfusion imaging using arterial spin labeling. NMR Biomed. 1994; 7: 75-82. 38. Barbier EL. Methodology of brain perfusion imaging. J. Magn. Reson. Imaging 2001; 13: 496-520. 39. Tofts PS. Modeling tracer kinetics in dynamic Gd-DTPA MR imaging. J. Magn. Reson. Imaging 1997; 7: 91-101. 40. Roberts HC, et.al. Quantitative measurement of microvacular permeability in human brain tumors achieved using dynamic contrast enhanced MR imaging: correlation with histologic grade. Am. J. Neuroradiol. 2000; 21: 891-899.
34
Breast MRI: Using Physics to Maximize Sensitivity and Specificity Hendrick
41. Kuhl CK, et.al. Breast neoplasms: T2* susceptibility-contrast. First-pass perfusion MR imaging. Radiology 1997; 202: 87-95. 42. Helbich T, Roberts TPL, Grossman A, et.al. MR imaging of breast tumors: testing of different analytic methods with gadopentetate (abstract). Eur. Radiol. 1999; 9 (suppl 1): 410. 43. Kvistad KA. Breast lesions: evaluation with dynamic contrast enhanced T1-weighted MR imaging and with T2*-weighted first pass perfusion imaging. Radiology 2000; 216: 545-553. 44. DeLille J, et.al. Breast cancer: regional blood flow and blood volume measured with magnetic susceptibility-based MR imaging – initial results. Radiology 2002; 223: 558-565. 45. Gribbestad IS, Petersen SB, FJosne HE, et.al. 1H NMR spectroscopic characterization of percholric acid extracts from breast carcinomas and non-involved breast tissue. NMR Biomed. 1994; 7: 181-194. 46. Nagandank W. Studies of human tumors by MRS. A review. NMR Biomed 1992; 5: 303-324. 47. Podo F. Tumour phospholipids metabolism. NMR Biomed. 1999; 12: 413-439. 48. Aboagye EO, Bhujwalla ZM. Malignant transformation alters membrane choline phospholipids metabolism of human mammary epithelial cells. Cancer Research 1999; 59: 80-84. 49. Ackerstaff E, Glunde K, Bhujwalla ZM. Choline phospholipids metabolism: a target in cancer cells? Journal of Cellular Biochemistry 2003; 90: 525-533. 50. Roebuck JR, Cecil KM, Schnall MD, Lenkinski RE. Human breast lesions: characterization with proton MR spectroscopy. Radiology 1998; 209: 269-275. 51. Gribbestad IS, Singstad TE, Nilsen G, et al. In vivo H-1 MRS of normal breast and breast tumors using a dedicated double breast coil. J Magn Reson Imaging 1998; 8: 1191-1197. 52. Kvistad KA, Bakken IJ, Gribbestad IS, et al. Characterization of neoplastic and normal human breast tissues with in vivo (1)H MR spectroscopy. J Magn Reson Imaging 1999; 10: 159-164. 53. Yeung DK, Cheung HS, Tse GM. Human breast lesions: characterization with contrast-enhanced in vivo proton MR spectroscopy – initial results. Radiology 2001; 220: 40-46.
35

Breast MRI: Using Physics to Maximize Sensitivity and Specificity Hendrick
54. Jagannathan NR, Kumar M, Seenu V, et al. Evaluation of total choline from in-vivo volume localized proton MR spectroscopy and its response to neoadjuvant chemotherapy in locally advanced breast cancer. Br J Cancer 2001; 84: 1016-1022. 55. Thomas MA, Binesh N, Yue K, DeBruhl N. Volume-localized two-dimensional correlated magnetic resonance spectroscopy of human breast cancer. J Magn Reson Imaging 2001; 14: 181-186. 56. Cecil KM, Schnall MD, Siegelman ES, Lenkinski RE. The evaluation of human breast lesions with magnetic resonance imaging and proton magnetic resonance spectroscopy. Breast Cancer Res Treat 2001; 68: 45-54. 57. Katz-Brull R, Lavin PT, Lenkinski RE. Clinical utility of proton magnetic resonance spectroscopy in characterizing breast lesions. J. Natl. Cancer Inst. 2002; 94: 1197-1203. 58. Yeung DK, Cheung HS, Tse GM. Breast cancer: in vivo proton MR spectroscopy in the characterization of histopathologic subtypes and preliminary observations in axillary node metastases. Radiology 2002; 225: 190-197. 59. Meisamy, et.al. Value of adding MRS to MRI in predicting response to neoadjuvant chemotherapy of locally advanced breast cancer. RSNA Annual Meeting 2003; Scientific Abstract #750, p.492. 60. Bolan, P. J., L. DelaBarre, et al. "Eliminating spurious lipid sidebands in 1H MRS of breast lesions." Magn Reson Med 2002; 48(2): 215-22. 61. Bolan, P. J., S. Meisamy, et al. "In vivo quantification of choline compounds in the breast with 1H MR spectroscopy." Magn Reson Med 2003; 50(6): 1134-1143. 62. Star-Lack, J. M., E. Adalsteinsson, et al. "In vivo 1H MR spectroscopy of human head and neck lymph node metastasis and comparison with oxygen tension measurements." AJNR Am J Neuroradiol 2000; 21(1): 183-93. 63. Gribbestad IS, Sitter B, Lundgren S, Krane J, Axelson D. Metabolite composition in breast tumors examined by proton nuclear magnetic resonance spectroscopy. Anticancer Res 1999; 19: 1737-1746. 64. Jacobs MA, Barker PB, Bottomley PA, et.al. Proton magnetic resonance spectroscopic imaging of human breast cancer: a preliminary study. Journal of Magnetic Resonance Imaging 2004; 19: 68-75.
36