breakdown of covered interest parity: mystery or …all currency pairs is fast becoming a mystery in...
TRANSCRIPT
BIS Papers No 96 57
Breakdown of covered interest parity: mystery or myth?1
Alfred Wong, Jiayue Zhang2
Abstract
The emergence and persistence of basis spreads in cross-currency basis swaps (CCBS) since the global financial crisis have become a mystery in international finance, as they violate the long-standing principle of covered interest parity (CIP). We argue that the phenomenon is no mystery but merely a reflection of the different risks involved between money market and CCBS transactions in the post-crisis era. Empirical results based on seven major currency pairs support our hypothesis that swap dealers behave as if they seek to align the risks of the transactions in pricing CCBS, which causes CIP to break down. We also find that the basis spreads are well arbitraged among the currency pairs, which suggests they are fairly priced. Hence, it is a myth that CCBS basis spreads or CIP deviations are evidence of the market not functioning properly.
Keywords: covered interest parity, FX swap, cross-currency basis swap, basis spread, CIP deviation, Libor-OIS spread, counterparty credit risk, funding liquidity risk.
JEL classification: F31, F32, G15.
1 The authors thank Michelle Chan, Sebastian Edwards, Charles Engel, Tom Fong, Cho-hoi Hui, Michael
Kiley, Catherine Koch, Max Kwong, David Leung, Qi Li, Eli Remolona, Ole Rummel, Asani Sarkar, Hyun Song Shin, Suresh Sundaresan, Vladyslav Sushko, Giorgio Valente and participants of the SEACEN Third Research Week, the Banco Central do Brasil XII Annual Seminar on Risk, Financial Stability and Banking, the HKMA-BIS Conference on the Price, Real and Financial Effects of Exchange Rates, and the FIW-Research Conference on International Economics for valuable comments, suggestions and discussions.
2 Research Department, Hong Kong Monetary Authority. Email: [email protected], [email protected].

58 BIS Papers No 96
1. Introduction
The phenomenon that a basis spread (hereafter referred to as basis for short) has emerged and continues to persist in cross-currency basis swaps (CCBS) for practically all currency pairs is fast becoming a mystery in international finance. The persistence of the basis suggests that covered interest parity (CIP), a long-standing economic principle, no longer holds, which puzzles many economists.3 However, we think this is not as perplexing as it seems.
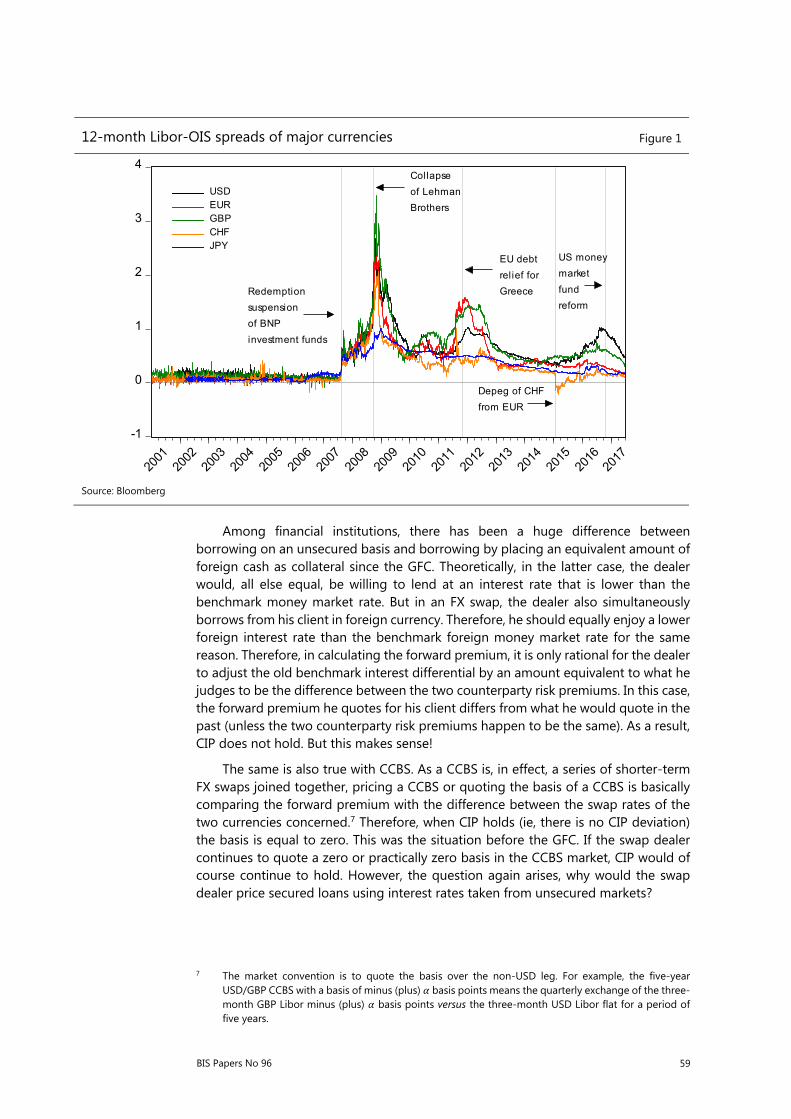
Since the onset of the global financial crisis (GFC), there has been a major reappraisal of counterparty credit risk and funding liquidity risk in global financial markets. This is evident in the sustained spread of the London interbank offered rate (Libor) over the overnight indexed swap (OIS) rate in the interbank funding market across most major currencies (Figure 1). The presence of counterparty risk is extremely important for unsecured lending/borrowing, as the lending party can end up getting nothing back if the other party defaults on the loan. However, swaps are different. They are secured transactions; neither party to the swap takes any counterparty risk. As principals are exchanged at inception, counterparty risk is largely eliminated since the parties effectively hold each other's loan as collateral.4 To understand why basis emerges in the CCBS, or why CIP no longer holds in a market where participants are cautious about counterparty risk, it is useful to understand how swap dealers price FX swaps since a CCBS can be viewed as a series of shorter-term FX swaps.5
From the perspective of the swap dealer, quoting the price of an FX swap when approached by a client is essentially quoting the forward premium or discount.6 It was a simple task before the GFC, as there was little concern for counterparty risk. All the dealer had to do was to multiply the spot exchange rate of the two currencies by their interest differential based on benchmark money market rates such as the Libors. In doing so, he is applying CIP, which basically says the ratio of the forward to spot exchange rates between the foreign and domestic currencies is equal to their interest differential. Today’s money market is different as participants are acutely aware of counterparty and liquidity risks. If the dealer continues to quote the forward premium as he did in the past, then CIP would continue to hold. But this makes no sense, as CIP would then imply that the dealer ignores the fact that the FX swap effectively converts the two unsecured money market loans into secured ones.
3 A recent study even likens CIP to a physical law in international finance (Borio et al (2016)).
4 Counterparty risk refers to the risk of default on each other's loan in this paper. Both parties, however, still take the counterparty risk of the swap itself, which is negligible compared to that of the loan.
5 A swap dealer is a market dealer of swaps who takes positions, and hence also risks, in matching opposite sides of a swap. Textbooks often describe swaps as two parties engaging in transactions directly. However, as one can imagine, it is difficult for a company or financial institution to find another party that can offer exactly what it needs and, at the same time, needs exactly what it can offer. In reality, most of the transactions in the swap market are conducted indirectly through a dealer.
6 The forward premium or discount refers to the difference between the spot and forward exchange rates, depending on whether the difference is positive or negative. In the FX swap market, the forward premium or discount is most commonly quoted in terms of forward or swap points, the number of pips added to or subtracted from the spot rate. We shall hereafter call it the forward premium for brevity, bearing in mind that it can indeed be a discount if it is negative.
BIS Papers No 96 59
Among financial institutions, there has been a huge difference between borrowing on an unsecured basis and borrowing by placing an equivalent amount of foreign cash as collateral since the GFC. Theoretically, in the latter case, the dealer would, all else equal, be willing to lend at an interest rate that is lower than the benchmark money market rate. But in an FX swap, the dealer also simultaneously borrows from his client in foreign currency. Therefore, he should equally enjoy a lower foreign interest rate than the benchmark foreign money market rate for the same reason. Therefore, in calculating the forward premium, it is only rational for the dealer to adjust the old benchmark interest differential by an amount equivalent to what he judges to be the difference between the two counterparty risk premiums. In this case, the forward premium he quotes for his client differs from what he would quote in the past (unless the two counterparty risk premiums happen to be the same). As a result, CIP does not hold. But this makes sense!
The same is also true with CCBS. As a CCBS is, in effect, a series of shorter-term FX swaps joined together, pricing a CCBS or quoting the basis of a CCBS is basically comparing the forward premium with the difference between the swap rates of the two currencies concerned.7 Therefore, when CIP holds (ie, there is no CIP deviation) the basis is equal to zero. This was the situation before the GFC. If the swap dealer continues to quote a zero or practically zero basis in the CCBS market, CIP would of course continue to hold. However, the question again arises, why would the swap dealer price secured loans using interest rates taken from unsecured markets?
7 The market convention is to quote the basis over the non-USD leg. For example, the five-year
USD/GBP CCBS with a basis of minus (plus) basis points means the quarterly exchange of the three-month GBP Libor minus (plus) basis points versus the three-month USD Libor flat for a period of five years.
12-month Libor-OIS spreads of major currencies Figure 1
-1
0
1
2
3
4
2001
2002
2003
2004
2005
2006
2007
2008
2009
2010
2011
2012
2013
2014
2015
2016
2017
USDEURGBPCHFJPY
Redemption
suspension
of BNP
investment funds
EU debt
rel ief for
Greece
Depeg of CHF
from EUR
US money
market
fund
reform
Collapse
of Lehman
Brothers
Source: Bloomberg

60 BIS Papers No 96
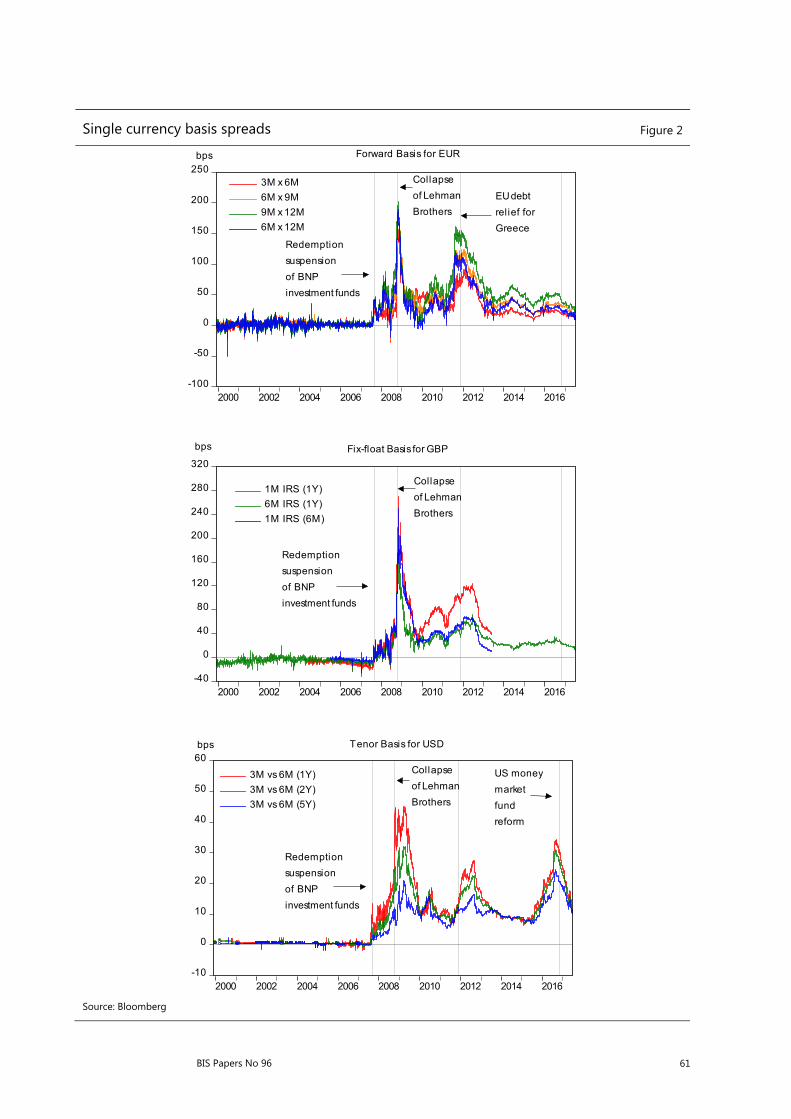
Therefore, it is reasonable to postulate that, in the post-GFC trading environment, the swap dealer behaves as if he seeks to take into account the (absence of) counterparty risks involved when quoting for his client the forward premium in the case of an FX swap or the basis in the case of a CCBS (Wong et al (2016)). This is consistent with the multi-curve modelling approach to interest rate swap (IRS) pricing in finance literature. The classic single-curve model, which worked fine in the pre-crisis era, no longer works post crisis, as the Libor curve is no longer risk-free.8 This causes basis to occur even in the single-currency swap market (Figure 2).9 The multi-curve model tackles the issue by using risk-embedded curves (eg, Libor-based curves) to calculate the expected future cash flows and a risk-free curve to discount them (Bianchetti (2010), Mercurio (2010), Grbac et al (2015)). This pricing methodology dates back to Tuckman & Porfirio (2003) but has gained popularity in practice only after the GFC as counterparty and liquidity risks have surged in the interbank money market (Bianchetti (2010)).10 However, it is imperative to note that the cross-currency swap (ie, FX swap and CCBS) market differs from the single-currency swap (ie, IRS) market in that principals are exchanged in the former but not in the latter.
The collateralised nature of the FX swap or CCBS transaction eliminates only the counterparty risks that are priced into the Libors but not the liquidity risks. The fact that both parties to the transaction swap their principals at inception means they still take a liquidity risk for the funds they lend but receive a liquidity premium for the funds they borrow. Hence, as the counterparty risk premiums in the domestic and foreign money market rates are removed, the difference between the liquidity risk premiums and the difference between the risk-free rates are left in the dealer’s equation in pricing the swap. The presence of the liquidity risk premiums in the price reflects the fact that the liquidity risks of the two parties are swapped in the FX swap or CCBS transaction. This explains why there is still a basis or deviation when one replaces the Libor-differential in the CIP condition with risk-free or near risk-free interest differentials such as OIS spreads, repo spreads or government bond yield spreads(Bottazzi et al (2013), Fukuda (2016), Du et al (2017)). The reason is that these interest rates contain not only minimal counterparty risk premium but also negligible liquidity risk premium.11 However, in the swap market the forward premium must
8 Before the GFC, IRSs were valued using the single-curve model, in which the estimation and
discounting of future cash flows are based on the same interest rate curve, usually a Libor curve. The emergence of counterparty and liquidity risks since the GFC has given rise to bases as the reference interest rates, which are risk-embedded, are no longer consistent with the risk-free nature of the transaction.
9 Single-currency bases can be broadly classified into three types: (i) forward basis, the difference between the Libor-curve-implied forward rate and the traded forward rate agreement rate; (ii) fix-float basis, the deviation of the Libor-curve-implied fixed rate from the swap rate; and (iii) tenor basis, which occurs between two legs of a basis swap indexed to Libors of different tenors.
10 The use of the multi-curve model has essentially become the standard market practice after LCH.Clearnet, which operates SwapClear, announced on June 17, 2010 that it would replace the Libor curve with the OIS curve to discount its entire IRS portfolio after extensive consultation with market participants. See press release by LCH.Clearnet.
11 Theoretically, the liquidity risk premium contained in a repo rate or bond yield depends on the market liquidity of the collateral asset or debt security concerned. The more liquid the asset or security market is, the smaller the funding liquidity risk embedded in the repo rate or bond yield. See Brunnermeier & Pedersen (2009) for a more detailed discussion about the relationship between market liquidity and funding liquidity. Needless to say, the problem will also be compounded by factors that affect the supply of, and demand for, the underlying security other than the opportunity cost of borrowing/lending, eg, the convenience yield.
BIS Papers No 96 61
Single currency basis spreads Figure 2
-100
-50
0
50
100
150
200
250
2000 2002 2004 2006 2008 2010 2012 2014 2016
3M x 6M
6M x 9M
9M x 12M
6M x 12M
Redemption
suspension
of BNP
investment funds
Collapse
of Lehman
Brothers
EU debt
relief for
Greece
-40
0
40
80
120
160
200
240
280
320
2000 2002 2004 2006 2008 2010 2012 2014 2016
1M IRS (1Y)
6M IRS (1Y)
1M IRS (6M)
Redemption
suspension
of BNP
investment funds
Collapse
of Lehman
Brothers
-10
0
10
20
30
40
50
60
2000 2002 2004 2006 2008 2010 2012 2014 2016
3M vs 6M (1Y)
3M vs 6M (2Y)
3M vs 6M (5Y)
Redemption
suspension
of BNP
investment funds
Collapse
of Lehman
Brothers
US money
market
fund
reform
Forward Basis for EUR
Fix-float Basis for GBP
Tenor Basis for USD
bps
bps
bps
Source: Bloomberg

62 BIS Papers No 96
reflect, in addition to the risk-free interest differential, the difference between the liquidity risks that are present in the two money markets. This is supported by the important finding by Rime et al (2017) that CIP deviations based on OIS rates tend to co-move strongly with measures of liquidity premium differentials.
Our explanation, therefore, differs distinctly from previous studies in recent CIP literature, which attribute the phenomenon to a global shortage of US dollars. Earlier ones argue that, during the GFC and in its aftermath, many foreign financial institutions needed US dollars to fund their US conduits but found themselves shut off from the Libor market because US financial institutions were concerned about their counterparty risk (Baba & Packer (2009), Coffey et al (2009), Genberg et al (2009), Fong et al (2010), Hui et al (2011)). As a result, they had to resort to the FX swap and CCBS markets to obtain dollar funding, and paid a premium for it. In these studies, the CIP deviation or CCBS basis essentially reflects this dollar premium. More recent studies relate the shortage of US dollars to regulatory reforms introduced following the GFC, growing demand for dollar hedging, capital and balance sheet constraints, and even global imbalances, which have singly or jointly resulted in limits to arbitrage as reflected by the persistence of the non-zero basis (Ivashina et al (2015), Borio et al (2016), Du et al (2017), Sushko et al (2017)). The phenomenon arguably reflects the special role of the dollar as the global funding currency (Avdjiev et al (2016), Shin (2016)).
Nonetheless, many of these explanations are not necessarily inconsistent with ours. We concur that the basis is a consequence of certain factors or considerations that did not exist before the GFC. The difference, however, is authors of previous studies believe these factors or considerations are external to the reference interest rates used in the pricing of the swap, while we argue that, if any such factors or considerations exist, they would be translated into counterparty or liquidity risk in money market transactions and hence the reference interest rates. For instance, Baba & Packer (2009) try to explain CIP deviation by credit default swap spreads, while Avdjiev et al (2016), Borio et al (2016), Du et al (2017) and Sushko et al (2017) attempt to relate the basis to dollar strength or dollar hedging demand. In our view, all these are already priced in by the Libor-OIS spreads. Indeed, the quarter-end spikes in the basis as observed by Borio et al (2016) and Du et al (2017) are totally consistent with the quarter-end jumps we find in the Libor-OIS spread (Table 1). To them, the greater importance accorded to quarter-end reporting and regulatory ratios following regulatory reforms makes it harder to take arbitrage at those times, which is reflected in the basis. For us, these pressures are detectable in the Libor-OIS spread as they translate into higher funding liquidity risk at quarter ends.
In this paper, we examine the CCBS market for seven currency pairs in the post-GFC era: four involving a dollar leg (USD/EUR, USD/GBP, USD/CHF and USD/JPY) and the other three a euro leg (EUR/GBP, EUR/CHF and EUR/JPY). We find consistent evidence across the currency pairs that the CCBS basis essentially reflects the difference in the counterparty risk premiums embedded in the domestic and foreign money markets. Our results also contribute to the heated debate in literature about the proportions of the counterparty and liquidity risk premiums embedded in the Libor-OIS spread (Michaud & Upper (2008), Sarkar (2009), Acharya & Skeie (2011), Garleanu & Pedersen (2011), Gefang et al (2011), McAndrews et al (2017)). Since the swap market, as we postulate, works as a risk filter that separates the two risk premiums, our model allows us to estimate econometrically the shares of the counterparty and liquidity risk premiums in the spread. For USD/EUR, for example, we find that, in this period, the counterparty risk premium, on average, accounts for

BIS Papers No 96 63
about 22.3% of the total risk premium embedded in the USD Libor, and the liquidity risk premium about 76.1%. The counterparty risk premium contributes 75.8% to the total risk premium embedded in the EUR Libor and the liquidity risk premium only 23.6%. This means the swap dealer subtracts 22.3% of the USD Libor-OIS spread from the USD Libor and 75.8% of the EUR Libor-OIS spread from the EUR Libor in pricing the CCBS.
The implication of our hypothesis that CCBS are fairly priced is also evident in the behaviour of the CCBS market itself. As one can imagine, if market forces are hampered by some constraints or limits, the prices may be arbitrarily determined. However, we find that the CCBS bases relate to each other in a triangular relationship explicable by a matrix with special properties. The relationship suggests that the CCBS market is well arbitraged, although not in the sense of eliminating the basis, and that
Quarter-end spikes in the one-week Libor-OIS spreads Table 1
USD EUR GBP CHF JPY Panel
Whole period
Constant 0.1257*** 0.0460* 0.0917*** -0.0758*** 0.0366*** 0.0522***
(0.0184) (0.0250) (0.0146) (0.0208) (0.0072) (0.0017)
Quarter 0.0528*** 0.0275** 0.0182** 0.0092 0.0100** 0.0247***
(0.0085) (0.0135) (0.0071) (0.0167) (0.0047) (0.0063)
Obs. 2501 2535 2501 1815 2255 11607
R-squared 0.0023 0.0041 0.0011 0.0002 0.0010 0.1217
Positive interest rate period
Constant 0.0735** 0.0250*** 0.0417***
(0.0291) (0.0060) (0.0105)
Quarter 0.0398** 0.0230*** 0.0170***
(0.0201) (0.0065) (0.0053)
Obs. 1,751 1,244 1,896
R-squared 0.0069 0.0023 0.0027
Negative interest rate period
Constant -0.0156 -0.2951*** 0.0092
(0.0070) (0.0055) (0.0609)
Quarter 0.0056** -0.0242*** -0.0259*
(0.0024) (0.0084) (0.0141)
Obs. 784 571 359
R-squared 0.0047 0.0109 0.0322
1. Quarter is a dummy variable that equals one when the observation is within the last five trading days of a quarter, and equals zero otherwise.
2. Regressions for individual currencies are estimated using Newey-West standard errors with 65 lags (average number of trading days in a quarter) and pre-whitening with 22 lags (average number of trading days in a month). The panel regression includes currency fixed effects.
3. The whole sample period spans from August 9, 2007, to June 30, 2017, which is divided into positive and negative interest rate periods depending on the currency (if applicable). The negative interest rate period for EUR, CHF and JPY starts from June 14, 2014; January 15, 2015; and January 29, 2016, respectively.

64 BIS Papers No 96
the bases are not arbitrarily determined but fairly priced.12 We argue that the well-arbitraged non-zero bases are driven by the difference between the counterparty risks of the two money markets concerned but acknowledge the possibility that they are determined by the limits to arbitrage caused by plausible constraints such as capital charges resulting from recent regulatory reforms. Nonetheless, the persistence of the bases (especially those between two non-USD currencies) and the considerable differences among them (even between the currency pairs with a USD leg) challenge the notion that CIP deviation or CCBS basis is essentially a dollar phenomenon.13
This paper is organised as follows. In the next section, we set out the model and discuss the data. Section 3 shows that the CCBS market is a well-arbitraged market and that our empirical results support the risk-adjusted version of CIP. Section 4 concludes.
2. Model and data
2.1 Model
We employ an approach similar to that adopted by Wong et al (2017) using forward point as the dependent variable to estimate the average share of counterparty risks and liquidity risks associated with different currencies in the Libor market. Since the dependent variable, forward premium, and independent variables, Libor and OIS of domestic and foreign currencies each have a unit root, we take the first difference of all variables to build the unrestricted model: ∆ = + ∆ + ∆ + ∆ + ∆ +
where the dependent variable, , is the annualised forward premium defined as the annualised log difference between the -year forward and spot exchange rates, ie, , − / ; The independent variables, and , refer to the OIS rates of foreign and domestic currencies respectively; and refer to the IRS rates of foreign and domestic currencies respectively; is the error term; ∆ is the first difference operator.
In the unrestricted model, the absolute values of the coefficients of the risk-free rates, and , represent the shares of counterparty risk premium in the total risk premium for foreign and domestic currencies respectively, and the absolute values of the coefficients of the interbank borrowing rates, and , represent the shares of liquidity risk in the total risk premium. According to our proposed theory of decomposing the CCBS basis, the constant is expected to be zero, and the coefficients of IRS and OIS of the foreign (domestic) currency should sum to unity. Therefore, we develop our hypotheses below.
Hypothesis 1: = 0
Hypothesis 2a: + = 1
12 The triangular relationship does not imply that CIP holds, as the triangular arbitrage is different from
the conventional CIP arbitrage.
13 The fact that bases have also emerged and persisted in the single-currency swap market for practically all currencies provides further evidence that the phenomenon is no privilege of the dollar (Figure 2). Basis is principally an outcome of swapping two interest rates whose underlying risks are not aligned with the nature of the transaction.
BIS Papers No 96 65
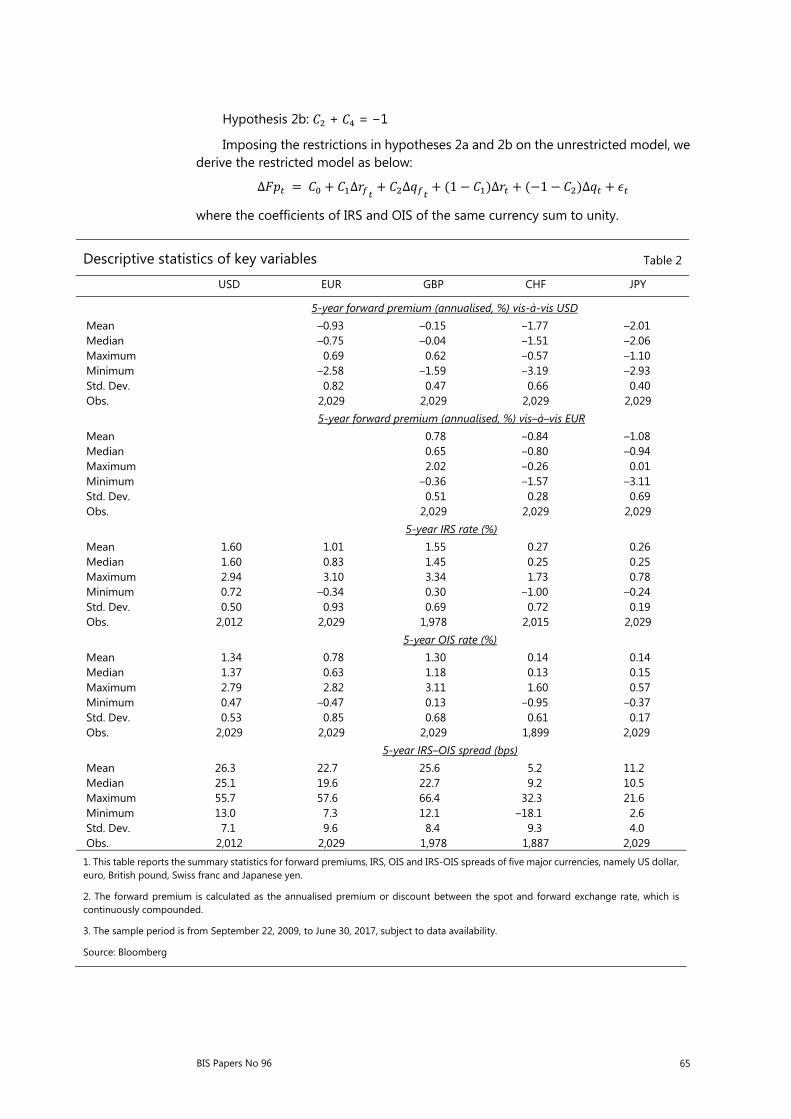
Hypothesis 2b: + = −1
Imposing the restrictions in hypotheses 2a and 2b on the unrestricted model, we derive the restricted model as below: ∆ = + ∆ + ∆ + (1 − )∆ + (−1 − )∆ +
where the coefficients of IRS and OIS of the same currency sum to unity.
Descriptive statistics of key variables Table 2
USD EUR GBP CHF JPY
5-year forward premium (annualised, %) vis-à-vis USD Mean –0.93 –0.15 –1.77 –2.01 Median –0.75 –0.04 –1.51 –2.06 Maximum 0.69 0.62 –0.57 –1.10 Minimum –2.58 –1.59 –3.19 –2.93 Std. Dev. 0.82 0.47 0.66 0.40 Obs. 2,029 2,029 2,029 2,029
5-year forward premium (annualised, %) vis–à–vis EUR Mean 0.78 –0.84 –1.08 Median 0.65 –0.80 –0.94 Maximum 2.02 –0.26 0.01 Minimum –0.36 –1.57 –3.11 Std. Dev. 0.51 0.28 0.69 Obs. 2,029 2,029 2,029
5-year IRS rate (%) Mean 1.60 1.01 1.55 0.27 0.26 Median 1.60 0.83 1.45 0.25 0.25 Maximum 2.94 3.10 3.34 1.73 0.78 Minimum 0.72 –0.34 0.30 –1.00 –0.24 Std. Dev. 0.50 0.93 0.69 0.72 0.19 Obs. 2,012 2,029 1,978 2,015 2,029 5-year OIS rate (%) Mean 1.34 0.78 1.30 0.14 0.14 Median 1.37 0.63 1.18 0.13 0.15 Maximum 2.79 2.82 3.11 1.60 0.57 Minimum 0.47 –0.47 0.13 –0.95 –0.37 Std. Dev. 0.53 0.85 0.68 0.61 0.17 Obs. 2,029 2,029 2,029 1,899 2,029 5-year IRS–OIS spread (bps) Mean 26.3 22.7 25.6 5.2 11.2 Median 25.1 19.6 22.7 9.2 10.5 Maximum 55.7 57.6 66.4 32.3 21.6 Minimum 13.0 7.3 12.1 –18.1 2.6 Std. Dev. 7.1 9.6 8.4 9.3 4.0 Obs. 2,012 2,029 1,978 1,887 2,029 1. This table reports the summary statistics for forward premiums, IRS, OIS and IRS-OIS spreads of five major currencies, namely US dollar, euro, British pound, Swiss franc and Japanese yen.
2. The forward premium is calculated as the annualised premium or discount between the spot and forward exchange rate, which is continuously compounded.
3. The sample period is from September 22, 2009, to June 30, 2017, subject to data availability.
Source: Bloomberg

66 BIS Papers No 96
2.2 Data
Data employed in this study are all collected from Bloomberg as at the London market close with daily frequency.14 This paper focuses on the world’s most actively traded currencies, namely USD, EUR, GBP, JPY and CHF.15 Among these five currencies, there are a total of 10 possible currency pairs, but only seven of them are actively traded in the CCBS market: four involving a USD leg (namely, USD/EUR, USD/GBP, USD/CHF and USD/JPY) and three a EUR leg (namely, EUR/GBP, EUR/CHF and EUR/JPY). The remaining three pairs of currencies (namely, GBP/CHF, GBP/JPY and CHF/JPY) do not have an active market, and there are no data reported by Bloomberg. Table 2 summarises the descriptive statistics of key variables.
2.2.1 Choice of variables
The spot and forward exchange rates vis-à-vis USD are collected directly from Bloomberg, whereas those vis-à-vis EUR are calculated using the respective exchange rates vis-à-vis USD to keep inconsistency to a minimum.16 The OIS rates for USD, EUR, GBP, CHF and JPY are the effective Fed funds rate, Euro overnight index average, sterling overnight index average, tom/next indexed swap and Tokyo overnight average rate, respectively. Details of each reference rate are summarised in Table 3.
14 Global financial markets are probably most active in London at 6pm out of the three time choices
available from Bloomberg, with the other two being Tokyo, 8pm and New York, 5pm.
15 According to BIS (2014, 2016), the average daily turnover of CCBS involving these currencies accounted for 79.16% of the total in April 2016, and 78.90% in April 2013.
16 While direct quotes of cross exchange rates (ie, non-USD exchange rates) are also available from Bloomberg, data quality for USD exchange rates is much better due to larger trading volumes.
Descriptive statistics of key variables Table 3
USD EUR GBP CHF JPY
IRS rates Reference rate 3M Libor 3M Euribor 3M Libor 3M Libor 3M LiborPayment frequency
Quarterly Annually Quarterly Annually Semi-annually
OIS rates Reference rate Effective Fed
funds rate Euro overnight index average
Sterling overnight index average
Tom/next indexed swap in CHF fixing
Tokyo overnight average rate
Description A weighted average of rates on trades arranged by major brokers
A weighted average of overnight unsecured lending rates in the interbank market, initiated within the euro area by contributing banks
A weighted average rate of unsecured sterling overnight cash transactions brokered in London by WMBA member firms
Based on quotations from approximately 30 reference banks for its Tom/next unsecured lending rate to prime banks, supplied to Cosmorex AG
Based on uncollateralised overnight average call rates for lending among financial institutions, published by Bank of Japan
Published by Federal Reserve Bank New York
European Central Bank
Wholesale Markets Brokers’ Association
Cosmorex AG Bank of Japan
Source: Bloomberg and FTSE Russel
BIS Papers No 96 67
Five-year CCBS basis and CIP deviation Figure 3
-0.8
-0.7
-0.6
-0.5
-0.4
-0.3
-0.2
-0.1
0.0
0.1
IV I II III IV I II III IV I II III IV I II III IV I II III IV I II III IV I II III IV I II
2010 2011 2012 2013 2014 2015 2016 2017
USD/EUR basis
(negative) USD/EUR CIP deviation
-0.2
0.0
0.2
0.4
0.6
0.8
1.0
1.2
IV I II III IV I II III IV I II III IV I II III IV I II III IV I II III IV I II III IV I II
2010 2011 2012 2013 2014 2015 2016 2017
EUR/GBP basis
(negative) EUR/GBP CIP deviation
-0.4
-0.2
0.0
0.2
0.4
0.6
0.8
IV I II III IV I II III IV I II III IV I II III IV I II III IV I II III IV I II III IV I II
2010 2011 2012 2013 2014 2015 2016 2017
USD/GBP basis
(negative) USD/GBP CIP deviation
-0.4
-0.3
-0.2
-0.1
0.0
0.1
0.2
0.3
0.4
0.5
IV I II III IV I II III IV I II III IV I II III IV I II III IV I II III IV I II III IV I II
2010 2011 2012 2013 2014 2015 2016 2017
EUR/CHF basis
(negative) EUR/CHF CIP deviation
-0.8
-0.7
-0.6
-0.5
-0.4
-0.3
-0.2
-0.1
0.0
0.1
IV I II III IV I II III IV I II III IV I II III IV I II III IV I II III IV I II III IV I II
2010 2011 2012 2013 2014 2015 2016 2017
USD/CHF basis
(negative) USD/CHF CIP deviation
-0.8
-0.6
-0.4
-0.2
0.0
0.2
0.4
IV I II III IV I II III IV I II III IV I II III IV I II III IV I II III IV I II III IV I II
2010 2011 2012 2013 2014 2015 2016 2017
EUR/JPY basis
(negative) EUR/JPY CIP deviation
-0.8
-0.7
-0.6
-0.5
-0.4
-0.3
-0.2
-0.1
0.0
0.1
IV I II III IV I II III IV I II III IV I II III IV I II III IV I II III IV I II III IV I II
2010 2011 2012 2013 2014 2015 2016 2017
EUR/JPY basis
(negative) EUR/JPY CIP deviation
Source: Bloomberg
68 BIS Papers No 96
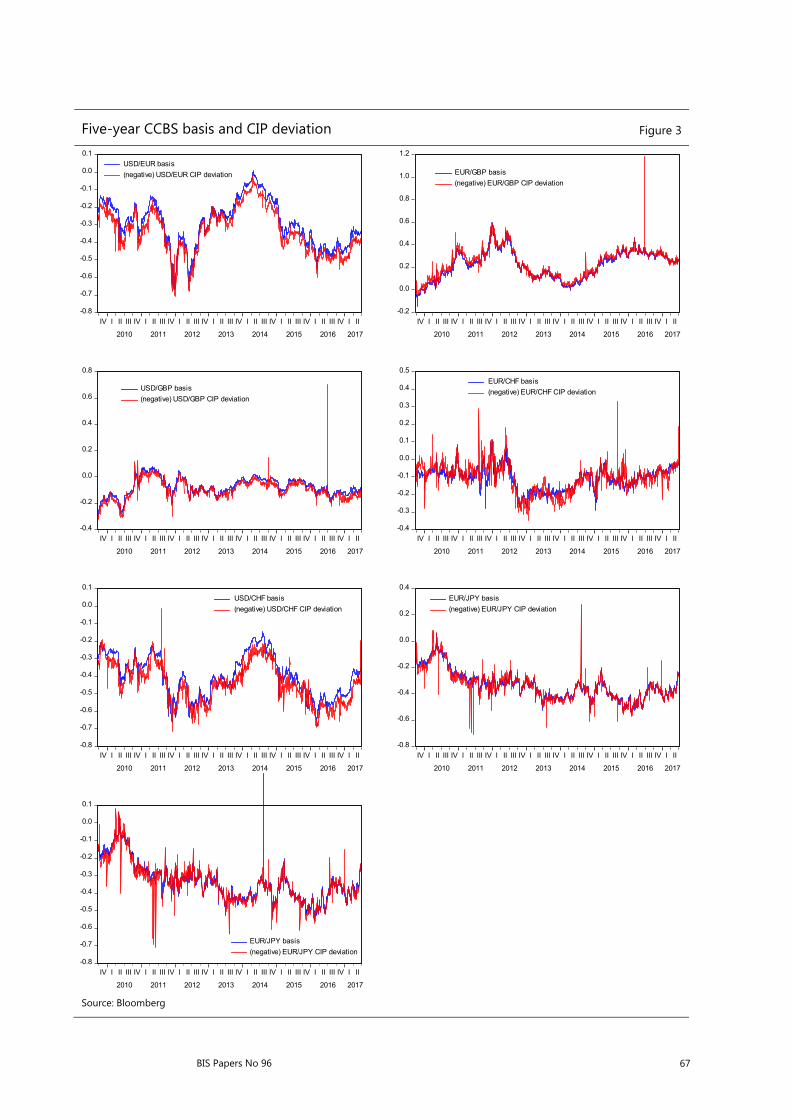
For all currency pairs, the conventional CCBS contracts are based on their three-month interbank offered rates.17 Correspondingly, we use the fixed rates of IRS, which are indexed to three-month Libors and are of five-year tenor as and .18 As can be seen in Figure 3, the CIP deviations closely track the corresponding CCBS bases for all currency pairs.
2.2.2 Choice of sample
Like most previous studies, this paper focuses on the popular five-year tenor. The sample periods are defined by data availability, ranging from 1887 to 2029 observations in each regression. For USD/CHF and EUR/CHF, the sample period is from January 13, 2010 to June 30, 2017, as the CHF OIS rate is only available from January 13, 2010. For the rest of the currency pairs, the sample period covers September 22, 2009 to June 30, 2017, as the five-year USD IRS rate is only available starting from September 21, 2009. To reduce the potential bias caused by data errors, data points lying five or more standard deviations away from the mean are deleted (Charles & Darné (2005)).19
3. Empirical findings
3.1 Basis matrix
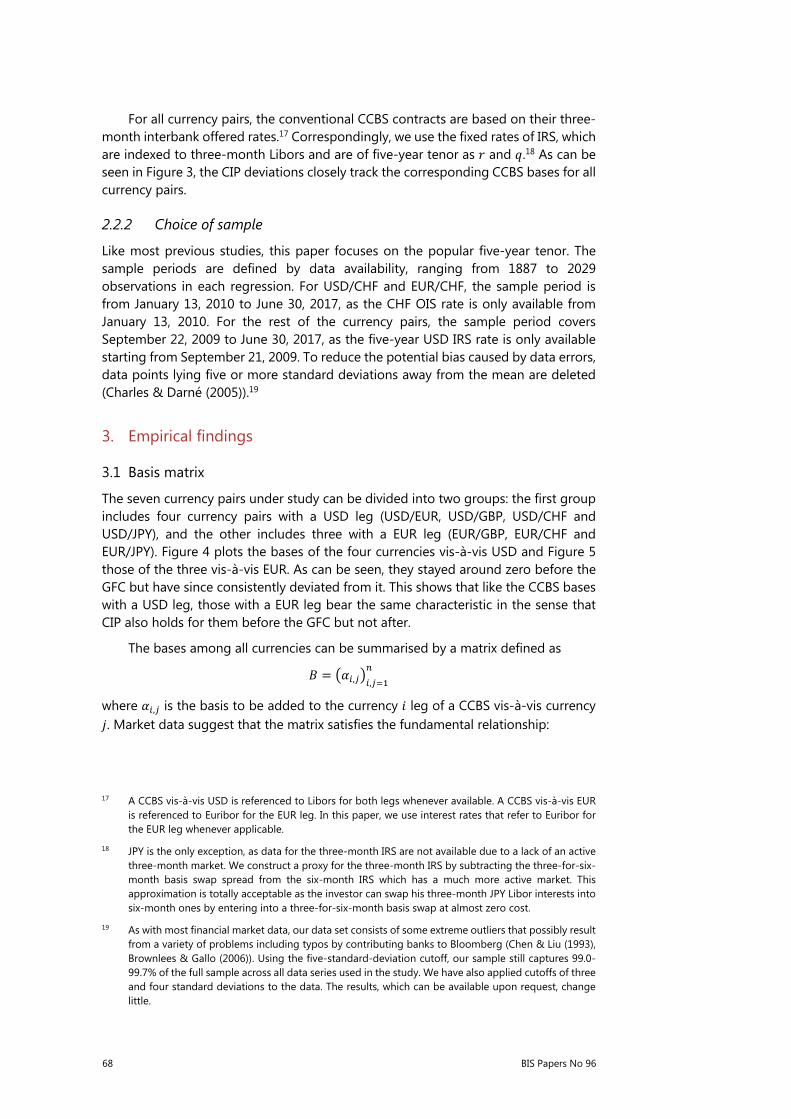
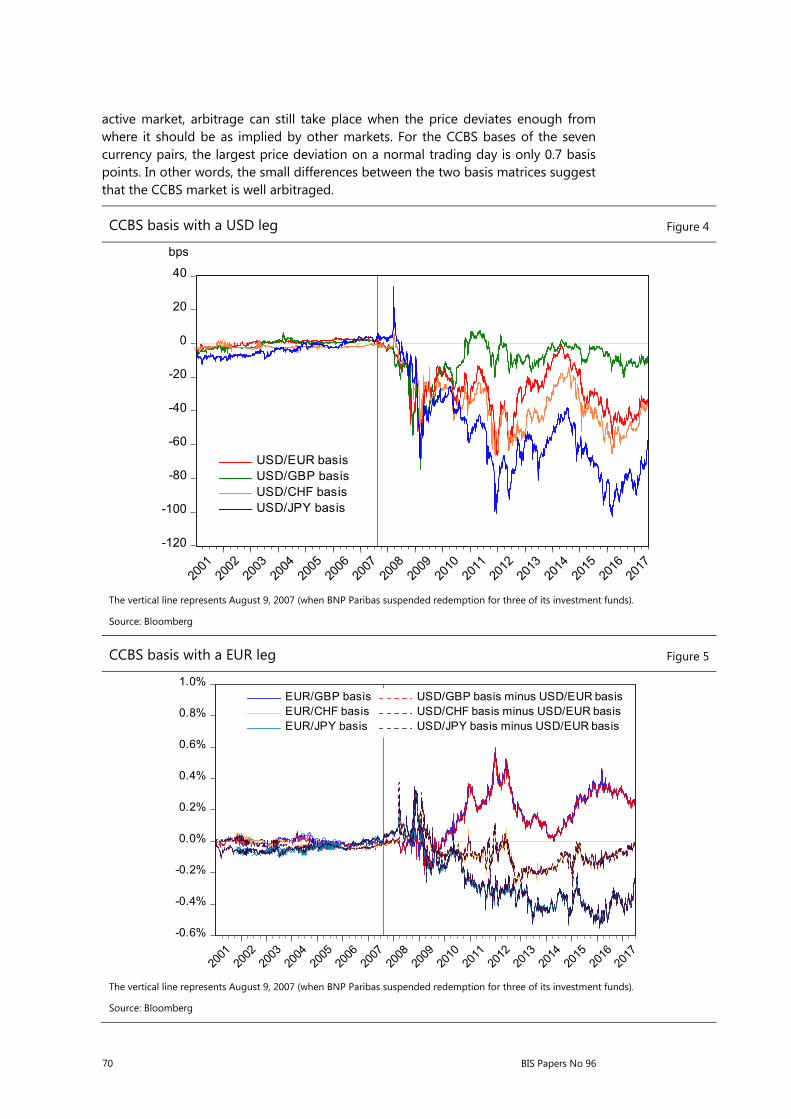
The seven currency pairs under study can be divided into two groups: the first group includes four currency pairs with a USD leg (USD/EUR, USD/GBP, USD/CHF and USD/JPY), and the other includes three with a EUR leg (EUR/GBP, EUR/CHF and EUR/JPY). Figure 4 plots the bases of the four currencies vis-à-vis USD and Figure 5 those of the three vis-à-vis EUR. As can be seen, they stayed around zero before the GFC but have since consistently deviated from it. This shows that like the CCBS bases with a USD leg, those with a EUR leg bear the same characteristic in the sense that CIP also holds for them before the GFC but not after.
The bases among all currencies can be summarised by a matrix defined as = , ,
where , is the basis to be added to the currency leg of a CCBS vis-à-vis currency . Market data suggest that the matrix satisfies the fundamental relationship:
17 A CCBS vis-à-vis USD is referenced to Libors for both legs whenever available. A CCBS vis-à-vis EUR
is referenced to Euribor for the EUR leg. In this paper, we use interest rates that refer to Euribor for the EUR leg whenever applicable.
18 JPY is the only exception, as data for the three-month IRS are not available due to a lack of an active three-month market. We construct a proxy for the three-month IRS by subtracting the three-for-six-month basis swap spread from the six-month IRS which has a much more active market. This approximation is totally acceptable as the investor can swap his three-month JPY Libor interests into six-month ones by entering into a three-for-six-month basis swap at almost zero cost.
19 As with most financial market data, our data set consists of some extreme outliers that possibly result from a variety of problems including typos by contributing banks to Bloomberg (Chen & Liu (1993), Brownlees & Gallo (2006)). Using the five-standard-deviation cutoff, our sample still captures 99.0-99.7% of the full sample across all data series used in the study. We have also applied cutoffs of three and four standard deviations to the data. The results, which can be available upon request, change little.

BIS Papers No 96 69
, + , + , = 0
for , , = 1,2, … , . This relationship suggests that for any three currencies the difference between the bases of any two of them vis-à-vis the third one is equal to the basis involving these two currencies. Figure 5 shows that the difference between the USD/EUR and USD/GBP bases, as depicted by the red dotted line, is always almost the same as the EUR/GBP basis traded in the market. The same is also true for the difference between the USD/EUR and USD/CHF bases, and the EUR/CHF basis; and the difference between the USD/EUR and USD/JPY bases, and the EUR/JPY basis. In our view, this is no coincidence. There must be players actively taking arbitrage in the market, which is reminiscent of what occurs in the FX market, where the exchange rates of any two non-USD currencies vis-à-vis USD can be used to derive the cross exchange rate between them.
To show how large (or small) the arbitrage opportunity is on a usual trading day, we calculate and compare two basis matrices using the data collected at the London market close on June 30, 2017.20 Based on the properties of the basis matrix, we obtain the first matrix using only the CCBS bases with a dollar leg and the second one using only the CCBS bases with a euro leg as follows,
= 0 −33.1 −7.4 −35.5 −57.833.1 0 25.8 −1.9 −24.77.4 −25.8 0 −27.6 −50.435.5 1.9 27.6 0 −22.857.8 24.7 50.4 22.8 0
= 0 −33.1 −6.9 −35.6 −58.533.1 0 26.3 −2.5 −25.46.9 −26.3 0 −28.8 −51.635.6 2.5 28.8 0 −22.958.5 25.4 51.6 22.9 0
where currency 1, 2, 3, 4, 5 represents USD, EUR, GBP, CHF and JPY respectively. As can be seen, the two matrices derived from the first (USD leg) and the second (EUR leg) rows are almost identical, with the largest difference between the corresponding bases being 1.2 basis points for GBP/JPY. However, since there is no active market for GBP/JPY, the largest difference among the seven pairs of currencies traded in the CCBS market actually lies with EUR/JPY, 0.7 basis points.
As discussed earlier, Bloomberg has CCBS basis data only for currency pairs that are actively traded. According to BIS (2016), of the seven pairs, the four pairs with a USD leg have by far considerably larger trading volumes.21 The trading of USD/EUR and USD/JPY is most intense, while that of USD/GBP and USD/CHF is thinner. The transactions for the currency pairs without a USD leg are even smaller. Hence, the currency pairs with a USD leg, especially USD/EUR and USD/JPY, probably dominate the price discovery process whereas those without a USD leg are likely to be price followers. However, the relative small size of a market or its limited price setting power does not a priori impede arbitrage activity. As long as there is a reasonably
20 June 30, 2017, the last day of our sample period, is arbitrarily chosen for illustrative purposes. One
could pick any other day.
21 The following table summarises the average daily turnover of CCBS in April 2016 for the seven currency pairs covered in this study (BIS (2016)).
(in millions of US dollar) EUR GBP CHF JPY USD 17,834 8,157 1,326 17,247 EUR 1,490 235 432
70 BIS Papers No 96
active market, arbitrage can still take place when the price deviates enough from where it should be as implied by other markets. For the CCBS bases of the seven currency pairs, the largest price deviation on a normal trading day is only 0.7 basis points. In other words, the small differences between the two basis matrices suggest that the CCBS market is well arbitraged.
CCBS basis with a USD leg Figure 4
-120
-100
-80
-60
-40
-20
0
20
40
2001
2002
2003
2004
2005
2006
2007
2008
2009
2010
2011
2012
2013
2014
2015
2016
2017
USD/EUR basisUSD/GBP basisUSD/CHF basisUSD/JPY basis
bps
The vertical line represents August 9, 2007 (when BNP Paribas suspended redemption for three of its investment funds).
Source: Bloomberg
CCBS basis with a EUR leg Figure 5
-0.6%
-0.4%
-0.2%
0.0%
0.2%
0.4%
0.6%
0.8%
1.0%
2001
2002
2003
2004
2005
2006
2007
2008
2009
2010
2011
2012
2013
2014
2015
2016
2017
EUR/GBP basis USD/GBP basis minus USD/EUR basisEUR/CHF basis USD/CHF basis minus USD/EUR basisEUR/JPY basis USD/JPY basis minus USD/EUR basis
The vertical line represents August 9, 2007 (when BNP Paribas suspended redemption for three of its investment funds).
Source: Bloomberg

BIS Papers No 96 71
However, it is important to differentiate between this triangular arbitrage and the conventional CIP arbitrage under the new bank regulatory regime. In recent literature, there has been an increasing voice arguing that the persistent non-zero bases must be the result of some quantity constraints (Bottazzi et al (2013), Gabaix & Maggiori (2015), Borio et al (2016), Duffie (2016), Du et al (2017)). One such key constraint arises from bank regulatory reforms, in particular in relation to the risk-weighted and non-risk-weighted capital requirements.22 For the risk-weighted capital requirement the charge, which to a large extent depends on the Value-at-Risk of the net position of the trade, is much smaller for the triangular arbitrage than for the conventional CIP arbitrage. For the non-risk-weighted capital requirement, while the triangular arbitrage involves only the swap positions, the conventional CIP arbitrage also requires the arbitrageur to go long (short) in one money market and short (long) in the other, which increases the size of the balance sheet by the notional of the trade due to these cash market positions. Hence, higher capital charges under the current regulatory regime possibly underscore why the triangular arbitrage works but the conventional CIP arbitrage does not.
Nonetheless, the fact that the no-arbitrage condition of the basis matrix holds does have two important implications. First, it shows that the CCBS bases are not arbitrarily determined, as it may be the case given all plausible constraints. From a microeconomic point of view, they are fairly priced, reflecting the difference between the counterparty risks of the two money markets in the context of the risk-adjusted CIP, or the limits to arbitrage from the perspectives of those in favour of the constraint story. Second, the well-arbitraged CCBS bases are different across currency pairs, even between those with a USD leg. This seems to suggest that the persistence of bases in CCBS is unlikely to reflect a dollar shortage. At best one may argue that the phenomenon is attributable to a relative dollar shortage, eg, a dollar shortage relative to a euro or yen shortage. The same applies for those who try to link the bases to the role of the dollar as a global funding currency. In this connection, the particular challenge to the notion of the breakdown of CIP as a dollar phenomenon is how one accounts for the different bases across currency pairs, eg, why some are more negative than the others.
3.2 Estimation results
A major objective of this study is to find out how the swap dealer sets the forward premium using the domestic and foreign risk-free and risk-embedded interest rates. However, econometrically, unless the interest rates are exogenous, estimating the models by means of ordinary least squares (OLS) potentially invites the problem of endogeneity which, if exists, can cause the estimators to be biased. In particular, the concern about endogeneity arises from simultaneous causality between the forward premium and the four interest rates, as the forward premium may arguably also affect the interest rates.
While the (spot) exchange rate and the interest rates of the two countries concerned are likely to be co-determined, it is hard to imagine the same applies to the relationship between the forward premium (the difference between the spot and forward exchange rates) and the interest rates. Nonetheless, to address the concern,
22 In their example of a five-year CIP trade using CCBS, Du et al (2017) estimate that capital charges
attributable to the risk-weighted capital requirement surge from 0.4% to more than 4% of the notional principal under Basel III, while those due to the non-risk-weighted capital requirement (ie, the leverage ratio) increase by 3%.
72 BIS Papers No 96
we first estimate a model by means of the generalised method of moments (GMM) assuming that endogeneity exists, and then test the validity of this specification. In the GMM model, the endogenous variables are the four interest rates and the exogenous instruments are the one-day to five-day lags of domestic and foreign government bond yields, domestic and foreign bank CDS spreads and the VIX index, all in first difference form. These instruments are hardly affected by the forward premium, but are correlated with the interest rates of the two countries through the risk-free opportunity cost of borrowing, counterparty risk and liquidity risk channels. Based on the GMM estimation, we conduct the Durbin-Wu-Hausman test to examine if the four endogenous variables are exogenous. The results show we cannot reject the null hypothesis that these variables are exogenous at the 10% or higher significance level for the seven currency pairs.23 This means the estimators in the OLS models are unbiased. Since the OLS estimators are more efficient than those in the GMM, we stick with OLS in our final estimation.
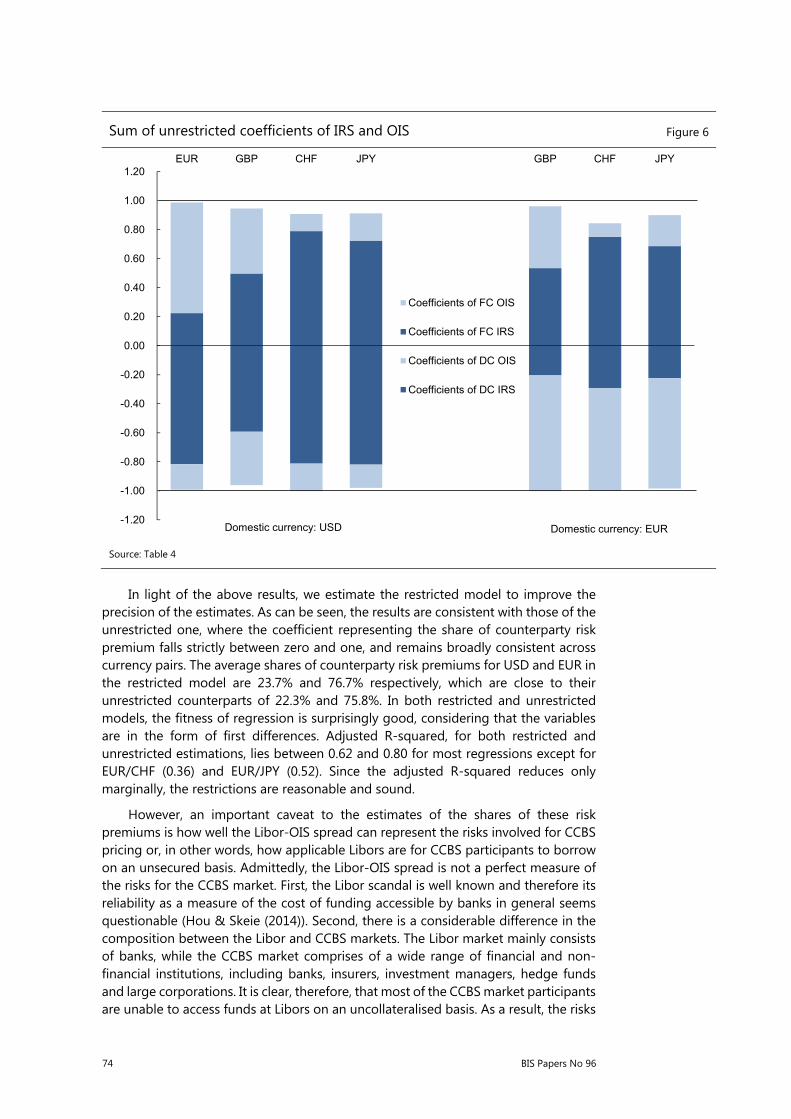
The estimation results are shown in Table 4.24 As can be seen from the first rows in the unrestricted and restricted models, the constant in all regressions are extremely close to zero and statistically insignificant. The estimation results from the unrestricted model support hypotheses 2a and 2b. First, most coefficients are highly significant in the unrestricted models with signs consistent with our expectation. Secondly, all four coefficients ( to ) in each regression fall between zero and one. Thirdly, the sum of the coefficients of IRS and OIS in the same currency is very close to unity. They are plotted in Figure 6 for ease of inspection. For the four currency pairs with a USD leg, ie, USD/EUR, USD/GBP, USD/CHF and USD/JPY, the sum of the shares of counterparty and liquidity risk premiums for USD is 99.2%, 96.1%, 100.2% and 98.0% respectively. For the three currency pairs with a EUR leg, ie, EUR/GBP, EUR/CHF and EUR/JPY, the sum for EUR is 100.3%, 100.1% and 98.5% respectively. To formally examine the validity of hypotheses 2a and 2b, we further apply Wald tests, + =1 and + = 1, on each regression separately. As can be seen from Table 5, eight out of the 14 tests show that we cannot reject hypotheses 2a or 2b at the 10% or higher significant levels. For the other six tests, while we can reject the hypothesis, it is worth noting that the rejection is mainly caused by the small size of the standard errors.
It is also interesting to see that the share of counterparty risk premium associated with any currency is relatively stable regardless of which currency is in the other leg. For example, the share of counterparty risk premiums for USD is 17.5%, 18.9% and 16.1% when the other leg is the EUR, CHF and JPY respectively; that for EUR is 76.2%, 79.9%, 71.0% and 76.1% when the other leg is USD, GBP, CHF and JPY respectively. This indicates that, on average, counterparty risk premium accounts for a consistently smaller share in the total risk premium in the USD Libor market when compared to Libor markets of the other currencies, while counterparty risk premium takes up a much larger share in the EUR Libor market. Perhaps, the only exception is GBP, as the share of counterparty risk premium for USD vis-à-vis GBP is 36.8%, which is still small
23 The Durbin-Wu-Hausman test statistics for each currency pair are listed below. The null hypothesis
is that the first differences of domestic and foreign currency IRS and OIS are exogenous. Curr pairs USD/EUR USD/GBP USD/CHF USD/JPY EUR/GBP EUR/CHF EUR/CHF Diff. in J-stat 3.9757 5.8490 2.7510 5.8828 2.8020 2.3178 4.5259 Probability 0.4093 0.2107 0.6003 0.2081 0.5915 0.6775 0.3395
24 As a robustness check, we conducted the same estimation using winsorised data between 0.5% and 99.5% percentiles. The results are broadly consistent with those using the five-standard-deviation outlier-detection method.

BIS Papers No 96 73
but somewhat larger when compared to the other currencies. Hence, overall, the evidence seems to suggest that the share of counterparty risk premium is perceived to be fairly consistent across the non-USD currencies.
Estimation results of unrestricted and restricted models Table 4
Foreign currency EUR GBP CHF JPY GBP CHF JPY
Unrestricted model USD as domestic currency EUR as domestic currency Constant 0.0000 0.0000 0.0000 0.0000 0.0000 0.0000 0.0000 (0.0000) (0.0000) (0.0000) (0.0000) (0.0000) (0.0000) (0.0000) C1 (FC OIS) 0.7616 *** 0.4480 *** 0.1175 *** 0.1882 *** 0.4262 *** 0.0936 ** 0.2143 *** (0.0382) (0.0446) (0.0346) (0.0643) (0.0505) (0.0365) (0.0694) C2 (DC OIS) -0.1747 *** -0.3682 *** -0.1893 *** -0.1606 *** -0.7986 *** -0.7096 *** -0.7609 *** (0.0333) (0.0386) (0.0556) (0.0495) (0.0486) (0.0723) (0.0629) C3 (FC IRS) 0.2246 *** 0.4979 *** 0.7899 *** 0.7243 *** 0.5343 *** 0.7506 *** 0.6860 *** (0.0368) (0.0445) (0.0453) (0.0703) (0.0514) (0.0483) (0.0742) C4 (DC IRS) -0.8176 *** -0.5927 *** -0.8128 *** -0.8196 *** -0.2042 *** -0.2913 *** -0.2239 *** (0.0329) (0.0376) (0.0548) (0.0495) (0.0468) (0.0699) (0.0616) R-squared 0.7986 0.7104 0.6278 0.6873 0.6398 0.3742 0.5183 Adjusted R-squared 0.7982 0.7098 0.6270 0.6866 0.6390 0.3729 0.5173 DW Statistics 2.3565 2.7895 2.5773 2.5067 2.5514 2.6928 2.6482 Log Likelihood 14317 13587 12275 13400 13477 12328 13460 Restricted model USD as domestic currency EUR as domestic currency Constant 0.0000 0.0000 0.0000 0.0000 0.0000 0.0000 0.0000 (0.0000) (0.0000) (0.0000) (0.0000) (0.0000) (0.0000) (0.0000) C1 0.7717 *** 0.4763 *** 0.1295 *** 0.2129 *** 0.4425 *** 0.1175 *** 0.2499 *** (0.0365) (0.0440) (0.0345) (0.0607) (0.0503) (0.0364) (0.0655) C2 -0.1796 *** -0.3998 *** -0.1997 *** -0.1703 *** -0.7993 *** -0.7238 *** -0.7738 *** (0.0326) (0.0373) (0.0544) (0.0490) (0.0465) (0.0698) (0.0612) R-squared 0.7985 0.7086 0.6254 0.6868 0.6377 0.3643 0.5175 Adjusted R-squared 0.7983 0.7083 0.6250 0.6864 0.6374 0.3636 0.5170 DW Statistics 2.3618 2.8025 2.5797 2.5117 2.5587 2.6781 2.6547 Log Likelihood 14317 13581 12269 13398 13471 12313 13458 1. This table reports the coefficients estimated from the unrestricted and restricted models. Standard errors are included in parentheses.
2. The equations are estimated at daily frequency over the sample period from September 22, 2009, to June 30, 2017, subject to data availability.
3. *, ** and *** denote statistical significance at the 10%, 5% and 1% levels.
Wald test results of unrestricted models Table 5
Foreign currency EUR GBP CHF JPY GBP CHF JPY
Domestic currency is USD Domestic currency is EUR C1 + C3 = 1 (FC) *** *** ** *** *t-statistic -0.9015 -3.4070 -2.8285 -1.6158 -2.3411 -4.1489 -1.8361F-statistic 0.8126 11.6076 8.0005 2.6107 5.4808 17.2132 3.3711p-value 0.3675 0.0007 0.0047 0.1063 0.0193 0.0000 0.0665 C2 + C4 = 1 (DC) *** t-statistic -0.6708 -2.6604 0.1149 -1.3169 0.1343 0.0307 -0.7126F-statistic 0.4499 7.0778 0.0132 1.7343 0.0180 0.0009 0.5078p-value 0.5025 0.0079 0.9086 0.1880 0.8932 0.9755 0.4762
1. This table reports the Wald test t-statistics, F-statistics and p-values of the unrestricted models. For foreign currency and domestic currency, we separately test whether the sum of the coefficients of IRS and OIS is equal to one.
2. *, ** and *** denote statistical significance at 10%, 5% and 1% levels.
74 BIS Papers No 96
In light of the above results, we estimate the restricted model to improve the precision of the estimates. As can be seen, the results are consistent with those of the unrestricted one, where the coefficient representing the share of counterparty risk premium falls strictly between zero and one, and remains broadly consistent across currency pairs. The average shares of counterparty risk premiums for USD and EUR in the restricted model are 23.7% and 76.7% respectively, which are close to their unrestricted counterparts of 22.3% and 75.8%. In both restricted and unrestricted models, the fitness of regression is surprisingly good, considering that the variables are in the form of first differences. Adjusted R-squared, for both restricted and unrestricted estimations, lies between 0.62 and 0.80 for most regressions except for EUR/CHF (0.36) and EUR/JPY (0.52). Since the adjusted R-squared reduces only marginally, the restrictions are reasonable and sound.
However, an important caveat to the estimates of the shares of these risk premiums is how well the Libor-OIS spread can represent the risks involved for CCBS pricing or, in other words, how applicable Libors are for CCBS participants to borrow on an unsecured basis. Admittedly, the Libor-OIS spread is not a perfect measure of the risks for the CCBS market. First, the Libor scandal is well known and therefore its reliability as a measure of the cost of funding accessible by banks in general seems questionable (Hou & Skeie (2014)). Second, there is a considerable difference in the composition between the Libor and CCBS markets. The Libor market mainly consists of banks, while the CCBS market comprises of a wide range of financial and non-financial institutions, including banks, insurers, investment managers, hedge funds and large corporations. It is clear, therefore, that most of the CCBS market participants are unable to access funds at Libors on an uncollateralised basis. As a result, the risks
Sum of unrestricted coefficients of IRS and OIS Figure 6
Source: Table 4
-1.20
-1.00
-0.80
-0.60
-0.40
-0.20
0.00
0.20
0.40
0.60
0.80
1.00
1.20EUR GBP CHF JPY GBP CHF JPY
Coefficients of FC OIS
Coefficients of FC IRS
Coefficients of DC OIS
Coefficients of DC IRS
Domestic currency: USD Domestic currency: EUR
BIS Papers No 96 75
are likely to be underestimated. Nonetheless, the spread is still arguably the best available measure that can serve as a reasonably good approximation of the risks for our estimation, especially since first difference data are employed.
4. Conclusions
The breakdown of CIP is more of a myth in the sense that the returns on investing in different currencies are no longer the same even after exchange rate risk is covered. True, exchange-rate-risk-covered returns, taken at face value, are no longer the same because the uncovered returns, as commonly represented by Libors in testing CIP, consist of considerable counterparty and liquidity risk premiums in today's money market. Hence, CIP breaks down as Libors, which are interest rates for unsecured borrowing/lending, are no longer fit for use in pricing CCBS, which are secured transactions. Therefore, the uncovered returns must be adjusted for the counterparty risks involved in the transaction. This is precisely what the swap dealer is trying to do in the CCBS market.
In short, therefore, the CCBS basis is no mystery. It merely reflects the price adjustment the swap dealer has to undertake in order to make the transaction fair to both sides. This adjustment is absolutely necessary due to one important fact: the counterparty risk in the domestic currency money market differs from that in the foreign currency money market. Therefore, the invalidity or inobservance of CIP as manifested by the non-equivalence between the Libors of two currencies does not mean that the market has failed. Quite the contrary, the change in the behaviour of market participants reflects that the market has functioned particularly well as it prices in the associated risks in CCBS transactions. Expecting CCBS bases to be zero in today’s financial markets is failing to recognise that market participants, in pricing or trading a financial product, must consider the risks that are factored into the prices of its reference financial products instead of taking them at face value. CIP asks the swap dealer to take money market rates at face value. Obviously he would not be obliged to do so.
In this paper, we have argued that the swap dealer behaves as if he seeks to remove the counterparty risk premium in the money market rates when pricing the CCBS. Given that the CCBS basis is the same as the CIP deviation, we have estimated the forward premium using the domestic and foreign OIS rates and IRS rates for seven currency pairs using the risk-adjusted CIP model. The empirical results support our thesis that the forward premium is largely determined by the difference between the weighted averages of OIS and IRS rates for both the domestic and foreign currencies as predicted by the model. Because the swap market, as we argue, functions effectively as a device to separate counterparty risk and liquidity risk, the model also allows us to estimate the shares of the two risk premiums that make up the Libor-OIS spread. Generally speaking, liquidity risk premium, on average, accounts for a much greater proportion relative to counterparty risk premium for USD, while the reverse is true for the other currencies. Hence, the USD lender (cum foreign currency borrower) tends to receive a greater discount from the foreign currency loan, causing the CCBS bases to be negative.
We have also shown that the so-called market anomaly exists not only in the CCBS with a dollar leg but also in those without one. This finding poses a challenge to the economists who argue that CIP deviation or CCBS basis is attributable to a global shortage of US dollars or reflects the role of the US dollar as a global funding
76 BIS Papers No 96
currency, for if it were purely a dollar phenomenon there is no reason why the CCBS bases vis-à-vis USD are considerably different from each other or why cross CCBS bases (ie, those CCBS without a dollar leg) are non-zero. We have further demonstrated how to arbitrage in the CCBS market. Interestingly, we have found that the CCBS bases satisfy a no-arbitrage condition, which means they are not arbitrarily determined but rigorously priced.
References
Acharya, V and D Skeie (2011): “A model of liquidity hoarding and term premia in inter-bank markets”, Journal of Monetary Economics, vol 58, no 5, pp 436–47.
Avdjiev, S, W Du, C Koch and H S Shin (2017): “The dollar, bank leverage and the deviation from covered interest parity”, BIS Working Paper, no 592, July.
Baba, N and F Packer (2009): “Interpreting deviations from covered interest parity during the financial market turmoil of 2007–08”, Journal of Banking and Finance, vol 33, no 11, pp 1953–962.
Bank for International Settlements (2014): Global foreign exchange market turnover in 2013, BIS Triennial Central Bank Survey, February.
——— (2016): Global foreign exchange market turnover in 2016, BIS Triennial Central Bank Survey, September.
Bianchetti, M (2010): “Two curves, one price”, Risk, vol 23, no 8, p 66.
Borio, C, R McCauley, P McGuire and V Sushko (2016): “Covered interest parity lost: understanding the cross-currency basis”, BIS Quarterly Review, September.
Bottazzi, J, J Luque, M Pascoa and S Sundaresan (2013): “Dollar shortage, central bank actions, and the cross currency basis”, paper presented at the 2013 European Meeting of the Econometric Society.
Brownlees, C and G Gallo (2006): “Financial econometric analysis at ultra-high frequency: data handling concerns”, Computational Statistics and Data Analysis, vol 51, no 4, pp 2232–45.
Brunnermeier, M and L Pedersen (2009): “Market liquidity and funding liquidity”, Review of Financial Studies, vol 22, no 6, pp 2201–38.
Charles, A and O Darné (2005): “Outliers and GARCH models in financial data”, Economics Letters, vol 86, no 3, pp 347–52.
Chen, C and L Liu (1993): “Joint estimation of model parameters and outlier effects in time series”, Journal of the American Statistical Association, vol 88, no 421, pp 284–97.
Coffey, N, W Hrung and A Sarkar (2009): “Capital constraints, counterparty risk, and deviations from covered interest rate parity”, Federal Reserve Bank of New York Staff Report, no 393, September.
Du, W, A Tepper and A Verdelhan (2017): “Deviations from covered interest rate parity”, Journal of Finance, forthcoming.
Duffie, D (2016): “Why are big banks offering less liquidity to bond markets?”, Forbes, March.
Fong, W, G Valente and J Fung (2010): “Covered interest arbitrage profits: the role of liquidity and credit risk”, Journal of Banking and Finance, vol 34, no 5, pp 1098–107.
BIS Papers No 96 77
Fukuda, S (2016): “Strong sterling pound and weak European currencies in the crises: evidence from covered interest parity of secured rates”, Journal of the Japanese and International Economies, vol 42, pp 109–22.
Gabaix, X and M Maggiori (2015): “International liquidity and exchange rate dynamics”, The Quarterly Journal of Economics, vol 130, no 3, pp 1369–420.
Garleanu, N and L Pedersen (2011): “Margin-based asset pricing and deviations from the law of one price”, Review of Financial Studies, vol 24, no 6, pp 1980–2022.
Gefang, D, G Koop and S Potter (2011): “Understanding liquidity and credit risks in the financial crisis”, Journal of Empirical Finance, vol 18, no 5, pp 903–14.
Genberg, H, C Hui, A Wong and T Chung (2009): “The link between FX swaps and currency strength during the credit crisis of 2007-2008”, Hong Kong Monetary Authority Research Notes, no 01/2009, February.
Grbac, Z, A Papapantoleon, J Schoenmakers and D Skovmand (2015): “Affine LIBOR models with multiple curves: theory, examples and calibration”, SIAM Journal on Financial Mathematics, vol 6, no 1, pp 984–1025.
Hou, D and D Skeie (2014): “Libor: origins, economics, crisis, scandal, and reform”, Federal Reserve Bank of New York Staff Report, no 667, March.
Hui, C, H Genberg and T Chung (2011): “Funding liquidity risk and deviations from interest-rate parity during the financial crisis of 2007–2009”, International Journal of Finance and Economics, vol 16, no 4, pp 307–23.
Ivashina, V, D Scharfstein and J Stein (2015): “Dollar funding and the lending behavior of global banks”, Quarterly Journal of Economics, vol 130, no 3, pp 1241–81.
McAndrews, J, A Sarkar and Z Wang (2017): “The effect of the term auction facility on the London interbank offered rate”, Journal of Banking and Finance, vol 83, pp 135–52.
Mercurio, F (2010): “Libor market models with stochastic basis”, Bloomberg Education and Quantitative Research Paper, no 2010-05-FRONTIERS.
Michaud, F and C Upper (2008): “What drives interbank rates? Evidence from the Libor panel”, International Banking and Financial Market Developments, vol 3, p 47.
Parker, F (1965): “Matrices in the market place”, Mathematics Magazine, vol 38, no 3, pp 125–28.
Rime, D, A Schrimpf and O Syrstad (2017): “Segmented money markets and covered interest parity arbitrage”, BIS Working Paper, no 651, July.
Sarkar, A (2009): “Liquidity risk, credit risk, and the Federal Reserve’s responses to the crisis”, Financial Markets and Portfolio Management, vol 23, no 4, pp 335–48.
Shin, H S (2016): “Global liquidity and procyclicality”, presentation at the World Bank Conference on the State of Economics, the State of the World. Washington DC, 8 June.
Sushko, V, C Borio, R McCauley and P McGuire (2017): “The failure of covered interest parity: FX hedging demand and costly balance sheets”, BIS Working Papers, no 590, August.
Tuckman, B and P Porfirio (2003): “Interest rate parity, money market basis swaps, and cross-currency basis swaps”, Fixed Income Liquid Markets Research, Lehman Brothers.

78 BIS Papers No 96
Wong, A, D Leung and C Ng (2016): “Risk-adjusted covered interest parity: theory and evidence”, Hong Kong Institute for Monetary Research Working Paper, no 16/2016, https://ssrn.com/abstract=2834798.