brazil's progress toward the future of agriculture cities’ role perspectives
TRANSCRIPT

Brazil's Progress Toward the Future of AgricultureCities’ Role Perspectives
Antonio Oliveira, Ph.D

CGEE - A Brief Description
CGEE ORIGINS
• Created in 2001• Non-profit organization• STI studies for economic
growth competitiveness and well being in Brazil
CONTROLS
• Overseen by the Ministry of Science Technology and Innovation
• Subjected to auditing by Brazilian Supreme Audit Institutions
SIZE AND BUDGET
• Staff ~80 employees• Annual budget 10M US$
STRENGTHS
• ~ 2000 experts from 300 institutions per year
• ~ 400 studies in Science Technology and Innovation

To promote Science, Technology and Innovation to advance economic growth, competitiveness and well-being in Brazil
Mission and core activities
Future StudiesStrategic Evaluation
Information and Knowledge Management
CGEE

The Study

Objective
Identifying integrated courses of action aiming atstrengthening Brazil's proactive role towards thesustainability of food production

Main Challenges

70%
100% Developingcountries
world
2050 Em
tons of grains1 billion
200 mitons of meat
Annual production must increase at least¹:
Grain average growth²
Food demand
Challenges
¹ FAO 2013; ² FAO 2009;

Avoid food waste and losses
¹ FAO (201?); ² TESCO (2013);
World
30 – 50% 1,2 – 2 billion tons per year
-25% of waste =
feed 500 milhões people/year¹
14,5%
In UK (TESCO):
fruits and vegetables
Waste in the UK²
21% 41% 50%
banana²backery items
1,5 Millions of tons/year
Challenges

Workshop with specialists

Dimensions

Key Drivers

Drivers - Population growth
¹ FAO, 2009; ² UN data from Global Harvest Iniative GAP Report, 2011; ³ IBGE, 2013;
2050
In
+ 2,3 billions¹ Major populationgrowth²
total of 9,3 billions
�41%
�49%
“zero growth”
20502042
Brazil³
World
2013
201 mi inhabitants
0 – 1415 – 64
> 6568,4%
7,4%
24,1%
63,2%
22,6%
14,1%
Demographic window
226 miinhabitants
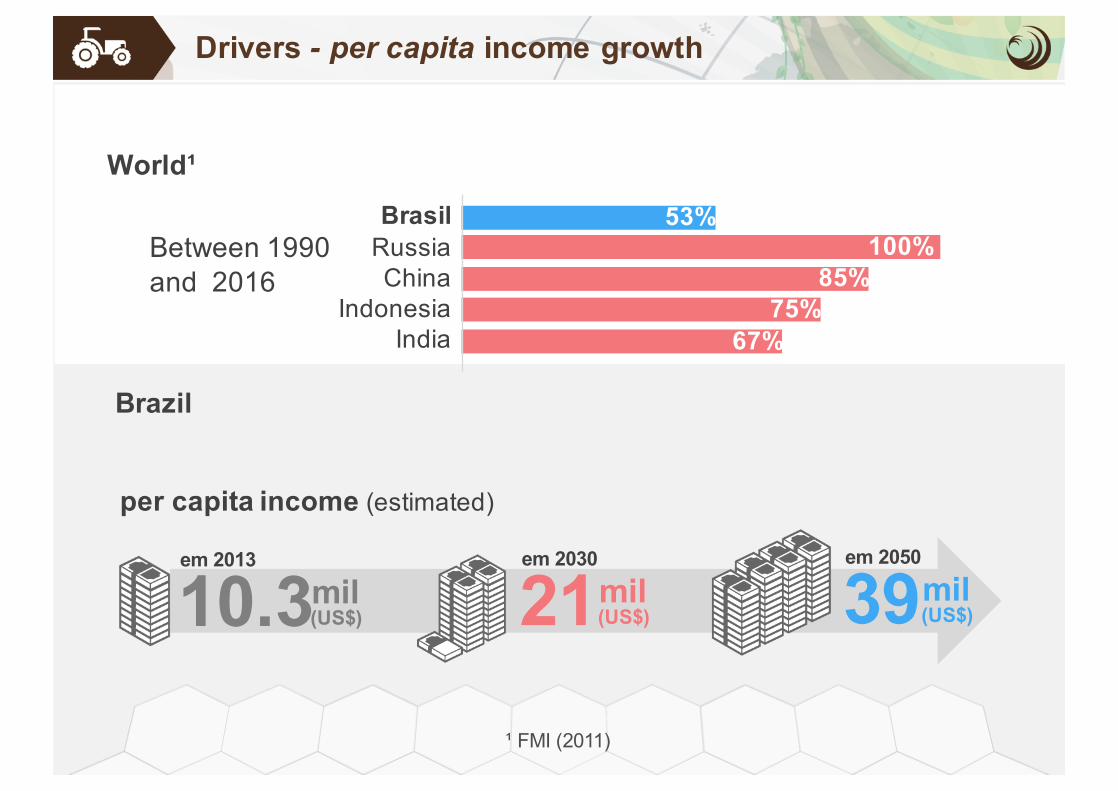
¹ FMI (2011)
per capita income (estimated)
39em 2050
mil(US$)
BrasilRussiaChina
IndonesiaIndia
100% 53%
85% 75%
67%
Brazil
World¹
Between 1990 and 2016
10.3em 2013
mil(US$) 21
em 2030
mil(US$)
Drivers - per capita income growth

¹ World Bank (2014); ² Painel Brasileiro de Mudanças Climáticas- PBMC (2013)
Soya
going up
going down
Sugarcane
+ =35% greenhousegases emissions
Brazil²
World¹ | Greenhouse gases emissions (15%)
18%enteric fermentation
Estimated lossesin 2020: R$ 7,4 bilions
35% 20% 12%
Irrigated rice (paddy)
Enteric fermentation Fertilizers
12%
Animal waste
Drivers - Global climate change

¹Euromonitor (2012);
5 milhões aging between18 to 34 in 2010
270 million people
in households occupied by just one person
Brazil
World
10% of households occupied by just one person
searching for food easyto prepare and consume
77%
28%
2006
Drivers - consumers habits and behaviors¹
Single person household andolder people

Heathier food
Practical and convenience
Higher collective consciousness
Gourmet
Digital Cooking
Homemade
Vegetarianism
HealthCertified originFunctional foodGood nutrition Easy preparation
Intelligent packagingE-commerce
Personal satisfaction & collective well-beingSustainabilityLocal production
Sensorial experiencesDifferential in qualitySophistication
Highly customized production (individual and industrial)High variety of new ingredients 3D manufacturing
Cultural preferencesHomemade meals at working environmentsTradition
No animal protein intake (total or partial)Animal protein substitutes (“fake meat”)
Drivers - trends at consumers level

¹ United Nations (2011); ² IBGE (2013)
Brazil²
1950 2050201014% 6%36,2%
Urban 70% Rural 30%
2012
2050
Urban 50% Rural 50%World1
94%86%63,8%
urban
rural
Drivers - Urbanization
Analysis and interpretation

Pillars of Sustainable Food in Brazil
32
A extração dos elementos anteriormente mencionados e a identificação de palavras-chaves foram feitas pela equipe do estudo e posteriormente inseridas em ferramenta desenvolvida para este fim, denominada mindshare. Essa ferramenta cria, automaticamente, nuvens de palavras-chaves associadas ao tema em análise e permite que a partir de palavras-chaves de interesse particular seja possível recuperar as informações relacionadas às mesmas produzidas ao longo do estudo, conforme exemplo ilustrado na Figura .
Figura 4. Nuvem formada pelas palavras chave selecionadas no estudo Política de Recursos Hídricos
Fonte: dados do Estudo.
CT&I, educação e capacidade
I
II
Viabilidade
econômica, social e
ambiental
III
Infra
estr
utur
a,
logís
tica e
tecn
olog
ia
da in
form
ação
VI
Cons
umo,
saúd
e e
bem
–est
ar
V
Cultura de comércio
internacional
IV
Promoção deempreendedorismo
Projeto alimentos
Figura 5. Pilares para a sustentabilidade e sustentação da produção de alimentos no Brasil
Fonte: dados do estudo.
Sustainable Food
Entrepreneurship
Science, Technology,
Education and Capacity Building
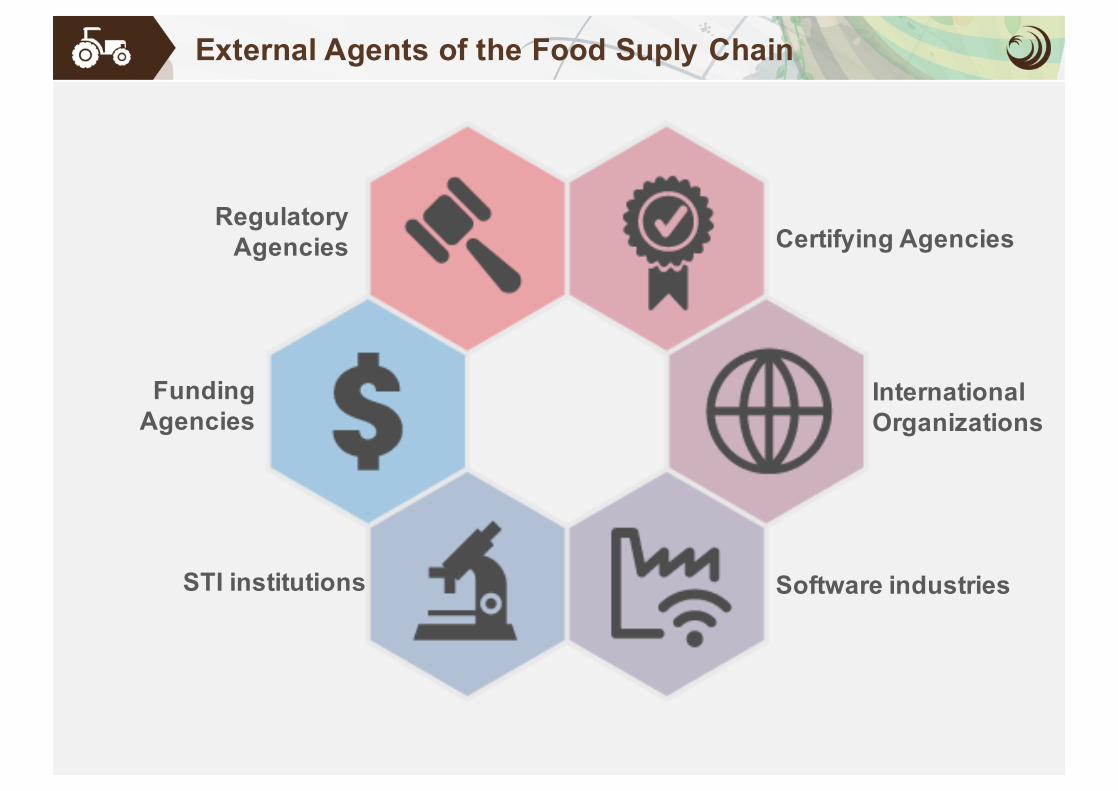
External Agents of the Food Suply Chain
Certifying Agencies
Software industries
Regulatory Agencies
International Organizations
STI institutions
Funding Agencies

Challenge: diversify food products in the market
Pilar I — STI, Education and Capacity Building
R&D applied to discovering new polymers and substances obtained from biology engineering platforms
Recommendation
Important to be competitive at the 3D manufacturing market
Justification
Conclusion and Recommendations

Challenge: creating a competitive differential for the food industry
Pilar I — STI, Education and Capacity Building
Establish the carbon footprint in thewhole food chain
Recommendation
Selo Baixo Carbono, MMA; Coalizão de Empresas pelo Clima, FBDS
Conclusion and Recommendations

The Role of Cities

The Role of Cities
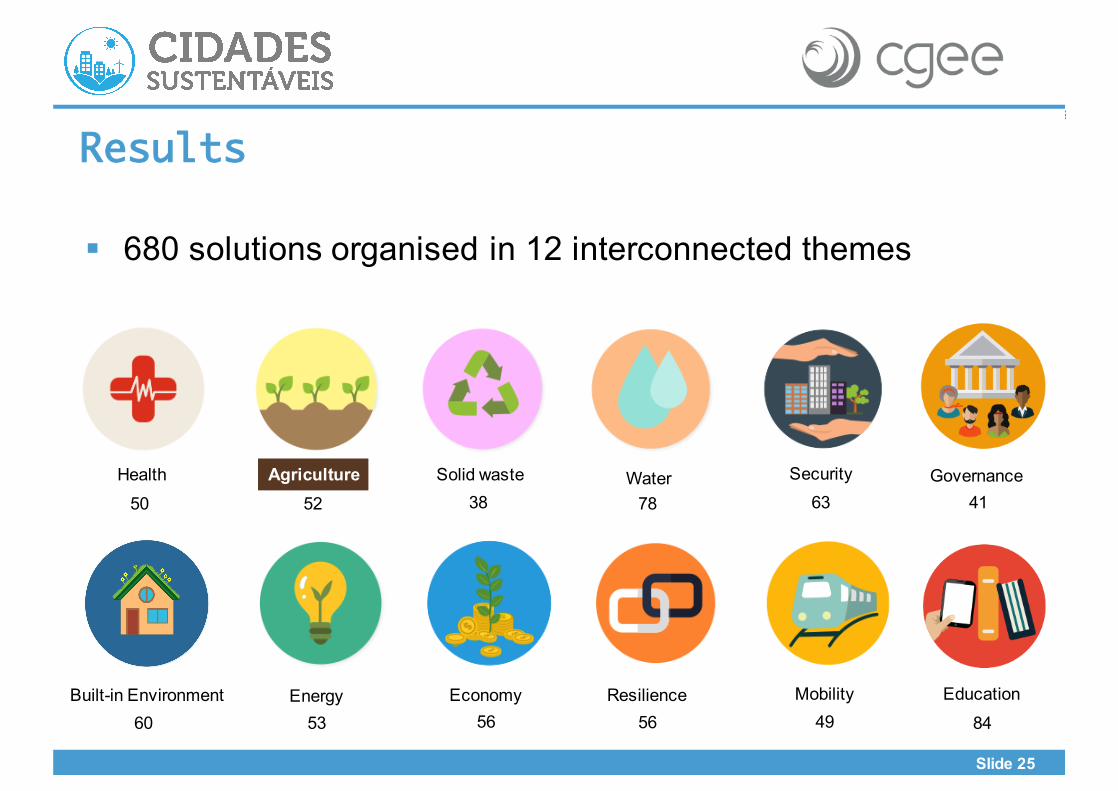
Slide 25
§ 680 solutions organised in 12 interconnected themes
Results
5653 56 49 8460
38 78 63 415250
Energia
Health Agriculture Solid waste Water Security Governance
Built-in Environment Energy Economy Resilience Mobility Education

Slide 26
Urban &Peri-urban Agriculture
v Rooftop Farmingv Green Wallsv Green Belts v Beekeeping v Vertical Farming

Slide 27
Producers and Consumers Relationship
v Creation of cooperatives v Agreements between
schools and small farmers
v Online sales of productsv Municipal markets

Slide 28
Policies and Programs
v Urban agriculture in city planning
v tax incentives for production urban and peri-urban food
v Regulate the re-location of the food supply
v educational programs of urban agriculture in community spaces
v Food waste reduction

https://www.youtube.com/watch?v=pHcnhDtj2CU
How kids see the city of the future
