braking performance 4
TRANSCRIPT

Braking Performance
3/27/2012 ١ME 467 Vehicle Dynamics

Stopping Distance
• It is the distance between the moment when a hazard is recognized and the time when the vehicle comes to a complete stop.
• It is the sum of the distance traveled during the reaction time at given speed and active braking time.
3/27/2012 2 ME 467 Vehicle Dynamics

Reaction Time
• The reaction time is the period which elapses between the recognition of the object, the decision to brake, and the time it takes for the foot to hit the brake pedal.
3/27/2012 3 ME 467 Vehicle Dynamics

Reaction Time
• The reaction time is not a fixed value: it ranges from 0.3 to 1.7 s, depending depending upon the driver and on external factors.
3/27/2012 4 ME 467 Vehicle Dynamics

Stopping Sight Distance (SSD)
• Worst-case conditions– Poor driver skills
– Low braking efficiency
– Wet pavement
• Perception-reaction time = 2.5 seconds
• Equation:
3/27/2012 5 ME 467 Vehicle Dynamics
rtVa
VSSD 1
21
2+=

Speed and Stopping Distance
• Look carefully at stopping distance for each vehicle speed !!!
3/27/2012 6 ME 467 Vehicle Dynamics
Vehicle Braking
• It is obvious that vehicle weight has a linear relationship with the energy to be dissipated (stored) and the change in velocity required has a exponential relationship.
• Deceleration times and stopping distances vary somewhat for all vehicles on a given road surface. somewhat for all vehicles on a given road surface.
• It should then be obvious that sizing the brake system components has critical importance with respect to the potential vehicle velocity and the mass of the vehicle.
• Note that heavy trucks generally have greater stopping distances as compared to typical passenger cars.
3/27/2012 7 ME 467 Vehicle Dynamics

Braking and Deceleration
3/27/2012 8 ME 467 Vehicle Dynamics

Retarding Forces
• The retarding forces on a vehicle are generally of the type shown in the following equation, where q is uphill grade:– Front and rear brake forces
– Aerodynamics drag– Aerodynamics drag
– Rolling resistance
– Climbing resistance and downgrade force
3/27/2012 9 ME 467 Vehicle Dynamics
sinθWFFFFDgW
aM RollingcAerodynamirBrake,fBrake,xx -----=÷÷ø
öççè
æ-=
FBf , FBr include: 1) brake torque2) bearing friction3) drive line drag.

Rolling Resistance• It is the product of deformation processes which occur at
the contact patch between tire and road surface.
• Frr = f Mg
Depends on:
3/27/2012
10 ME 467 Vehicle Dynamics
Depends on:– bearing friction, – deformation of tires, – road surface.
Rxf + Rxr = fr (Wf + Wr) = frWfr : rolling resistance coefficient.Rolling resistance: depends on the
distribution of loads on axles.: it equivalent to about 0.01 g (0.3 ft /sec2).

Rolling Resistance
• It is directly proportional to the level of deformation and inversely proportional to the tire radius.
• It increase with greater loads, higher speeds, and lower pressure.
3/27/2012 11 ME 467 Vehicle Dynamics

Aerodynamic Drag
• It is empirical value and depends on vehicle shape and speed.
Fa = CdV2
Depends upon:
3/27/201212 ME 467 Vehicle Dynamics
Depends upon:– frontal area,
– relative vehicle speed to air speed
DA = C . A . V2
DA: can be neglect at low speed,
DA » 0.03 g at high speed (1 ft /sec2).
A: frontal area
V: relative speed
C: aerodynamic drag coefficient.

Drive line drag (inertia)
• Inertia (adds to the effective mass of vehicle).• Drag arises from internal friction in gears
and bearings and from engine braking.• Engine braking arising from internal friction
and air pumping losses. and air pumping losses. • Engine braking multiplies by the gear ratio
selected.• If vehicle decelerates faster than drive line,
slowing down from drive line drag will have lower contribution in braking effort.
3/27/2012 ١٣ME 467 Vehicle Dynamics

Grade
Rg = W sinθ
Grade increase the braking effort of vehicle in uphill road and decrease it in down hill road.road and decrease it in down hill road.
Rg = W sinθ = W θ , θ in (radians) ≈ grade for small angles.
Grade of 4% (0.04) will be equivalent of deceleration (! 0.04g) →1.3 ft /sec2
3/27/2012 ١٤ME 467 Vehicle Dynamics

Active Braking and Kinetic Energy
• Brake systems convert the kinetic energy of the vehicle at velocity to some other form of energy.
• Current design brake systems in conventional automobiles convert the kinetic energy of the vehicle into thermal energy (heat) which is subsequently dissipated into the atmosphere. into the atmosphere.
• Hybrid vehicles attempt to recover the kinetic energy as stored battery or capacitor electrical energy.
• Kinetic energy (KE) is mathematically represented as ½ the product of the vehicle mass and the velocity of the vehicle squared.
3/27/201215
ME 467 Vehicle Dynamics
2
21
vmKE =

Energy Conversion during Braking
Conversions that might be possible would include:
Kinetic Energy to Thermal Energy
• Typically a friction system generating heat between a rotating wheel part and a vehicle fixed friction component which can be modulated by the driver.be modulated by the driver.
Kinetic Energy to Stored Electrical Energy
• Regenerative system where electric motors can be used as electric generators under braking and subsequently turn some portion of the kinetic energy into stored electrical energy.
• The stored electrical energy can be later used to supplement performance and/or range.
3/27/2012 16 ME 467 Vehicle Dynamics

Energy Conversion during Braking
Kinetic Energy to Stored Mechanical Energy• Regenerative system where mechanical systems can be engaged
under braking to impart kinetic energy to a flywheel subsequently turning some portion of the kinetic energy into stored mechanical energy.
• The stored energy can be released as required to augment acceleration and/or extend the range of the vehicle.acceleration and/or extend the range of the vehicle.
Kinetic Energy to Stored Hydraulic Pressure Energy• Regenerative system where hydraulic motors can be used as
hydraulic pumps under braking and subsequently turn some portion of the kinetic energy into stored hydraulic energy.
• Storage of the fluid under pressure can later be released to the pump, driving it as a hydraulic motor which can be used to augment acceleration and/or extend the range of the vehicle.
3/27/2012 17 ME 467 Vehicle Dynamics

Constant Deceleration
• Assuming the forces on the vehicle are constant:
• This equation can be integrated because F is constant
dtdV
M
F = D xtotal
x =
• This equation can be integrated because Fx is constant from initial velocity Vo to final velocity Vf:
3/27/2012 18 ME 467 Vehicle Dynamics
òò =sf
0
t
0
V
V
xtotal dtM
FdV

Constant Deceleration
• The fundamental relationship equations that govern braking are:
òò =-=>=t
sxtotal
f0
Vxtotal t
FVVdt
FdV
f
Where ts is the time for the velocity change
3/27/2012 19 ME 467 Vehicle Dynamics
òò =-=>=0
sf0V
tM
VVdtM
dVo

Stopping Distance (SD)
• can substitute for dt in equation (1) and integrate to obtain the relationship between velocity and distance:
xM
F
2
VV x total,2f
2
0 =-
Where x = distance traveled during deceleration
• In the case where Vf = 0, then x = stopping distance
3/27/2012 20 ME 467 Vehicle Dynamics
M2
x
2o
D2V
x =

Braking Energy
• The time to stop is then:
• Thus, all things being equal, the time to stop is
x
0
xtotal
0s
DV
MF
V = t =
• Thus, all things being equal, the time to stop is proportional to the velocity, where as the distance to stop is proportional to the velocity squared.
• The energy absorbed by the brake system is the kinetic energy of motion:
3/27/2012 21 ME 467 Vehicle Dynamics
)V(V2M
=Energy 2f
20 -

Deceleration with Wind Resistance
• Aerodynamic drag effects:
3/27/2012 22 ME 467 Vehicle Dynamics

Types of braking systems
• Desk and Drum types
3/27/2012 23 ME 467 Vehicle Dynamics

Physics of braking
•d
3/27/2012 24 ME 467 Vehicle Dynamics

3/27/2012 25 ME 467 Vehicle Dynamics

BrakesDrum brakesAdvantage - High brake factor (low actuation effort).- Easy to integrate with park brake. Disadvantage- not consistent in torque performance. - not consistent in torque performance.
Disc brakesAdvantage - more consistent torqueDisadvantage- low brake factor.- high actuation effort.3/27/2012 ٢٦ME 467 Vehicle Dynamics

Brake factorIs a mechanical advantage in drum brakes to minimize required
actuation effort?Moment equation about pivot of shoe AåMp = e Pa + n m NA – m NA = 0Pa : application of an actuation force.NA : normal forcee, n, m: distances as shown in (fig).
Ae, n, m: distances as shown in (fig).NA = Pa · e , NB = Pa · e
m - m n m + m nFriction forces on brake shoes:FA = m NA , FB = m NB ,
FA = Pa · m · e , FB = Pa · m · em - m n m + m n
FA = m e , FB = m ePa m - m n Pa m + m n ٢٧

FA = m e , FB = m e Pa m - m n Pa m + m n
TL = FA · r TT = FB · rTL : brake torque of leading shoe, TT : brake torque of trailing shoe.
Braking torque developed by leading shoe greater than brake torque developed by trailing shoe.The moment produced by the friction force on the leading shoe acts to rotate The moment produced by the friction force on the leading shoe acts to rotate
against the drum and increase the friction force developed (self servo).
For this reason two leading shoe type of brake usually using in front brakes. In leading shoe If µ gets too large ≈ 1 brake factor goes to infinity ( m ≈ n) and brake will lock.Consequences:
1- sensitivity to the lining coefficient of friction2- high noise ٢٨ME 467 Vehicle Dynamics

Leading show A :- Moment produced by the friction force on the show acts to rotate it against the drum and increase the friction force developed (self-servo which characterized by brake factor).
Trailing show B :- friction force acts to reduce the application force, lower brake factor and higher braking forces required to achieve desired braking torque.
3/27/2012 ٢٩ME 467 Vehicle Dynamics

Braking torque during stopping processBraking torque during stopping process
Tb = f ( Pa , velocity , temperature )•Torque normally increase linearly with Pa•Torque increases as velocity increase.•Torque decreases as temperature increase.
Disk brake shows less torque variation during stopping.So, in drum brakes it is difficult to maintain proper balance between front and rear braking effort during max braking.
3/27/2012 ٣٠ME 467 Vehicle Dynamics

Braking force at the ground
Fb = Tb – Iw awr
That if wheels still rotating during brakingIw : rotational inertia of wheelsaw: rotational deceleration of wheels.aw: rotational deceleration of wheels.
If wheels lock up:aw related to acceleration of vehicle
aw = ax ,r
Iw: part of vehicle mass
Fb = Tbr
3/27/2012 ٣١ME 467 Vehicle Dynamics

road friction)-Traction (TireFriction force can be increase to the limit of frictional coupling between the tire and road
Mechanisms of friction:• Adhesion, it arises from
intermolecular bonds between the rubber and road surface. Higher on dry road, reduced with wet road surface
(wheel rotating).• Hysterises, Represents energy
loss in the rubber as it deforms when sliding over road surface not affected by water, thus it has better wet traction. ٣٢

- Both Mechanisms of friction depend on small amount of slip occurring in the contact patch.
- As braking force develops, additional slip is observed additional slip is observed as a result of deformation of the rubber elements.
- Deformation increases from front to back and the force developed increases proportionality.
3/27/2012 ٣٣ME 467 Vehicle Dynamics

Both mechanisms depends on two factors:-
(brake force coefficient and slip - which are coexistent)1) slip of tiresslip = v – w . r , %
v v : forward velocityv : forward velocity
w: tire rotational speed
w¯….slip , w=0….slip=100%
2) brake force coefficient (µ)= FxFz
Fx: braking force,
Fz: axle load
Brake coefficient µ increases with slip to about 10-20% slip (see fig.)
µp – peak coefficient (it establishes the max brake force that can be obtained from particular tire and road friction).Max braking coefficient develops at µp .Then if Slip … µ ¯ until µs .ms … at full wheel locking.in ABS ms return to mp in a repeated cycles.
3/27/2012 ٣٤ME 467 Vehicle Dynamics

Friction in braking depends on:1. tire design2. road surface type3. velocity (both peak and slide friction decrease with
velocity increase).4. Inflation pressure. Wet road: P ® mp ,ms
Dry road: P less affect on mDry road: P less affect on m5.vertical load: (Brake force coefficient=Fx /Fz ),
increasing of vertical load reduce brake force coefficient levels,
if load increase mP ,ms don’t increase proportionally.
3/27/2012 ٣٥ME 467 Vehicle Dynamics

Brake proportioning: describes the relation between front and rear brake forces, determined by the pressure applied to each brake wheel cylinder and the gain of each.and the gain of each.
Ideal design is to bring both axles up to lock up simultaneously
3/27/2012 ٣٦ME 467 Vehicle Dynamics

Brake proportioningDynamic load during braking
W , W : static loadsWfs , Wrs : static loads
Wd : dynamic load transfer.
Maximum brake forces on an axle:
mp- peak coefficient of friction ٣٧
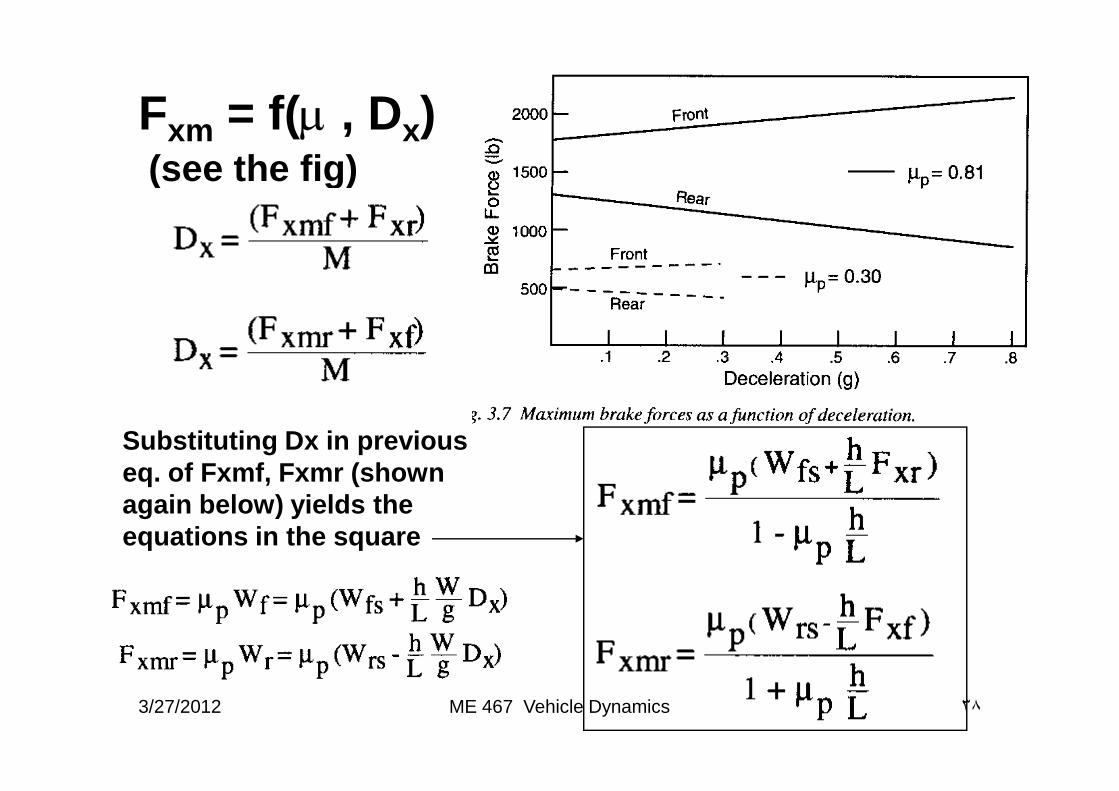
Fxm = f(m , Dx)(see the fig)
Substituting Dx in previous eq. of Fxmf, Fxmr (shown again below) yields the equations in the square
3/27/2012 ٣٨ME 467 Vehicle Dynamics

The intersection point can be determined by manipulating equations of Fxmf, Fxmr.
3/27/2012 ٣٩ME 467 Vehicle Dynamics

Brake gain and Brake proportioningThe gain of brakes on front and
rear wheels is an important factor to determine brake proportioning.
Brake force on each wheel
Fb =Tb =G Par rr rG: brake gain (in–lb/psi)
Pa: application pressure.
3/27/2012 ٤٠ME 467 Vehicle Dynamics

Hydraulic proportioning valveHydraulic proportioning valve: provide equal pressure to both front and rear brakes up to certain pressure level and then reduce pressure to rear brake.So, it adjusts the brake torque output on front and rear wheels in accordance to the peak traction forces possible or to loads.Example:- Hydraulic proportioning valve identification number:(500 / 0.3) that means:-For Pa < 500 psiPf = Pr = Pa = application pressure.For Pa > 500 psiPf = Pa , Pr = 500 + 0.3 (Pa – 500) If Pa = 700 psiPf = Pa = 700 psiPr = 500 +0.3(700 – 500) = 570 psi.3/27/2012 ٤١ME 467 Vehicle Dynamics