braintrinsic: a virtual reality-compatible tool for exploring … · braintrinsic: a virtual...
TRANSCRIPT

BRAINtrinsic: A Virtual Reality-CompatibleTool for Exploring Intrinsic Topologies of the
Human Brain Connectome
Giorgio Conte1, Allen Q. Ye2, Angus G. Forbes1,Olusola Ajilore2, and Alex Leow2
1 Department of Computer Science, University of Illinois at Chicago{gconte2,aforbes}@uic.edu,
2 Department of Psychiatry and Bioengineering, University of Illinois at [email protected], {oajilore,aleow}@psych.uic.edu
Abstract. Thanks to advances in non-invasive technologies such as func-tional Magnetic Resonance Imaging (fMRI) and Diffusion Tensor Imag-ing (DTI), highly-detailed maps of brain structure and function can nowbe collected. In this context, brain connectomics have emerged as a fastgrowing field that aims at understanding these comprehensive maps ofbrain connectivity using sophisticated computational models. In this pa-per we present BRAINtrinsic, an innovative web-based 3D visual ana-lytics tool that allows users to intuitively and iteratively interact withconnectome data. Moreover, BRAINtrinsic implements a novel visualiza-tion platform that reconstructs connectomes’ intrinsic geometry, i.e., thetopological space as informed by brain connectivity, via dimensionalityreduction. BRAINtrinsic is implemented with virtual reality in mind andis fully compatible with the Oculus Rift technology. Last, we demonstrateits effectiveness through a series of case studies involving both structuraland resting-state MR imaging data.
Keywords: Connectomics, connectome datasets, intrinsic geometry, neu-roimaging.
1 Introduction
Magnetic resonance (MR) imaging techniques such as functional Magnetic Res-onance Imaging (fMRI) and diffusion weighted imaging (DWI) enable neuroim-agers to collect and derive data about how different brain regions connect fromboth a structural and a functional point of view [15]. Analogous to the conceptof genome for genetic data, a brain connectome is a whole-brain comprehensivemap of neural connections [20]. As neural connections exhibit complex patternsof function and structure, the field of brain connectomics has emerged in or-der to understand these imaging big data. The brain connectome is typicallymathematically represented using connectivity matrices that describe the inter-action among different brain regions. To date, most connectome study designs

2 G. Conte et al.
use brain connectivity matrices to compute summary statistics on either a globalor a nodal level [21].
In the current work, we introduce an innovative visualization technology withthe ability to reconstruct and analyze the intrinsic geometry of brain data, thatis, the topological space where brain connectivity natively resides (independent ofanatomy). Understanding this intrinsic geometry could not only lead to a greaterdistinction of differences in clinical cohorts, but also help track longitudinalchanges in individual brains in order to better deliver precision medicine. To thebest of our knowledge, no such tool currently exists that effectively addressesthese needs.
2 Intrinsic Geometry
The proposed intrinsic geometry represents the brain connectome after non-linear multidimensional data reduction techniques are applied. This means thatthe position of each node does not correspond to its anatomical location, as itdoes in the original brain geometry. Instead, its position is based on the strengthof the interaction that each region has with the rest of the brain, whether struc-tural or functional. To put into context why intrinsic geometry may be a betterspace to understand brain connectivity data, for decades cartographers havemapped quantitative data onto world maps to create unique, informative vi-sualizations. For example, by resizing countries according the Gross DomesticProduct (GDP), the viewer can easily appreciate that the United States has thelargest GDP. Similarly, dimensionality reduction techniques remap the brain ac-cording to network properties. In the intrinsic geometry we are more interestedin the shape the brain connectome assumes independent of the anatomical dis-tances between nodes. Thus, the space in which the intrinsic geometry is plottedin is called a topological space [4].
Linear dimensionality reduction techniques such as multidimensional scal-ing (MDS) [2] and principal component analysis (PCA) [14] have been previ-ously used in unrelated fields of medicine as a way to distinguish clinical cohortsthrough biomarkers, although it can be argued that they are not suitable for com-plex high-dimensional connectome data [13, 22]. To the best of our knowledge,this study represents the first comprehensive application of non-linear dimen-sionality reduction techniques in the ever-expanding field of brain connectomics.This intrinsic geometry concept provides a connectomic visualization that is notobscured or constrained by the brains anatomy. Indeed, visualizing connectivityinformation within an anatomical representation of the brain can potentiallylimit one’s ability to clearly understand the complexity of a human brain con-nectome; some meaningful patterns of structure or function may be much easierto appreciate in a topological space.
2.1 Data Acquisition and Intrinsic Geometry Reconstruction
Structural and diffusion-weighted imaging data were acquired from 46 healthycontrol subjects (HC, mean age: 59.7±14.6, 20 males). Resting-state functional

BRAINtrinsic: Exploring the Human Brain Connectome 3
MRI data were additionally acquired on a subset of healthy controls (n = 10). Toobtain DTI-informed structural brain connectome, we used a pipeline reportedpreviously [9]. Functional connectomes were generated using the resting statefMRI toolbox, CONN.3 In brief, raw EPI images were realigned, co-registered,normalized, and smoothed before analyses. Confounding effects from motionartifact, white matter, and CSF were regressed out of the signal. Using the same82 cortical/subcortical gray-matter labels as the structural brain networks [7],functional brain networks were derived using pairwise fMRI signal correlations.
These 82 anatomical regions were then further upsampled using an algorithmthat continuously bisected each region across all subjects at an identical angleuntil the average region size reached a certain threshold. Previous studies usingsimilar algorithms have shown that up-sampling regions into higher-resolutionvoxels maintains network connectivity [11]. The resulting parcellation converted82 regions into 620 sub-regions for the structural data and 739 for the functionaldata. Brain networks formed by either the fiber tract counts or the functionalcorrelations between up-sampled gray matter regions were generated using anin-house program in Matlab. These up-sampled regions were also re-registered tooriginal subcortical/cortical regions in preparation for nonlinear dimensionalityreduction. All networks were examined to ensure that all regions were directlyconnected to at least one other region preventing the formation of any isolated“islands”. To compensate for inter-subject variations, we averaged individualsubjects’ networks together to obtain a group average network.
2.2 Intrinsic Geometry Reconstruction
Representing functional and structural connectomes as high-dimen-sional data. Before any dimensionality reduction can be applied, we need arepresentation of the connectome data in a high-dimensional space where a dis-tance metric can be properly computed (such that a neighborhood could bedefined). In the case of fMRI BOLD signal time series correlations, we pro-pose to first transform inter-regional correlations (r) using the transformation:si,j = log( 1
|ri,j | ). Here ri,j represents the correlation coefficient between i and
j. Note this non-negative transformation yields s = 0 if two nodes are com-pletely coupled (i.e., r = 1 or −1), and infinity when completely decoupled(r = 0). This transformation provides the building block for representing func-tional data in a high-dimensional space. To this end, we first note that forany brain region the n-dimensional vector S∗ = (s∗,1, s∗,2, s∗,3 . . . , s∗,n) nowencodes the pattern of coupling between this region and the entire brain (ndenotes the total number of brain regions or nodes; n = 739 in our restingstate imaging data). In the intrinsic geometry one would thus want to embedtwo nodes i and j next to each other if they exhibit very similar coupling pat-terns, i.e., the Euclidean distance |Si−Sj | =
√∑n(si,n − sj,n)2 is small, where
Si = (si,1, si,2, si,3 . . . , si,n) and Sj = (sj,1, sj,2, sj,3, . . . , sj,n). This intuitive ex-ample illustrates that we could simply represent functional connectome data
3 http://www.nitrc.org/projects/conn

4 G. Conte et al.
in a n = 739 dimensional Euclidean space, with node k having the followingcoordinates, Sk = (sk,1, sk,2, sk,3, . . . , sk,739). In the case of structural connec-tome (whose connectivity matrix codes the strength of white matter tracts)we propose, with similar rationale, to represent structural connectivity data ina n = 620 Euclidean space with node k placed at the following coordinates:Sk = (GraphDistk,1, GraphDistk,2, . . . , GraphDistk,620); here GraphDist codesthe shortest path length (i.e., graph distance) connecting two nodes; graph dis-tances are usually computed by defining edge length as the inverse of the edgestrength (i.e., fiber counts) followed by applying Dijkstra’s algorithm [5]. Fig-ure 1 visualizes these two different transformations for both the structural andfunctional connectivity matrices.
Fig. 1. The figure shows the adjacency matrices for both the structural and the func-tional group-averaged connectome. The (i,j) element represents the tractography-basedfiber count or the BOLD fMRI signal correlation between brain regions i and j. Theresulting n-dimensional row vectors (vertically stacked) describing the Euclidean coor-dinates of high-dimensional connectome data are shown on the right. See Section 2.2for more details.
Constructing 3-Dimensional Embedding. To promote uniformity through-out the analyses, we used the dimensionality reduction toolbox introduced byvan der Maaten for all reductions [17]. The number of dimensions was reducedfrom 620 and 739 to 3, for the structural and functional connectome respectively.We used the compute mapping routine, with the ”Isomap” and the ”k-nearestneighbor” options. The number of nearest neighbors (i.e., k) during local neigh-borhood construction was increased iteratively such that all points were includedin the embedding. For structural connectome, k was determined to be 17, andfor functional 27.
3 Design features of BRAINtrinsic
A range of interesting approaches to visualizing the human brain connectomeare available. Some recent connectome visualization tools include a 3D node-link representation to provide meaningful spatial information relative to the realanatomical position [10, 16, 24]. However, in these tools, the overall visual cluttertends to increase in large networks with dense interconnections between nodes.

BRAINtrinsic: Exploring the Human Brain Connectome 5
In this context, interaction helps limit the potential visual clutter that may occurwhen visualizing the human brain connectome. A possible solution is to let theuser easily choose the level of details of the exploration within a Virtual Reality(VR) environment.
Since the advent of this technology, VR systems have been used for visualiz-ing scientific datasets [19]. Additionally, recent VR tools have provided new waysto interact with and explore complex datasets effectively. For example, Ware etal. evaluates the effectiveness of 3D graph visualization when using high reso-lution stereoscopic displays [23]. Recently, Forbes et al. presents a stereoscopicsystem to visualize temporal data of the brain activity responding to externalstimuli [8], providing new insights when dealing with the temporal dimensionin a 3D environment. Broadly speaking, multi-purpose immersive VR environ-ments, such as the CAVE2 [6], enable a more engaging and effective explorationof complex datasets.
Although, the effectiveness of utilizing 3D for representing data has beendebated [18], recent work by Alper et al. [1] has shown that in some situationsvisualizing 3D networks can outperform 2D static visualization, especially whenconsidering complex tasks. To the best of our knowledge, BRAINtrinsic presentsthe first dynamic and interactive VR-compatible visualization platform for con-nectome representation and exploration.
3.1 Design and functionality
BRAINtrinsic uses an interactive 3D node-link diagram to visualize connectomedata. The individual nodes represented different brain regions and are visual-ized using circular glyphs, while edges representing a functional or a structuralconnection between these regions are displayed using lines.
A main concern with the use of node-link diagrams is the potential for visualclutter when displaying a highly interconnected graph. Instead of showing allthe connections simultaneously, by default BRAINtrinsic only shows nodes whilehiding all links unless explicitly required. Through interaction, users are able todisplay or hide connections according to their preferences and current needs. Wealso allow the user to view the connections only within a particular sub-graph.This edges-on-demand technique allows exploration tasks to be performed byshowing only the connections starting from a specific region that is currentlybeing interrogated. The user can pin the connections in the scene by simplyclicking on the node itself. We use varying degrees of transparency to visuallyencode the strength of edge weights; stronger connections are represented usingopaque lines while weaker edges are more transparent. Transparency is scaledrelative to only the currently displayed edges.
Colors are used to highlight the neuroanatomical membership of each node inthe brain. Here, each glyph belongs to one of the 87 neuroanatomical gray matterregions as defined by Freesurfer [7]. However, the data structure is flexible enoughto accept any membership or affiliation definition. Additionally, we implementeda range of user interactions to support visual analysis including the following:

6 G. Conte et al.
– Dynamically display the nodal strength for any node being interrogated [3];– Dynamically create the shortest-path tree rooted in the node selected by the
user;– Visualize the shortest path between any two nodes;– Select or deselect any regions in any topological space (anatomy versus in-
trinsic) during visualization;
We again used Dijkstra’s algorithm [5] to create the shortest path tree. Theuser can filter the shortest path tree according to two different measures: graphdistance and number of intermediate nodes or “hops”. In the first case the usercan filter the tree according to the relative distance with respect to its farthestnode. Given a threshold t, all the nodes that satisfy the following inequalityare drawn: d(r, i) ≤ maxDistance(r) · t, where r is the root node, i is thenode considered, maxDistance(r) is the distance between the root node and thefarthest node, and t is the threshold chosen by the user. If t = 0 then only theroot node is displayed, while if t = 1 the entire shortest path tree is drawn. Inthe latter case, the user is able to filter out nodes that are not reachable withina certain number of nodes from the root.
Following the computation of the shortest-path tree, the user then can pro-ceed to select a second “destination” node and visualize the shortest route con-necting this node to the root. In this case, we display all the nodes in the networkto provide the overall perspective of the route course.
3.2 System Details
BRAINtrinsic was developed in Javascript using the threejs library (http://threejs.org) an open source wrapper for the hardware accelerated graph-ics functionality provided by WebGL (http://webgl.com). BRAINtrinsic wasdesigned to be fully compatible within a virtual reality environment, and hasbeen specifically calibrated for use with the Oculus Rift VR headset (http://oculus.com). Through stereographic rendering, we emulate the way humaneyes perceive the real world, creating a natural navigation for the user. The codedeveloped is open source and publicly available at the authors’ code repository 4.
4 Results
4.1 Visualizing the intrinsic geometry and simulated Rich-clubremoval
Figure 2 visualizes the intrinsic geometry of the structural and the functionalgroup-averaged connectome, as well as illustrates the rich-club property of thehuman connectome (second row). The basic concept behind the rich club prop-erty is the tendency for nodes with high nodal strengths to form tightly in-terconnected groups [12]. Mathematically speaking, given a graph N and the
4 https://github.com/CreativeCodingLab/BRAINtrinsic

BRAINtrinsic: Exploring the Human Brain Connectome 7
parameter k which defines a nodal strength cut off, the rich club property isdefined as
φ(k) =2E>k
N>k(N>k − 1)(1)
where E>k is the number of edges in N between the nodes of nodal strengthgreater than k and N>k is the number of nodes in N with nodal strength greaterthan k. Visually and intuitively, it is clear that rich-club nodes form the center ofthe structural connectome’s intrinsic geometry (lower middle panel). To furtherappreciate the power of BRAINtrinsic, we demonstrate gross changes in theshape of the structural connectome’s intrinsic geometry when rich-club nodesare removed.
Fig. 2. This figure visualizes the intrinsic geometry of the tractography-derived struc-tural and the resting-state fMRI connectome (middle and right panel, respectively), aswell as the locations of rich-club regions in these spaces (second row). For comparison,their corresponding locations in the original neuroanatomical space are also shown (leftpanel).
Figure 3 (top left) again visualizes the bowl-like shape of the complete struc-tural connectome, while the connectome without rich club nodes (top right)shows a ring-like structure with a “hole” in the middle. Visually, rich-club nodesthus keep the entire network intact by forming the center. When they are re-moved, remaining brain regions are now topologically dispersed and less cou-pled. Similar simulations were further conducted by removing an equal numberof nodes with respect to the following criteria: a) nodal strength (high to low),b) clustering (low to high), c) nodal path length (low to high), and d) randomremoval. While random removal(top middle) as expected only induces subtlechanges to the intrinsic geometry, interestingly removing nodes based on clus-tering (lower left) also minimally changes the overall shape, supporting the fun-damental differences in what local properties such as clustering capture relativeto global properties. The immersive VR environment provided by BRAINtrin-sic helps user better appreciate the differences mentioned above. BRAINtrinsic
8 G. Conte et al.
is particularly effective when experts aim at understanding and comparing theoverall shape of the entire connectome.
4.2 Resting state functional connectome
The right panel of Figure 2 visualizes the intrinsic geometry of resting-state fMRIconnectome, which exhibits a very different pattern compared to its structuralcounterpart. Due to the strong inter-hemispheric fMRI connectivity betweenhomologous regions, here one does not see the left-right symmetry as in thestructural case; instead homologous regions now coalesce into a single cluster.More interestingly, while rich-club regions are located at the center of struc-tural connectome’s intrinsic geometry, this is no longer the case for functionalconnectome. BRAINtrinsic allows for such an appreciation to easily occur whenexploring functional datasets. The choice of using different glyphs and colors toencode different regions-of-interests coupled with effective VR rendering providesa clear understanding of the underlying neuroanatomy even in this topologicalspace.
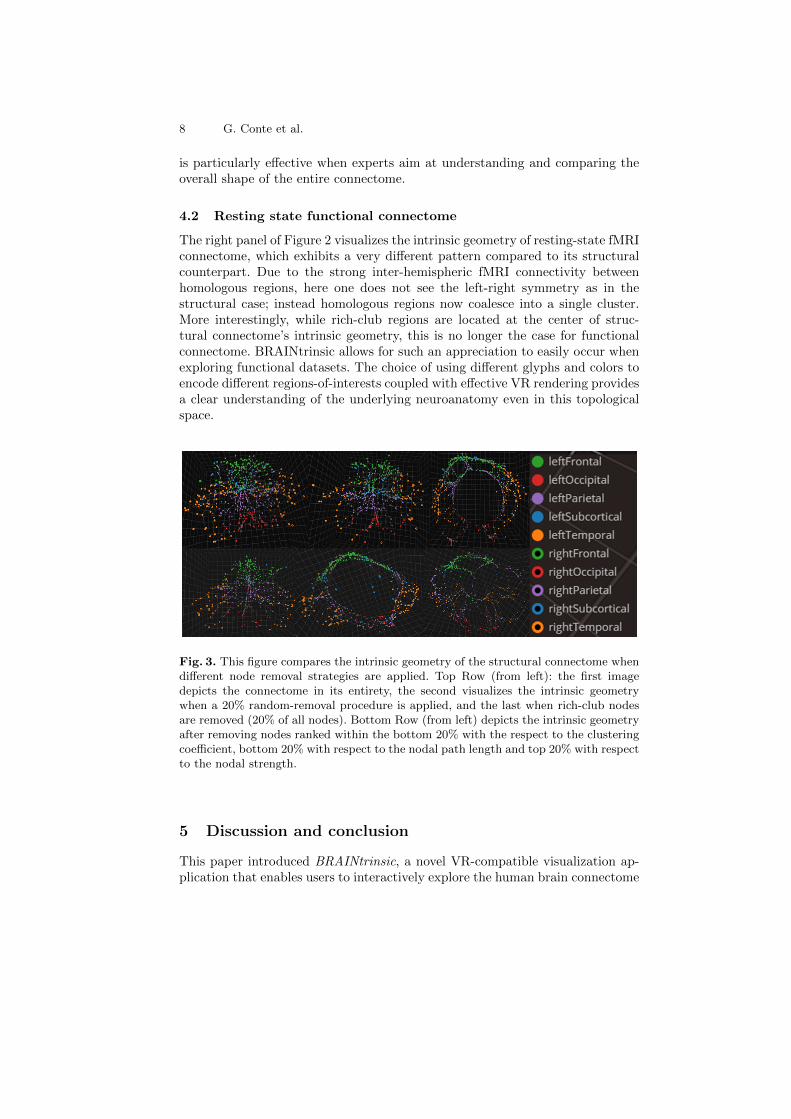
Fig. 3. This figure compares the intrinsic geometry of the structural connectome whendifferent node removal strategies are applied. Top Row (from left): the first imagedepicts the connectome in its entirety, the second visualizes the intrinsic geometrywhen a 20% random-removal procedure is applied, and the last when rich-club nodesare removed (20% of all nodes). Bottom Row (from left) depicts the intrinsic geometryafter removing nodes ranked within the bottom 20% with the respect to the clusteringcoefficient, bottom 20% with respect to the nodal path length and top 20% with respectto the nodal strength.
5 Discussion and conclusion
This paper introduced BRAINtrinsic, a novel VR-compatible visualization ap-plication that enables users to interactively explore the human brain connectome

BRAINtrinsic: Exploring the Human Brain Connectome 9
Fig. 4. Exploring connectome data using BRAINtrinsic within the Oculus Rift envi-ronment.
and its intrinsic topology. Since in the intrinsic space, spatial vicinity equatesto stronger connectivity, the user is able to explore freely and easily the terrainof brain connectivity, either functional or structural. Indeed, the real advantageof exploring in the intrinsic space (especially when coupled with virtual-realitytechnology), is the ability to understand the connectivity relationship amonga number of brain regions as neuroimagers unfold complex high-dimensionalconnectivity data into easily understandable and relatable configurations in 3D(Figure 4). By representing structural or functional connectomes using high-dimensional data followed by dimensionality reduction, this visualization soft-ware creates a “road map” of the human brain. While the actual connectivitymatrix can be parsed much like knowing the distance to any stop of a roadtrip it is hard to comprehend these strict numerical quantities without a mapto help guide relative locations. BRAINtrinsic facilitates this appreciation andfurther provides methods for interacting with individual nodes to discover highlyintegrated circuits in both functional and structural connectomes.
References
1. Alper, B., Hollerer, T., Kuchera-Morin, J., Forbes, A.: Stereoscopic highlighting:2d graph visualization on stereo displays. Visualization and Computer Graphics,IEEE Transactions on 17(12), 2325–2333 (2011)
2. Borg, I., Groenen, P.J.: Modern multidimensional scaling: Theory and applications.Springer Science & Business Media (2005)
3. Bullmore, E., Sporns, O.: Complex brain networks: graph theoretical analysis ofstructural and functional systems. Nature Reviews Neuroscience 10(3), 186–198(2009)
4. Bullmore, E.T., Bassett, D.S.: Brain graphs: graphical models of the human brainconnectome. Annual review of clinical psychology 7, 113–140 (2011)
5. Dijkstra, E.W.: A note on two problems in connexion with graphs. Numerischemathematik 1(1), 269–271 (1959)
6. Febretti, A., Nishimoto, A., Thigpen, T., Talandis, J., Long, L., Pirtle, J., Peterka,T., Verlo, A., Brown, M., Plepys, D., et al.: Cave2: a hybrid reality environment for

10 G. Conte et al.
immersive simulation and information analysis. In: IS&T/SPIE Electronic Imag-ing. pp. 864903–864903. International Society for Optics and Photonics (2013)
7. Fischl, B.: Freesurfer. Neuroimage 62(2), 774–781 (2012)8. Forbes, A., Villegas, J., Almryde, K.R., Plante, E.: A stereoscopic system for view-
ing the temporal evolution of brain activity clusters in response to linguistic stimuli.In: IS&T/SPIE Electronic Imaging. pp. 90110I–90110I. International Society forOptics and Photonics (2014)
9. GadElkarim, J.J., Schonfeld, D., Ajilore, O., Zhan, L., Zhang, A.F., Feusner,J.D., Thompson, P.M., Simon, T.J., Kumar, A., Leow, A.D.: A framework forquantifying node-level community structure group differences in brain connectiv-ity networks. In: Medical Image Computing and Computer-Assisted Intervention–MICCAI 2012, pp. 196–203. Springer (2012)
10. Gerhard, S., Daducci, A., Lemkaddem, A., Meuli, R., Thiran, J.P., Hagmann,P.: The connectome viewer toolkit: an open source framework to manage, analyzeand visualize connectomes. Frontiers in Neuroinformatics 5(3) (2011), http://www.frontiersin.org/neuroinformatics/10.3389/fninf.2011.00003/abstract
11. Hagmann, P., Cammoun, L., Gigandet, X., Meuli, R., Honey, C.J., Wedeen, V.J.,Sporns, O.: Mapping the structural core of human cerebral cortex. PLoS biology6(7), e159 (2008)
12. van den Heuvel, M.P., Sporns, O.: Rich-club organization of the human connec-tome. The Journal of neuroscience 31(44), 15775–15786 (2011)
13. Howells, S., Maxwell, R., Peet, A., Griffiths, J.: An investigation of tumor 1hnuclear magnetic resonance spectra by the application of chemometric techniques.Magnetic resonance in medicine 28(2), 214–236 (1992)
14. Jolliffe, I.: Principal component analysis. Wiley Online Library (2002)15. Jones, D.K.: Diffusion MRI: Theory, methods, and applications. Oxford University
Press (2010)16. LaPlante, R.A., Douw, L., Tang, W., Stufflebeam, S.M.: The connectome visu-
alization utility: Software for visualization of human brain networks. PLoS ONE9(12), e113838 (12 2014), http://dx.doi.org/10.1371%2Fjournal.pone.0113838
17. van der Maaten, L.J., Postma, E.O., van den Herik, H.J.: Dimensionality reduc-tion: A comparative review. Journal of Machine Learning Research 10(1-41), 66–71(2009)
18. Munzner, T.: Process and pitfalls in writing information visualization researchpapers. In: Information visualization, pp. 134–153. Springer (2008)
19. Robertson, G.G., Mackinlay, J.D., Card, S.K.: Cone trees: animated 3d visual-izations of hierarchical information. In: Proceedings of the SIGCHI conference onHuman factors in computing systems. pp. 189–194. ACM (1991)
20. Sporns, O.: The human connectome: a complex network. Annals of the New YorkAcademy of Sciences 1224(1), 109–125 (2011)
21. Sporns, O., Tononi, G., Kotter, R.: The human connectome: a structural descrip-tion of the human brain. PLoS computational biology 1(4), e42 (2005)
22. Vujovic, S., Henderson, S., Presneau, N., Odell, E., Jacques, T., Tirabosco, R.,Boshoff, C., Flanagan, A.: Brachyury, a crucial regulator of notochordal devel-opment, is a novel biomarker for chordomas. The Journal of pathology 209(2),157–165 (2006)
23. Ware, C., Mitchell, P.: Visualizing graphs in three dimensions. ACM Transactionson Applied Perception (TAP) 5(1), 2 (2008)
24. Xia, M., Wang, J., He, Y.: Brainnet viewer: a network visualization tool for humanbrain connectomics. PloS one 8(7), e68910 (2013)