bp 4q & full year 2017 results & strategy update · bp 4q 2017 resultsbp 4q & full year...
TRANSCRIPT
BP 4Q 2017 RESULTS 1BP 4Q & FULL YEAR 2017 RESULTS & STRATEGY UPDATE 1
6 FEBRUARY 2018
BP 4Q & FULL YEAR 2017 RESULTS & STRATEGY UPDATE
STRONGER FUTURE IN A CHANGING WORLD
1

BP 4Q 2017 RESULTS 2BP 4Q & FULL YEAR 2017 RESULTS & STRATEGY UPDATE 2
BP 4Q & FULL YEAR 2017 RESULTS & STRATEGY UPDATE
Group Chief Executive
Bob Dudley
Hello everyone and welcome to BP’s fourth-quarter and full-year 2017 results and anupdate on BP’s strategy.
I would like to thank everyone for joining us – here in the room in London, as well asthose of you online around the globe.
I know it’s very early in the morning or late in the evening for some of you, so aparticular thanks to you.
2
BP 4Q 2017 RESULTS 3BP 4Q & FULL YEAR 2017 RESULTS & STRATEGY UPDATE 3
Cautionary statementForward-looking statements - cautionary statement
In order to utilize the ‘safe harbor’ provisions of the United States Private Securities Litigation Reform Act of 1995 (the ‘PSLRA’), BP is providing the following cautionary statement. This presentation and the associated slidesand discussion contain forward-looking statements – that is, statements related to future, not past events – with respect to the financial condition, results of operations and business of BP and certain of the expectations,intentions, plans and objectives of BP with respect to these items, in particular statements regarding expectations related to future oil prices and supply and demand; expectations related to global energy supply and demandincluding with respect to natural gas and renewables; expectations regarding industry refining margins, turnaround activity and discounts for North American heavy crude oil in the first quarter of 2018; expectations regardingUpstream underlying production in 2018 and Upstream reported production in the first quarter of 2018; expectations regarding the timing and amount of future payments relating to the Gulf of Mexico oil spill; plans andexpectations regarding the strategic partnership with Lightsource; plans and expectations with respect to Upstream projects, production, investments and activities in the Africa Transform Margin, the Atlantic Margin,Argentina, Azerbaijan, Brazil, Egypt, the Gulf of Mexico, India, Indonesia, the Lower 48, the North Sea, Norway, Nova Scotia, Oman, and Trinidad; plans and expectations regarding joint ventures with Rosneft; plans andexpectations regarding major projects production including with respect to margins and production of 900 thousand barrels per day by 2021; expectations regarding organic capital expenditure, organic free cash flow, theorganic breakeven point, inorganic cash flow, average operating cash flow, the DD&A charge, the Other Businesses and Corporate average underlying quarterly charge and the 2018 adjusted effective tax rate; plans andexpectations regarding sustainable free cash flow and distributions to shareholders over the long term; expectations that ROACE will exceed 10% by 2021; plans and expectations regarding Downstream underlying earningsgrowth, free cash flow and pre-tax returns by 2021; plans and expectations regarding retail markets in Mexico, India, Indonesia and China; expectations with respect to base decline, margins per barrel and development costsper barrel; plans to set operational emissions reduction targets and expectations regarding operational emissions; plans and expectations regarding spending on and development of renewables including through newtechnologies, new business models, venturing and research, OGCI collaboration and the $1 billion investment fund; plans and expectations regarding the BP-Beyond Limits partnership; plans to maintain focus on safety anddiscipline; plans and expectations to offset scrip dilution and balance disciplined investment and regarding deleveraging of the balance sheet and distributions growth; expectations regarding the amount and timing ofdivestment proceeds; plans and expectations to target gearing within a 20-30% band; [and plans and expectations with respect to dividends]. By their nature, forward-looking statements involve risk and uncertainty becausethey relate to events and depend on circumstances that will or may occur in the future and are outside the control of BP. Actual results may differ materially from those expressed in such statements, depending on a variety offactors, including: the specific factors identified in the discussions accompanying such forward-looking statements; the receipt of relevant third party and/or regulatory approvals; the timing and level of maintenance and/orturnaround activity; the timing and volume of refinery additions and outages; the timing of bringing new fields onstream; the timing, quantum and nature of certain divestments; future levels of industry product supply, demandand pricing, including supply growth in North America; OPEC quota restrictions; PSA effects; operational and safety problems; potential lapses in product quality; economic and financial market conditions generally or in variouscountries and regions; political stability and economic growth in relevant areas of the world; changes in laws and governmental regulations; regulatory or legal actions including the types of enforcement action pursued and thenature of remedies sought or imposed; the actions of prosecutors, regulatory authorities and courts; delays in the processes for resolving claims; amounts ultimately payable and timing of payments relating to the Gulf ofMexico oil spill; exchange rate fluctuations; development and use of new technology; recruitment and retention of a skilled workforce; the success or otherwise of partnering; the actions of competitors, trading partners,contractors, subcontractors, creditors, rating agencies and others; our access to future credit resources; business disruption and crisis management; the impact on our reputation of ethical misconduct and non-compliance withregulatory obligations; trading losses; major uninsured losses; decisions by Rosneft’s management and board of directors; the actions of contractors; natural disasters and adverse weather conditions; changes in publicexpectations and other changes to business conditions; wars and acts of terrorism; cyber-attacks or sabotage; and other factors discussed under “Principal risks and uncertainties” in the results announcement for the periodended 30 June 2017 and “Risk factors” in BP Annual Report and Form 20-F 2016 as filed with the US Securities and Exchange Commission.
This document contains references to non-proved resources and production outlooks based on non-proved resources that the SEC's rules prohibit us from including in our filings with the SEC. U.S. investors are urged toconsider closely the disclosures in our Form 20-F, SEC File No. 1-06262. This form is available on our website at www.bp.com. You can also obtain this form from the SEC by calling 1-800-SEC-0330 or by logging on to theirwebsite at www.sec.gov
Reconciliations to GAAP - This presentation also contains financial information which is not presented in accordance with generally accepted accounting principles (GAAP). A quantitative reconciliation of this information to themost directly comparable financial measure calculated and presented in accordance with GAAP can be found on our website at www.bp.com.Tables and projections in this presentation are BP projections unless otherwise stated. February 2018
Before we begin, I need to draw your attention to the cautionary statement. It is longand detailed, but necessary. Please have a read when you have a moment.
3
BP 4Q 2017 RESULTS 4BP 4Q & FULL YEAR 2017 RESULTS & STRATEGY UPDATE 4
Agenda
Bernard LooneyChief executive, Upstream
Upstream
4
Brian GilvaryChief financial officer
4Q results & financial frame
2
Lamar McKayDeputy group chief executive
Advancing the energytransition
3
Summary & Q&A
6
Tufan ErginbilgicChief executive, Downstream
Downstream
5
Group strategic review
1
Bob DudleyGroup chief executive
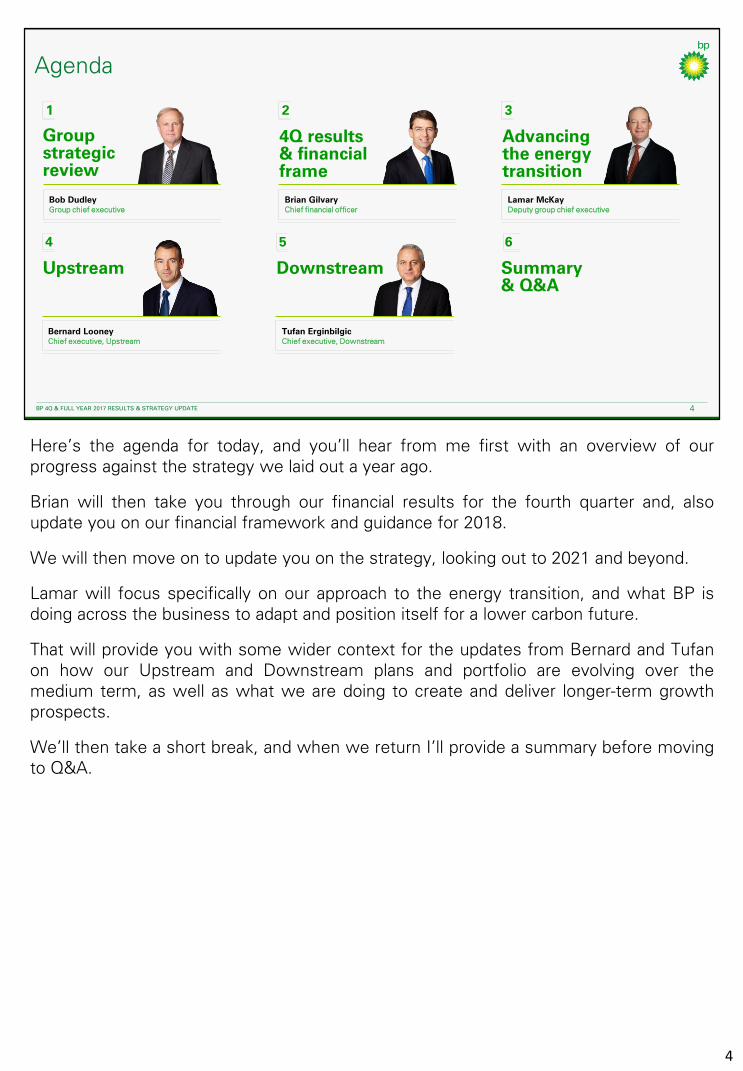
Here’s the agenda for today, and you’ll hear from me first with an overview of ourprogress against the strategy we laid out a year ago.
Brian will then take you through our financial results for the fourth quarter and, alsoupdate you on our financial framework and guidance for 2018.
We will then move on to update you on the strategy, looking out to 2021 and beyond.
Lamar will focus specifically on our approach to the energy transition, and what BP isdoing across the business to adapt and position itself for a lower carbon future.
That will provide you with some wider context for the updates from Bernard and Tufanon how our Upstream and Downstream plans and portfolio are evolving over themedium term, as well as what we are doing to create and deliver longer-term growthprospects.
We’ll then take a short break, and when we return I’ll provide a summary before movingto Q&A.
4
BP 4Q 2017 RESULTS 5BP 4Q & FULL YEAR 2017 RESULTS & STRATEGY UPDATE 5
2017 – a year of strong delivery
Underlying replacement cost profit
$6.2bn
Financial highlights
Organic capital expenditure
$16.5bn
Underlying operating cash flow1
$24.3bn
Divestment proceeds2
$4.3bn
Gulf of Mexico oil spill payments3
$5.3bnGearing
27.4%(1) Underlying operating cash flow is net cash provided by/(used in) operating activities excluding pre-tax Gulf of Mexico oil spill payments (2) Total proceeds, includes net proceeds received from the initial public offering of BP Midstream Partners LP (3) Gulf of Mexico pre-tax oil spill payments (4) Combined basis of subsidiaries and equity accounted entities, excluding acquisitions and divestments
major projects in 2017
7
Sharebuyback programme
Fuels marketing
>10%
Biggest year of exploration since 2004
discoveries6
reserves replacement4
143%
earnings growth
Strong refining availability
>95%
Backin solar
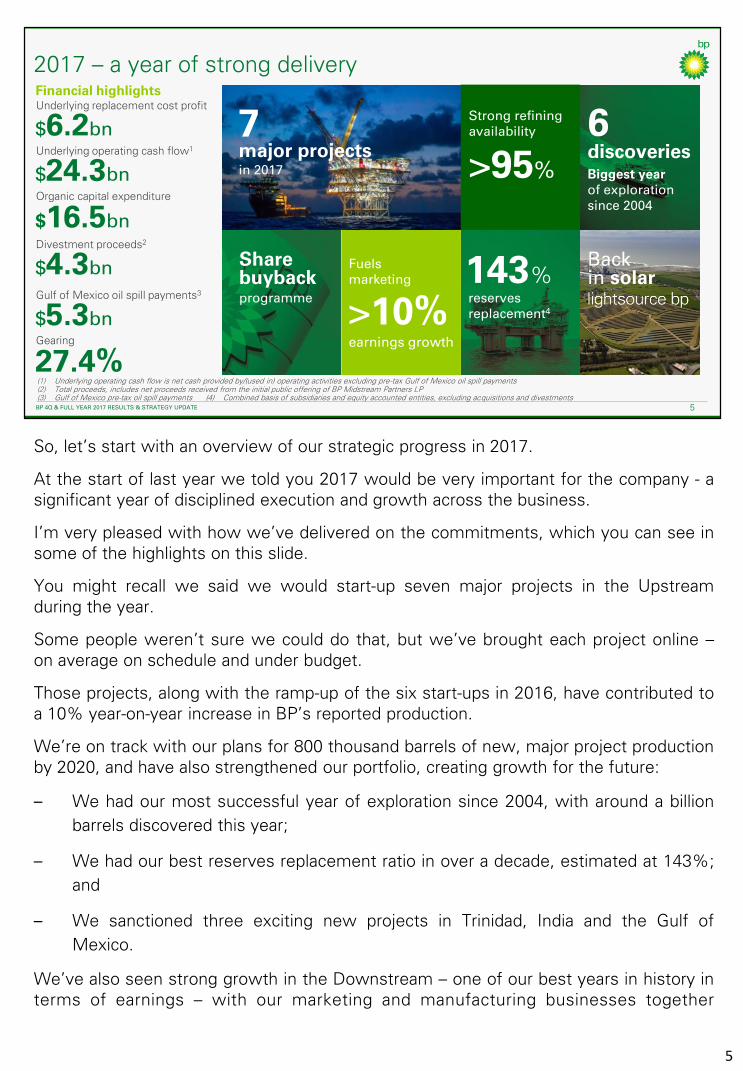
So, let’s start with an overview of our strategic progress in 2017.
At the start of last year we told you 2017 would be very important for the company - asignificant year of disciplined execution and growth across the business.
I’m very pleased with how we’ve delivered on the commitments, which you can see insome of the highlights on this slide.
You might recall we said we would start-up seven major projects in the Upstreamduring the year.
Some people weren’t sure we could do that, but we’ve brought each project online –on average on schedule and under budget.
Those projects, along with the ramp-up of the six start-ups in 2016, have contributed toa 10% year-on-year increase in BP’s reported production.
We’re on track with our plans for 800 thousand barrels of new, major project productionby 2020, and have also strengthened our portfolio, creating growth for the future:
– We had our most successful year of exploration since 2004, with around a billion
barrels discovered this year;
– We had our best reserves replacement ratio in over a decade, estimated at 143%;
and
– We sanctioned three exciting new projects in Trinidad, India and the Gulf of
Mexico.
We’ve also seen strong growth in the Downstream – one of our best years in history interms of earnings – with our marketing and manufacturing businesses together
5

delivering around $1 billion of underlying earnings improvement in the year,through:
– Continued volume growth in premium fuels and lubricants;
– The strong performance of our refining operations, averaging morethan 95% availability across the year; and
– Earnings growth of over 10% in fuels marketing. We now have around1,100 retail convenience partnership sites around the world. We haveplans to continue growing our retail network across existing markets aswell as new markets such as India, Indonesia, Mexico and China.
We also grew our Alternative Energy businesses - iwth availability around95% resulting in strong operating cash flow in 2017. We went back intosolar, but in a new way, in partnership with Lightsource. This is a veryexciting development for us. We are combining our scale, relationships andexpertise in major projects with Lightsource’s expertise in developing solarprojects.
Overall, 2017 has proved to be one of the strongest years of operationaldelivery in recent history, and this is also reflected in our full-year financialresults:
– Our underlying replacement cost profit of $6.2 billion, more than
double that of 2016;
– An underlying operating cash flow of $24.3 billion, excluding pre-tax
oil spill related payments; and
– Gearing of 27.4% at year end, comfortably within our 20-30% target
band.
In addition:
– Our organic capital expenditure was $16.5 billion;
– Total divestments and other proceeds were $4.3 billion, and we made
pre-tax Gulf of Mexico oil spill payments of $5.3 billion; and
– We distributed $7.9 billion of dividends to shareholders, of which $6.2
billion were in cash.
And as you saw in our announcement in October, with the strongunderlying performance and our confidence in growing organic free cashflow, we recommenced a share buyback programme in the fourth quarterof 2017, buying back shares through the fourth quarter to offset the scripdividend issued in September. That commitment remains.
5
BP 4Q 2017 RESULTS 6BP 4Q & FULL YEAR 2017 RESULTS & STRATEGY UPDATE 6
Primary energy consumption by fuel1
bn tonnes of oil equivalent
0
10
20
30
40
50
1965 1975 1985 1995 2005 2015 2025 2035
Oil Gas RenewablesHydroCoal Nuclear
Shares of primary energy1
%
Changing dynamics of supply and demand
(1) Source: BP Energy Outlook 2017
Oil Gas RenewablesHydroCoal Nuclear
0
4
8
12
16
20
1965 1975 1985 1995 2005 2015 2025 2035
Forecast Forecast
6
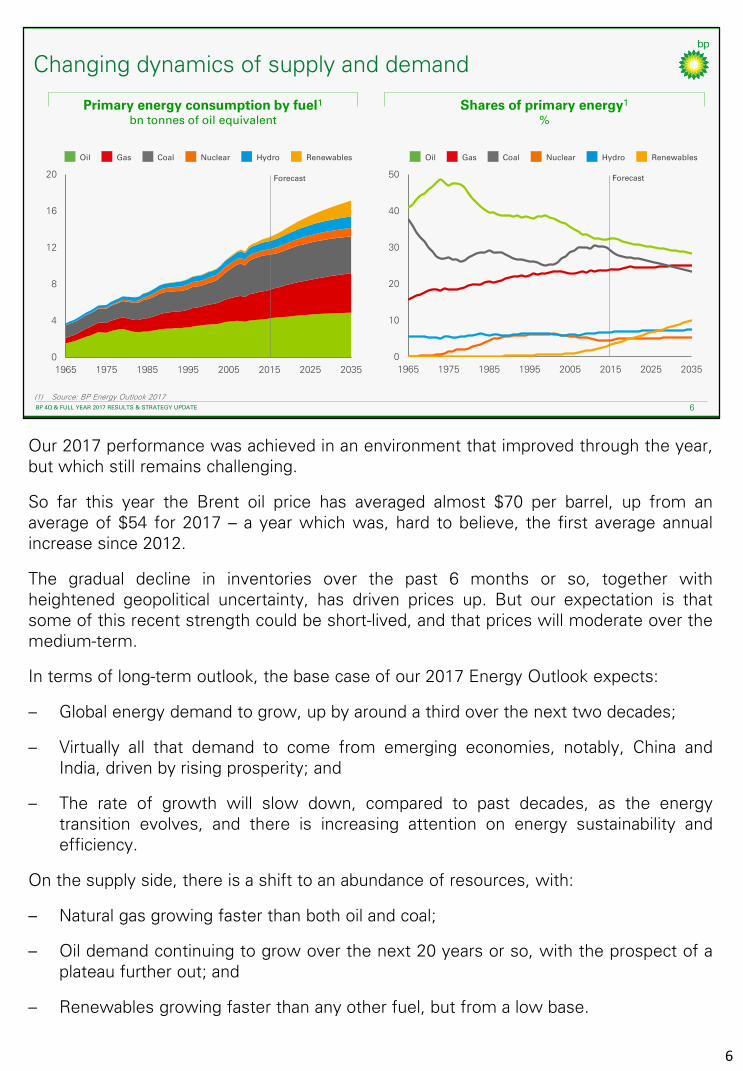
Our 2017 performance was achieved in an environment that improved through the year,but which still remains challenging.
So far this year the Brent oil price has averaged almost $70 per barrel, up from anaverage of $54 for 2017 – a year which was, hard to believe, the first average annualincrease since 2012.
The gradual decline in inventories over the past 6 months or so, together withheightened geopolitical uncertainty, has driven prices up. But our expectation is thatsome of this recent strength could be short-lived, and that prices will moderate over themedium-term.
In terms of long-term outlook, the base case of our 2017 Energy Outlook expects:
– Global energy demand to grow, up by around a third over the next two decades;
– Virtually all that demand to come from emerging economies, notably, China andIndia, driven by rising prosperity; and
– The rate of growth will slow down, compared to past decades, as the energytransition evolves, and there is increasing attention on energy sustainability andefficiency.
On the supply side, there is a shift to an abundance of resources, with:
– Natural gas growing faster than both oil and coal;
– Oil demand continuing to grow over the next 20 years or so, with the prospect of aplateau further out; and
– Renewables growing faster than any other fuel, but from a low base.
BP 4Q 2017 RESULTS 7BP 4Q & FULL YEAR 2017 RESULTS & STRATEGY UPDATE 7
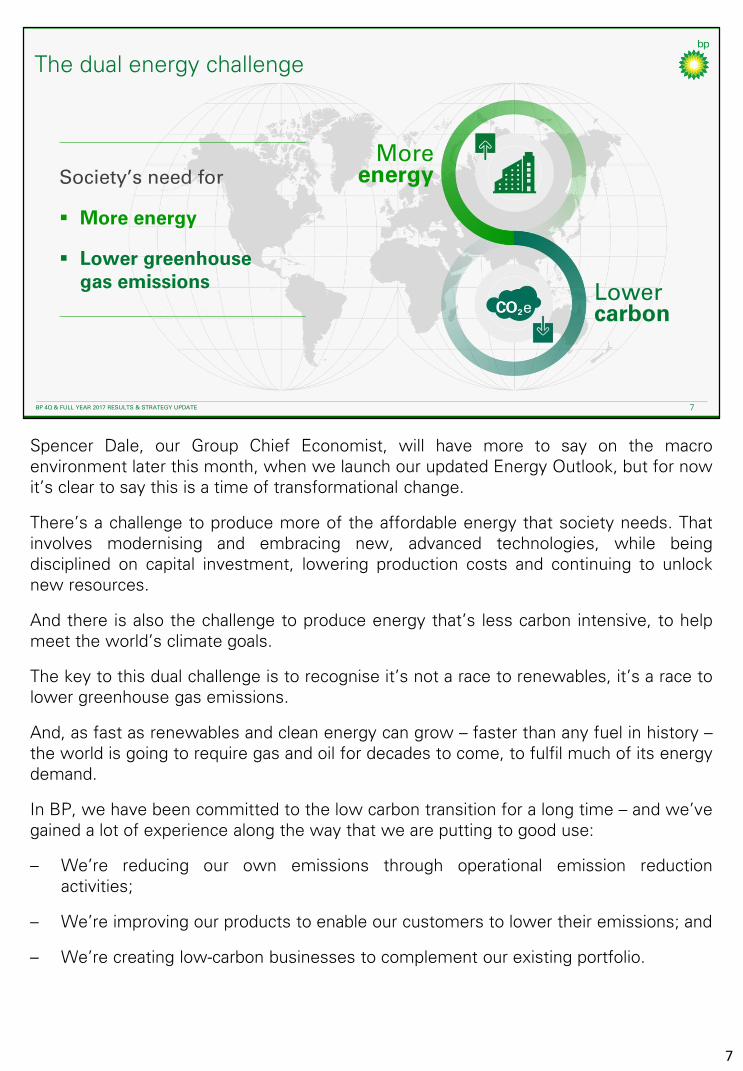
The dual energy challenge
Society’s need for
▪ More energy
▪ Lower greenhouse gas emissions
Moreenergy
Lowercarbon
Spencer Dale, our Group Chief Economist, will have more to say on the macroenvironment later this month, when we launch our updated Energy Outlook, but for nowit’s clear to say this is a time of transformational change.
There’s a challenge to produce more of the affordable energy that society needs. Thatinvolves modernising and embracing new, advanced technologies, while beingdisciplined on capital investment, lowering production costs and continuing to unlocknew resources.
And there is also the challenge to produce energy that’s less carbon intensive, to helpmeet the world’s climate goals.
The key to this dual challenge is to recognise it’s not a race to renewables, it’s a race tolower greenhouse gas emissions.
And, as fast as renewables and clean energy can grow – faster than any fuel in history –the world is going to require gas and oil for decades to come, to fulfil much of its energydemand.
In BP, we have been committed to the low carbon transition for a long time – and we’vegained a lot of experience along the way that we are putting to good use:
– We’re reducing our own emissions through operational emission reductionactivities;
– We’re improving our products to enable our customers to lower their emissions; and
– We’re creating low-carbon businesses to complement our existing portfolio.
7

There is a lot of uncertainty around the pace and direction of change –probably more than at any time I can recall – but we have a strong andflexible platform to build on, giving us the ability to adapt quickly in anyenvironment.
With the experience we have, the portfolio we have created and theflexibility of our strategy, we can embrace the low-carbon future in a waythat enhances our investor proposition.
You’ll hear more detail from Lamar on what we have been doing aroundadvancing the energy transition.
7
BP 4Q 2017 RESULTS 8BP 4Q & FULL YEAR 2017 RESULTS & STRATEGY UPDATE 8
The BP proposition
Safer
Fit for the future
Focused on returns
Safe, reliable and efficient execution
A distinctive portfolio fit for a changing world
Value based,disciplined investment and cost focus
Growing sustainable free cash flow and
distributions toshareholders over
the long-term
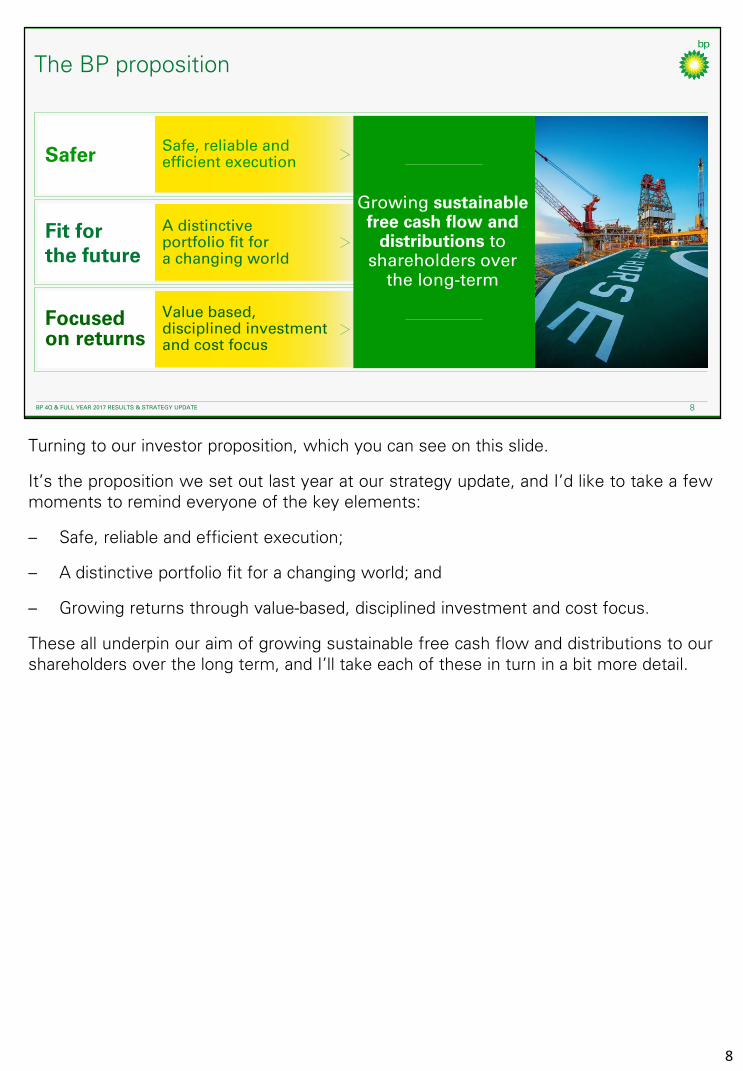
Turning to our investor proposition, which you can see on this slide.
It’s the proposition we set out last year at our strategy update, and I’d like to take a fewmoments to remind everyone of the key elements:
– Safe, reliable and efficient execution;
– A distinctive portfolio fit for a changing world; and
– Growing returns through value-based, disciplined investment and cost focus.
These all underpin our aim of growing sustainable free cash flow and distributions to ourshareholders over the long term, and I’ll take each of these in turn in a bit more detail.
8
BP 4Q 2017 RESULTS 9BP 4Q & FULL YEAR 2017 RESULTS & STRATEGY UPDATE 9
Safe, reliable and efficient execution
Process Safety Events (PSE)number of instances
0
20
40
60
80
100
120
140
2013 2014 2015 2016 2017
PSE Tier 1 PSE Tier 2
(1) Operated portfolio(2) Refining availability and petrochemicals reliability
95%
Downstream availability2
in 2017
95%
Upstream plant reliability1
in 2017
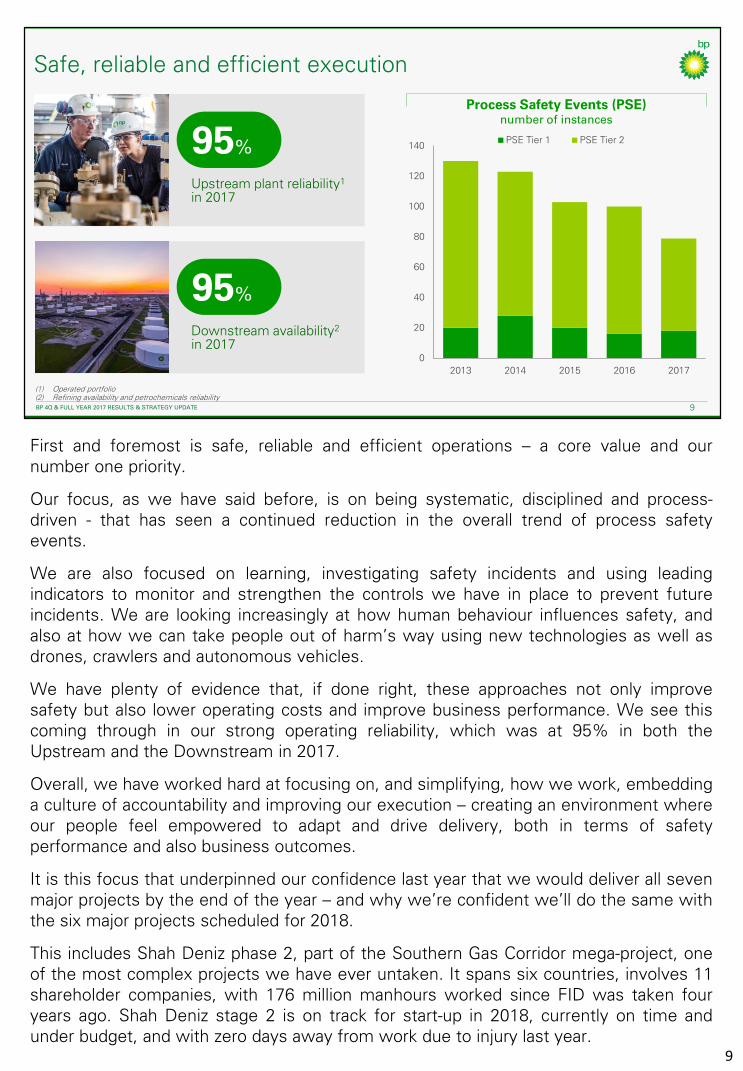
First and foremost is safe, reliable and efficient operations – a core value and ournumber one priority.
Our focus, as we have said before, is on being systematic, disciplined and process-driven - that has seen a continued reduction in the overall trend of process safetyevents.
We are also focused on learning, investigating safety incidents and using leadingindicators to monitor and strengthen the controls we have in place to prevent futureincidents. We are looking increasingly at how human behaviour influences safety, andalso at how we can take people out of harm’s way using new technologies as well asdrones, crawlers and autonomous vehicles.
We have plenty of evidence that, if done right, these approaches not only improvesafety but also lower operating costs and improve business performance. We see thiscoming through in our strong operating reliability, which was at 95% in both theUpstream and the Downstream in 2017.
Overall, we have worked hard at focusing on, and simplifying, how we work, embeddinga culture of accountability and improving our execution – creating an environment whereour people feel empowered to adapt and drive delivery, both in terms of safetyperformance and also business outcomes.
It is this focus that underpinned our confidence last year that we would deliver all sevenmajor projects by the end of the year – and why we’re confident we’ll do the same withthe six major projects scheduled for 2018.
This includes Shah Deniz phase 2, part of the Southern Gas Corridor mega-project, oneof the most complex projects we have ever untaken. It spans six countries, involves 11shareholder companies, with 176 million manhours worked since FID was taken fouryears ago. Shah Deniz stage 2 is on track for start-up in 2018, currently on time andunder budget, and with zero days away from work due to injury last year.
9
BP 4Q 2017 RESULTS 10BP 4Q & FULL YEAR 2017 RESULTS & STRATEGY UPDATE 10
A distinctive portfolio
Downstream
Price leverage % operating cash flow2
Deep reserves baseProved reserves1
bn boe
18.4
Oil linked
Gas linked
Fixed + other
(1) Estimated net proved reserves on an oil equivalent basis as at 31 December 2017. Includes BP’s estimated share of Rosneft and other equity-accounted entities(2) Average operating cash flow 2017-2021
Strong brands
Upstream
Balanced refining throughput bbl/day
US
Rest of World
Europe
Gas
Liquids
Alternative Energy
Renewable PRODUCTS
Renewable FUELS
Renewable POWER
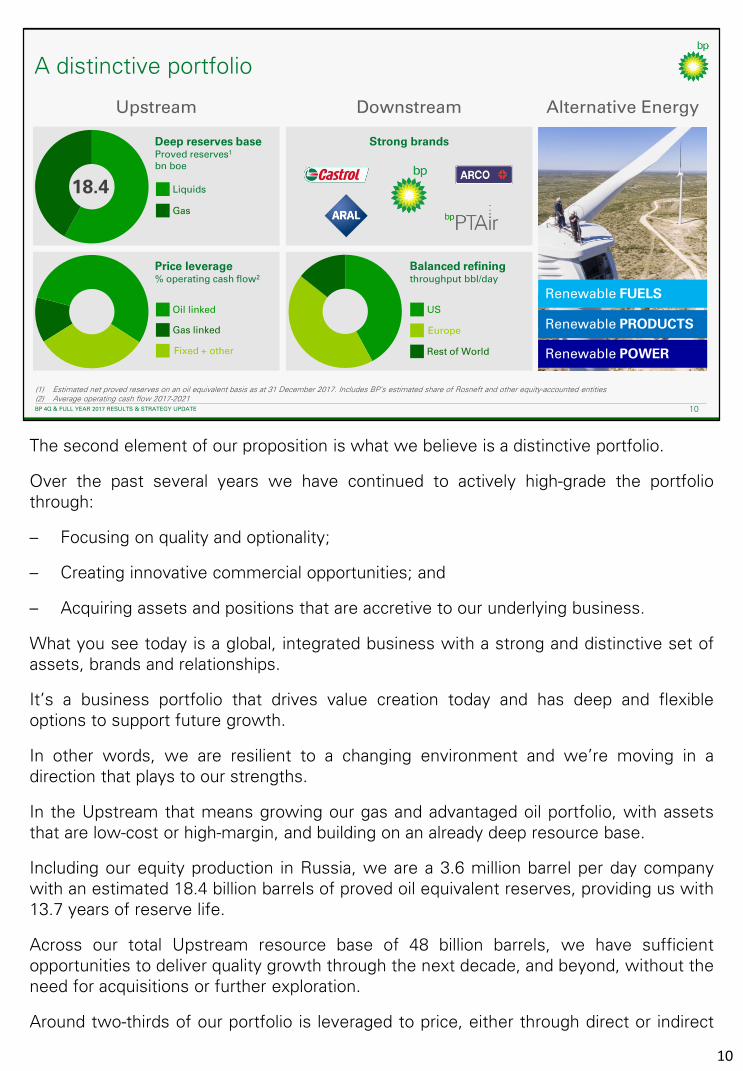
The second element of our proposition is what we believe is a distinctive portfolio.
Over the past several years we have continued to actively high-grade the portfoliothrough:
– Focusing on quality and optionality;
– Creating innovative commercial opportunities; and
– Acquiring assets and positions that are accretive to our underlying business.
What you see today is a global, integrated business with a strong and distinctive set ofassets, brands and relationships.
It’s a business portfolio that drives value creation today and has deep and flexibleoptions to support future growth.
In other words, we are resilient to a changing environment and we’re moving in adirection that plays to our strengths.
In the Upstream that means growing our gas and advantaged oil portfolio, with assetsthat are low-cost or high-margin, and building on an already deep resource base.
Including our equity production in Russia, we are a 3.6 million barrel per day companywith an estimated 18.4 billion barrels of proved oil equivalent reserves, providing us with13.7 years of reserve life.
Across our total Upstream resource base of 48 billion barrels, we have sufficientopportunities to deliver quality growth through the next decade, and beyond, without theneed for acquisitions or further exploration.
Around two-thirds of our portfolio is leveraged to price, either through direct or indirect
10

oil and gas indexation. But importantly, this is balanced with productionfrom fixed-price or similar contracts, which provide a base of steady,resilient, long-term cash flow.
We also have a strong and differentiated Downstream business – whichsome of you may be familiar with if you joined Tufan and the team at hisinvestor day at our Downstream Technology Centre in Pangbourne lastJune.
The portfolio today is a high-quality group of competitively advantagedbusinesses. It covers marketing, manufacturing and our integrated supplyand trading function creating an integrated and value-optimised business.
A differentiated and high-returning marketing business is underpinned bystrong brands, a distinctive premium offer, and has an increasing exposureto growth markets. And in manufacturing, the refining portfolio isgeographically balanced with good access to advantaged feedstock suchas heavy Canadian crude. While in Petrochemicals, our latest technologyallows us to deliver industry-leading cost and environmental performance.
I’ve already mentioned our move back into solar, which is a significantaddition to the wind and biofuels businesses in our Alternative Energyportfolio. We have one of the largest operated renewables portfolio amongour peers, and we are selectively investing in emerging new businessesand technologies to ensure we stay at the forefront of changing globalneeds and the energy transition.
10

BP 4Q 2017 RESULTS 11BP 4Q & FULL YEAR 2017 RESULTS & STRATEGY UPDATE 11
Distinctive partnership – Russia
(1) BP share, preliminary (2) Replacement cost profit before interest and tax (RCPBIT), adjusted for non-operating items and fair value accounting effects(3) Transaction to be closed in 2018, subject to regulatory approvals
Growing a material business
with Rosneft
with Rosneft
Strategic investment in Rosneft
Technical co-operation
with Rosneft (30%) and ENI (60%)
▪ Upstream and Downstream capabilities and processes
with Rosneft and 3 others20%
49%
49%
10%
1.1mmboed2017 production1
19.75% 2shareholding board members
$836million2017 earnings1, 2
$314million2017 dividends paid
Yermak JV
Kharampur JV3
Zohr gas field Egypt
Taas JV
▪ Mature fields optimisation
▪ Co-operation in gas
▪ Health safety and environment
Another highly distinctive aspect of our portfolio is our strategic partnership withRussia’s largest oil company.
Rosneft has a strong portfolio of current and future opportunities onshore and offshore,with assets in all of Russia’s key hydrocarbon regions.
We have developed our relationship with Rosneft in recent years to create what is aunique and advantageous position for BP in one of the largest and lowest-costhydrocarbon resource basins in the world, with access to huge markets, both east andwest.
Our 19.75% shareholding in Rosneft, together with our two Board seats, allows us toinfluence the strategic direction of the company as well as benefit from a diversified setof existing and potential projects in the Russian oil and gas sector. In 2017 BP’s share ofproduction from Rosneft was around 1.1 million per day. We also received $314 millionin dividends, supported by the recent changes in dividend policy to pay out at least 50%of IFRS net profit.
In addition to that equity position, we are building a material business that is generatingincremental value through standalone joint ventures in Russia, and internationally.
We currently have interests in three joint ventures in Russia:
– The Taas JV, in which we have a 20% interest, is developing an oil and gascondensate field in East Siberia. The field is currently producing around 25 thousandbarrels per day and the expansion project is expected to start up in 2018 and raiseproduction to 100 thousand barrels per day by 2021.
– A 49% interest in the Yermak JV, which is conducting onshore exploration in WestSiberia. It also holds seven exploration and production licenses.
11

– We have reached agreement to form a new JV for the Kharampur field,in which we will have a 49% interest. Most regulatory approvals are inplace and we do not see any barriers for the deal closure by the end of2018.
Outside Russia, we also have a 10% interest in the Zohr gas field in Egypt,in which Rosneft holds a 30% interest.
A third aspect to the relationship is technical co-operation to benefit bothRosneft’s performance and the performance of our JV’s.
For example, cooperating on health, safety and environmental issues,including providing these services on a contractual basis, in order to sharebest practice and improve asset performance.
In addition we are developing and applying new methods and products toimprove mature oil and gas fields and refining performance, as well asworking to increase the safety, efficiency of exploration, appraisal and fielddevelopment activities.
Obviously, we work within sanction requirements. Over time, we expect tocontinue to work with Rosneft to further build an important partnershipacross a range of activities.
11

BP 4Q 2017 RESULTS 12BP 4Q & FULL YEAR 2017 RESULTS & STRATEGY UPDATE 12
2016 2017 Environment Underlyingimprovement
2021
Focused on returns
▪ Making the right choices to deliver competitive returns
▪ Capital and cost discipline
▪ Actively managed portfolio
ROACE1
%
2.8
5.8
>10
(1) ROACE reflects underlying replacement cost profit, after adding back minority shareholders’ interests and finance interest net of BP tax assumption, divided by average capital employed excluding cash & cash equivalents and goodwill
(2) Incremental impact of environment in 2021, assuming Brent $55/bbl 2017 real and an RMM of $14/bbl
2
>10% by 2021
ROACE1
Delivering competitive returns
The third element of the BP proposition is our focus on returns.
Returns have been a challenge for the industry as a whole in recent years, with heavyinvestment through the high-price, high-cost cycle, followed by the challenge of bringingcosts down in the lower price environment. And for BP, we had the impact of portfoliochanges and our own significant build phase.
So, what do we mean by focus on returns.
First, as you’ll have heard me say many times, it is a continuous drive to simplify andreduce our costs – without in any way compromising on safety.
Second, is to be very disciplined on capital investment. In both the Upstream andDownstream, we maintain strict investment hurdle rates of return, ensuring we onlyprogress the best options. Once sanctioned, we also optimise full cycle returns of eachproject as they progress through the life of the project.
Third is the active optimisation of the portfolio. We manage for value over the long-term,seeking new ways to grow returns inorganically. Two recent examples are:
– The transaction in the Norwegian North Sea to create AkerBP; and
– The merger of BP and Bridas assets to create Argentina’s largest private integratedoil and gas company – Pan American Energy Group or PAEG; and
Fourth, building mutually beneficial relationships that allow you to operate further downthe cost curve. This can be with resource holders in the most competitive basins, orwith business partners with complementary capabilities – as we’re doing with KosmosEnergy to develop our offshore discoveries in Mauritania and Senegal.
We are now seeing the benefits of the significant build phase of the past few yearsbecoming evident in the bottom line, as our Upstream and Downstream businessesearnings and cash grow. Return on average capital employed, or ROACE, more thandoubled in 2017 versus a year ago, to 5.8%, obviously, still a long way to go. As volumesand margins continue to grow across our operating businesses we expect ROACE torecover steadily and exceed 10% by 2021.
12
BP 4Q 2017 RESULTS 13BP 4Q & FULL YEAR 2017 RESULTS & STRATEGY UPDATE 13
Clear priorities for a changing world
Growing gas and advantaged oil in the Upstream
Modernising the whole Group
Venturing and low carbon across multiple fronts
Market led growth in the Downstream
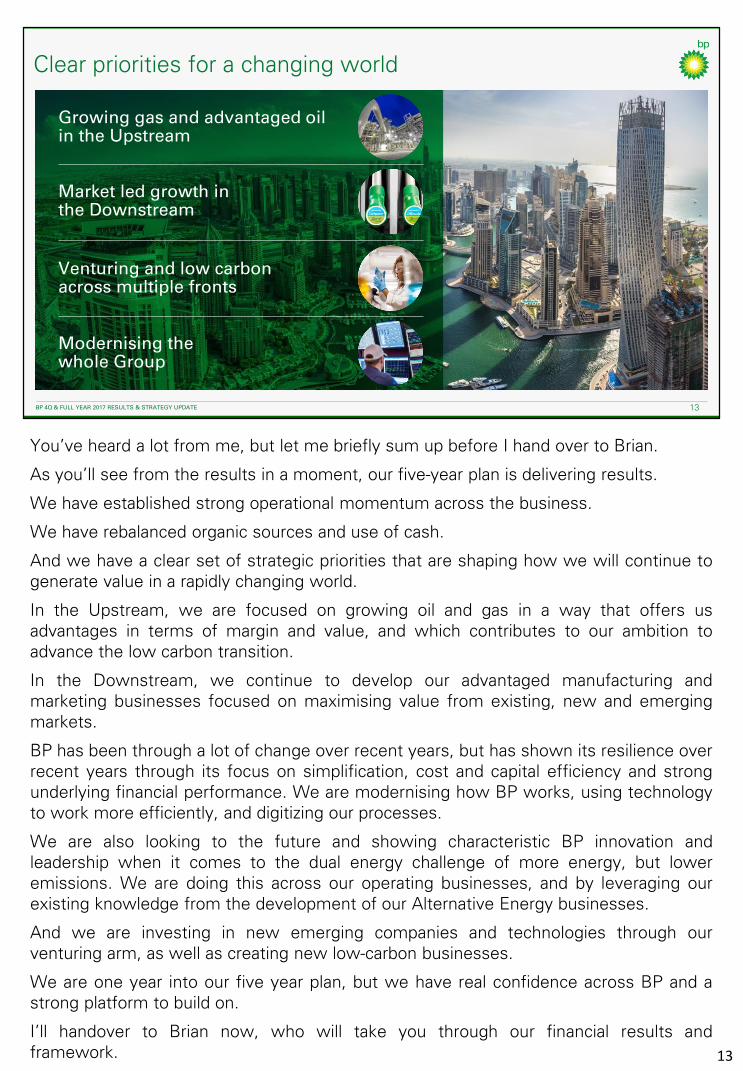
You’ve heard a lot from me, but let me briefly sum up before I hand over to Brian.
As you’ll see from the results in a moment, our five-year plan is delivering results.
We have established strong operational momentum across the business.
We have rebalanced organic sources and use of cash.
And we have a clear set of strategic priorities that are shaping how we will continue togenerate value in a rapidly changing world.
In the Upstream, we are focused on growing oil and gas in a way that offers usadvantages in terms of margin and value, and which contributes to our ambition toadvance the low carbon transition.
In the Downstream, we continue to develop our advantaged manufacturing andmarketing businesses focused on maximising value from existing, new and emergingmarkets.
BP has been through a lot of change over recent years, but has shown its resilience overrecent years through its focus on simplification, cost and capital efficiency and strongunderlying financial performance. We are modernising how BP works, using technologyto work more efficiently, and digitizing our processes.
We are also looking to the future and showing characteristic BP innovation andleadership when it comes to the dual energy challenge of more energy, but loweremissions. We are doing this across our operating businesses, and by leveraging ourexisting knowledge from the development of our Alternative Energy businesses.
And we are investing in new emerging companies and technologies through ourventuring arm, as well as creating new low-carbon businesses.
We are one year into our five year plan, but we have real confidence across BP and astrong platform to build on.
I’ll handover to Brian now, who will take you through our financial results andframework. 13
4Q & FULL YEAR 2017 RESULTS & STRATEGY UPDATE
Group Chief Executive
Bob Dudley
BP 4Q & FULL YEAR 2017 RESULTS & STRATEGY UPDATE
Chief Financial Officer
Brian Gilvary
14
BP 4Q 2017 RESULTS 15BP 4Q & FULL YEAR 2017 RESULTS & STRATEGY UPDATE 15
Environment
(1) Source: Factset(2) Refining Marker Margin (RMM) based on BP’s portfolio All data 1 October 2016 to 2 February 2018
Brent oil price1
$/bblHenry Hub gas price
$/mmbtuRefining Marker Margin2
$/bbl
1 1 12 2 21 1144 4 4 43 3 34
2.5
2.7
2.9
3.1
3.3
3.5
3.7
3.9
Q16 Q17 Q17 Q17 Q17 Q18
8
10
12
14
16
18
20
22
24
Q16 Q17 Q17 Q17 Q17 Q18
40
45
50
55
60
65
70
75
Q16 Q17 Q17 Q17 Q17 Q18
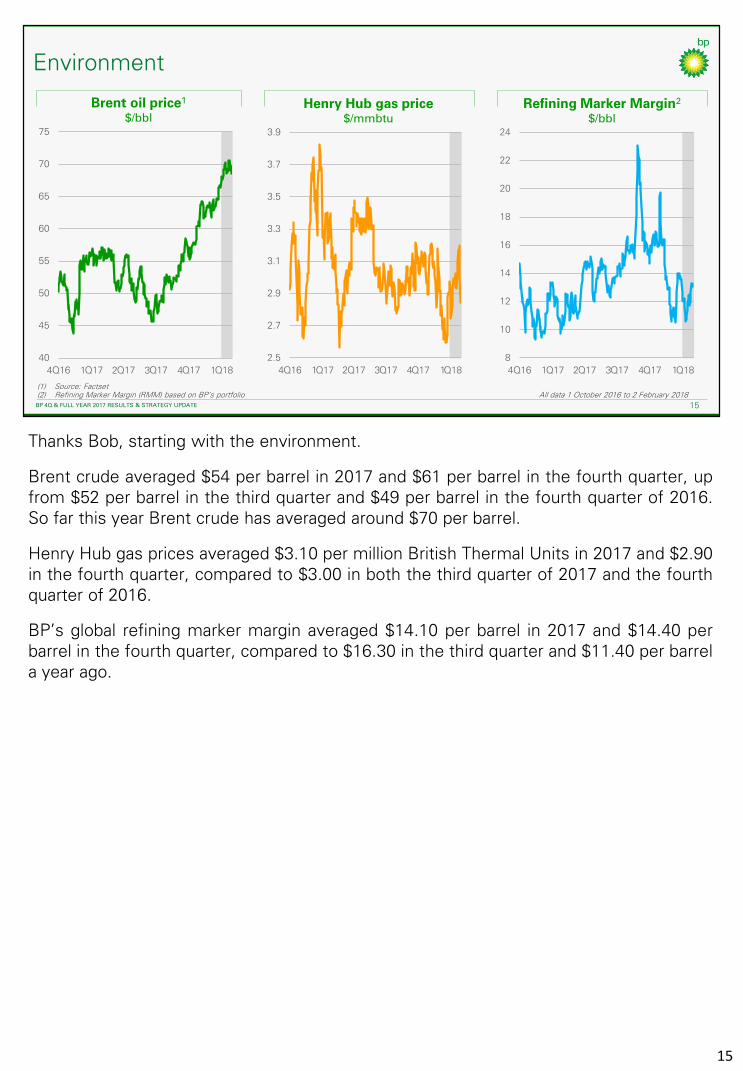
Thanks Bob, starting with the environment.
Brent crude averaged $54 per barrel in 2017 and $61 per barrel in the fourth quarter, upfrom $52 per barrel in the third quarter and $49 per barrel in the fourth quarter of 2016.So far this year Brent crude has averaged around $70 per barrel.
Henry Hub gas prices averaged $3.10 per million British Thermal Units in 2017 and $2.90in the fourth quarter, compared to $3.00 in both the third quarter of 2017 and the fourthquarter of 2016.
BP’s global refining marker margin averaged $14.10 per barrel in 2017 and $14.40 perbarrel in the fourth quarter, compared to $16.30 in the third quarter and $11.40 per barrela year ago.
15
BP 4Q 2017 RESULTS 16BP 4Q & FULL YEAR 2017 RESULTS & STRATEGY UPDATE 16
4Q 2017 summary
(1) Replacement cost profit before interest and tax (RCPBIT), adjusted for non-operating items and fair value accounting effects(2) BP estimate of Rosneft earnings after interest, tax and minority interest(3) Finance costs and net finance income or expense relating to pensions and other post-retirement benefits(4) Underlying operating cash flow is net cash provided by/(used in) operating activities excluding pre-tax Gulf of Mexico oil spill payments
$bn 4Q16 3Q17 4Q17 % Y-o-Y % Q-o-Q
Upstream 0.4 1.6 2.2
Downstream 0.9 2.3 1.5
Other businesses & corporate (0.4) (0.4) (0.4)
Underlying business RCPBIT1 0.9 3.5 3.3 287% (6%)
Rosneft2 0.1 0.1 0.3
Consolidation adjustment - unrealised profit in inventory (0.1) (0.1) (0.1)
Underlying RCPBIT1 0.9 3.5 3.5 306% (1%)
Finance costs3 (0.4) (0.4) (0.6)
Tax (0.1) (1.2) (0.8)
Minority interest (0.0) 0.0 (0.0)
Underlying replacement cost profit 0.4 1.9 2.1 427% 13%
Underlying operating cash flow4 4.5 6.6 6.4 42% (4%)
Underlying earnings per share (cents) 2.1 9.4 10.6 405% 13%
Dividend paid per share (cents) 10 10 10 0% 0%
16
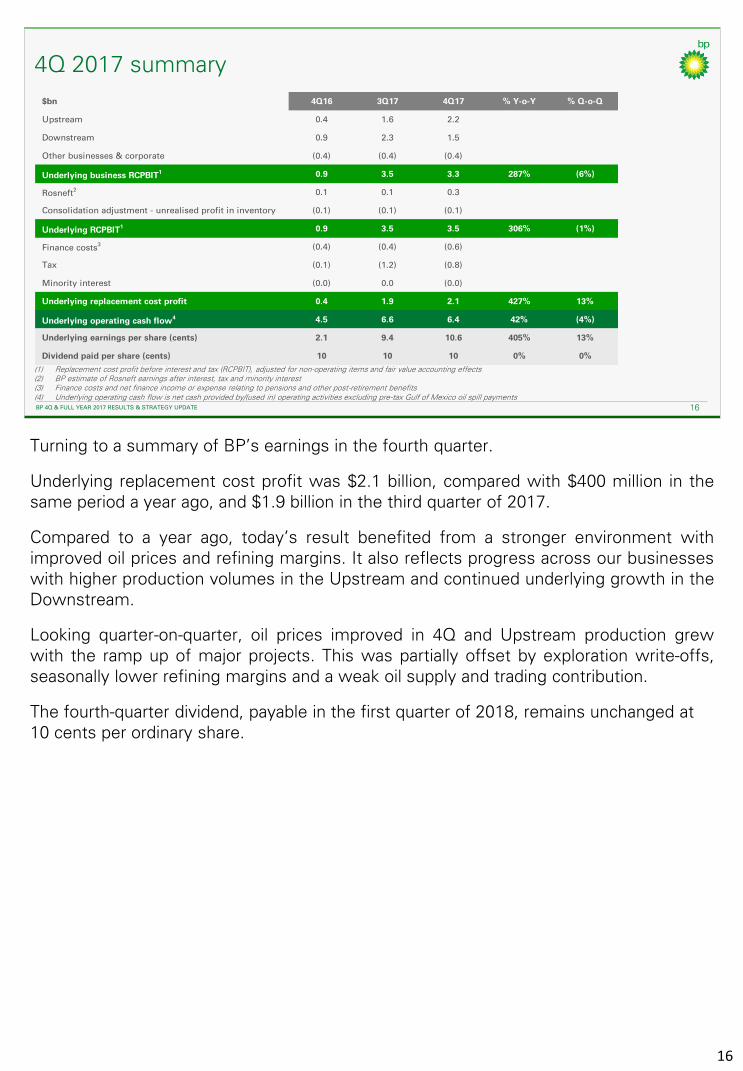
Turning to a summary of BP’s earnings in the fourth quarter.
Underlying replacement cost profit was $2.1 billion, compared with $400 million in thesame period a year ago, and $1.9 billion in the third quarter of 2017.
Compared to a year ago, today’s result benefited from a stronger environment withimproved oil prices and refining margins. It also reflects progress across our businesseswith higher production volumes in the Upstream and continued underlying growth in theDownstream.
Looking quarter-on-quarter, oil prices improved in 4Q and Upstream production grewwith the ramp up of major projects. This was partially offset by exploration write-offs,seasonally lower refining margins and a weak oil supply and trading contribution.
The fourth-quarter dividend, payable in the first quarter of 2018, remains unchanged at 10 cents per ordinary share.
BP 4Q 2017 RESULTS 17BP 4Q & FULL YEAR 2017 RESULTS & STRATEGY UPDATE 17
0.4
1.4
0.7
1.6
2.2
(0.5)
0.0
0.5
1.0
1.5
2.0
2.5
4Q16 1Q17 2Q17 3Q17 4Q17
Non-US US Total RCPBIT
Upstream
(1) Realisations based on sales of consolidated subsidiaries only, excluding equity-accounted entities(2) Group reported oil and gas production including Rosneft estimate(3) Replacement cost profit (loss) before interest and tax (RCPBIT), adjusted for non-operating items and fair value accounting effects
Realisations1 Volumemboe/d
Underlying RCPBIT3
$bn
0
2
4
6
8
10
12
0
10
20
30
40
50
60
4Q16 1Q17 2Q17 3Q17 4Q17
Liquids ($/bbl) Gas ($/mcf)
1500
2000
2500
3000
3500
4000
4Q16 1Q17 2Q17 3Q17 4Q17
Group production
Upstream production excluding Rosneft
2
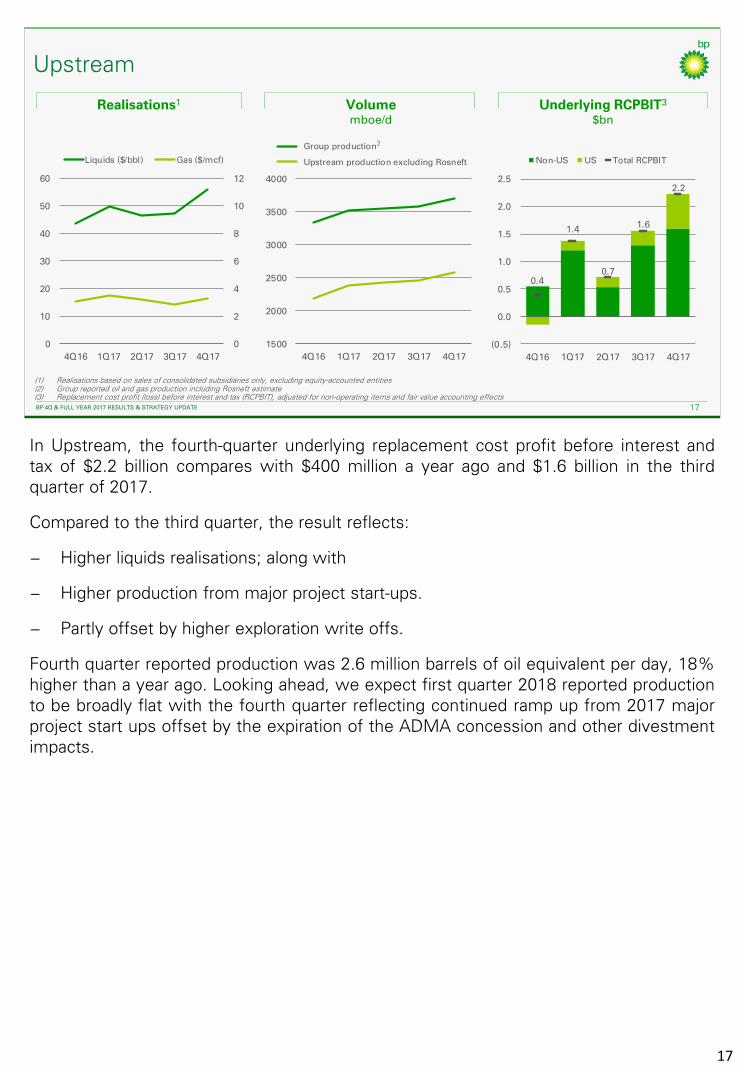
In Upstream, the fourth-quarter underlying replacement cost profit before interest andtax of $2.2 billion compares with $400 million a year ago and $1.6 billion in the thirdquarter of 2017.
Compared to the third quarter, the result reflects:
− Higher liquids realisations; along with
− Higher production from major project start-ups.
− Partly offset by higher exploration write offs.
Fourth quarter reported production was 2.6 million barrels of oil equivalent per day, 18%higher than a year ago. Looking ahead, we expect first quarter 2018 reported productionto be broadly flat with the fourth quarter reflecting continued ramp up from 2017 majorproject start ups offset by the expiration of the ADMA concession and other divestmentimpacts.
17

BP 4Q 2017 RESULTS 18BP 4Q & FULL YEAR 2017 RESULTS & STRATEGY UPDATE 18
Downstream
(1) Source: Platts (CMA: Calendar Month Average); lagged by one month(2) Replacement cost profit before interest and tax (RCPBIT), adjusted for non-operating items and fair value accounting effects
0
4
8
12
16
20
24
4Q16 1Q17 2Q17 3Q17 4Q17
RMM WTI CMA-WCS spread
Refining environment$/bbl
Refining availability%
Underlying RCPBIT2
$bn
1
0.9
1.7
1.4
2.3
1.5
0.0
0.5
1.0
1.5
2.0
2.5
4Q16 1Q17 2Q17 3Q17 4Q17
Fuels Lubricants
Petrochemicals Total RCPBIT
86
88
90
92
94
96
98
4Q16 1Q17 2Q17 3Q17 4Q17
Turning to Downstream, the fourth-quarter underlying replacement cost profit beforeinterest and tax was $1.5 billion compared with $900 million a year ago and $2.3 billion inthe third quarter.
Compared to the third quarter, the result reflects:
− Stronger refining performance with availability at 96.1%, the highest in over adecade.
More than offset by:
− A slightly below breakeven performance in oil supply and trading;
− Seasonally lower industry refining margins and fuels marketing results;
− More turnaround activity; and
− The absence of earnings following the divestment of the SECCO joint venture in ourPetrochemicals business.
Looking to the first quarter of 2018, we expect higher discounts for North Americanheavy crude oil but lower industry refining margins. We also expect turnaround activity tobe lower in refining, but significantly higher in Petrochemicals.
18

Based on preliminary estimates, we have recognised $320 million as BP’s share ofRosneft’s underlying net income for the fourth quarter, compared to $140 million a yearago and $140 million in the third quarter of 2017. Along with a higher Urals price, theestimate reflects a one-off legal settlement in Rosneft’s favour and adverse foreignexchange impacts.
Our estimate of BP’s share of Rosneft’s production for the fourth quarter is 1.1 millionbarrels of oil equivalent per day, a decrease of 2% reflecting participation in Non-OPECoil production cuts.
Further details will be available when Rosneft report their fourth-quarter results.
19
BP 4Q 2017 RESULTS 19BP 4Q & FULL YEAR 2017 RESULTS & STRATEGY UPDATE 19
BP share of underlying net income1
$bn
Average Urals price$/bbl
BP share of Rosneft dividend
$bn
(1) On a replacement cost basis and adjusted for non-operating items; 4Q17 represents BP estimate(2) Half yearly dividend declared representing 50% of Rosneft’s IFRS net income for 1H 2017, paid in the fourth quarter(3) Annual dividends paid in the third quarter, in respect of the previous year
0
10
20
30
40
50
60
70
4Q16 1Q17 2Q17 3Q17 4Q17
0.0
0.1
0.2
0.3
0.4
4Q16 1Q17 2Q17 3Q17 4Q17
0.0
0.2
0.4
2015 2016 2017
Half yearly dividend
Annual dividend for previous year
2
3
Rosneft
BP 4Q 2017 RESULTS 20BP 4Q & FULL YEAR 2017 RESULTS & STRATEGY UPDATE 20
Other items
OB&C underlying RCPBIT1
$bnAdjusted effective tax rate2
%
(1) Other businesses and corporate replacement cost profit before interest and tax (RCPBIT), adjusted for non-operating items (2) Effective tax rate on replacement cost profit adjusted to remove the effects of non-operating items and fair value accounting effects
(0.5)
(0.4)
(0.3)
(0.2)
(0.1)
0.0
4Q16 1Q17 2Q17 3Q17 4Q17
0
10
20
30
40
50
60
70
4Q16 1Q17 2Q17 3Q17 4Q17
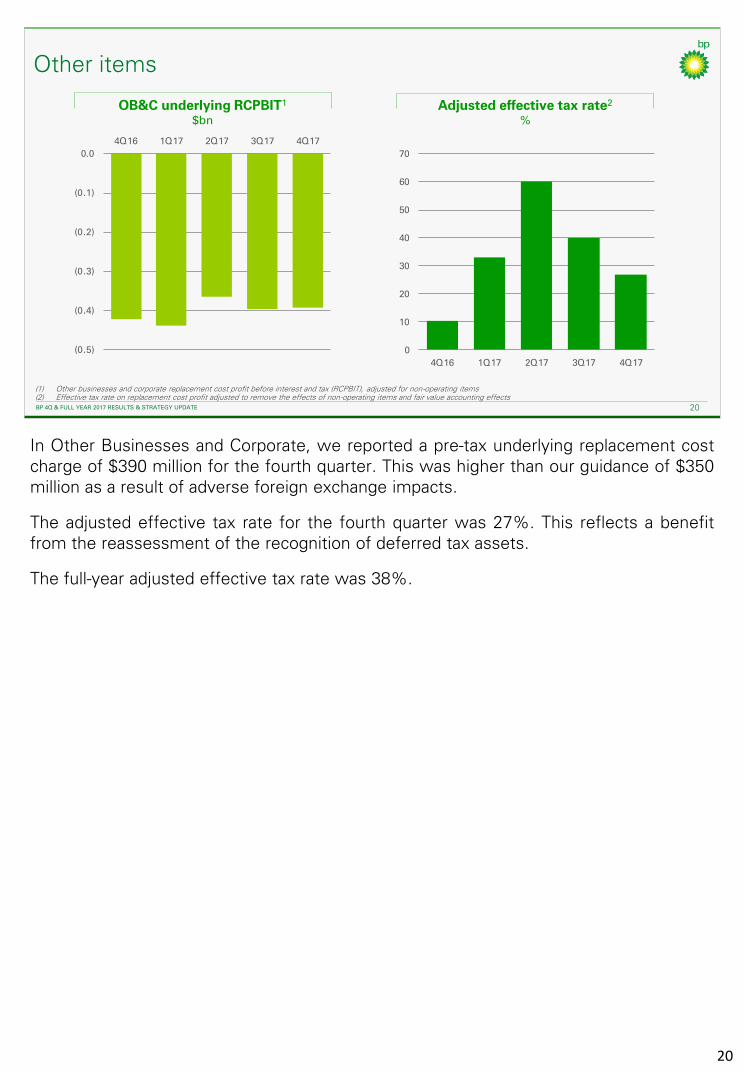
In Other Businesses and Corporate, we reported a pre-tax underlying replacement costcharge of $390 million for the fourth quarter. This was higher than our guidance of $350million as a result of adverse foreign exchange impacts.
The adjusted effective tax rate for the fourth quarter was 27%. This reflects a benefitfrom the reassessment of the recognition of deferred tax assets.
The full-year adjusted effective tax rate was 38%.
20
BP 4Q 2017 RESULTS 21BP 4Q & FULL YEAR 2017 RESULTS & STRATEGY UPDATE 21
0
3
6
9
0
3
6
9
0
4
8
12
16
20
24
28
0
4
8
12
16
20
24
28
Sources and uses of cash2016 organic cash inflows/outflows $bn
Other inflows/outflows $bn
2017 organic cash inflows/outflows $bn
Other inflows/outflows $bn
(1) Underlying operating cash flow is net cash provided by/(used in) operating activities excluding pre-tax Gulf of Mexico oil spill payments(2) Cash dividends paid(3) 2016 includes proceeds for sale of partial shareholding in Castrol India, 2017 includes net proceeds received from the initial public offering of BP Midstream Partners LP
Underlying cash flow1 Organic capex
Dividends2
Disposals3
Gulf of Mexico oil spill
Underlying cash flow1 Organic capex
Dividends2
Disposals3Gulf of Mexico
oil spill
Inorganic capex
Inorganic capex
Share buybacks
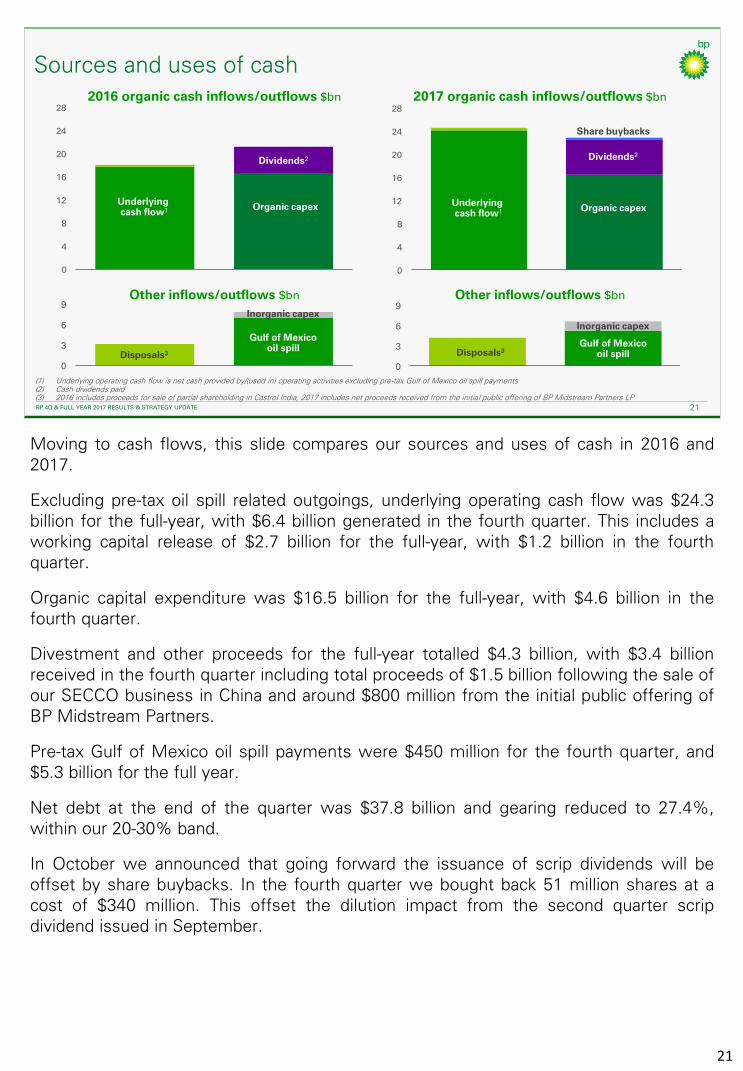
Moving to cash flows, this slide compares our sources and uses of cash in 2016 and2017.
Excluding pre-tax oil spill related outgoings, underlying operating cash flow was $24.3billion for the full-year, with $6.4 billion generated in the fourth quarter. This includes aworking capital release of $2.7 billion for the full-year, with $1.2 billion in the fourthquarter.
Organic capital expenditure was $16.5 billion for the full-year, with $4.6 billion in thefourth quarter.
Divestment and other proceeds for the full-year totalled $4.3 billion, with $3.4 billionreceived in the fourth quarter including total proceeds of $1.5 billion following the sale ofour SECCO business in China and around $800 million from the initial public offering ofBP Midstream Partners.
Pre-tax Gulf of Mexico oil spill payments were $450 million for the fourth quarter, and$5.3 billion for the full year.
Net debt at the end of the quarter was $37.8 billion and gearing reduced to 27.4%,within our 20-30% band.
In October we announced that going forward the issuance of scrip dividends will beoffset by share buybacks. In the fourth quarter we bought back 51 million shares at acost of $340 million. This offset the dilution impact from the second quarter scripdividend issued in September.
21

BP 4Q 2017 RESULTS 22BP 4Q & FULL YEAR 2017 RESULTS & STRATEGY UPDATE 22
2018 guidanceFull year 2018 guidance
(1) Underlying production. The actual reported number will depend on divestments, OPEC quotas, and entitlement impacts in production-sharing agreements (2) DD&A: depreciation, depletion and amortisation(3) Effective tax rate on underlying replacement cost profit; guidance based on current portfolio of assets
Full year 2017 actual
Organic capital expenditure $15-16bn$16.5bn
DD&A2 higher than 2017$15.6bn
Other businesses and corporateaverage underlying quarterly charge $350m$400m
Effective tax rate3 >40%38%
Gearing 20-30%27.4%
Upstream production excluding Rosneftincluding Rosneft
higher than 201712.5mboed3.6mboed
Turning now to our guidance for 2018.
We expect Upstream full-year 2018 underlying production, to be higher than 2017,driven by the continued ramp-up of 2017 major projects as well as the six major projectstart-ups we have planned in 2018. Actual reported production will depend ondivestments, OPEC quotas and entitlement impacts.
We expect organic capital expenditure to be in the range of $15-16 billion reflecting thecontinuing focus on disciplined spend.
The total DD&A charge is expected to be higher than 2017 reflecting the start-up ofmajor projects and continued growth in Upstream production volumes.
In Other Businesses and Corporate, the average underlying quarterly charge is expectedto be around $350 million, although this may fluctuate between individual quarters.
In the current environment the adjusted effective tax rate for 2018 is expected to beabove 40%.
Our balance sheet remains robust and we continue to target a gearing band of 20-30%.
22
BP 4Q 2017 RESULTS 23BP 4Q & FULL YEAR 2017 RESULTS & STRATEGY UPDATE 23
(1) Organic free cash flow: operating cash flow excluding pre-tax Gulf of Mexico oil spill payments less organic capital expenditure. In USD cents per ordinary share, based on BP planning assumptions (2) DPS: dividend per ordinary share. Cash DPS assumes 20% scrip uptake
Growing free cash flow
Organic free cash flow per share1▪ Rebalanced organic sources and
uses of cash
▪ Share buybacks offset impact of dilution from scrip over time
▪ Growth in operating cash flow delivered across our businesses
▪ Cost and capital discipline
2018 2021
Current cash DPS2
Currentfull DPS2
2017
Brent price
$50-55/bbl real
$54/bbl
$35-40/bbl
Oil price breakeven by 2021
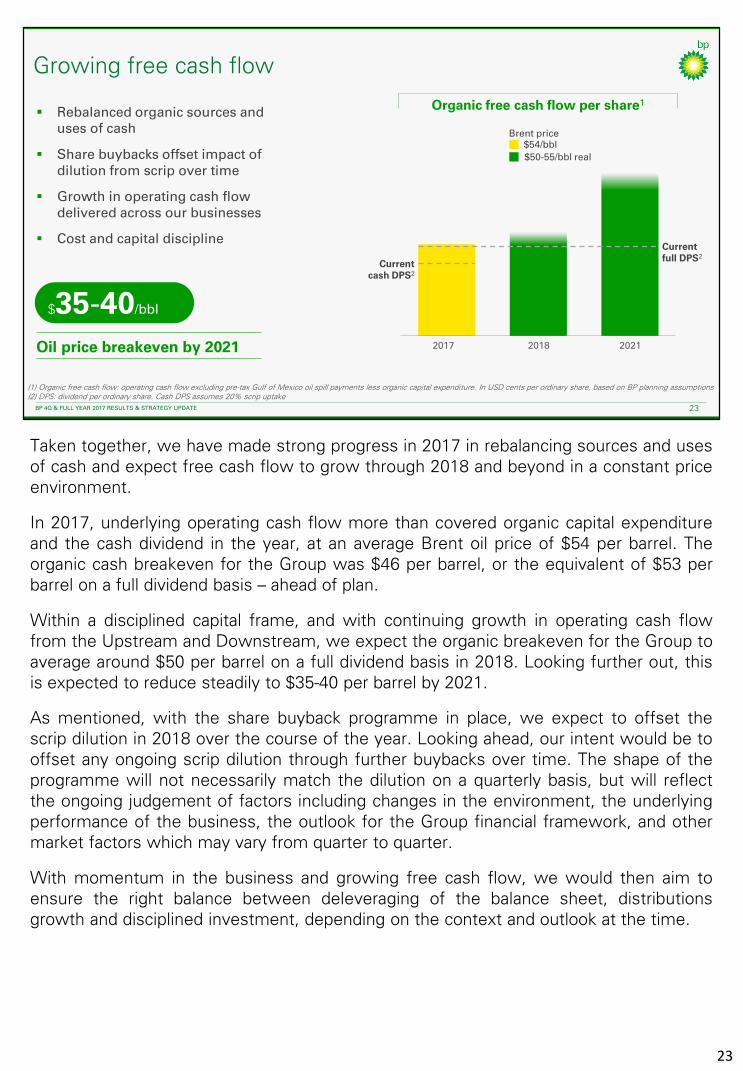
Taken together, we have made strong progress in 2017 in rebalancing sources and usesof cash and expect free cash flow to grow through 2018 and beyond in a constant priceenvironment.
In 2017, underlying operating cash flow more than covered organic capital expenditureand the cash dividend in the year, at an average Brent oil price of $54 per barrel. Theorganic cash breakeven for the Group was $46 per barrel, or the equivalent of $53 perbarrel on a full dividend basis – ahead of plan.
Within a disciplined capital frame, and with continuing growth in operating cash flowfrom the Upstream and Downstream, we expect the organic breakeven for the Group toaverage around $50 per barrel on a full dividend basis in 2018. Looking further out, thisis expected to reduce steadily to $35-40 per barrel by 2021.
As mentioned, with the share buyback programme in place, we expect to offset thescrip dilution in 2018 over the course of the year. Looking ahead, our intent would be tooffset any ongoing scrip dilution through further buybacks over time. The shape of theprogramme will not necessarily match the dilution on a quarterly basis, but will reflectthe ongoing judgement of factors including changes in the environment, the underlyingperformance of the business, the outlook for the Group financial framework, and othermarket factors which may vary from quarter to quarter.
With momentum in the business and growing free cash flow, we would then aim toensure the right balance between deleveraging of the balance sheet, distributionsgrowth and disciplined investment, depending on the context and outlook at the time.
23
BP 4Q 2017 RESULTS 24BP 4Q & FULL YEAR 2017 RESULTS & STRATEGY UPDATE 24
Financial frame
(1) Including full dividend, excluding pre-tax Gulf of Mexico oil spill payments(2) Brent oil prices 2017 real
2019 to 20212018
Organic free cash flow1 Material growth, balance point falls steadily
Balancing at ~$50/bbl
Organic capital expenditure $15-17bn$15-16bn
Divestments ~$2-3bn~$2-3bn
Gulf of Mexico oil spill payments~$2bn in 2019
Stepping down to ~$1bnJust over $3bn
Gearing 20-30%20-30%
Group ROACE at $55/bbl2 >10% by 2021
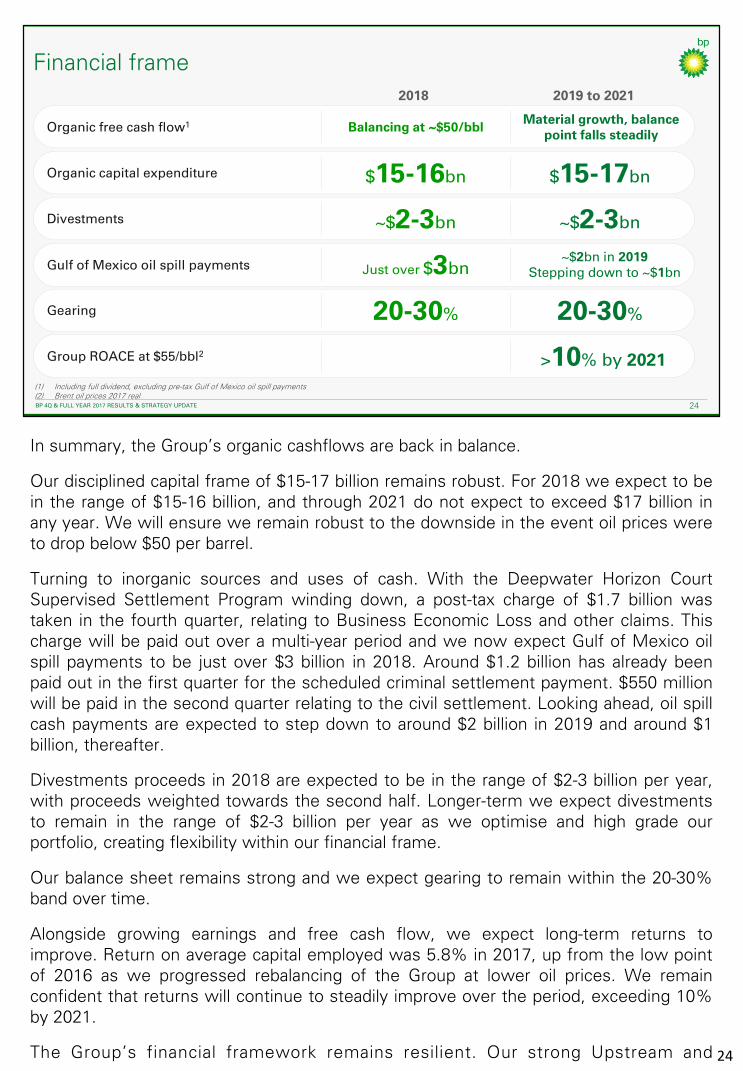
In summary, the Group’s organic cashflows are back in balance.
Our disciplined capital frame of $15-17 billion remains robust. For 2018 we expect to bein the range of $15-16 billion, and through 2021 do not expect to exceed $17 billion inany year. We will ensure we remain robust to the downside in the event oil prices wereto drop below $50 per barrel.
Turning to inorganic sources and uses of cash. With the Deepwater Horizon CourtSupervised Settlement Program winding down, a post-tax charge of $1.7 billion wastaken in the fourth quarter, relating to Business Economic Loss and other claims. Thischarge will be paid out over a multi-year period and we now expect Gulf of Mexico oilspill payments to be just over $3 billion in 2018. Around $1.2 billion has already beenpaid out in the first quarter for the scheduled criminal settlement payment. $550 millionwill be paid in the second quarter relating to the civil settlement. Looking ahead, oil spillcash payments are expected to step down to around $2 billion in 2019 and around $1billion, thereafter.
Divestments proceeds in 2018 are expected to be in the range of $2-3 billion per year,with proceeds weighted towards the second half. Longer-term we expect divestmentsto remain in the range of $2-3 billion per year as we optimise and high grade ourportfolio, creating flexibility within our financial frame.
Our balance sheet remains strong and we expect gearing to remain within the 20-30%band over time.
Alongside growing earnings and free cash flow, we expect long-term returns toimprove. Return on average capital employed was 5.8% in 2017, up from the low pointof 2016 as we progressed rebalancing of the Group at lower oil prices. We remainconfident that returns will continue to steadily improve over the period, exceeding 10%by 2021.
The Group’s financial framework remains resilient. Our strong Upstream and 24

Downstream businesses are growing operating cash, capital is trending tothe lower end of our frame and we continue to focus on our cost andefficiency programs across the Group. This in turn is driving increasing freecash flow and improved returns, supporting growth in distributions toshareholders over the long term.
Thank you, and I’ll now hand over to Lamar.
24
BP 4Q 2017 RESULTS 25BP 4Q & FULL YEAR 2017 RESULTS & STRATEGY UPDATE 25
BP 4Q & FULL YEAR 2017 RESULTS & STRATEGY UPDATE
Deputy Group Chief Executive
Lamar McKay
Thanks Brian.
You heard earlier from Bob about the dual energy challenge – I’d like to return to thetopic to share with you our approach to the energy transition, and how we are doing thisin a focused and disciplined way as part of the broader financial framework outlined byBrian.
25
BP 4Q 2017 RESULTS 26BP 4Q & FULL YEAR 2017 RESULTS & STRATEGY UPDATE 26
The right priorities for an evolving energy landscape
Modernising the whole Group
Venturing and low carbon across multiple fronts
Growing gas and advantaged oil in the Upstream
Market led growth in the Downstream
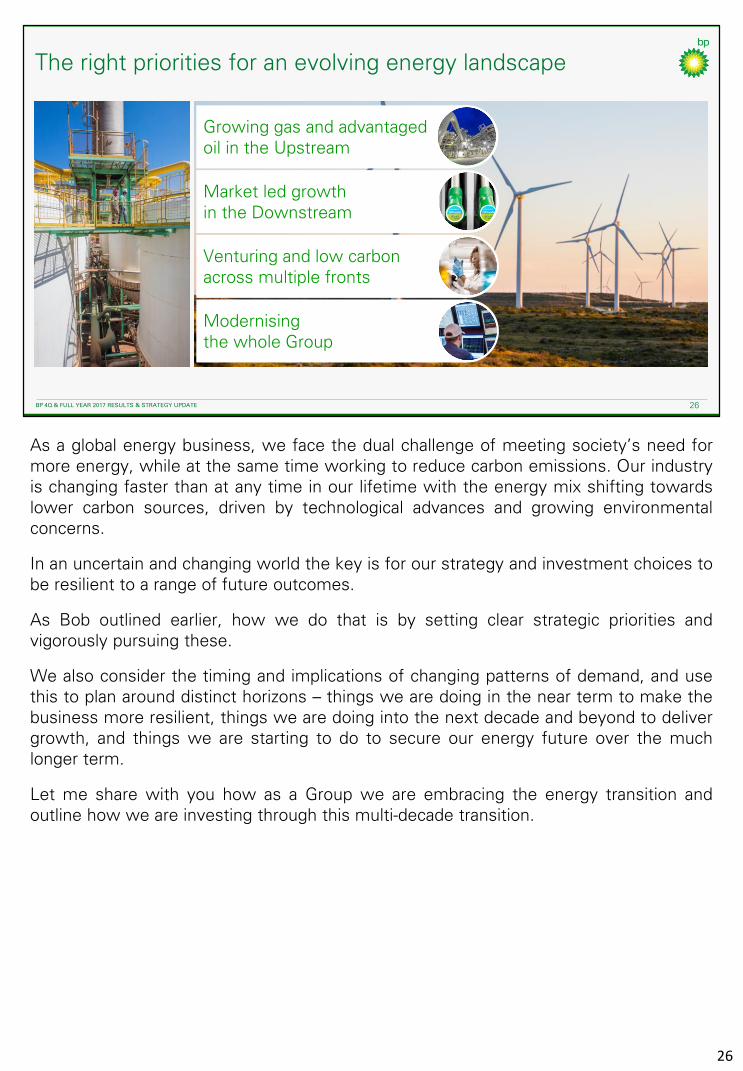
As a global energy business, we face the dual challenge of meeting society’s need formore energy, while at the same time working to reduce carbon emissions. Our industryis changing faster than at any time in our lifetime with the energy mix shifting towardslower carbon sources, driven by technological advances and growing environmentalconcerns.
In an uncertain and changing world the key is for our strategy and investment choices tobe resilient to a range of future outcomes.
As Bob outlined earlier, how we do that is by setting clear strategic priorities andvigorously pursuing these.
We also consider the timing and implications of changing patterns of demand, and usethis to plan around distinct horizons – things we are doing in the near term to make thebusiness more resilient, things we are doing into the next decade and beyond to delivergrowth, and things we are starting to do to secure our energy future over the muchlonger term.
Let me share with you how as a Group we are embracing the energy transition andoutline how we are investing through this multi-decade transition.
26

BP 4Q 2017 RESULTS 27BP 4Q & FULL YEAR 2017 RESULTS & STRATEGY UPDATE 27
Advancing the energy transition
Creating low carbon businesses
Reducing emissions in
our operations
Improving our products
Today, oil and gas accounts for almost 60% of all energy used. That means companieswho provide these energy sources – along with their consumers and others – have animportant role to play in the energy transition.
Our ambition is to provide more energy while advancing the energy transition – and weare taking action.
Our approach – ‘Reduce-Improve-Create’, which Bob mentioned earlier – consists ofthree distinct elements:
First, reducing our own operational emissions. Now I need to be clear here – this is acomplex subject and our total emissions may grow in the coming years as ourproduction grows. Indeed, the emissions intensity of some operational activity mayincrease, such as LNG processing – though on a lifecycle basis gas wins over highercarbon products such as coal. However, we are actively looking for ways to limit thegrowth of emissions where we can, with a focus on reducing our emissions at anoperational level – and that’s what we’re talking about when we say ‘Reduce’. A coupleof examples:
– We are integrating energy efficiency into the design of new projects – we designedour Khazzan gas operation in Oman to be inherently efficient and low in emissions. Ithas a central processing facility, removing the need for processing equipment ateach well site, a common source of methane emissions;
– We are also improving the equipment and processes in existing operations – ourwork to reduce flaring is an example of this. We are a founding member of theWorld Bank’s Global Gas Flaring Reduction partnership and a member of its ZeroRoutine Flaring by 2030 initiative.
To underpin our efforts to reduce our own emissions we plan to set operationalemissions targets, including for methane and you’ll hear more on this in the coming
27
months.
Second we are improving our products with the development of advancedfuels, lubricants and chemicals that enable our customers to lower theiremissions. Providing lower carbon products to our customers is one of thebiggest contributions we can make – around 80-90% of CO2 emissionsfrom oil and gas products originate from their consumption. We’re in actionon this:
– BP fuels with ACTIVE technology use an innovative formula designedto help engines run smoothly and efficiently by fighting dirt in the car’sengine;
– We are the largest producer of renewable natural gas fuel for UStransport, making fuel from agricultural and food waste; and
– Our PTAir, used to make items such as clothes and soft drink bottles,has a carbon footprint around 30% lower than the average EuropeanPTA, and we’ve launched a carbon neutral PTAir in China.
The third element includes growing our established renewable portfolioand creating new low carbon businesses. By investing in hi-tech, low-carbon start-ups and developing new business models and offers, we cancomplement our existing hydrocarbon and renewables businesses.
I want to take a bit more time to run through the work we have been doingin this area.
27
BP 4Q 2017 RESULTS 28BP 4Q & FULL YEAR 2017 RESULTS & STRATEGY UPDATE 28
Building low carbon businesses
▪ Commercially driven investments
▪ Established low carbon business –
Alternative Energy
▪ Building resilience within existing
core and adjacent businesses
Five focusareas
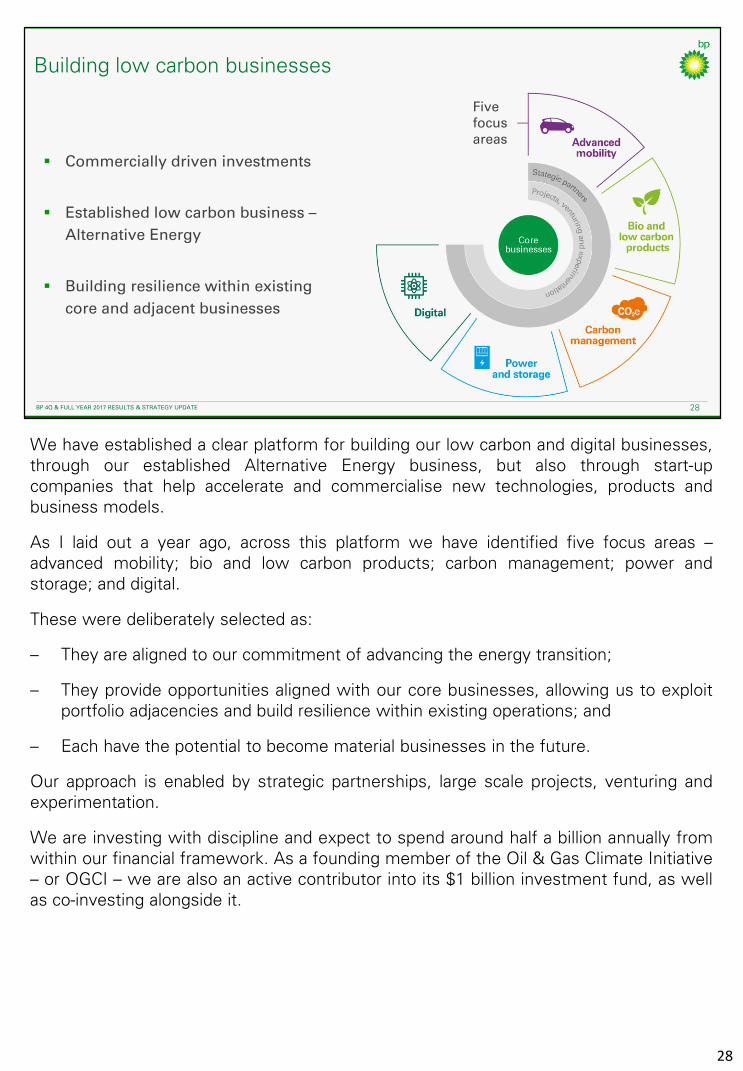
We have established a clear platform for building our low carbon and digital businesses,through our established Alternative Energy business, but also through start-upcompanies that help accelerate and commercialise new technologies, products andbusiness models.
As I laid out a year ago, across this platform we have identified five focus areas –advanced mobility; bio and low carbon products; carbon management; power andstorage; and digital.
These were deliberately selected as:
– They are aligned to our commitment of advancing the energy transition;
– They provide opportunities aligned with our core businesses, allowing us to exploitportfolio adjacencies and build resilience within existing operations; and
– Each have the potential to become material businesses in the future.
Our approach is enabled by strategic partnerships, large scale projects, venturing andexperimentation.
We are investing with discipline and expect to spend around half a billion annually fromwithin our financial framework. As a founding member of the Oil & Gas Climate Initiative– or OGCI – we are also an active contributor into its $1 billion investment fund, as wellas co-investing alongside it.
28
BP 4Q 2017 RESULTS 29BP 4Q & FULL YEAR 2017 RESULTS & STRATEGY UPDATE 29
▪ Fastest-growing energy sector
▪ Focus on safety, reliability,
optimisation and efficiency
▪ Lightsource strategic partnership
▪ Integrated value chains
Established low carbon business – Alternative Energy
capacity
ambition
Bio-power
Wind energy
Solar energy
grosscapacity
Renewable POWER
224MW
6 GW
2.2GW
Renewable FUELS
Commercialising
bio-isobutanol
technology
10Mtpa
biofuelsindustrialcapacity
Renewable PRODUCTS
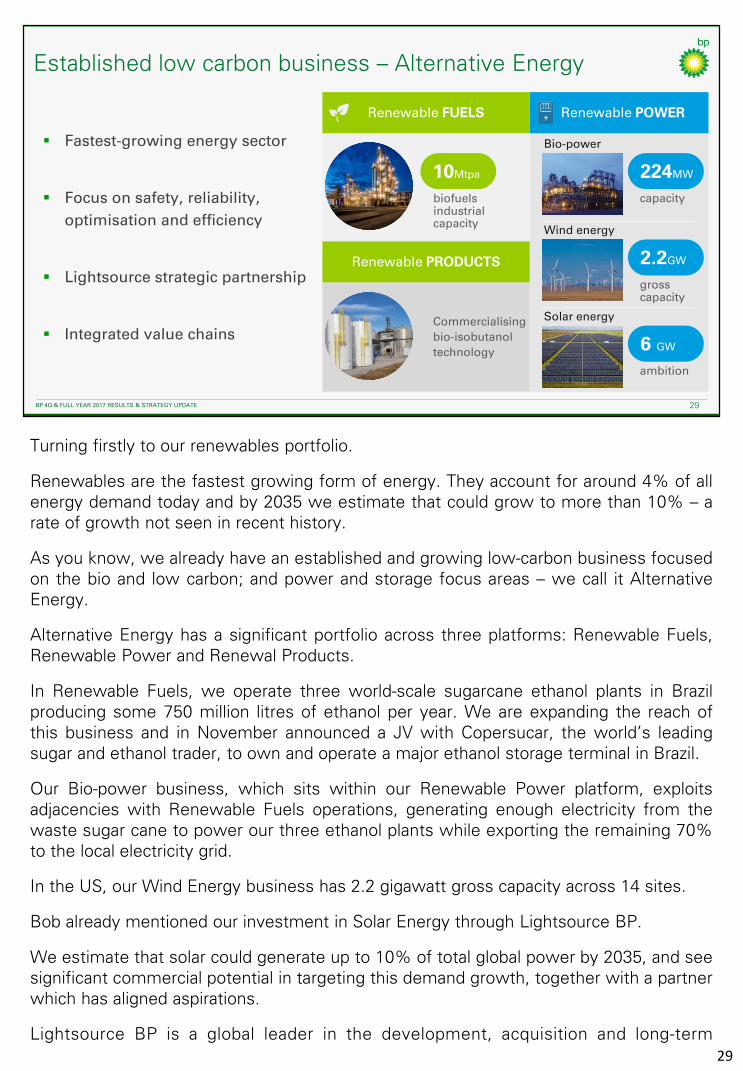
Turning firstly to our renewables portfolio.
Renewables are the fastest growing form of energy. They account for around 4% of allenergy demand today and by 2035 we estimate that could grow to more than 10% – arate of growth not seen in recent history.
As you know, we already have an established and growing low-carbon business focusedon the bio and low carbon; and power and storage focus areas – we call it AlternativeEnergy.
Alternative Energy has a significant portfolio across three platforms: Renewable Fuels,Renewable Power and Renewal Products.
In Renewable Fuels, we operate three world-scale sugarcane ethanol plants in Brazilproducing some 750 million litres of ethanol per year. We are expanding the reach ofthis business and in November announced a JV with Copersucar, the world’s leadingsugar and ethanol trader, to own and operate a major ethanol storage terminal in Brazil.
Our Bio-power business, which sits within our Renewable Power platform, exploitsadjacencies with Renewable Fuels operations, generating enough electricity from thewaste sugar cane to power our three ethanol plants while exporting the remaining 70%to the local electricity grid.
In the US, our Wind Energy business has 2.2 gigawatt gross capacity across 14 sites.
Bob already mentioned our investment in Solar Energy through Lightsource BP.
We estimate that solar could generate up to 10% of total global power by 2035, and seesignificant commercial potential in targeting this demand growth, together with a partnerwhich has aligned aspirations.
Lightsource BP is a global leader in the development, acquisition and long-term29

management of large-scale solar projects and smart energy solutions.
The company has developed 1.3 gigawatt of solar capacity to date andmanages some 2GW of solar assets – the equivalent of powering over halfa million homes. Lightsource BP aims to develop a 6 gigawatt growthpipeline focused largely in the US, India, Europe and the Middle East.
Renewable Products is the third and emerging platform within theAlternative Energy portfolio.
Through our Butamax JV with DuPont we are working to commercialisetechnology that converts sugars into an energy rich biofuel known as bio-isobutanol – this can be used as an advanced biofuel or a high valuebuilding-block for a wider range of products.
Operating performance across our Alternative Energy businesses has beenstrong and they increasingly provide platforms to grow our integrated valuechain offers.
29

BP 4Q 2017 RESULTS 30BP 4Q & FULL YEAR 2017 RESULTS & STRATEGY UPDATE 30
New low carbon businesses
Electric, connected and autonomous vehicles
Advanced mobility
New fuels, gas, lubricants and plastics
Bio and low carbon
Lowering carbon footprint for
customers and BP
Carbon management
Low carbon power, storage and trading
Power and storage
Transformingproductivity and
customer experience
Digital
We are also developing new low carbon and digital businesses and our portfolio ofopportunities today includes a pipeline of more than 35 active investments with morethan 200 co-investors. We are already leveraging these investments successfully with12 technologies in use within BP.
In the advanced mobility area we are pursuing opportunities across a number of broadthemes including electric vehicles, batteries and charging; new mobility models such ascar pooling and ride sharing; and vehicle autonomy.
We are exploring the development and production of new bio-molecules for gas, fuel,lubricants, plastics and chemicals, and other lower carbon products – something many ofour customers are beginning to ask for. As I mentioned earlier, our Alternative Energyand Downstream manufacturing and marketing operations provide a platform forcommercialising these products. We have already had success in this space for examplewith Fulcrum, PTAir and Clean Energy.
In the area of carbon management, we are working to improve carbon emissionsperformance at an operational level and enable customers to reduce or offset theiremissions through carbon markets. We are investing in new technologies and exploringthe application of carbon capture use and storage. In addition, our trading business, IST,is increasingly active in originating and trading carbon credits. With one-seventh of theworld’s greenhouse gas emissions now covered by carbon pricing systems weanticipate further growth in this area.
We are also looking at opportunities to invest in low carbon power and storage, inparticular where portfolio synergies help to build further resilience across our existingcore businesses. As discussed in our 2017 Energy Outlook nearly two-thirds of theprojected growth in world energy demand over the coming decades could come in theform of electricity.
30

Finally, in the digital space we are looking to new digital platforms includingblockchain, quantum computing and cognitive computing to improveefficiency and productivity in our operations, as well as transform ourcustomers experience. We recently invested in Beyond Limits – a leader inartificial intelligence and cognitive computing – and are working together toapply technologies developed and pioneered in space to the extremeenvironments we operate within such as deep-water exploration andproduction.
Each opportunity is subject to our rigorous investment framework. In theearly stages of incubation we don’t expect immediate profits, howeverwhere they pass materiality and return thresholds, we will look to take theinvestments forward, growing and commercialising them.
30

BP 4Q 2017 RESULTS 31BP 4Q & FULL YEAR 2017 RESULTS & STRATEGY UPDATE 31
Advancing the energy transition
A clear approach
1. Reduce
2. Improve
3. Create
Creating low carbon and digital businesses
5 focus areas
~$500mannual spend
within a strictinvestment framework
To summarise.
BP is in action, with a clear strategy and set of businesses that are focused on a lowercarbon future.
Our commitment to helping drive the energy transition is embedded in the core of ourbusiness strategy.
The key for BP is for our strategy and investment choices to remain flexible to a range ofscenarios – scenarios which ultimately drive our four strategic priorities.
We believe that maintaining a balanced portfolio and a disciplined investment frameworkwill enable us to be resilient to the evolving energy landscape.
We are actively developing lower carbon and digital businesses through our establishedAlternative Energy business and across five focus areas: advanced mobility; bio and lowcarbon products; carbon management; power and storage; and digital.
In 2017 we made important progress building on our existing foundations through ourinvestments in Lightsource BP, Clean Energy, Fulcrum, and Butamax among others.
As we look to invest around half a billion dollars annually in these areas, eachopportunity will be assessed against materiality and returns thresholds, and subject toour rigorous investment framework.
With that I’ll pass you over to Bernard to talk to you about strategic progress in theUpstream.
31

BP 4Q & FULL YEAR 2017 RESULTS & STRATEGY UPDATE 32
4Q & FULL YEAR 2017 RESULTS & STRATEGY UPDATE
Group Chief Executive
Bob Dudley
BP 4Q & FULL YEAR 2017 RESULTS & STRATEGY UPDATE
Chief Executive, Upstream
Bernard Looney
Thank you Lamar. And good morning ladies and gentlemen.
Today I will provide an update on the five year plan we laid out last year, with a summaryof what we delivered in 2017, and what this means for our plan to 2021 and beyond.
32
BP 4Q & FULL YEAR 2017 RESULTS & STRATEGY UPDATE 33
Upstream strategySAFETY STRATEGY
core value#1
(1) 2016-2021 compound annual growth rate (2) Free cash flow proxy = Underlying RCPBIT+DD&A+EWO-Organic capital expenditure, at $55/bbl Brent 2017 real
QUALITY EXECUTION
GROWING GAS AND ADVANTAGED OIL
RETURNS LED GROWTH
$13-14bn5%productionCAGR1
capital expenditurep.a. to 2021
free cashflow2 in 2021
KEY METRICS
$13-14bn
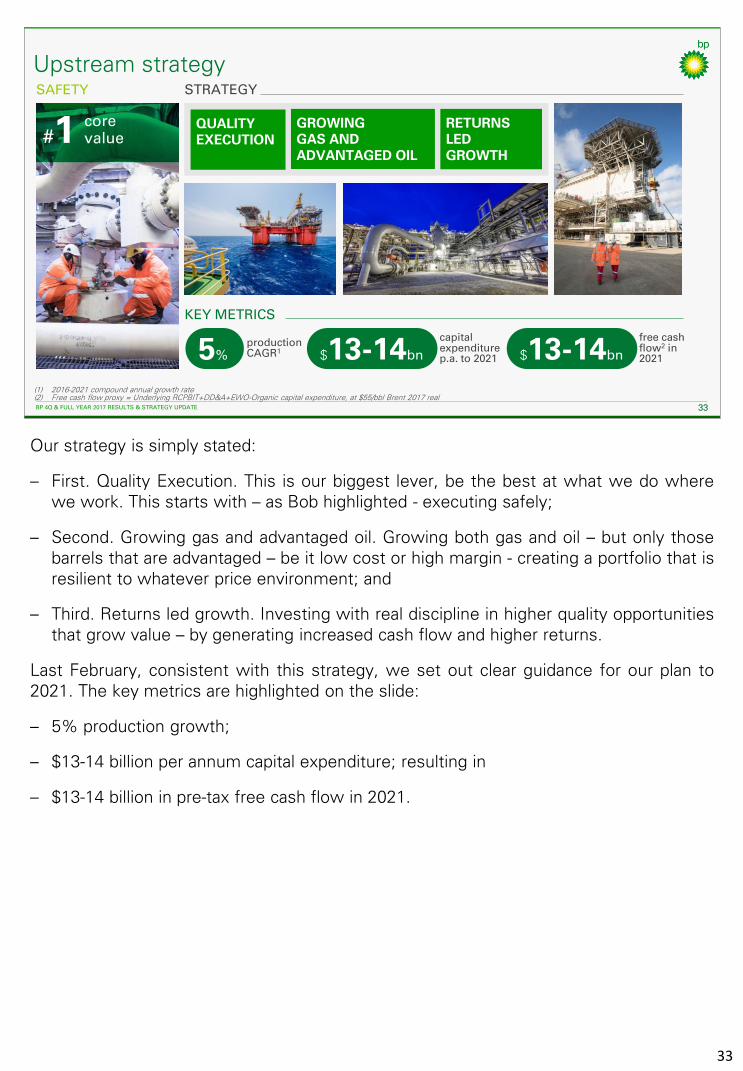
Our strategy is simply stated:
– First. Quality Execution. This is our biggest lever, be the best at what we do wherewe work. This starts with – as Bob highlighted - executing safely;
– Second. Growing gas and advantaged oil. Growing both gas and oil – but only thosebarrels that are advantaged – be it low cost or high margin - creating a portfolio that isresilient to whatever price environment; and
– Third. Returns led growth. Investing with real discipline in higher quality opportunitiesthat grow value – by generating increased cash flow and higher returns.
Last February, consistent with this strategy, we set out clear guidance for our plan to2021. The key metrics are highlighted on the slide:
– 5% production growth;
– $13-14 billion per annum capital expenditure; resulting in
– $13-14 billion in pre-tax free cash flow in 2021.
33

BP 4Q & FULL YEAR 2017 RESULTS & STRATEGY UPDATE 34
Continued track record of delivery
(1) From 2015 base(2) Reported Upstream production. CAGR = compound annual growth rate(3) Free cash flow proxy = Underlying RCPBIT+DD&A+EWO-Organic capital expenditure, at $55/bbl Brent 2017 real. 2017 at actual prices
2017 DELIVERYFEBRUARY 2017 GUIDANCE
800mboed major project production1 in 2020 7 start-ups on schedule and under budget
>500mboed production capacity1
$13-14bn p.a. organiccapital expenditure
organic capital expenditure$13.8bn
5% productionCAGR2 2016-21
productiongrowth212%
Stronger long term growth
exploration successand new access 3FIDs
$13-14bn free cash flow in 20213 $6.9bn
free cashflow3
In 2017, we took significant steps towards these goals with a very strong year ofdelivery.
First - at the beginning of the year - we set out ambitious plans to start up seven majorprojects. All seven were successfully delivered - on average on schedule and underbudget.
In total - from the beginning of 2016 to the end of 2017 - we installed more than 500thousand barrels of oil equivalent per day production capacity from our major projects. Avery significant year of delivery as we march towards our 2020 guidance of 800thousand barrels per day.
Second – we grew production 12% versus 2016. This was ahead of our plan withproduction growth accelerated into 2017. Underlying growth was 8%.
Third – we said we would maintain discipline and invest between $13-14 billion oforganic capital per annum. In 2017 - we invested $13.8 billion of organic capital.Importantly we continue to maintain a laser focus on the efficiency of our spend and Iwill share more on this later.
Fourth - all this helped us generate $6.9 billion pre-tax free cash flow – an increase ofaround $8.5 billion on 2016.
Finally, we made 3 final investment decisions and took a number of steps to strengthenour portfolio for long term value growth. Examples include:
– Azerbaijan, where we agreed a 25 year extension to the ACG production sharingagreement, out to 2049. We also extended the In Amenas production sharingcontract in Algeria;
– Brazil, where we accessed the prolific Santos basin, and signed a letter of intent withPetrobras to jointly identify and evaluate business opportunities;
34

– On the other side of the Atlantic, where we accessed new acreage inCote d’Ivoire, and just last month, in Sao Tome and Principe; and
– In Norway, where our Aker BP joint venture continued its remarkablegrowth through acquiring Hess Norge.
We also had a good year of exploration, announcing six discoveries acrossSenegal, Egypt, Trinidad and the UK North Sea. We discovered around onebillion barrels of oil equivalent for the year which is our largest discoveredresource in exploration since 2004 – with Yakaar in Senegal the industry’sbiggest discovery of the year.
34

Our performance in 2017 was underpinned by strong functional execution – helping usget the most out of every dollar we spend.
Unit production costs continued their downward trajectory and are now down 46% since2013 – exceeding our 40% target – with costs at their lowest level since 2006.
Execution of our drilling programs continues to improve. In 2013, around one quarter ofoffshore wells drilled were top quartile according to industry benchmarking. Now, over60% are top quartile. This is one of the factors which has helped reduce unitdevelopment costs in drilling by 34% since 2013.
Our project costs - as measured by Independent Project Analysis - have improvedsignificantly and are well below the industry benchmark.
We also continue to actively manage our base business – a source of enormous value.Our five year base decline, from 2012 to 2017, was 2.6% - below our 3-5% guidance. In2017, we actually grew the base by 0.6% - a great outcome driven in large part by ourinvestment in new digital tools, a key part of our modernisation agenda.
BP 4Q & FULL YEAR 2017 RESULTS & STRATEGY UPDATE 35
Quality execution
Projects cost benchmarkingIPA2 ratio
Unit production costs$/bbl
New well D-cost1
$/bbl
+0.6%base production improvement in 2017
-2.6%5 year average base decline3
0.0
0.9
1.2
0.6
1.5
0.3
2016201520142013 2017
IPA2 2017 Benchmark
8
6
2
4
020172016201520142013
34%
6
3
15
9
0
12
20142013 2016 20172015
46%
(1) BP estimates of operated, excluding Iraq, gross well capital expenditure per barrel of gross estimated recoverable volumes(2) Independent Project Analysis, a lower ratio indicates lower costs vs. IPA industry models(3) 2012-2017 compound annual decline rate
35
BP 4Q & FULL YEAR 2017 RESULTS & STRATEGY UPDATE 36
(1) 2016-2025 average pre-tax operating cash flow per barrel at flat $52/bbl
High quality growth extended
BP net production from major projectsmboed
400
0
600
800
200
201820172016 20192015 2020 2021
1000 Appraise/Design
Construction
Operating
West Nile Delta –Taurus/Libra
Trinidad Onshore Compression
Quad 204
Persephone
Juniper
Khazzan Phase 1
Zohr
In Salah Southern Fields
Thunder Horse Water Injection
Point Thomson
Angola LNG
In Amenas Compression
Thunder Horse South Expansion
Atoll Phase 1
Clair Ridge
Constellation
Shah Deniz 2
West Nile Delta – Giza/Fayoum
Taas Expansion
Angelin
Culzean
Thunder Horse North West Expansion
Western Flank B
2017 2018
KG D6 R-Series
Tangguh Expansion
Alligin
Atlantis Phase 3
Vorlich
Zinia 2
Mad Dog Phase 2
Cassia Compression
KG D6 D55
KG D6 Satellites
Khazzan Phase 2
Tortue Phase 1
2016 2017 2018
2019 2020 2021
900mboedby 2021
35%greater cash margins than 2015 base1
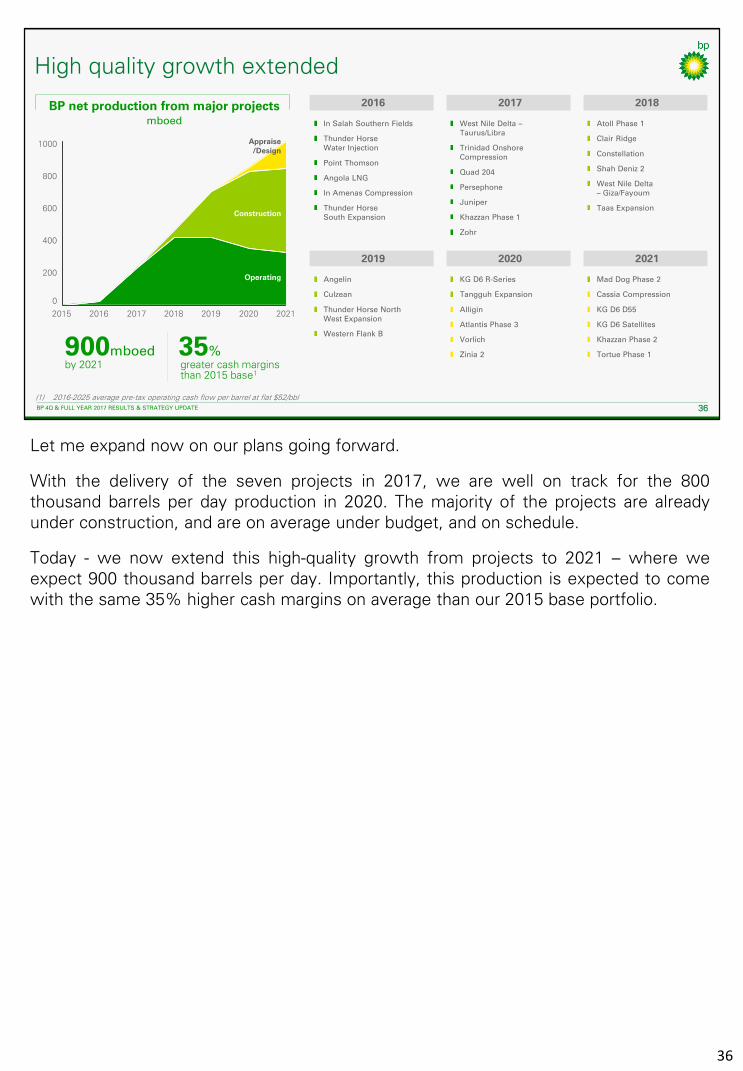
Let me expand now on our plans going forward.
With the delivery of the seven projects in 2017, we are well on track for the 800thousand barrels per day production in 2020. The majority of the projects are alreadyunder construction, and are on average under budget, and on schedule.
Today - we now extend this high-quality growth from projects to 2021 – where weexpect 900 thousand barrels per day. Importantly, this production is expected to comewith the same 35% higher cash margins on average than our 2015 base portfolio.
36
BP 4Q & FULL YEAR 2017 RESULTS & STRATEGY UPDATE 37
Confidence in free cash flow growth
(1) 2016-2021 compound annual growth rate (2) From 2015 base(3) Free cash flow proxy = Underlying RCPBIT+DD&A+EWO-Organic capital expenditure, 2021 at $55/bbl Brent 2017 real
2018 2021
Production 5-7% 5% CAGR1
6 potentialStronger long
term growthFIDs
Capitalexpenditure $13-14bn
Majorprojects 6 900mboed2start-ups
Free cash flow – pre-tax3
$bn
underlying growth
$12-13bn
2016 2017 2021
13-14
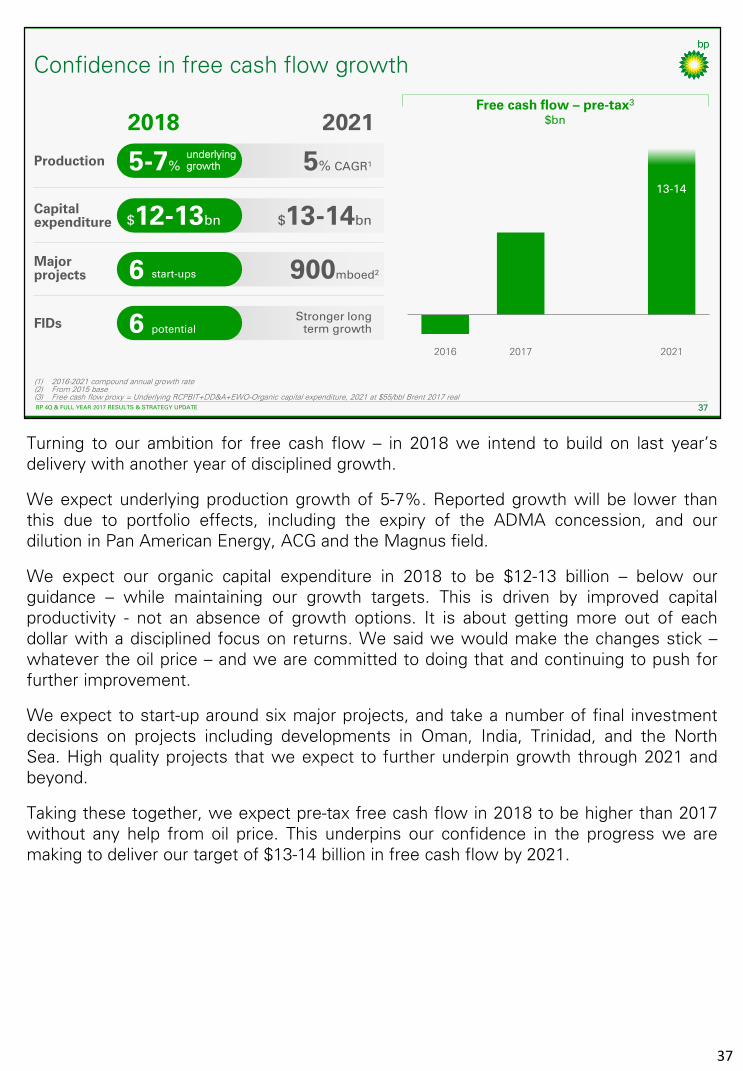
Turning to our ambition for free cash flow – in 2018 we intend to build on last year’sdelivery with another year of disciplined growth.
We expect underlying production growth of 5-7%. Reported growth will be lower thanthis due to portfolio effects, including the expiry of the ADMA concession, and ourdilution in Pan American Energy, ACG and the Magnus field.
We expect our organic capital expenditure in 2018 to be $12-13 billion – below ourguidance – while maintaining our growth targets. This is driven by improved capitalproductivity - not an absence of growth options. It is about getting more out of eachdollar with a disciplined focus on returns. We said we would make the changes stick –whatever the oil price – and we are committed to doing that and continuing to push forfurther improvement.
We expect to start-up around six major projects, and take a number of final investmentdecisions on projects including developments in Oman, India, Trinidad, and the NorthSea. High quality projects that we expect to further underpin growth through 2021 andbeyond.
Taking these together, we expect pre-tax free cash flow in 2018 to be higher than 2017without any help from oil price. This underpins our confidence in the progress we aremaking to deliver our target of $13-14 billion in free cash flow by 2021.
37
BP 4Q & FULL YEAR 2017 RESULTS & STRATEGY UPDATE 38
High quality growth options
Average 2018-25 pre-tax operating cash per barrel at equivalent price to 2015 actuals
Bubble size = net resources
Pre-FID hopper - projects and new wellsIRR (%)
20
40
0
Resources (bn boe)
Pre-FID major projects hopper
>40%
4bn boe
Development cost below DD&A
Accre
tiv
e t
o c
ash
marg
ins
Average unit DD&A
20
15
ave
rag
e
op
era
tin
g c
ash
/ b
bl
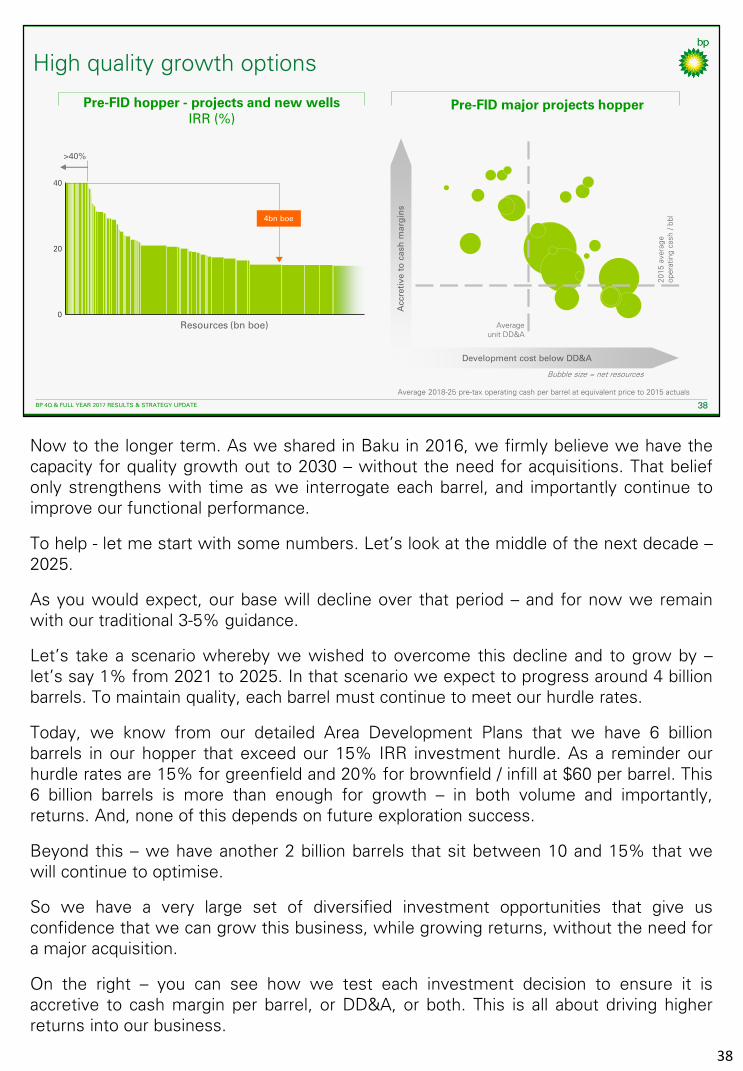
Now to the longer term. As we shared in Baku in 2016, we firmly believe we have thecapacity for quality growth out to 2030 – without the need for acquisitions. That beliefonly strengthens with time as we interrogate each barrel, and importantly continue toimprove our functional performance.
To help - let me start with some numbers. Let’s look at the middle of the next decade –2025.
As you would expect, our base will decline over that period – and for now we remainwith our traditional 3-5% guidance.
Let’s take a scenario whereby we wished to overcome this decline and to grow by –let’s say 1% from 2021 to 2025. In that scenario we expect to progress around 4 billionbarrels. To maintain quality, each barrel must continue to meet our hurdle rates.
Today, we know from our detailed Area Development Plans that we have 6 billionbarrels in our hopper that exceed our 15% IRR investment hurdle. As a reminder ourhurdle rates are 15% for greenfield and 20% for brownfield / infill at $60 per barrel. This6 billion barrels is more than enough for growth – in both volume and importantly,returns. And, none of this depends on future exploration success.
Beyond this – we have another 2 billion barrels that sit between 10 and 15% that wewill continue to optimise.
So we have a very large set of diversified investment opportunities that give usconfidence that we can grow this business, while growing returns, without the need fora major acquisition.
On the right – you can see how we test each investment decision to ensure it isaccretive to cash margin per barrel, or DD&A, or both. This is all about driving higherreturns into our business.
38
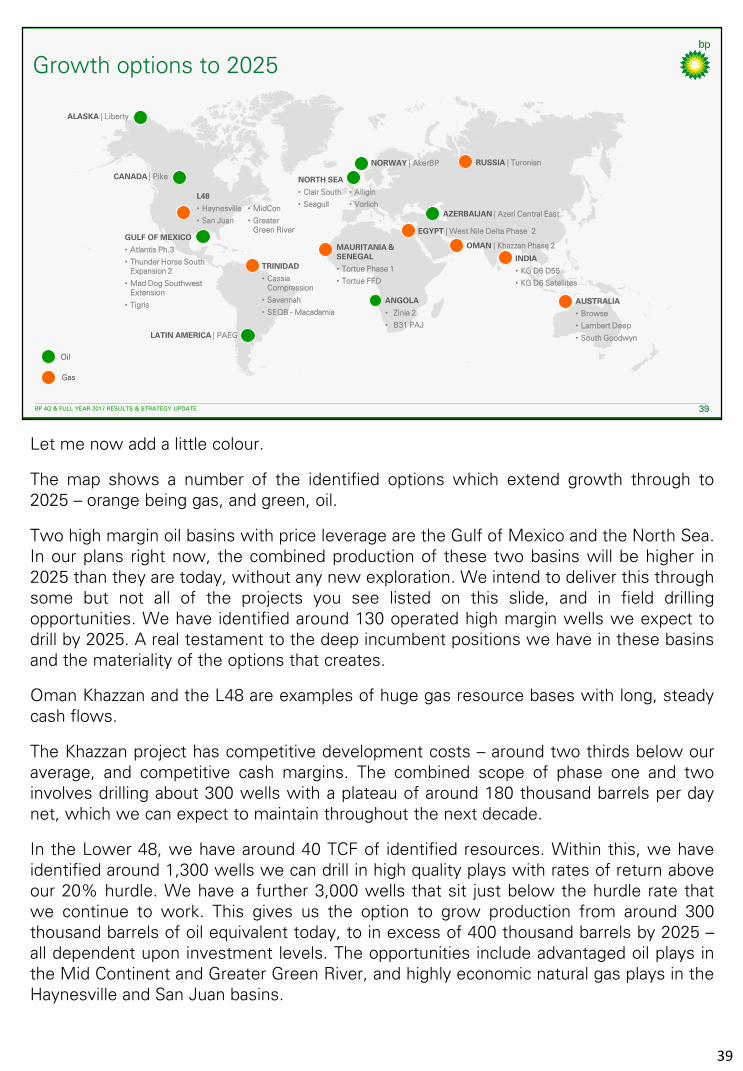
BP 4Q & FULL YEAR 2017 RESULTS & STRATEGY UPDATE 39
Gas
Growth options to 2025
ALASKA | Liberty
CANADA | Pike
GULF OF MEXICO
• Atlantis Ph.3
• Thunder Horse South Expansion 2
• Mad Dog Southwest Extension
• Tigris
TRINIDAD
• Cassia Compression
• Savannah
• SEQB - Macadamia
NORTH SEA
• Clair South
• Seagull
• Alligin
• Vorlich
RUSSIA | Turonian
AZERBAIJAN | Azeri Central East
EGYPT | West Nile Delta Phase 2
MAURITANIA & SENEGAL
• Tortue Phase 1
• Tortue FFD
ANGOLA
• Zinia 2
• B31 PAJ
INDIA
• KG D6 D55
• KG D6 Satellites
LATIN AMERICA | PAEG
OMAN | Khazzan Phase 2
Oil
AUSTRALIA
• Browse
• Lambert Deep
• South Goodwyn
NORWAY | AkerBP
L48
• Haynesville
• San Juan
• MidCon
• Greater Green River
Let me now add a little colour.
The map shows a number of the identified options which extend growth through to2025 – orange being gas, and green, oil.
Two high margin oil basins with price leverage are the Gulf of Mexico and the North Sea.In our plans right now, the combined production of these two basins will be higher in2025 than they are today, without any new exploration. We intend to deliver this throughsome but not all of the projects you see listed on this slide, and in field drillingopportunities. We have identified around 130 operated high margin wells we expect todrill by 2025. A real testament to the deep incumbent positions we have in these basinsand the materiality of the options that creates.
Oman Khazzan and the L48 are examples of huge gas resource bases with long, steadycash flows.
The Khazzan project has competitive development costs – around two thirds below ouraverage, and competitive cash margins. The combined scope of phase one and twoinvolves drilling about 300 wells with a plateau of around 180 thousand barrels per daynet, which we can expect to maintain throughout the next decade.
In the Lower 48, we have around 40 TCF of identified resources. Within this, we haveidentified around 1,300 wells we can drill in high quality plays with rates of return aboveour 20% hurdle. We have a further 3,000 wells that sit just below the hurdle rate thatwe continue to work. This gives us the option to grow production from around 300thousand barrels of oil equivalent today, to in excess of 400 thousand barrels by 2025 –all dependent upon investment levels. The opportunities include advantaged oil plays inthe Mid Continent and Greater Green River, and highly economic natural gas plays in theHaynesville and San Juan basins.
39

And we will continue to explore – in pursuit of gas and advantaged oil – butwith real discipline. The objective is to discover barrels which are betterthan the barrels we have today, as well as to keep our facilities full.
Our innovative alliance with Kosmos is expected to continue to build aleading position on the Africa Transform Margin. This year, we plan toconduct tests in the Santos Basin in Brazil, and in Nova Scotia, as well asexplore near our hubs in the Gulf of Mexico, Trinidad, North Sea, Egypt andIndonesia.
I hope this gives you a sense of the confidence we have in the resourcebase, and in the ability of the resource base to sustain quality growththrough the next decade.
39
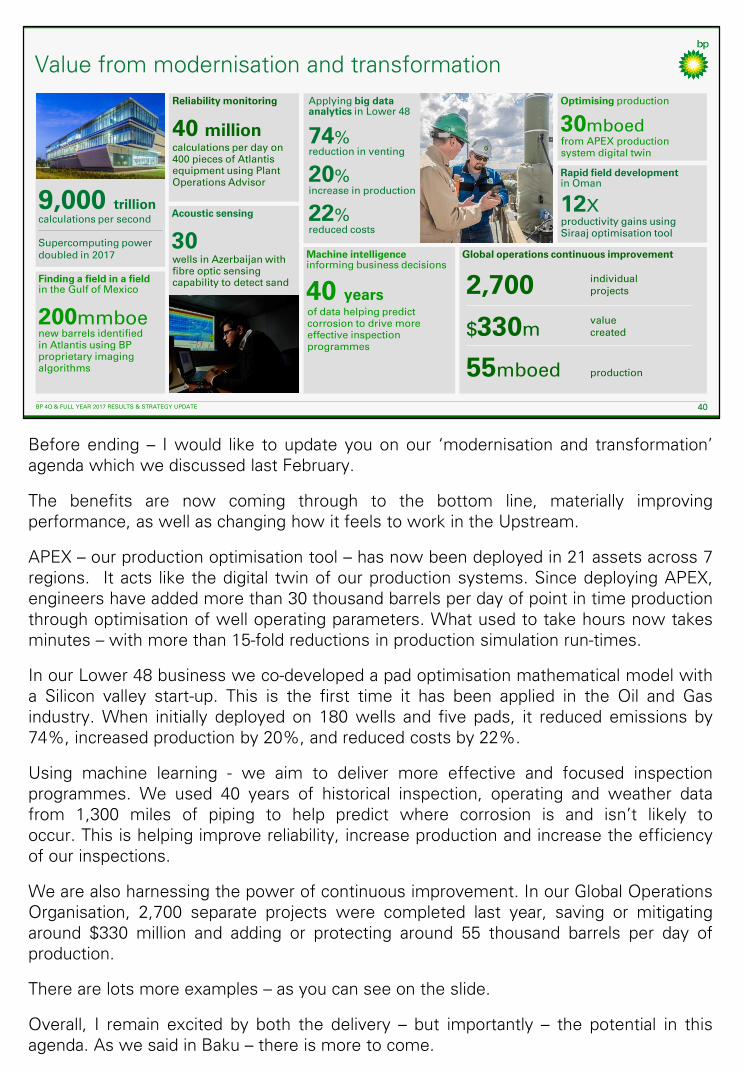
Before ending – I would like to update you on our ‘modernisation and transformation’agenda which we discussed last February.
The benefits are now coming through to the bottom line, materially improvingperformance, as well as changing how it feels to work in the Upstream.
APEX – our production optimisation tool – has now been deployed in 21 assets across 7regions. It acts like the digital twin of our production systems. Since deploying APEX,engineers have added more than 30 thousand barrels per day of point in time productionthrough optimisation of well operating parameters. What used to take hours now takesminutes – with more than 15-fold reductions in production simulation run-times.
In our Lower 48 business we co-developed a pad optimisation mathematical model witha Silicon valley start-up. This is the first time it has been applied in the Oil and Gasindustry. When initially deployed on 180 wells and five pads, it reduced emissions by74%, increased production by 20%, and reduced costs by 22%.
Using machine learning - we aim to deliver more effective and focused inspectionprogrammes. We used 40 years of historical inspection, operating and weather datafrom 1,300 miles of piping to help predict where corrosion is and isn’t likely tooccur. This is helping improve reliability, increase production and increase the efficiencyof our inspections.
We are also harnessing the power of continuous improvement. In our Global OperationsOrganisation, 2,700 separate projects were completed last year, saving or mitigatingaround $330 million and adding or protecting around 55 thousand barrels per day ofproduction.
There are lots more examples – as you can see on the slide.
Overall, I remain excited by both the delivery – but importantly – the potential in thisagenda. As we said in Baku – there is more to come.
BP 4Q & FULL YEAR 2017 RESULTS & STRATEGY UPDATE 40
Value from modernisation and transformation
Supercomputing power doubled in 2017
Applying big data analytics in Lower 48
Finding a field in a field in the Gulf of Mexico
Reliability monitoring Optimising production
Global operations continuous improvement
2,700 individualprojects
$330mvaluecreated
55mboed production
200mmboe
reduction in venting74%
increase in production20%
reduced costs22%
9,000 trillioncalculations per second
40 million 30mboed
Machine intelligence informing business decisions
40 years
Acoustic sensing
30
new barrels identified in Atlantis using BP proprietary imaging algorithms
calculations per day on 400 pieces of Atlantis equipment using Plant Operations Advisor
wells in Azerbaijan with fibre optic sensing capability to detect sand
of data helping predict corrosion to drive more effective inspection programmes
Rapid field development in Oman
12Xproductivity gains using Siraaj optimisation tool
from APEX production system digital twin
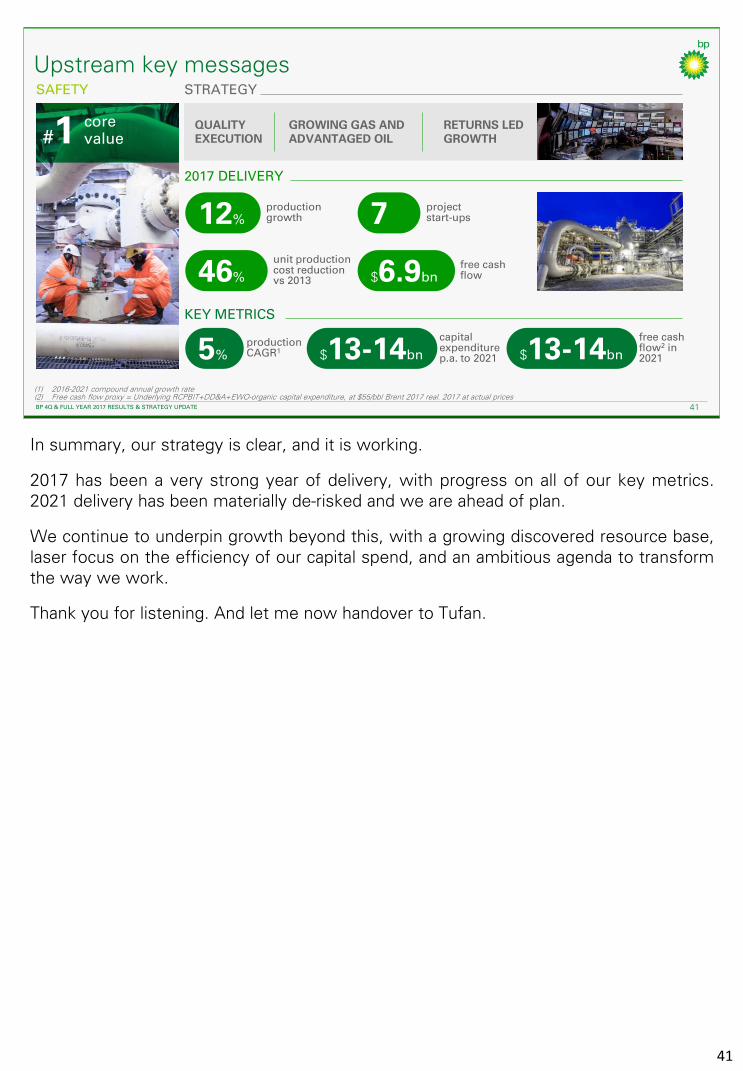
BP 4Q 2017 RESULTS 41BP 4Q & FULL YEAR 2017 RESULTS & STRATEGY UPDATE 41
SAFETY
Upstream key messagesSTRATEGY
RETURNS LEDGROWTH
QUALITYEXECUTION
GROWING GAS AND ADVANTAGED OIL
12%productiongrowth 7 project
start-ups
46%
unit productioncost reduction vs 2013
free cashflow$6.9bn
2017 DELIVERY
core value#1
(1) 2016-2021 compound annual growth rate (2) Free cash flow proxy = Underlying RCPBIT+DD&A+EWO-organic capital expenditure, at $55/bbl Brent 2017 real. 2017 at actual prices
$13-14bn5%productionCAGR1
capital expenditurep.a. to 2021
free cashflow2 in 2021
KEY METRICS
$13-14bn
In summary, our strategy is clear, and it is working.
2017 has been a very strong year of delivery, with progress on all of our key metrics.2021 delivery has been materially de-risked and we are ahead of plan.
We continue to underpin growth beyond this, with a growing discovered resource base,laser focus on the efficiency of our capital spend, and an ambitious agenda to transformthe way we work.
Thank you for listening. And let me now handover to Tufan.
41
BP 4Q 2017 RESULTS 42BP 4Q & FULL YEAR 2017 RESULTS & STRATEGY UPDATE 42
BP 4Q & FULL YEAR 2017 RESULTS & STRATEGY UPDATE
Chief Executive, Downstream
Tufan Erginbilgic
42
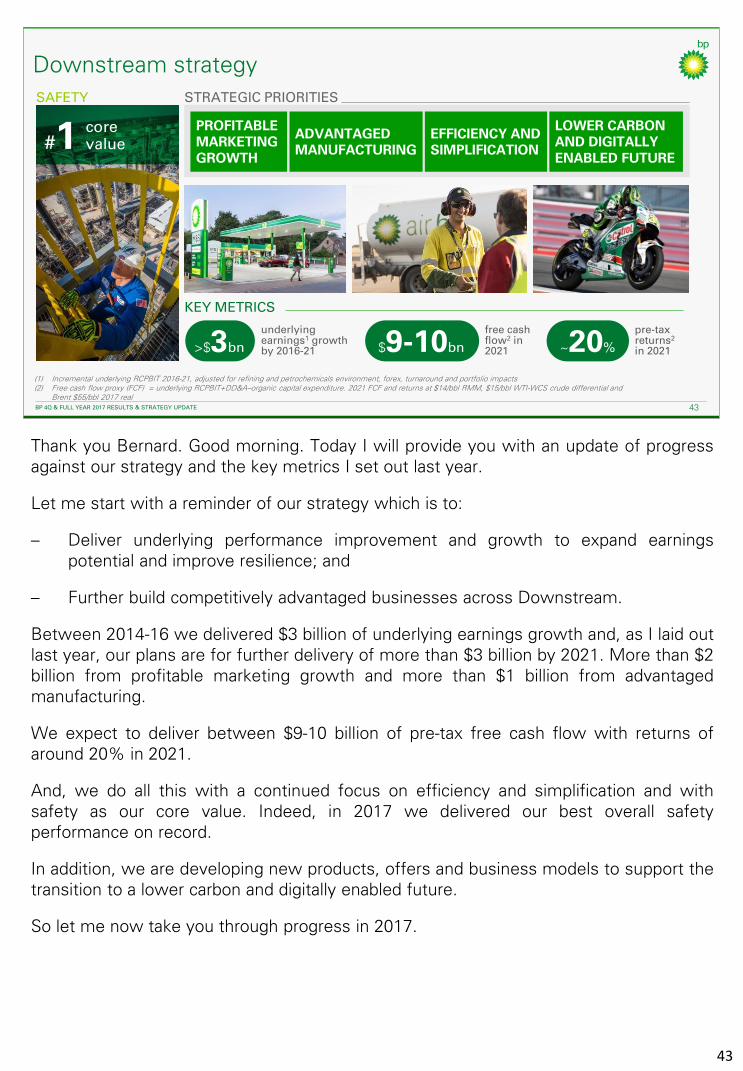
BP 4Q 2017 RESULTS 43BP 4Q & FULL YEAR 2017 RESULTS & STRATEGY UPDATE 43
Downstream strategy
STRATEGIC PRIORITIESSAFETY
core value#1
$9-10bn ~20%>$3bn
underlyingearnings1 growthby 2016-21
free cash flow2 in2021
pre-taxreturns2
in 2021
KEY METRICS
LOWER CARBON AND DIGITALLY ENABLED FUTURE
PROFITABLE MARKETING GROWTH
ADVANTAGEDMANUFACTURING
EFFICIENCY AND SIMPLIFICATION
(1) Incremental underlying RCPBIT 2016-21, adjusted for refining and petrochemicals environment, forex, turnaround and portfolio impacts(2) Free cash flow proxy (FCF) = underlying RCPBIT+DD&A–organic capital expenditure. 2021 FCF and returns at $14/bbl RMM, $15/bbl WTI-WCS crude differential and
Brent $55/bbl 2017 real
Thank you Bernard. Good morning. Today I will provide you with an update of progressagainst our strategy and the key metrics I set out last year.
Let me start with a reminder of our strategy which is to:
– Deliver underlying performance improvement and growth to expand earningspotential and improve resilience; and
– Further build competitively advantaged businesses across Downstream.
Between 2014-16 we delivered $3 billion of underlying earnings growth and, as I laid outlast year, our plans are for further delivery of more than $3 billion by 2021. More than $2billion from profitable marketing growth and more than $1 billion from advantagedmanufacturing.
We expect to deliver between $9-10 billion of pre-tax free cash flow with returns ofaround 20% in 2021.
And, we do all this with a continued focus on efficiency and simplification and withsafety as our core value. Indeed, in 2017 we delivered our best overall safetyperformance on record.
In addition, we are developing new products, offers and business models to support thetransition to a lower carbon and digitally enabled future.
So let me now take you through progress in 2017.
43
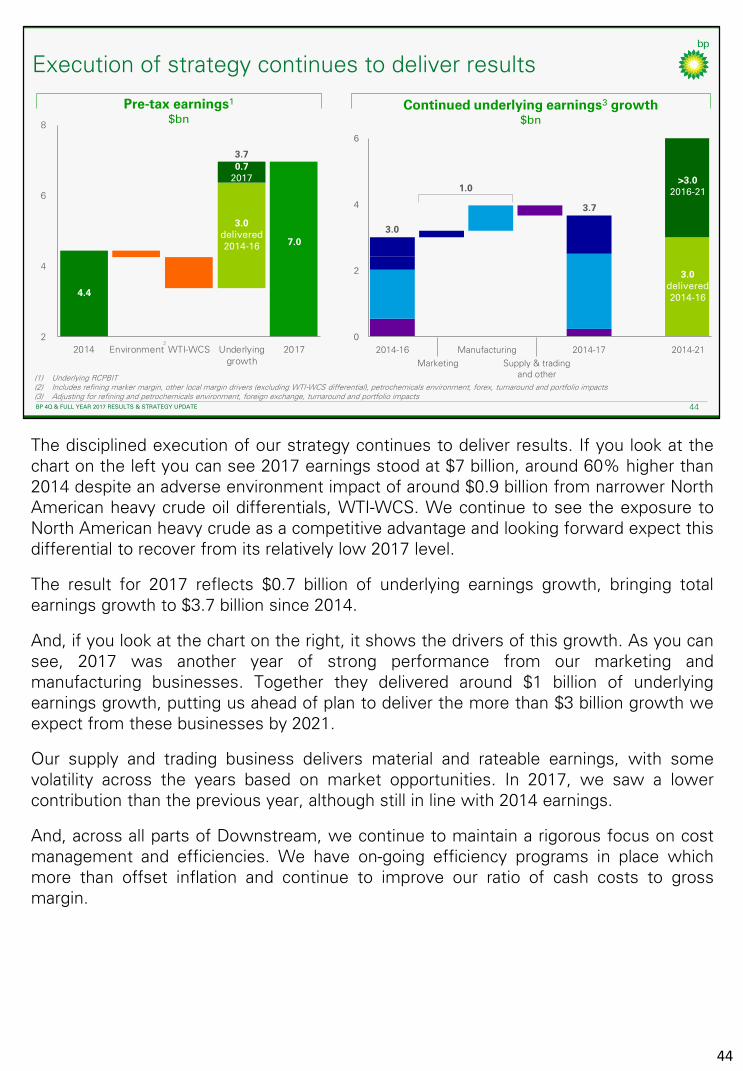
BP 4Q 2017 RESULTS 44BP 4Q & FULL YEAR 2017 RESULTS & STRATEGY UPDATE 44
Execution of strategy continues to deliver results
Pre-tax earnings1
$bnContinued underlying earnings3 growth
$bn
2
4
6
8
2014 Environment WTI-WCS Underlyinggrowth
2017
0.7 2017
3.0 delivered 2014-16 7.0
4.4
2
3.7
(1) Underlying RCPBIT (2) Includes refining marker margin, other local margin drivers (excluding WTI-WCS differential), petrochemicals environment, forex, turnaround and portfolio impacts(3) Adjusting for refining and petrochemicals environment, foreign exchange, turnaround and portfolio impacts
0
2
4
6
3.0
3.7
Marketing
Manufacturing2014-16 2014-17 2014-21
Supply & trading and other
>3.02016-211.0
3.0 delivered 2014-16
The disciplined execution of our strategy continues to deliver results. If you look at thechart on the left you can see 2017 earnings stood at $7 billion, around 60% higher than2014 despite an adverse environment impact of around $0.9 billion from narrower NorthAmerican heavy crude oil differentials, WTI-WCS. We continue to see the exposure toNorth American heavy crude as a competitive advantage and looking forward expect thisdifferential to recover from its relatively low 2017 level.
The result for 2017 reflects $0.7 billion of underlying earnings growth, bringing totalearnings growth to $3.7 billion since 2014.
And, if you look at the chart on the right, it shows the drivers of this growth. As you cansee, 2017 was another year of strong performance from our marketing andmanufacturing businesses. Together they delivered around $1 billion of underlyingearnings growth, putting us ahead of plan to deliver the more than $3 billion growth weexpect from these businesses by 2021.
Our supply and trading business delivers material and rateable earnings, with somevolatility across the years based on market opportunities. In 2017, we saw a lowercontribution than the previous year, although still in line with 2014 earnings.
And, across all parts of Downstream, we continue to maintain a rigorous focus on costmanagement and efficiencies. We have on-going efficiency programs in place whichmore than offset inflation and continue to improve our ratio of cash costs to grossmargin.
44

BP 4Q 2017 RESULTS 45BP 4Q & FULL YEAR 2017 RESULTS & STRATEGY UPDATE 45(1) Underlying RCPBIT at 2017 foreign exchange environment
Marketing – material and growing
in lubricants premium volumes and key growth countries earnings
$2.4bn
premium fuel volumes growth since Active fuels launch
20%
fuels marketingearnings
>10% growth vs 2016
sites opened in Mexico
>130
BP retail siteswith convenience partnerships
1,100
$1.5bnlubricants earnings
growth
Continued
0
2
4
6
2014 2015 2016 2017 2021
Fuels Marketing Lubricants
Pre-tax earnings1
$bn
3.9
Last year we spoke about the key drivers of earnings growth across each of ourbusinesses. Let me now share the progress we have made.
In marketing, we delivered further growth with earnings standing at almost $4 billion in2017 and returns remaining highly attractive, in excess of 30%.
In fuels marketing, we continued our track record of double-digit growth with underlyingearnings in 2017 growing by $0.3 billion to $2.4 billion.
In retail, the most material element of fuels marketing, we continue to strengthen ourdifferentiated offer.
We now have 1,100 convenience partnership sites, a growth of more than 220 in 2017.The success of this highly differentiated partnership model is reflected in our non-fuelretail gross margin, which stood at more than $1 billion in 2017.
And, since the launch of our latest Ultimate fuels with ACTIVE technology in 2016,premium fuel volumes have grown by 20%, improving by 6% in 2017 alone.
Our retail business is differentiated through our strong market positions, brands anddistinctive customer offers. This differentiation enables our growth in existing marketsand supports plans to expand our footprint in new material markets such as Mexico,India, Indonesia and China.
Indeed in Mexico, we now have more than 130 operational sites after becoming the firstinternational oil company to enter the deregulated fuel retail market last year. And weplan to grow to around 1,500 sites by 2021.
And in China, we recently entered into joint ventures with DongMing Petrochemical toestablish a leading branded retail fuels and convenience business. This is part of afocused growth strategy to expand our retail presence in China from 700 to around
45
2,500 sites.
We also continue to grow our B2B fuels and Air BP businesses. In ourglobal Air BP business, which has strong market positions and goodexposure to growth markets, earnings grew by 5% in the year.
Our Lubricants business is also differentiated; it has some of the strongestbrands in the industry and has a brand presence in around 120 countries. In2017, we delivered earnings of $1.5 billion with highly competitive returnon sales of more than 20%.
Our Lubricants business has good exposure to growth markets and thegrowing premium segment, which delivered continued underlying earningsgrowth in 2017, although offset by the adverse lag impacts of increasingbase oil prices.
Indeed, premium lubricants volumes grew to 44%, more than apercentage point increase versus 2016. And in the fourth quarter we saw areturn to year-on-year earnings growth, with key growth markets earningsincreasing by 9%.
Through the strength of our BP Castrol brand we are also establishing aglobal partnership with Renault Nissan Alliance, the largest globalautomotive carmaker. In addition to the continuation of Renault Formula 1sponsorship and the supply of fuels and lubricants by BP the partnershipwill also include a strategic collaboration for advanced mobility solutions.
In addition, we renewed partnerships and supply arrangements with Ford,VW and Volvo. All of this further demonstrates the quality, sustainabilityand robustness of the growth opportunities in our lubricants business.
45

BP 4Q 2017 RESULTS 46BP 4Q & FULL YEAR 2017 RESULTS & STRATEGY UPDATE 46
2016-17 2016-21
Manufacturing – strong underlying earnings growth
Strong operationsUnderlying earnings growth1
$bn
now deployed at key PTA sites
refiningavailability and petrochemicals reliability
>95%
improvement in refining net cash margin3 vs. 2016
vs 37% in 2016
technology
Industry leading
reduction in petrochemicals cash breakeven4 2014-17
>40%
>15%43%
Strong operations
record levels ofadvantaged feedstock2
(1) Underlying RCPBIT at constant refining & petrochemicals environment, normalised turnaround and portfolio impacts (2) Advantaged feedstocks processed as a percentage of throughput. BP operated refineries. 2017 portfolio basis (3) Net cash margin per barrel = Gross product value less raw material costs and operating expenditure. At 2016 price set, 2017 portfolio basis and constant $15/bbl WTI-WCS crude differential(4) Breakeven cash contribution margin based on BP estimates ($/tonne)
Petrochemicals
Refining
~0.8
>1.0
Manufacturing
Turning to manufacturing. Underlying earnings have grown by $0.8 billion in the year,$0.7 billion from refining and $0.1 billion from petrochemicals. This growth reflects thecontinued delivery from our multi-year business improvement programs, BIPs. And, asyou can see we have made significant progress against our plans of more than $1 billiongrowth by 2021.
Delivery has been underpinned by strong operational performance in both refining andpetrochemicals.
In refining, we continued to deliver against our key programs of reliability and efficiency,advantaged feedstock and commercial optimisation:
– Reliability was strong with Solomon availability of more than 95%. And, our Whitingrefinery achieved record levels of throughput in 2017;
– We also processed record levels of advantaged feedstock, increasing to 43% of totalthroughput, versus 37% in 2016;
– Through our commercial optimisation program we delivered additional value fromour assets by capturing opportunities from crude selection through to yieldoptimisation and constraints removal; and
– We delivered further efficiency benefits; for example, maintenance planning andscheduling efficiency improvements.
All of this supported an underlying improvement of more than 15% in our net cashmargin per barrel, which is a metric that measures refining competitive profitability.
In petrochemicals, reducing cash breakeven is key to improving resilience toenvironmental volatility. We have now reduced our cash breakeven by more than 40%
46

versus 2014 through improved operational performance, industry leadingtechnology upgrades and efficiency gains. This improvement wascompleted a year ahead of the schedule that I previously shared with you.
This delivery of underlying earnings growth and double-digit returns inPetrochemicals positions us well to capture growth and investmentopportunities in an attractive and growing market.
46

BP 4Q 2017 RESULTS 47BP 4Q & FULL YEAR 2017 RESULTS & STRATEGY UPDATE 47
0
10
20
2014 2016 2017 2021
12.0 11.5
0
5
10
15
20
25
2014 20162017 2021
RMM to generate 15% pre-tax returns
Growing free cash flow1
$bnImproved resilience
refining marker margin $/bbl
Attractive pre-tax returns%
Cash flow growth, attractive returns, improving resilience
9-10
6-84
2006-16 RMM range3
9-10
Adjusted returns2
(1) Free cash flow proxy (FCF) = underlying RCPBIT + DD&A – organic capex; 2021 FCF at $14/bbl RMM , $15/bbl WTI-WCS crude differential and Brent $55/bbl 2017 real (2) Adjusted returns at $14/bbl RMM, $15/bbl WTI-WCS crude differential and Brent crude price of $55/bbl 2017 real (3) Excludes global financial crisis (2009 & 2010) (4) 2021 projection based on $15/bbl WTI-WCS crude differential and Brent $55/bbl 2017 real
1.1
0
5
10
2016 2017 2021
9-10~20
Reported returns
47
We are also making strong progress on free cash flow and pre-tax returns.
As you can see from the chart on the left, free cash flow has grown by $1.1 billion to$6.6 billion, despite an increase in growth related capital investment. And, pre-taxreturns of more than 18%, our best on record, are fast approaching our target of around20%. Indeed, at 2021 plan assumptions 2017 free cash flow would have been $6.9billion, with returns of more than 19%.
All of which makes our business even more resilient to the environment. If you look atthe chart on the far right, you will see that we have further reduced the BP refiningmarker margin to deliver 15% returns from $12 per barrel in 2016 to $11.50 per barrel in2017. This was achieved despite the impact of narrower North American heavy crude oildifferentials. This means we are able to sustainably deliver strong returns even atindustry refining margins below the historic range.

BP 4Q 2017 RESULTS 48BP 4Q & FULL YEAR 2017 RESULTS & STRATEGY UPDATE 48
Building on our strengths to create our future
Advanced mobility Bio and low carbon Digital
Electric, connected and autonomous vehicles
New fuels, gas, lubricants and plastics
Lead in digital innovation and consumer differentiation
FreewireMobile EV charging investment
Electric vehiclesNew forecourt chargers
Castrol OptigearCarbon-neutral lubricants for wind turbines
Fulcrum BioenergyBiojet from municipal solid waste
Data-enabledBusiness
New business models and ecosystems
Now let me move to the longer term. I am excited by the opportunities that we areworking on in the Downstream to advance the energy transition in support of thereduce-improve-create framework that Lamar spoke about.
First, reducing our carbon footprint in our operations, where we are already in action. Forexample, at our PTA plant in Belgium, technology improvements allow us to achievegreater energy efficiency, reducing our power usage by 30% and leading to an overallgreenhouse gas emissions reduction of 14%.
Second, we continue to innovate and improve our products. We have developed lowerviscosity lubricants helping improve the efficiency of vehicles. In addition, our BP fuelswith ACTIVE technology use an innovative formula designed to fight engine dirt andincrease fuel economy.
And in the third area of creating new low carbon businesses, we use the strategic frameshown on the slide to develop new customer offers and transition our business to alower carbon future in the three focus areas of advanced mobility, bio and low carbonproducts and digital.
We see significant opportunities to create new low carbon businesses and we arepursuing numerous initiatives. Let me now play a short video to share just some of theprogress we have made….
[PLAY VIDEO]
As you can see, there is a lot already in play. We expect these initiatives and the otherprojects we have in the pipeline to create new business models and additional futurerevenue streams for Downstream over the longer term.
48
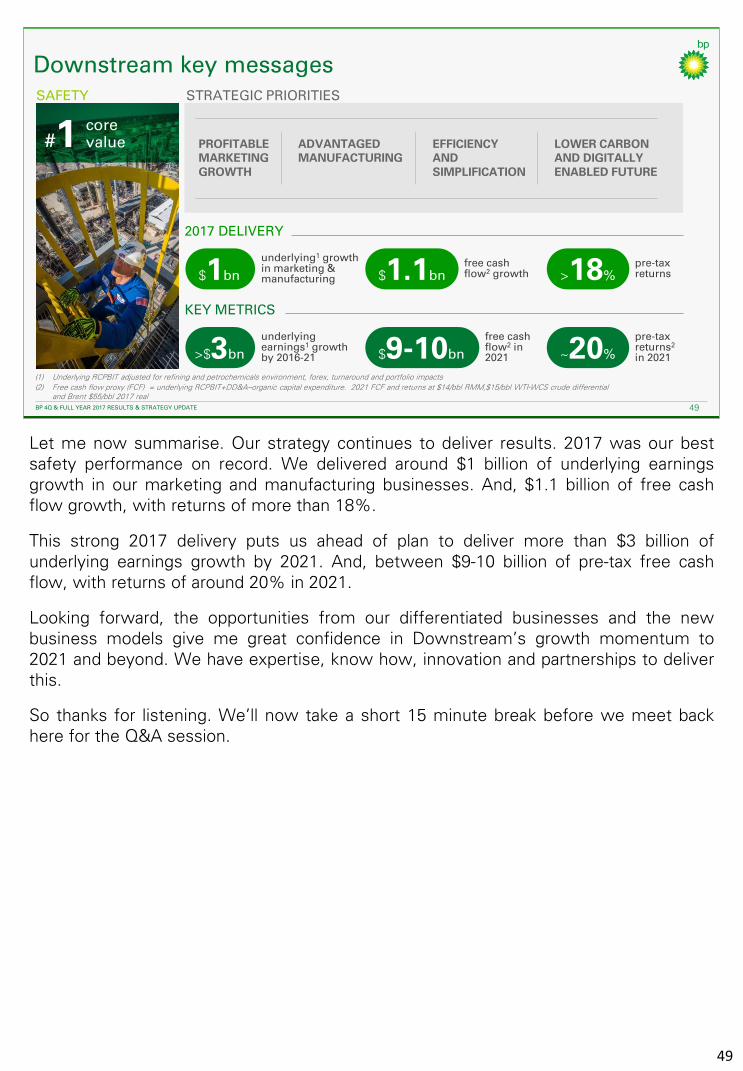
BP 4Q 2017 RESULTS 49BP 4Q & FULL YEAR 2017 RESULTS & STRATEGY UPDATE 49
SAFETY
Downstream key messages
core value#1
(1) Underlying RCPBIT adjusted for refining and petrochemicals environment, forex, turnaround and portfolio impacts
(2) Free cash flow proxy (FCF) = underlying RCPBIT+DD&A–organic capital expenditure. 2021 FCF and returns at $14/bbl RMM,$15/bbl WTI-WCS crude differential and Brent $55/bbl 2017 real
STRATEGIC PRIORITIES
$9-10bn ~20%>$3bn
underlyingearnings1 growthby 2016-21
free cash flow2 in2021
pre-taxreturns2
in 2021
KEY METRICS
$1.1bn >18%$1bn
underlying1 growth in marketing & manufacturing
free cashflow2 growth
pre-taxreturns
2017 DELIVERY
EFFICIENCYAND SIMPLIFICATION
PROFITABLE MARKETING GROWTH
ADVANTAGEDMANUFACTURING
LOWER CARBON AND DIGITALLY ENABLED FUTURE
Let me now summarise. Our strategy continues to deliver results. 2017 was our bestsafety performance on record. We delivered around $1 billion of underlying earningsgrowth in our marketing and manufacturing businesses. And, $1.1 billion of free cashflow growth, with returns of more than 18%.
This strong 2017 delivery puts us ahead of plan to deliver more than $3 billion ofunderlying earnings growth by 2021. And, between $9-10 billion of pre-tax free cashflow, with returns of around 20% in 2021.
Looking forward, the opportunities from our differentiated businesses and the newbusiness models give me great confidence in Downstream’s growth momentum to2021 and beyond. We have expertise, know how, innovation and partnerships to deliverthis.
So thanks for listening. We’ll now take a short 15 minute break before we meet backhere for the Q&A session.
49

BP 4Q 2017 RESULTS 50BP 4Q & FULL YEAR 2017 RESULTS & STRATEGY UPDATE 50
BP 4Q & FULL YEAR 2017 RESULTS & STRATEGY UPDATE
Group Chief Executive
Bob Dudley
Welcome back. Before we move to Q&A I would like to take just a few minutes to summarise a few key points.
50
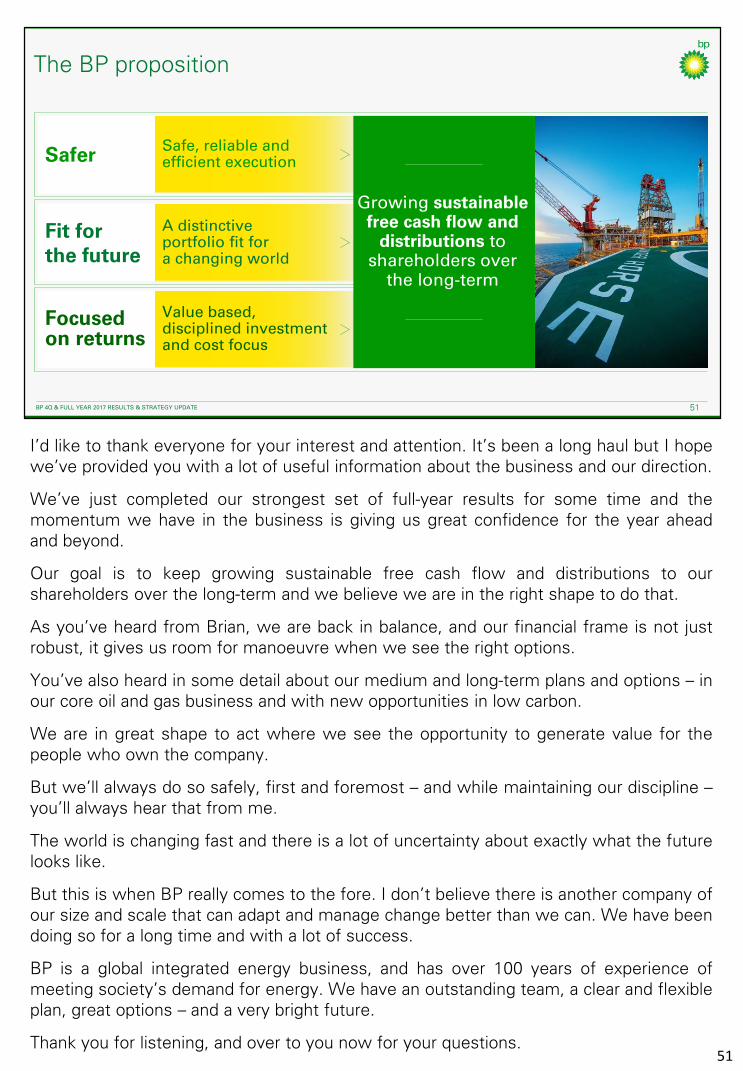
BP 4Q 2017 RESULTS 51BP 4Q & FULL YEAR 2017 RESULTS & STRATEGY UPDATE 51
The BP proposition
Safer
Fit for the future
Focused on returns
Safe, reliable and efficient execution
A distinctive portfolio fit for a changing world
Value based,disciplined investment and cost focus
Growing sustainable free cash flow and
distributions toshareholders over
the long-term
I’d like to thank everyone for your interest and attention. It’s been a long haul but I hopewe’ve provided you with a lot of useful information about the business and our direction.
We’ve just completed our strongest set of full-year results for some time and themomentum we have in the business is giving us great confidence for the year aheadand beyond.
Our goal is to keep growing sustainable free cash flow and distributions to ourshareholders over the long-term and we believe we are in the right shape to do that.
As you’ve heard from Brian, we are back in balance, and our financial frame is not justrobust, it gives us room for manoeuvre when we see the right options.
You’ve also heard in some detail about our medium and long-term plans and options – inour core oil and gas business and with new opportunities in low carbon.
We are in great shape to act where we see the opportunity to generate value for thepeople who own the company.
But we’ll always do so safely, first and foremost – and while maintaining our discipline –you’ll always hear that from me.
The world is changing fast and there is a lot of uncertainty about exactly what the futurelooks like.
But this is when BP really comes to the fore. I don’t believe there is another company ofour size and scale that can adapt and manage change better than we can. We have beendoing so for a long time and with a lot of success.
BP is a global integrated energy business, and has over 100 years of experience ofmeeting society’s demand for energy. We have an outstanding team, a clear and flexibleplan, great options – and a very bright future.
Thank you for listening, and over to you now for your questions.51

BP 4Q 2017 RESULTS 52BP 4Q & FULL YEAR 2017 RESULTS & STRATEGY UPDATE 52
Q&A
Chief executive, Upstream
BernardLooney
Chief financial officer
BrianGilvary
Deputy group chief executive
LamarMcKay
Chief executive, Downstream
TufanErginbilgic
Bob Dudley
Group chief executive
52