boxborough 2030 economic development existing conditions presentation, february 25, 2015 master plan...
TRANSCRIPT

BOXBOROUGH 2030 Economic Development: Existing Conditions
February 25, 2015 DRAFT

What is Economic Development?
Quality of life for
Community Members
Housing
Jobs & Workforce
development
Transportation
Environment
DRAFT

Key Findings
Boxborough is experiencing substantial retail leakage
but…
Boxborough’s location and workforce present significant opportunities for economic development.
DRAFT

Boxborough Today
Household demographics
Commercial development
Quality of life Housing needs DRAFT

Res: 44%
Ind/Comm: 19%
DRAFT

Revenue-Expenditure Ratio*
For every dollar collected from… the town spends roughly…
Residential property tax
Commercial/Industrial property tax
$1.36 on residential services
$1.26 on commercial/industrial services
* Rough estimation. Additional analysis required for accurate ratios. DRAFT

Slow commercial growth
Little commercial growth and few incentives to minimize business mobility
10
15
9 9 10
12
6
9
6 7
4
1
3
0
2
4
6
8
10
12
14
16
2004 2005 2006 2007 2008 2009 2010 2011 2012 2013 2014
Commercial Building Permits Issued
Renovation New Construction Source: Town of Boxborough Building Department
Jobs & Workforce
DRAFT

Large tech workforce Jobs &
Workforce
No. of Businesses by Category
Scientific, technical, professional services
& manufacturing 22%
Other businesses 78%
Local Workforce by Category
Scientific, technical, professional services
& manufacturing 64%
(~2600 people) Other
businesses 36%
5 Largest Employers Employee # range
Cisco Systems 500-999 Blue Coat Systems 100-249 Holiday Inn 100-249 Sava Senior Care Home Office 100-249 Setra Systems 100-249 DRAFT

Retail Gap: Boxborough Demand
(Retail Potential) Supply
(Retail Sales) Retail Gap
Leakage/ Surplus Factor
Industry Group Motor Vehicle & Parts Dealers $ 21,614,792 $ 1,666,157 $ 19,948,635 85.7 Food & Beverage Stores $ 20,912,570 $ 541,764 $ 20,370,806 94.9
Grocery Stores $ 17,787,077 $ 304,636 $ 17,482,441 96.6 Specialty Food Stores $ 852,433 $ 237,128 $ 615,305 56.5
Clothing & Clothing Accessories Stores $ 8,055,927 $ - $ 8,055,927 100
Sporting Goods, Hobby, Book & Music Stores $ 3,023,421 $ 213,300 $ 2,810,121 86.8
General Merchandise Stores $ 11,384,468 $ 128,867 $ 11,255,601 97.8 Miscellaneous Store Retailers $ 2,734,132 $ 402,834 $ 2,331,298 74.3 Florists $ 174,903 $ - $ 174,903 100 Food Services & Drinking Places $ 12,486,831 $ 1,397,577 $ 11,089,254 79.9
Full-Service Restaurants $ 6,442,217 $ 146,139 $ 6,296,078 95.6 Limited-Service Eating Places $ 5,011,641 $ 1,153,491 $ 3,858,150 62.6 Special Food Services $ 658,682 $ - $ 658,682 100
Drinking Places - Alcoholic Beverages $ 374,291 $ 97,947 $ 276,344 58.5
Source: ESRI, Dunn & Bradstreet 2014
Jobs & Workforce
Quality of Life
DRAFT

Complete Buildout as-of-right: additional $3.48 million in tax
revenue.
Capacity: 2.3 million square feet.
Jobs & Workforce
DRAFT
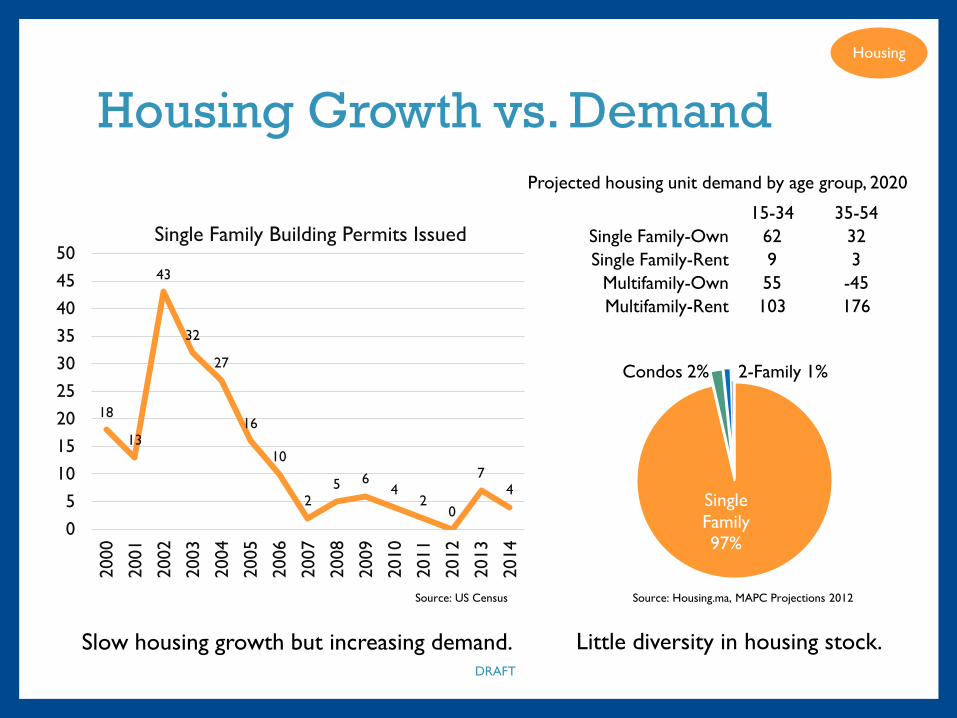
Housing Growth vs. Demand
18
13
43
32
27
16
10
2 5 6
4 2
0
7 4
0 5
10 15 20 25 30 35 40 45 50
2000
2001
2002
2003
2004
2005
2006
2007
2008
2009
2010
2011
2012
2013
2014
Single Family Building Permits Issued
Source: US Census
Single Family 97%
Condos 2% 2-Family 1%
Slow housing growth but increasing demand. Little diversity in housing stock.
Source: Housing.ma, MAPC Projections 2012
15-34 35-54 Single Family-Own 62 32 Single Family-Rent 9 3
Multifamily-Own 55 -45 Multifamily-Rent 103 176
Projected housing unit demand by age group, 2020
Housing
DRAFT

Rising Housing Costs
$640,000
$103,000
$285,000
$-
$100,000
$200,000
$300,000
$400,000
$500,000
$600,000
$700,000 19
87
1988
19
89
1990
19
91
1992
19
93
1994
19
95
1996
19
97
1998
19
99
2000
20
01
2002
20
03
2004
20
05
2006
20
07
2008
20
09
2010
20
11
2012
20
13
2014
Median Home Sales Price Boxborough, MA
Single Family
All
Source: The Warren Group
Condo
Housing
DRAFT

Complete Buildout as-of-right: additional $950,000 in tax
revenue.
Capacity: 105 units in A/R 3 units in R1 3 units in TC
Housing
DRAFT

Environment
DRAFT
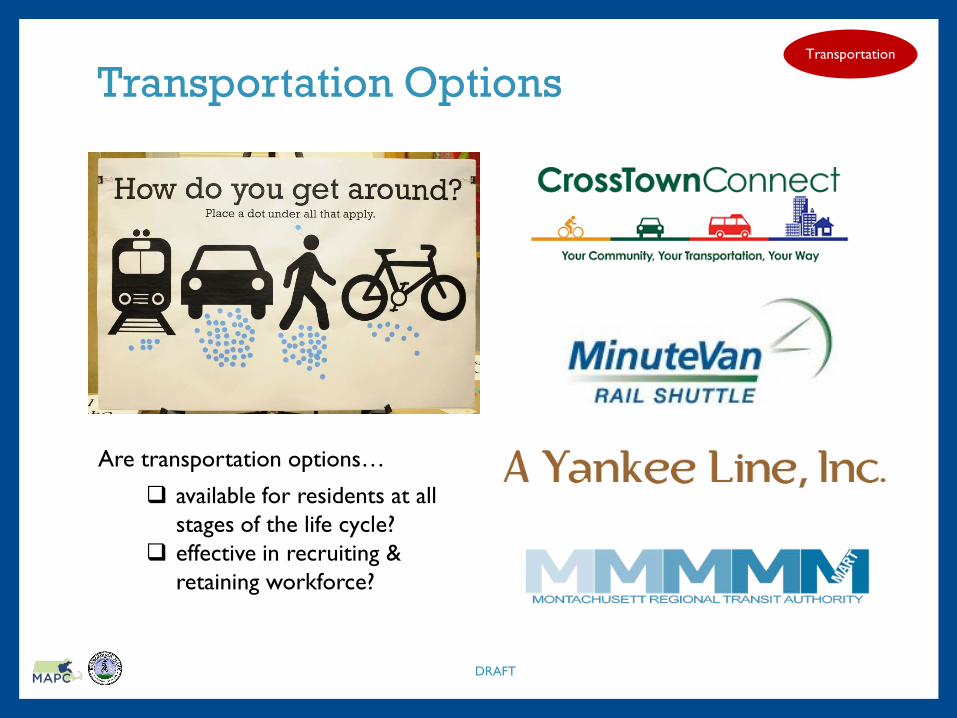
Transportation Options
Are transportation options…
available for residents at all stages of the life cycle?
effective in recruiting & retaining workforce?
Transportation
DRAFT

Again, Key Findings
Boxborough is experiencing substantial retail leakage
but…
Boxborough’s location and workforce present significant opportunities for economic development.
DRAFT

What’s holding back growth?
DRAFT

Strong emphasis on preserving rural character. Current zoning allows for more growth and density. Setback requirements waived for commercial
development in Town Center.
? Lot area and dimensional requirements may be prohibitive for small, village-type stores.
? Parking requirements. ? Conservation bylaws.
Zoning
DRAFT

Zoning Ingredients
Lot boundary
Upland area
Lot coverage
Parking
Building area
Open space/ Unbuilt area
Unbuilt area Built area
50 Setback (feet)
DRAFT

Zoning Recipe: Village Store Requirements for a village store of 2,000 square feet in Town Center District:
Minimum parking 3,200 square feet
Maximum lot coverage 35%
Minimum open space 65%
Store 5%
Parking 8%
Minimum upland lot area 20%
M i n i m u m l o t s i z e : 4 0 , 0 0 0 s q u a re f e e t
DRAFT

Zoning Recipe: Business District Store Requirements for a small hardware store of 10,000 sf in Business District:
Minimum parking16,000 square feet
Store 15%
Parking 25%
50
30
40
L o t s i z e : 1 . 5 a c re s / 6 5 , 3 4 0 s q u a re f e e t
Maximum lot coverage 50%
30
DRAFT

Growth under the Boxborough Vision
DRAFT

Scenario: New Life in “Holidisco”
DRAFT

Scenario: Building Boxborough Center
DRAFT

Open Space Commercial Development Minimum lot acreage: 10
Business 50% Preservation
Office Park 70% Preservation
Ind/Comm 70% Preservation
50% Development 30% Development 30% Development
Total maximum lot coverage allowed: 37% Total open space preserved: 63% Development pattern: Large, scattered lots.
Growth + Preservation
DRAFT

Transfer of Development Rights
Business 50% Preservation
Office Park 70% Preservation
Ind/Comm 70% Preservation
50% Development 30% Development 30% Development
Growth + Preservation
Sending Area
Receiving Area
Town Center Business
Office Park Ind/Comm
Additional density
Existing allowed density
Additional density
Existing allowed density
Total open space preserved: 100% Development pattern: Less sprawl & density in appropriate areas.
DRAFT

PRELIMINARY FINDINGS FROM INTERVIEWS
Strengths, Weaknesses, Threats, Opportunities
DRAFT

• High satisfaction with town services
• Proximity to I-495
• Unique and diverse businesses that cater to niche markets
• Strong technology sector
• Pride of business ownership
• A-B Regional School System
• High property values
• Office parks with existing infrastructure
• Demographic diversity in both residents and employees
• Town events
• Scenic beauty
• Unique character
• Low satisfaction with permitting process, especially for newcomers
• Rigid conservation bylaws
• Lack of water and sewer infrastructure
• Lack of incentives for businesses to stay
• Lack of a Town Center
• Stringent signage bylaws
• Weak relationship between local business/companies and Town Hall
• Lack of retail variety
• Lack of relatively affordable housing
• High number of commercial vacancies
• Vacant lots
• Walkability
Strengths Weaknesses vs
DRAFT

• High satisfaction with town services
• Proximity to I-495
• Unique and diverse businesses that cater to niche markets
• Strong technology sector
• Pride of business ownership
• A-B Regional School System
• High property values
• Office parks with existing infrastructure
• Demographic diversity in both residents and employees
• Town events
• Scenic beauty
• Unique character
• Relationship building with business owners and companies
• Recruiting business & companies that cater to larger trade areas
• Recruiting hi-tech companies
• High confidence on return on investment
• Increase property value of existing business with expansions & improvements
• “Hidden Gems” & destinations
• Infill development on existing commercial properties
• Foster local culture and identity
• Leverage natural & scenic resources for economic development
Strengths Opportunities =
DRAFT

• Low satisfaction with permitting process, especially for newcomers
• Rigid conservation bylaws
• Lack of water and sewer infrastructure
• Lack of incentives for businesses to stay
• Lack of a Town Center
• Stringent signage bylaws
• Weak relationship between local business/companies and Town Hall
• Lack of retail variety
• Lack of relatively affordable housing
• High number of commercial vacancies
• Vacant lots
• Walkability
• Deters existing businesses from expansion and investment
• Decreases confidence of doing business in town
• Lack of local will to pursue federal/state funding or assistance
• Corporate/business mobility
• Workforce mobility
• Physical appearance
• Ability to age in place
• Economic leakage
• Regional competition for housing and retail
Weaknesses Threats =
DRAFT

• Low satisfaction with permitting process, especially for newcomers
• Rigid conservation bylaws
• Lack of water and sewer infrastructure
• Lack of incentives for businesses to stay
• Lack of a Town Center
• Stringent signage bylaws
• Weak relationship between local business/companies and Town Hall
• Lack of retail variety
• Lack of relatively affordable housing
• High number of commercial vacancies
• Vacant lots
• Walkability
Weaknesses Opportunities = • Outreach & relationship building with
local businesses & companies
• Explore incentives for business retention
• Review of zoning / conservation bylaws
• Identification of opportunity sites for development and investment
• Exploration of infill development where infrastructure exists
• Increase taxable value of commercial properties by encouraging investment and improvement
• Identify and satisfy regional retail gaps
• Multiplier effect
• Foster local culture and community pride
DRAFT

FEEDBACK ON ECONOMIC
DEVELOPMENT SURVEYS
DRAFT