bows setup study guide - bulls on wall...
TRANSCRIPT
BOWS
Setup
Study
Guide
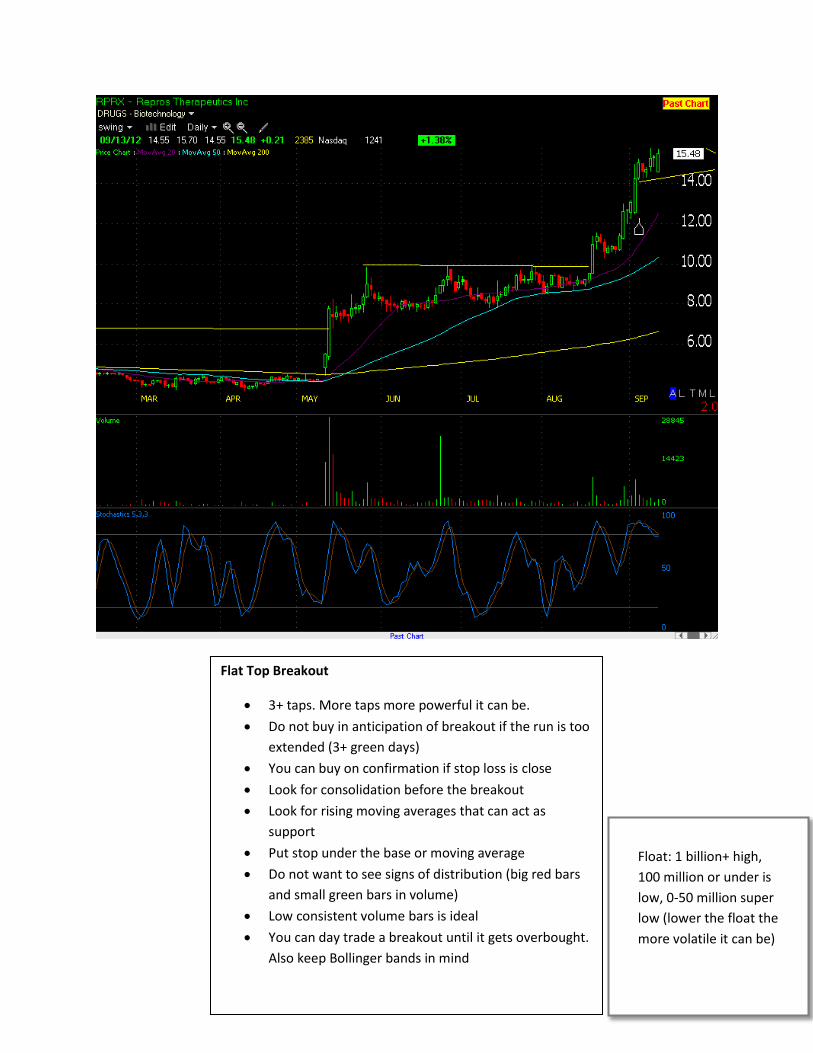
Flat Top Breakout
3+ taps. More taps more powerful it can be.
Do not buy in anticipation of breakout if the run is too
extended (3+ green days)
You can buy on confirmation if stop loss is close
Look for consolidation before the breakout
Look for rising moving averages that can act as
support
Put stop under the base or moving average
Do not want to see signs of distribution (big red bars
and small green bars in volume)
Low consistent volume bars is ideal
You can day trade a breakout until it gets overbought.
Also keep Bollinger bands in mind
Float: 1 billion+ high,
100 million or under is
low, 0-50 million super
low (lower the float the
more volatile it can be)
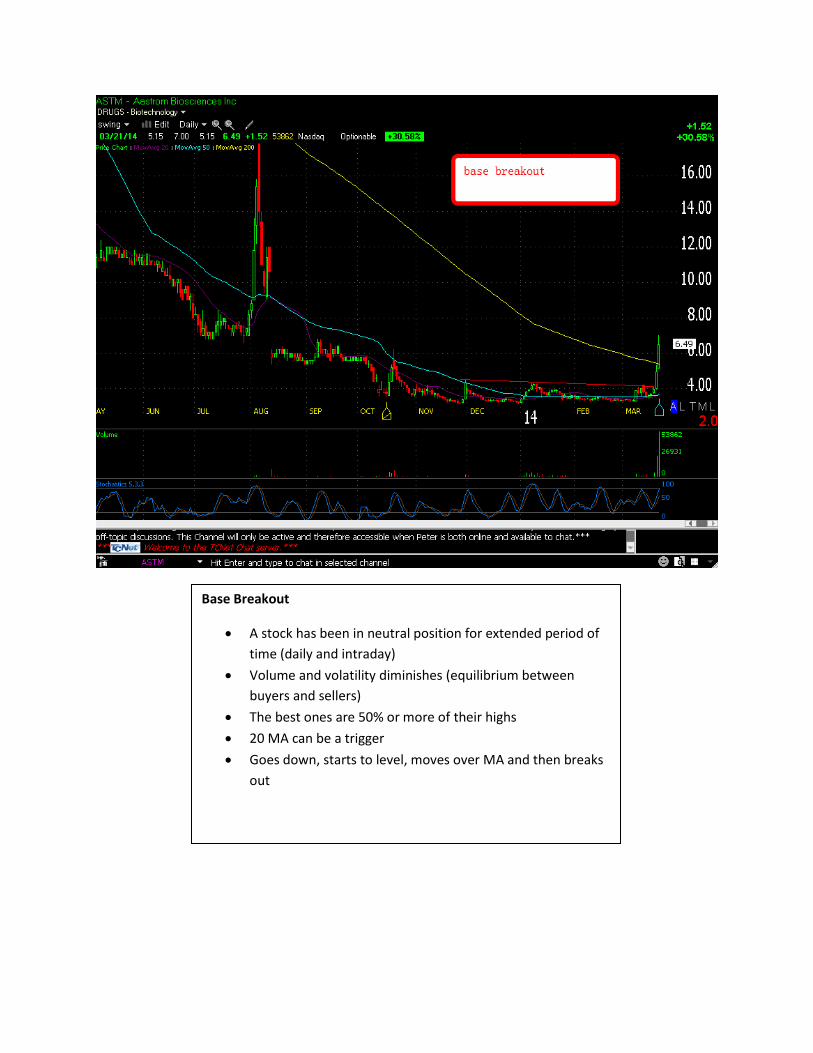
Base Breakout
A stock has been in neutral position for extended period of
time (daily and intraday)
Volume and volatility diminishes (equilibrium between
buyers and sellers)
The best ones are 50% or more of their highs
20 MA can be a trigger
Goes down, starts to level, moves over MA and then breaks
out
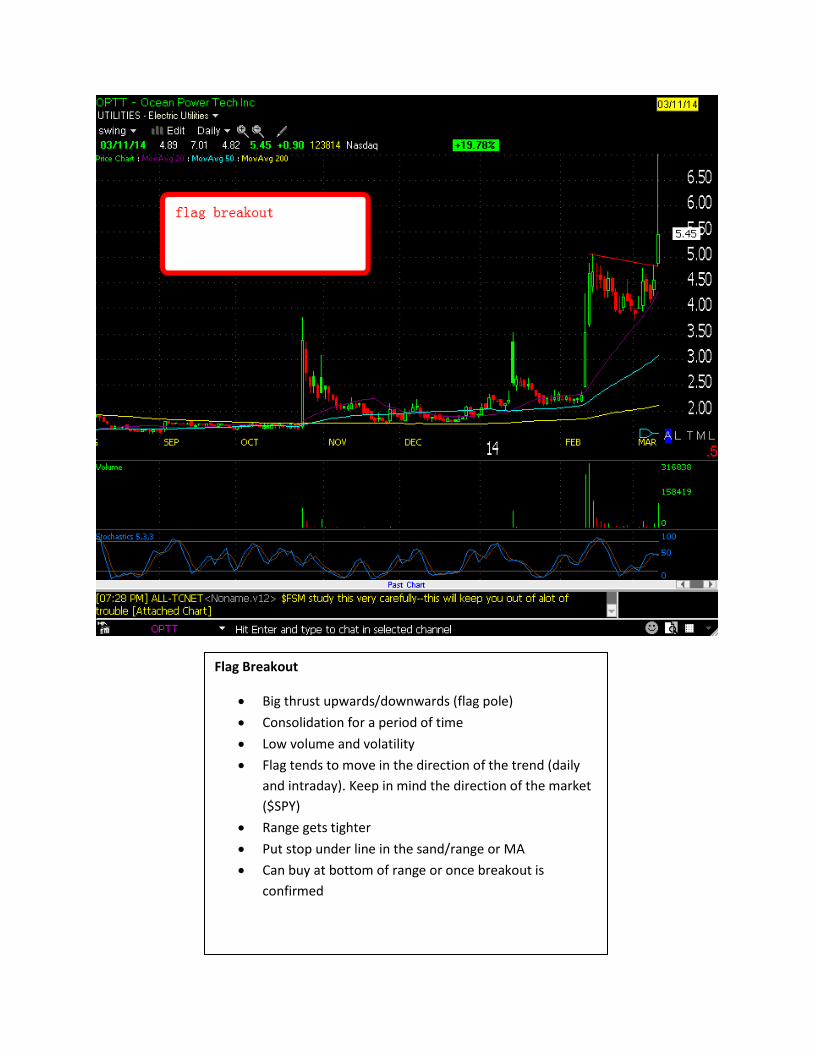
Flag Breakout
Big thrust upwards/downwards (flag pole)
Consolidation for a period of time
Low volume and volatility
Flag tends to move in the direction of the trend (daily
and intraday). Keep in mind the direction of the market
($SPY)
Range gets tighter
Put stop under line in the sand/range or MA
Can buy at bottom of range or once breakout is
confirmed
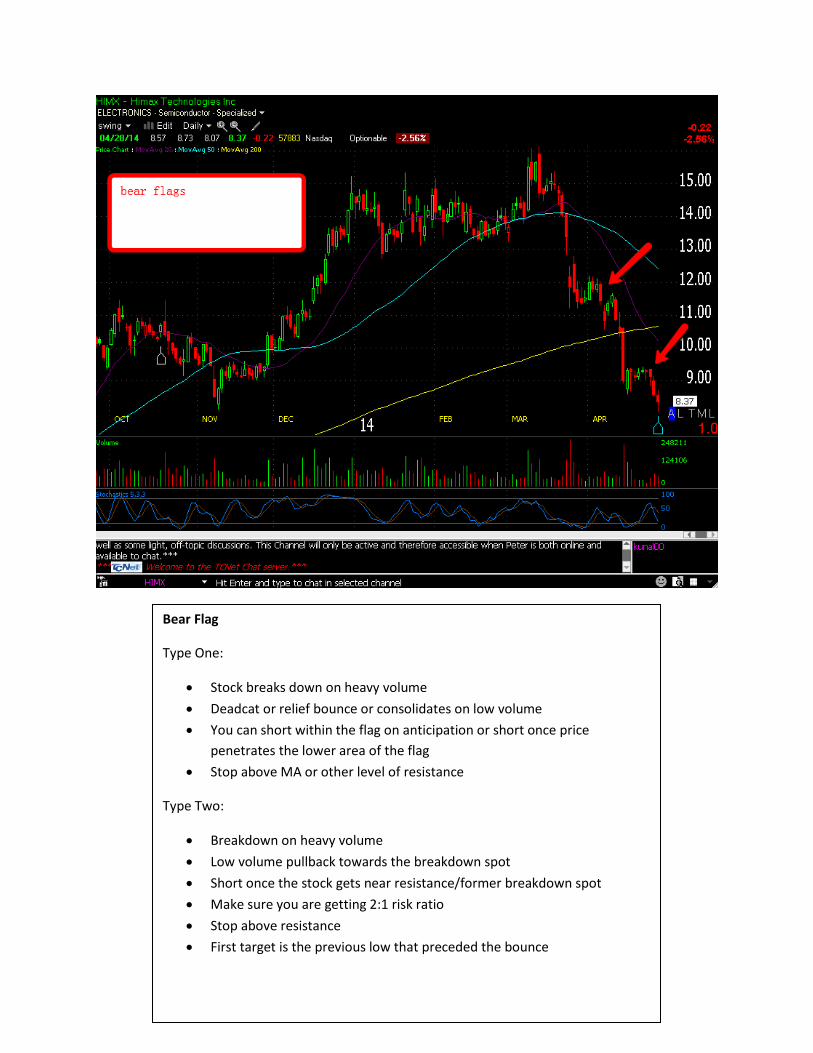
Bear Flag
Type One:
Stock breaks down on heavy volume
Deadcat or relief bounce or consolidates on low volume
You can short within the flag on anticipation or short once price
penetrates the lower area of the flag
Stop above MA or other level of resistance
Type Two:
Breakdown on heavy volume
Low volume pullback towards the breakdown spot
Short once the stock gets near resistance/former breakdown spot
Make sure you are getting 2:1 risk ratio
Stop above resistance
First target is the previous low that preceded the bounce
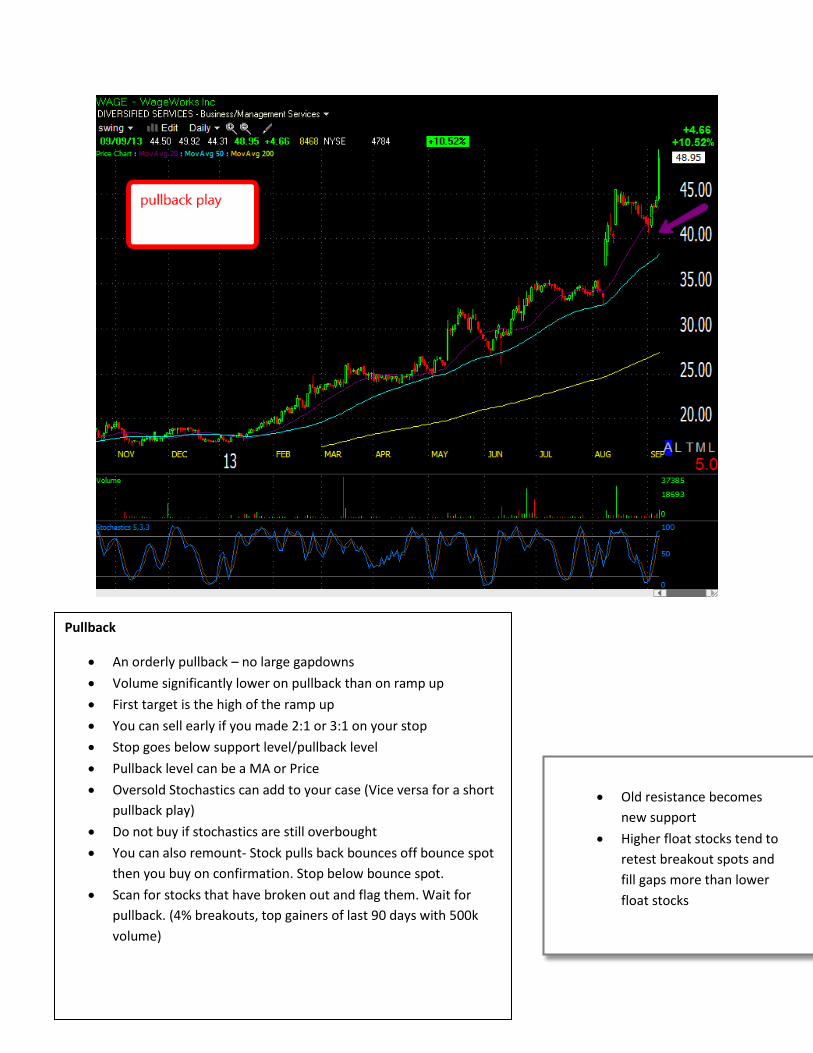
Pullback
An orderly pullback – no large gapdowns
Volume significantly lower on pullback than on ramp up
First target is the high of the ramp up
You can sell early if you made 2:1 or 3:1 on your stop
Stop goes below support level/pullback level
Pullback level can be a MA or Price
Oversold Stochastics can add to your case (Vice versa for a short
pullback play)
Do not buy if stochastics are still overbought
You can also remount- Stock pulls back bounces off bounce spot
then you buy on confirmation. Stop below bounce spot.
Scan for stocks that have broken out and flag them. Wait for
pullback. (4% breakouts, top gainers of last 90 days with 500k
volume)
Old resistance becomes
new support
Higher float stocks tend to
retest breakout spots and
fill gaps more than lower
float stocks
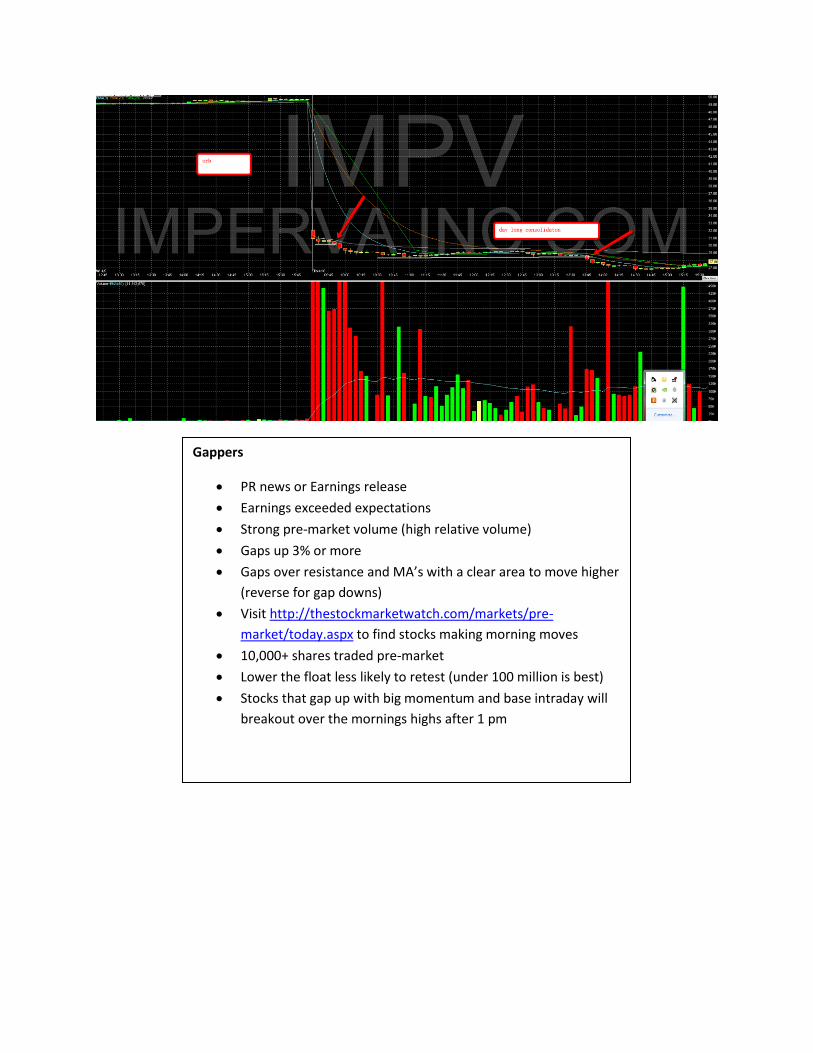
Gappers
PR news or Earnings release
Earnings exceeded expectations
Strong pre-market volume (high relative volume)
Gaps up 3% or more
Gaps over resistance and MA’s with a clear area to move higher
(reverse for gap downs)
Visit http://thestockmarketwatch.com/markets/pre-
market/today.aspx to find stocks making morning moves
10,000+ shares traded pre-market
Lower the float less likely to retest (under 100 million is best)
Stocks that gap up with big momentum and base intraday will
breakout over the mornings highs after 1 pm
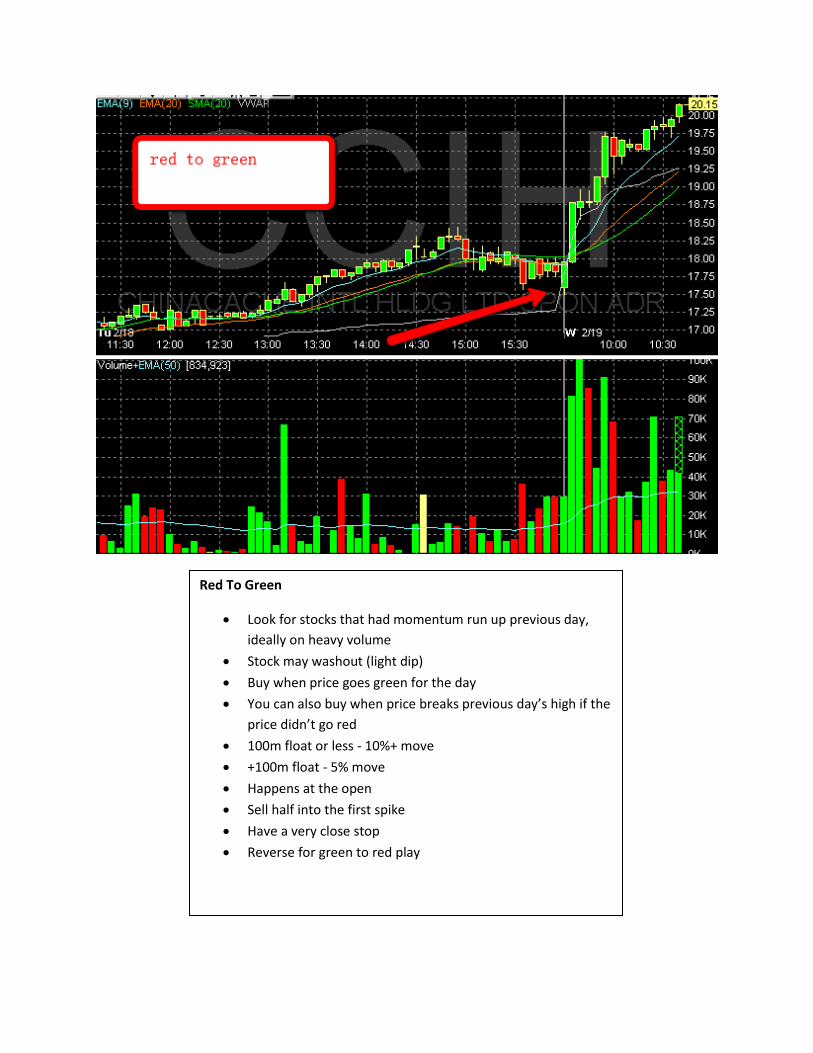
Red To Green
Look for stocks that had momentum run up previous day,
ideally on heavy volume
Stock may washout (light dip)
Buy when price goes green for the day
You can also buy when price breaks previous day’s high if the
price didn’t go red
100m float or less - 10%+ move
+100m float - 5% move
Happens at the open
Sell half into the first spike
Have a very close stop
Reverse for green to red play
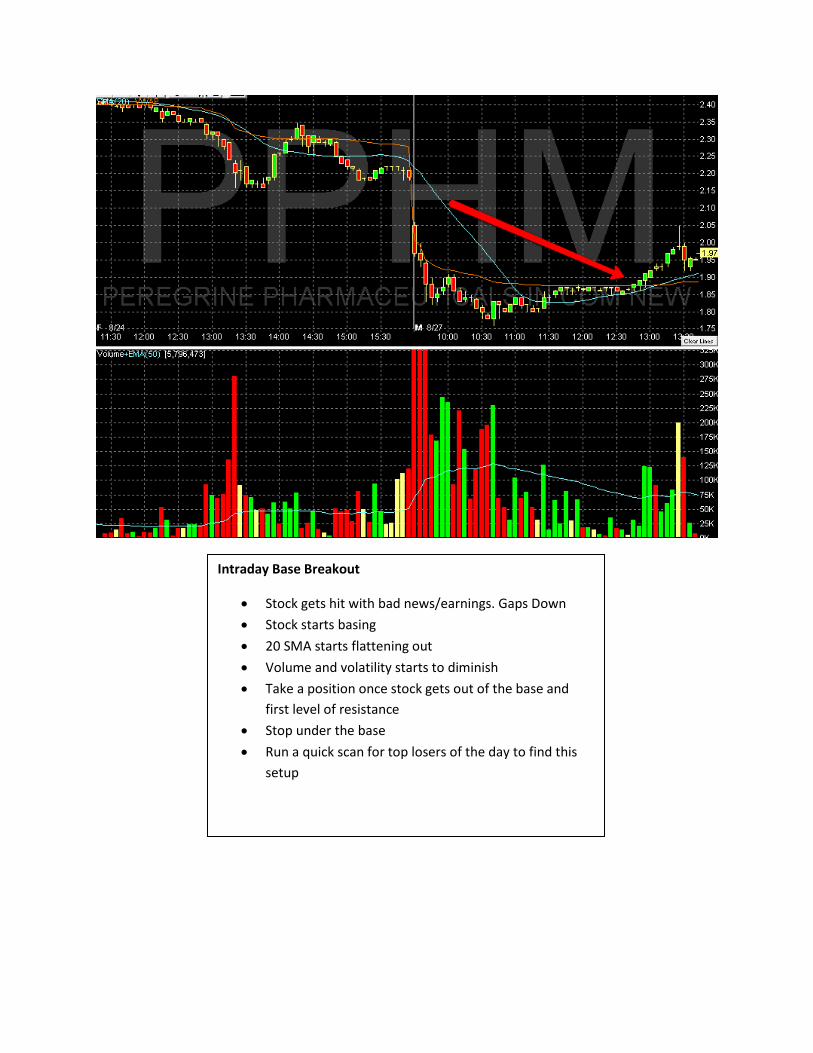
Intraday Base Breakout
Stock gets hit with bad news/earnings. Gaps Down
Stock starts basing
20 SMA starts flattening out
Volume and volatility starts to diminish
Take a position once stock gets out of the base and
first level of resistance
Stop under the base
Run a quick scan for top losers of the day to find this
setup
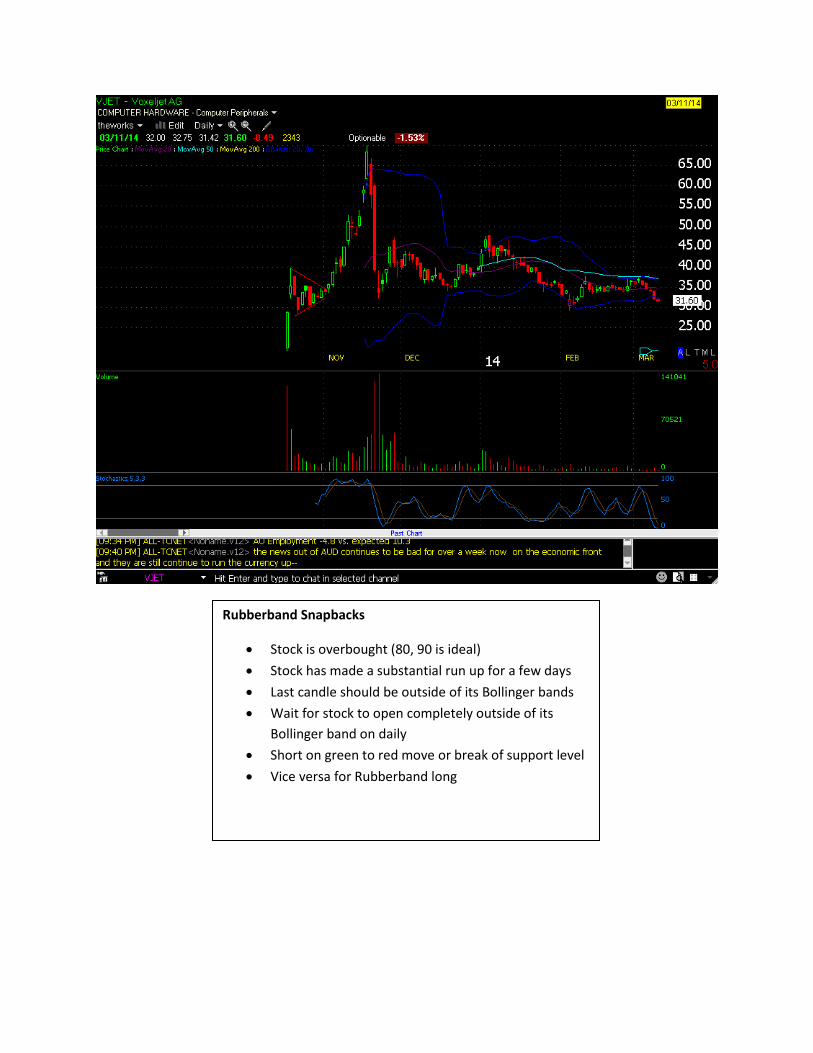
Rubberband Snapbacks
Stock is overbought (80, 90 is ideal)
Stock has made a substantial run up for a few days
Last candle should be outside of its Bollinger bands
Wait for stock to open completely outside of its
Bollinger band on daily
Short on green to red move or break of support level
Vice versa for Rubberband long
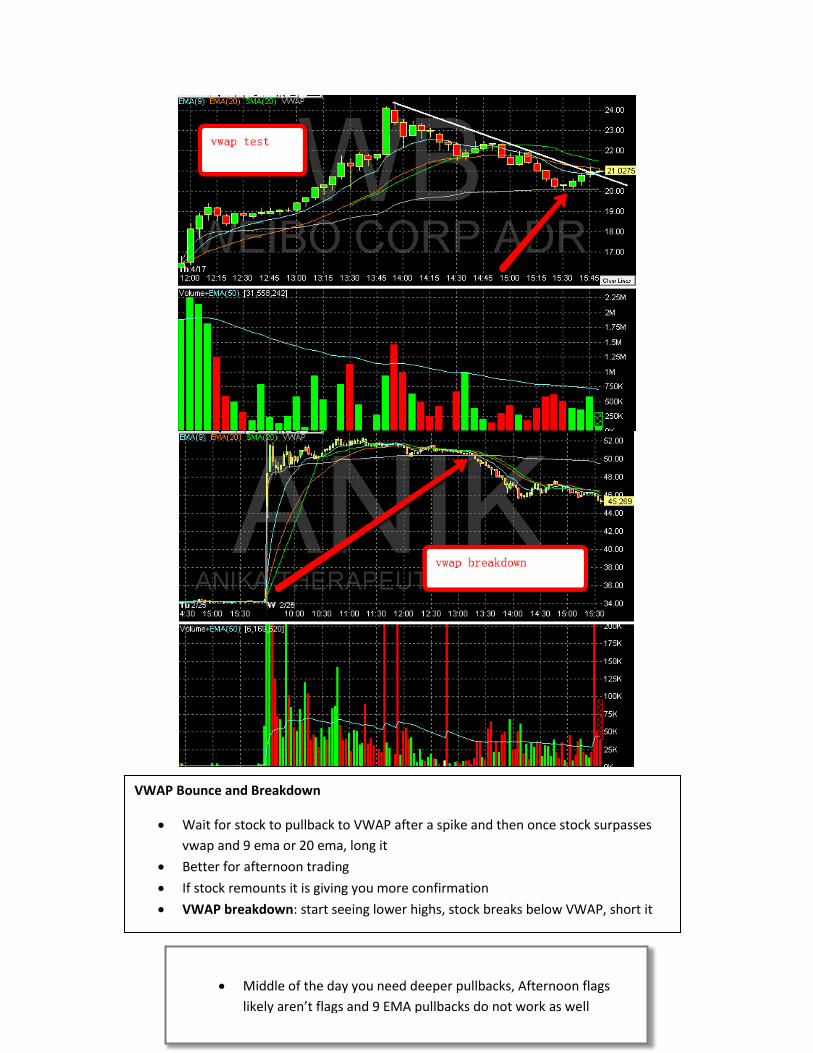
VWAP Bounce and Breakdown
Wait for stock to pullback to VWAP after a spike and then once stock surpasses
vwap and 9 ema or 20 ema, long it
Better for afternoon trading
If stock remounts it is giving you more confirmation
VWAP breakdown: start seeing lower highs, stock breaks below VWAP, short it
Middle of the day you need deeper pullbacks, Afternoon flags
likely aren’t flags and 9 EMA pullbacks do not work as well
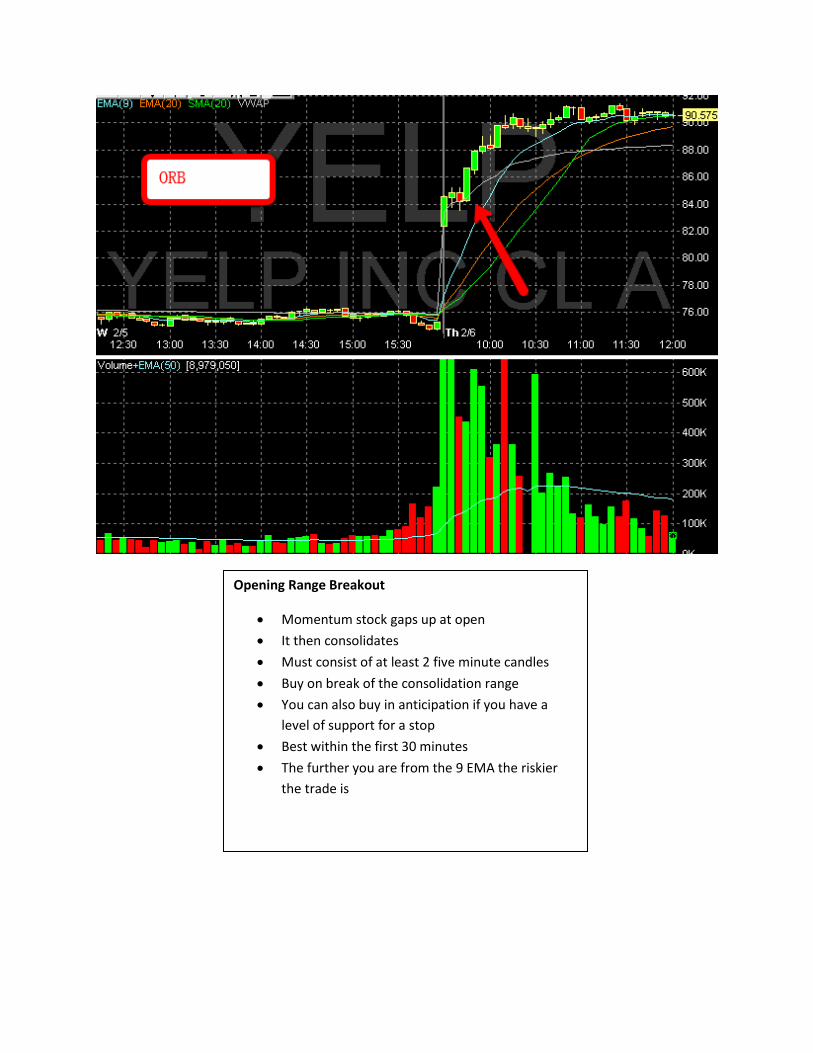
Opening Range Breakout
Momentum stock gaps up at open
It then consolidates
Must consist of at least 2 five minute candles
Buy on break of the consolidation range
You can also buy in anticipation if you have a
level of support for a stop
Best within the first 30 minutes
The further you are from the 9 EMA the riskier
the trade is
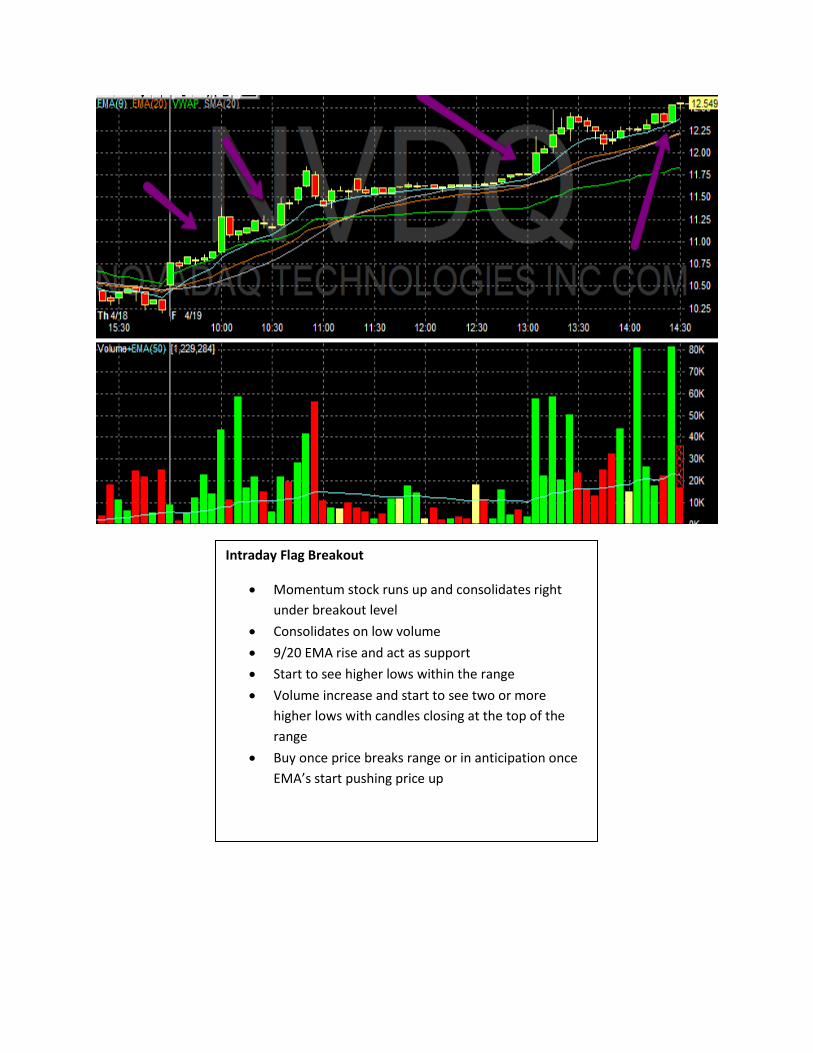
Intraday Flag Breakout
Momentum stock runs up and consolidates right
under breakout level
Consolidates on low volume
9/20 EMA rise and act as support
Start to see higher lows within the range
Volume increase and start to see two or more
higher lows with candles closing at the top of the
range
Buy once price breaks range or in anticipation once
EMA’s start pushing price up
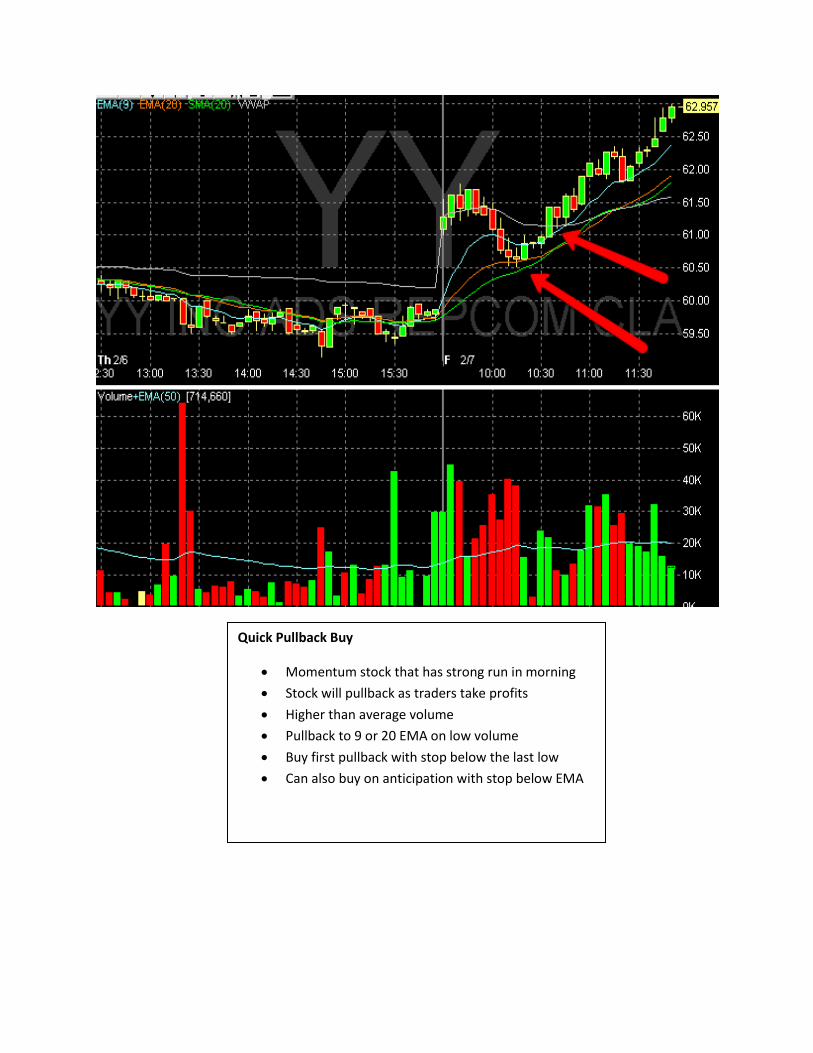
Quick Pullback Buy
Momentum stock that has strong run in morning
Stock will pullback as traders take profits
Higher than average volume
Pullback to 9 or 20 EMA on low volume
Buy first pullback with stop below the last low
Can also buy on anticipation with stop below EMA
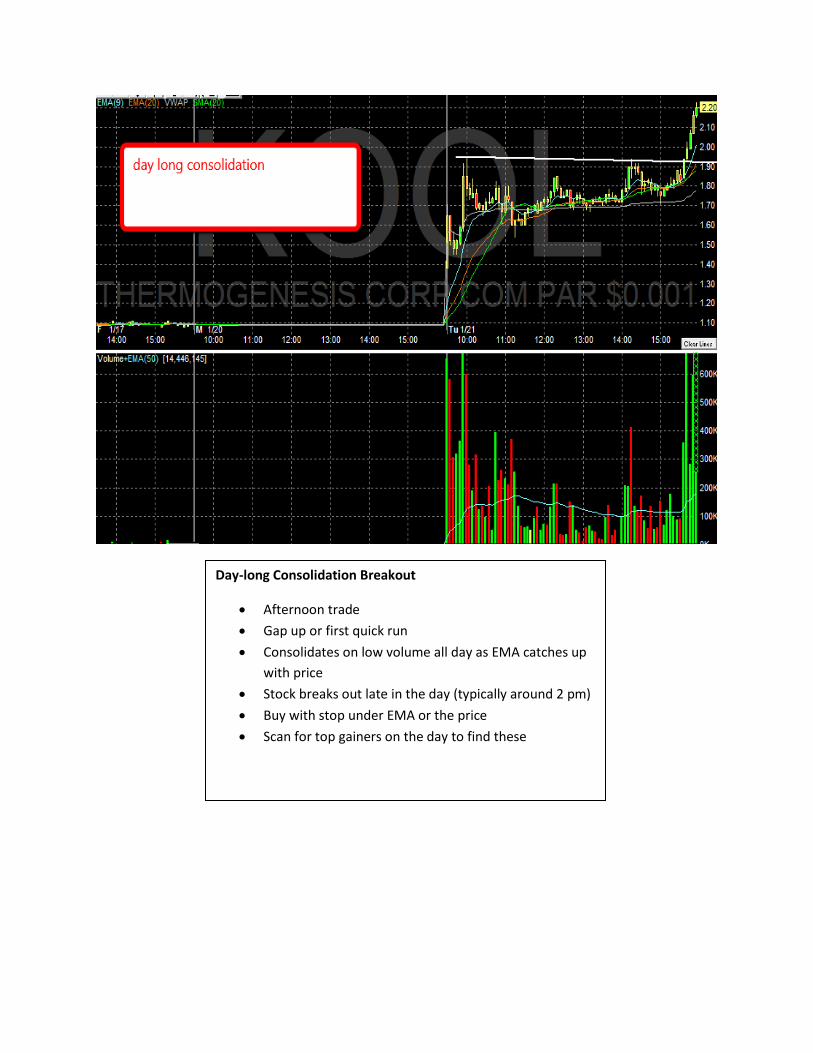
Day-long Consolidation Breakout
Afternoon trade
Gap up or first quick run
Consolidates on low volume all day as EMA catches up
with price
Stock breaks out late in the day (typically around 2 pm)
Buy with stop under EMA or the price
Scan for top gainers on the day to find these
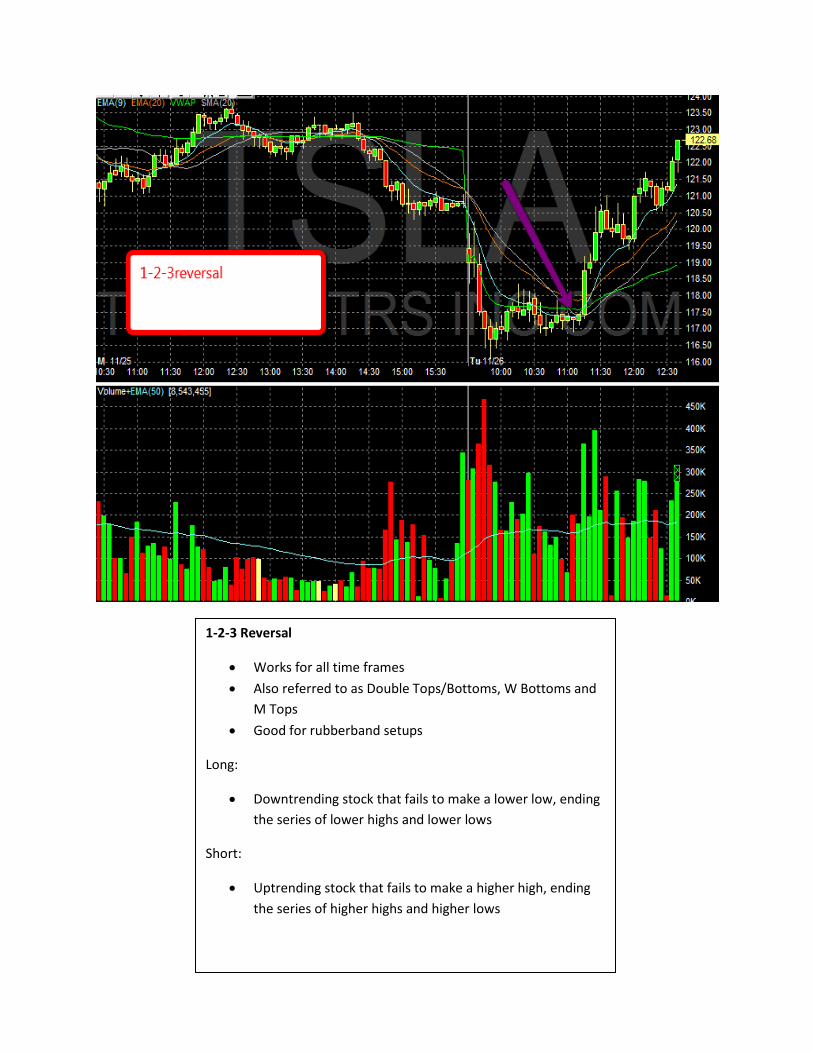
1-2-3 Reversal
Works for all time frames
Also referred to as Double Tops/Bottoms, W Bottoms and
M Tops
Good for rubberband setups
Long:
Downtrending stock that fails to make a lower low, ending
the series of lower highs and lower lows
Short:
Uptrending stock that fails to make a higher high, ending
the series of higher highs and higher lows