bottom-up assessment of chinese manufacturing growth and
TRANSCRIPT

1
Bottom-up Assessment of Chinese Manufacturing Growth and Energy Use up to 2020
Ali Hasanbeigi 1, Cecilia Fino-Chen, Hongyou Lu, Lynn Price
China Energy Group, Energy Analysis and Environmental Impacts Department
Environmental Energy Technologies Division, Lawrence Berkeley National Laboratory
Abstract
In 2009, China was responsible for nearly 20 percent of global energy use and 25 percent of
energy-related carbon dioxide (CO2) emissions. Unlike most countries, China’s energy
consumption pattern is unique because the industrial sector dominates the country’s total
energy consumption, accounting for about 70 percent of energy use and 72 percent of CO2
emissions in 2010. For this reason, the development path of China’s industrial sector will
greatly affect future energy demand and dynamics of not only China, but the entire world.
Number of analyses of historical trends is conducted, but careful projections of key factors
affecting China’s industry sector energy use over the next decade are scarce. This study
analyzes industrial energy use and economic structure of Chinese manufacturing sector in
detail. First, the study analyzes the energy use of and output from 18 industry sub-sectors.
Then, retrospective (1995-2010) and prospective (2010-2020) decomposition analyses are
conducted for industrial sectors in order to show how different factors (production growth,
structural change, and energy intensity change) have influenced industrial energy use trends in
China in the last 15 years and will do so over the next 10 years.
The historical analysis results show that top energy-consuming subsectors such as smelting
and pressing of ferrous metals, raw chemical materials and chemical products manufacturing,
and non-metallic mineral product manufacturing use more energy per value added, and,
although they have a large share of Chinese manufacturing final energy use while having
much lower share of total manufacturing value added in 2010. In contrast, the electric and
electronic equipment manufacturing, food, beverage and tobacco industry, and machinery
manufacturing accounted for more than 1/3 of manufacturing value added while just
consuming 8 percent of the total Chinese manufacturing final energy use in 2010.
The decomposition analysis shows that both energy intensity reduction and structural effect
helped to reduce energy use in Chinese manufacturing during 1995-2000 and 2005-2010.
However, during 2000-2005 the structural effect causing an increase in manufacturing energy
use primarily because the share of value added from top energy-intensive sector like smelting
and pressing of ferrous metals from total manufacturing value added increased during this
period. The forward looking (prospective) decomposition analysis for 2010-2020 shows that
the activity effect is largest under scenarios 1 because of higher value added AAGR assumed
for manufacturing subsectors under this scenario. Structural effect, however, is largest in
scenario 3 because of the share of value added of energy-intensive subsectors such as
smelting and pressing of ferrous metals and non-metallic mineral products sectors from total
manufacturing value added in 2015 and 2020 are lower in scenario 3 compared to other two
scenarios.
The results of this study allow policy makers to quantitatively compare the level of structural
change in the past and in the years to come and adjust their policies if needed to move
1 Corresponding author. Address: 1 Cyclotron Rd. MS 90R2002, Berkeley, CA 94720, USA.
Tel.: +1-510 495 2479, email address: [email protected]

2
towards the target of less energy-intensive industries. The scenario analysis shows the
structural change achieved trough different paths and helps to understand what are the
consequences of supporting or limiting the growth of certain manufacturing subsector from
the point of view of energy use and structural change. The results point out the industries that
had the largest influence in such structural change.
1. Introduction
In the last three decades, China has experienced unprecedented rapid economic growth, with
annual gross domestic product (GDP) growing at an average rate of 10 percent from 1980 to
2010 (NBS, 1981-2011). China became the world’s largest emitter of energy-related CO2 in
2007 and the world’s largest energy consumer in 2009 (IEA, 2011). In 2009, China was
responsible for nearly 20 percent of global energy use and 25 percent of energy-related CO2
emissions followed by the U.S. who is responsible for 18 percent of global energy use and 18
percent of global energy-related CO2 emissions in 2009 (IEA, 2011).
Unlike most countries, China’s energy consumption pattern is unique because the industrial
sector dominates the country’s total energy consumption, accounting for about 70 percent of
energy use and 72 percent of CO2 emissions2 in 2010 (NBS, 2011). For this reason, the
development path of China’s industrial sector will greatly affect future energy demand and
dynamics of not only China, but the entire world.
Numbers of analyses of historical industrial energy use trends in China are conducted (Wu
2012; Wang et al. 2010; Ma and Stern 2008; Liu et al. 2007), but comprehensive analysis
including all manufacturing subsectors and their role in historical energy use trends are
scarce. More importantly, in the context of this study, careful projections of key factors
affecting China’s manufacturing sector energy use over the next decade are also rare. This
study tried to address these shortcomings.
This study first analyzes the past energy trends and also make the projections for
manufacturing energy use and value added up to year 2020 for each manufacturing sub-
sector. Then, it uses decomposition analysis to quantify the effects of various factors in
shaping energy consumption trends in the past and in near future. Decomposition analysis has
been employed by several energy analysts since the early 1990s. By indexing certain drivers
to a base year value, this analysis approach shows how energy consumption would have
changed had all other factors been held constant. Decomposition analysis is used to
understand the drivers of energy use as well as to measure and monitor the performance of
energy-related policies. The unique feature of decomposition analysis is that it provides macro
results based on a myriad of detailed energy indicators. This gives policy makers quick access
to findings from technical data. Most OECD countries use decomposition analysis to
understand their energy use and assess the progress of their energy policies. Reviews of
decomposition analysis used at the national and international level include de la Rue du Can
et al. (2010) and Liu and Ang (2003).
2 Carbon dioxide emissions were estimated based on reported energy data multiplied by IPCC default emission
factors (NBS, 2011a; IPCC, 1996).

3
2. Methodology
Table 1 lists the manufacturing subsectors included in this study. We collected energy use and
value added data as well as other information on 18 subsectors of the manufacturing sector in
China.3
Table 1. List of Industry Subsectors Included in this Study No. Manufacturing subsector
1 Food, beverage and tobacco
2 Textile, Apparel, Chemical Fibers, Leather, Fur
3 Timber, Wood, Bamboo, etc.
4 Furniture
5 Paper and Paper Products
6 Printing and Publishing
7 Petroleum refining and Coking
8 Raw Chemical Materials and Chemical Products
9 Medicines
10 Rubber and Plastics
11 Non-metallic Mineral Products
12 Smelting and Pressing of Ferrous Metals
13 Smelting and Pressing of Non-ferrous Metals
14 Metal Products
15 Machinery
16 Transport Equipment
17 Electric and Electronic Equipment
18 Other industries
2.1. Forecasting Chinese manufacturing energy use and value added
The historical final energy use4 (1995 – 2010) and the value added (1995 – 2007) data for this
analysis were obtained from the China Energy Statistical Yearbook-various years (NBS,
1996-2011) and China Statistical Yearbook-various years (NBS, 1981-2011), respectively.
The value added data for manufacturing subsectors are not reported since 2007. Thus, value
for 2008-2010 for manufacturing subsectors are calculated using the assumed annual average
growth rate of value added for manufacturing subsectors reported for these three years in
different sources. The sum of value added of all manufacturing subsectors calculated in this
way for these three years are equal to the aggregate data reported in NBS (1981-2011). All
value added data are converted from current RMB to constant 2005 RMB and then used in the
analyses.
The forecasts of final energy use and value added of manufacturing subsectors in 2015 and
2020 are done as follows:
1. To forecast the final energy use, we need to have the forecast of value added as well
as energy intensity. From these two, we can calculate the forecast of final energy use
from equation 1.
Ei = EIi * VAi (1)
3 In Chinese statistics, the term “industry” refers to manufacturing as well as mining of coal and minerals, oil and
gas extraction, power generation, and production and distribution of water. These subsectors of industry (other
than manufacturing) are not included in the present study. 4 In final energy, electricity use is equal to electricity consumption at the end use.

4
Where:
Ei : final energy use of manufacturing subsector (i) [in PJ]
EIi : final energy intensity of manufacturing subsector (i) [in PJ/Million 2005 RMB]
VAi : value added of manufacturing subsector (i) [Million 2005 RMB]
Below we explain step-by-step how we forecast value added and energy intensity of
each manufacturing subsector in 2015 and 2020.
2. The year 2010 is used as the base year for the forecast. We have the final energy use
and value added data of each manufacturing subsector in 2010.
3. The forecast of the final energy use and value added is done for each manufacturing
subsector separately. This is one of the unique features of this study since other
similar studies usually made the forecast for the entire manufacturing in China and
not by subsector.
4. Because the forecast for average annual growth rate (AAGR) given for
manufacturing subsector value added varied in different sources and since the
forecast of value added significantly affect the results of the study, we developed
three scenarios with different assumptions on AAGR of value added for each
manufacturing. The three scenarios are:
a. Scenario 1: In this scenario the assumptions on value added AAGR were
mostly based on “key development targets for 22 industries during 12th
FYP”
published by the Chinese Ministry of Industry and Information Technology
(MIIT 2012a-n; MIIT 2011a-g) and the report by Industrial Economics
Research Department, Development Research Center of the State Council,
(IERD), Energy Research Institute of the National Development and Reform
Commission (ERI), Institute of Nuclear and New Energy Technology,
Tsinghua University (INNET) titled “2050 China Energy and CO2 Emissions
Report” (IERD/ ERI/ INNET 2009).
b. Scenario 2: In this scenario the assumptions on AAGR of value added were
mostly based on Oxford Economics’ China Industry Forecast (Oxford
Economics 2012).
c. Scenario 3: In this scenario the assumptions on AAGR of value added were
mostly based on experts’ judgment. The experts’ judgment was informed by
the national level GDP forecast data and the predicted share of total GDP of
industry sector from national GDP in 2015 and 2020 as well as by the data
from scenario 1 and scenario 2. In particular scenario 3 tends to take into
account the Chinese Government policy to shift the structure of industry from
heavy and energy-intensive industries to lighter and less energy-intensive
industries with higher value added and also the policy to “rebalance” the
economy, which is greater reliance on domestic demand, as opposed to new
fixed-asset investment and exports, to drive economic growth.
Table 2 shows the value added AAGR assumptions used under each of the aforementioned
scenarios in our analysis. It should be noted that under each scenario, there are two sets of
AAGR assumption, one for the period of 2011-2015 (12th
FYP) and the other for the period of
2016-2020 (13th
FYP). Table 2 also presents the energy intensity AAGR for each subsector.
Unlike value added assumption, only one set of assumption used for energy intensity AAGR
forecast.

5
Table 2. Value added AAGR assumptions used under each scenario and energy intensity
AAGR forecasts
No. Manufacturing subsector
Value added AAGR * Energy intensity
cumulative reduction
rate over 5-year ** Scenario 1 Scenario 2 Scenario 3
AAGR
in
2011-
2015
AAGR
in
2016-
2020
AAGR
in
2011-
2015
AAGR
in
2016-
2020
AAGR
in
2011-
2015
AAGR
in
2016-
2020
Cumulative
reduction
rate over
2011-2015
Cumulative
reduction
rate over
2016-2020
1 Food, beverage and tobacco 9.0% 7.0% 7.9% 6.1% 8.0% 7.0% 16.0% 14.0%
2 Textile, Apparel, Chemical Fibers,
Leather, Fur 7.0% 5.5% 5.3% 4.8% 6.0% 5.0% 18.0% 15.0%
3 Timber, Wood, Bamboo, etc. 9.0% 7.0% 11.5% 6.2% 9.0% 7.0% 16.0% 14.0%
4 Furniture 9.0% 6.6% 9.4% 7.0% 9.0% 7.0% 16.0% 13.0%
5 Paper and Paper Products 8.0% 6.7% 8.3% 6.9% 7.5% 7.0% 20.0% 16.0%
6 Printing and Publishing 8.0% 8.0% 6.6% 8.4% 7.0% 8.0% 16.0% 14.0%
7 Petroleum refining and Coking 7.5% 6.0% 7.5% 5.7% 7.0% 6.0% 20.0% 16.0%
8 Raw Chemical Materials and
Chemical Products 12.0% 9.0% 10.5% 9.7% 9.5% 8.5% 20.0% 16.0%
9 Medicines 15.0% 10.0% 13.8% 8.9% 12.0% 10.0% 21.0% 17.0%
10 Rubber and Plastics 7.0% 7.0% 6.5% 6.5% 6.5% 6.5% 16.0% 14.0%
11 Non-metallic Mineral Products 8.0% 6.0% 6.4% 6.8% 3.5% 3.0% 15.0% 13.0%
12 Smelting and Pressing of Ferrous
Metals 7.0% 5.7% 6.6% 5.4% 4.5% 4.0% 18.0% 15.0%
13 Smelting and Pressing of Non-
ferrous Metals 7.0% 6.0% 6.8% 6.2% 6.2% 5.5% 16.0% 14.0%
14 Metal Products 10.0% 7.4% 12.3% 8.7% 10.0% 7.8% 16.0% 14.0%
15 Machinery 10.0% 7.0% 12.1% 8.2% 10.0% 8.0% 16.0% 14.0%
16 Transport Equipment 9.5% 7.0% 9.2% 7.3% 9.0% 7.5% 16.0% 14.0%
17 Electric and Electronic Equipment 11.0% 9.0% 10.5% 8.5% 10.0% 8.5% 16.0% 14.0%
18 Other industries 8.0% 7.0% 8.1% 7.0% 8.0% 7.0% 16.0% 14.0%
* Value added AAGR for 2011-2015 are compared to 2010 value added and for 2016-2020 are compared to 2015 value
added (see equation 2 and 3 below).
* Energy intensity cumulative reduction rate over 2011-2015 are compared to 2010 energy intensity and over 2016-2020 are
compared to 2015 energy intensity (see equation 4 and 5 below).
*** 2011-2015 period is equal to 12th FYP and 2016-2020 period is 13th FYP in Chinese Government national policy
planning.
5. Having the value added AAGR during 2011-2015 (12th
FYP) compared to 2010
value added (Table 2) and the actual 2010 value added data for manufacturing
subsectors, we calculated the value added of each manufacturing in 2015 using
equation 2.
VAi (2015) = VAi (2010) * (1+AAGR2011-2015)5 (2)
Where:
VAi (2015) : value added of manufacturing subsector (i) in 2015
VAi (2010) : value added of manufacturing subsector (i) in 2010
AAGR2011-2015: average annual growth rate of manufacturing subsector (i) during 2011-2015
6. Having calculated the value added of manufacturing subsectors in 2015 from
equation 1 and the assumed value added AAGR during 2016-2020 (13th
FYP)
compared to 2015 value added (Table 2), we calculated the value added of each
manufacturing in 2020 using equation 3.
VAi (2020) = VAi (2015) * (1+AAGR2016-2020)5 (3)
6
Where:
VAi (2020) : value added of manufacturing subsector (i) in 2020
VAi (2015) : value added of manufacturing subsector (i) in 2015
AAGR2016-2020: average annual growth rate of manufacturing subsector (i) during 2016-2020
The value added for each manufacturing subsector was calculated under each
scenario separately using different AAGR assumption given in Table 2 for each
scenario. It should be noted that all value added data and their shares presented in
this study are in 2005 prices; thus, the shares of value added given for
manufacturing or each subsector might be slightly different from the shares
calculated using value added data in current prices.
7. The assumptions on final energy intensity reduction of manufacturing subsectors
were mostly based on forecast given in “key development targets for 22 industries
during 12th
FYP” published by the Chinese Ministry of Industry and Information
Technology (MIIT 2012a-n; MIIT 2011a-g). Some subsectors (e.g. smelting and
pressing of non-ferrous metals, manufacture of metal products, manufacture of
machinery, and manufacture of transport equipment) were not covered in (MIIT
2012a-n; MIIT 2011a-g). For these subsectors the overall Chinese industry
cumulative energy intensity reduction target during 12th
FYP set by the Chinese
government, which is 16 percent compared to 2010 level, is used. However, all given
reduction forecast are for cumulative percentage reduction in energy intensity for
each manufacturing sub-sectors during 2011-105 (12th
FYP). To forecast the energy
intensity of manufacturing sub-sectors in 2020, experts’ judgment is used for the
assumption on cumulative reduction energy intensity during 2016-2020. The final
energy intensity in 2015 and 2020 are calculated using equation 4 and 5, respectively.
EIi (2015) = EIi (2010) *(1-CR2011-2015) (4)
EIi (2020) = EIi (2015) *(1-CR2016-2020) (5)
Where:
EIi (2010): final energy intensity of manufacturing subsector (i) in 2010
EIi (2015): final energy intensity of manufacturing subsector (i) in 2015
EIi (2020): final energy intensity of manufacturing subsector (i) in 2020
CR2011-2015: cumulative reduction energy intensity of manufacturing (i) during 2011-2015 in
percentage (the sign is positive)
CR2016-2020: cumulative reduction energy intensity of manufacturing (i) during 2016-2020 in
percentage (the sign is positive)
8. Having the forecast of value added and final energy intensity calculated above for
each manufacturing subsector, we can calculate the final energy use of each
subsector in 2015 and 2020 using equation 1. Since we calculated value added for
three different scenarios, we will also have three scenarios for final energy use
forecast.
2.2. Decomposition analysis method
Decomposition analysis separates the effects of key components on energy end-use trends
over time. Three main components that are usually considered in decomposition analysis are:
1) aggregate activity, 2) sectoral structure, and 3) energy intensity. The IEA defines these
three components as (Unander et al., 2004):

7
1. Aggregate activity: Depending on the economic sector, this component is measured in
different ways. For manufacturing, it is often measured as value added of the sector.
2. Sectoral structure: This component represents the mix of activities within a sector and
further divides activity into subsectors.
3. Energy intensity: This component refers to energy use per unit of activity (i.e. value
added).
Different studies have used different mathematical techniques for decomposition analysis. Liu
and Ang (2003) explain eight different methods for decomposing the aggregate energy
intensity of industry into the impacts associated with aggregate activity, sectoral structure, and
energy intensity. They argue that the choice of method can be influenced by limitations such
as the data set (e.g., whether or not there are negative values) and the number of factors in the
decomposition.
For this study, the authors used additive Logarithmic Mean Divisia Index (LMDI)
decomposition analysis with non-changing analysis. Non-changing decomposition type is
used because for the future projection the changing analysis which requires annual data is less
relevant and the non-changing analysis with 5-year period is more appropriate since the
average annual growth rate (AAGR) forecast of value added for manufacturing sub-sectors
are given in 5-year terms. The energy intensity reduction forecasts are also cumulative over
the 5-year periods.
Ang (2005) provides practical guidelines for using the LMDI method. The formulas used in
the additive LMDI method for decomposing energy use into activity, structural, and energy
intensity effects are shown below (Ang, 2005):
ΔEtot = ET – E
0 = ΔEact + ΔEStr + ΔEint (6)
ΔEact = )ln(ln 00
0
Q
Q
EE
EE T
i iiT
iiT
(7)
ΔEStr = )ln(ln 00
0
i
iT
i iiT
iiT
S
S
EE
EE
(8)
ΔEint = )ln(ln 00
0
i
iT
i iiT
iiT
I
I
EE
EE
(9)
Where:
i: subsector
T: the last year of the period
T=0: the base year of the period
E: total energy consumption
ΔEtot: aggregate change in total energy consumption
The subscripts “act,” “str,” and “int” denote the effects associated with the overall activity
level, structure, and sectoral energy intensity, respectively.
Q = i
iQ : total activity level (10)
Si = i
i QQ / : activity share of sector I (11)
8
Ii = i
i
i QE / : energy intensity of sector I (12)
In decomposition analysis, energy intensity is often calculated based on economic output.
This is because, in decomposition analysis, the energy intensity and output of different
manufacturing subsectors are added together (see Equation 3-7); to make this addition
possible; the same unit must be used for the output of all subsectors. Moreover, data on
physical output can prove challenging to gather.
In this study we conduct a retrospective decomposition analysis using the historical data from
1995 to 2010. In addition, we conduct a prospective decomposition analysis using the forecast
data calculated based on the method explained above.
We have conducted the decomposition analysis for each of the three scenarios explained in
section 2.1., separately. This will show how different assumption on value added AAGR of
manufacturing subsector will affect the decomposition results.
3. Results and Discussion
In this section, we first present an analysis of historical as well as forecasted energy use and
value added of Chinese manufacturing subsectors. Then, retrospective and prospective
decomposition analysis results are presented.
3.1. Chinese manufacturing energy use and value added
3.1.1. Industry value-added trends
China is the world's second largest economy after the United States. In 2010, the
manufacturing vale added was equal to 10,935 billion 2005 RMB accounting for around 35
percent of China’s total gross domestic product (GDP) in that year (NBS, 1981-2011). The
total Chinese manufacturing value added (in 2005 RMB) increased by 383 percent over 1995-
2010. This is 2.8 times higher increase rate compared to the final energy use, which increased
by 137 percent over the same period. Smelting and pressing of non-ferrous metals has the
largest increase in value added during 1995-2010 with 808 percent increase, while petroleum
refining, coking, processing of nuclear fuel has the lowest increase in value added among all
other subsectors with only 183 percent during the same period. Overall, the value added of all
subsectors increase during this period.
Figure 1 shows that electric and electronic equipment manufacturing, food and beverage, and
textile industry have the largest contribution to the total manufacturing value added in that
period. Manufacturing of furniture, printing and publishing, and processing of timber,
manufacturing of wood, bamboo, etc. subsectors have the lowest share of total manufacturing
value added. There is no major shift between shares of value added amongst the subsectors.
However, even a minor few percentage change in the share of value added of high energy
intensive sectors (e.g. smelting and pressing of ferrous metals) or low energy-intensive sector
(e.g. electric and electronic equipment manufacturing) can have significant impact in
decomposition analysis, especially on the structural effect. This is discussed in more details in
section 3.2.

9
Note: All value added data and their shares presented in this study are in 2005 prices; thus, the shares of value
added given for manufacturing or each subsector might be slightly different from the shares calculated using
value added data in current prices.
Figure 1. Share of each manufacturing subsectors value added from the total value added of
the manufacturing in China during 1995-2010 (NBS, 1981-2011)
Table 3. Total manufacturing value added AAGR under each scenario and share of
manufacturing value added from China’s total GDP* Historical Scenario 1 Scenario 2 Scenario 3
2005-2010 2011-
2015
in 2016-
2020
2011-
2015
in 2016-
2020
2011-
2015
in 2016-
2020
Total manufacturing value added AAGR 12.8% 9.2% 7.3% 8.9% 7.3% 8.0% 7.0%
Share of manufacturing value added
from China’s total GDP* by end of the period (i.e. 2010, 2015, or 2020) **
34.8% 35.8% 36.3% 35.2% 35.7% 33.9% 33.9%
* China’s total GDP in 2015 and 2020 is calculated by having China’s total GDP in 2010 (in 2005 constant prices) and assuming the AAGR
for China’s total GDP of 8.6 percent during 2011-2015 compared to 2010 level and 7 percent during 2016-2020 compared to 2015 level. It
worth mentioning that AAGR for China’s total GDP during 2006-2010 was 11.2 percent compared to 2005 level. ** All value added data and their shares presented in this study are in 2005 prices; thus, the shares of value
added given for manufacturing or each subsector might be slightly different from the shares calculated using
value added data in current prices.
3.1.2. Final energy intensity trends
For past years (1995-2010), final energy use is divided by the value added (in 2005 constant
prices) of each subsector to determine the total final energy intensity for each subsector. For
future years (2015 and 2010), the energy intensity of manufacturing subsectors are calculated
using equation 4 and 5 in section 2.1. The results of energy intensity calculations are shown in
Figure 2 and Figure 3.
Figure 2 shows that during 1995-2010, “smelting and pressing of ferrous metals” has the
highest final energy intensity followed (in most years) by “nonmetallic minerals” and
“chemical industry”. In several years during this period (e.g. 2008-2010), “petroleum refining
and coking” industry overtook chemical industry and had higher energy intensity. The lowest
final energy intensity in 2010 is for “manufacturing of furniture” and the second-lowest was
14% 14% 12% 12% 12% 12% 12% 11% 12% 12%
13% 13%11% 9% 8% 8% 8% 7%
8% 8%
5% 4%
3%3% 2% 2% 3%
2%3% 2%
8% 7%
8%8% 9% 9% 8% 9%
8% 9%
2% 3%
3%3% 3% 4% 3% 3%
3% 4%
7% 6%
5%6% 5% 5% 5% 5%
5% 4%
9%7%
10%9% 8% 7% 8% 7%
7% 6%
2%3%
3%5% 4% 4% 4%
4%4%
4%
3%3% 3%
3%3% 3% 4%
4%4%
4%
9%
7% 8% 9% 10% 10% 11% 11% 10%11%
7%
7% 7% 8% 9% 8% 9% 9% 9% 9%
10%16% 16% 15% 16% 17% 16% 17% 16% 17%
0%
10%
20%
30%
40%
50%
60%
70%
80%
90%
100%
1995 2000 2005 2010 2015 2020 2015 2020 2015 2020
Scenario 1 Scenario 2 Scenario 3
Other industries
Electric and Electronic Equipment
Transport Equipment
Machinery
Metal Products
Smelting and Pressing of Non-ferrous Metals
Smelting and Pressing of Ferrous Metals
Non-metallic Mineral Products
Rubber and Plastics
Medicines
Raw Chemical Materials and Chemical Products
Petroleum refining and Coking
Printing and Publishing
Paper and Paper Products
Furniture
Timber, Wood, Bamboo, etc.
Textile, Apparel, Chemical Fibers, Leather, Fur
Food, beverage and tobacco

10
for “electric and electronic equipment manufacturing.” “Manufacturing of medicines” and
“manufacturing of furniture” showed the greatest drop in final energy intensity from 1995 to
2010, while “petroleum refining and coking” and “manufacturing of metal products” shows
the lowest drop of final energy intensity in the same period.
Figure 3 shows the final energy intensity of manufacturing subsectors in China during 2005-
2020. The 2015 and 2020 energy intensities are based on energy intensity reduction rates
given in Table 2. Since we assumed steady reduction rates for all manufacturing subsectors by
end of 12th
FYP (2015) and 13th
FYP (2020), we can see that the energy intensity of all
subsectors drops during these periods. The reduction rate during 13th
FYP (2016-2020) is less
than that in 12th
FYP (2011-2015). The reduction rates assumed for 12th
FYP are mostly based
on Chinese government energy intensity reduction targets for manufacturing subsector or for
industry as a whole. The reduction rates for 13th
FYP are based on experts’ judgments which
are informed by qualitative information on overall energy intensity reduction target expected
for Chinese industry during this period as well as previous targets set in 11th
and 12th
FYP.
Note: calculated based on data from NBS (1996-2011) and NBS (1981-2011)
Figure 2. Final energy intensity of different manufacturing subsectors in China during 1995-
2010
It can be seen that during 2010-2020, “smelting and pressing of ferrous metals”, “nonmetallic
minerals”, and “chemical industry” remain top three most energy intensive manufacturing
subsectors in China, while there energy intensity decline in this period.
The overall manufacturing energy intensity drops from 4.9 TJ/million 2005 RMB in 2010 to
3.9 TJ/million 2005 RMB in 2015 (a 20 percent drop compared to 2010 level) and further
declines to 3.2 TJ/million 2005 RMB in 2020 (a 17 percent drop compared to 2015 level).
The 20 percent reduction in manufacturing energy intensity in 12th
FYP is in line with
Chinese Government target for energy intensity reduction during this period. The Government
target is to reduce national energy intensity (energy use per GDP) by 16 percent during 12th
FYP. It is expected that industrial sector contribute the most to achieve this reduction target
because it accounts for around 70 percent of primary energy use in China and there are
Smelting and Pressing of Ferrous Metals
Non-metallic Mineral ProductsChemical industry
0
5
10
15
20
25
30
35
1995 1996 1997 1998 1999 2000 2001 2002 2003 2004 2005 2006 2007 2008 2009 2010
TJ/m
illio
n 2
00
5 R
MB
Smelting and Pressing of Ferrous Metals
Non-metallic Mineral Products
Petroleum refining and Coking
Chemical industry
Smelting and Pressing of Non-ferrous Metals
Paper and Paper Products
Metal Products
Rubber and Plastics
Textile, Apparel, Chemical Fibers, Leather, Fur
Other industries
Timber, Wood, Bamboo, etc.
Medicines
Machinery
Printing and Publishing
Food, beverage and tobacco
Transport Equipment
Electric and Electronic Equipment
Furniture

11
significant energy efficiency potential exist in industrial sector. Thus, the higher rate of
energy intensity reduction (20 percent reduction compared to national target of 16 percent
reduction) for overall manufacturing sector in China derived from our bottom-up, sub-sector
level calculations is acceptable.
Figure 3. Final energy intensity of different manufacturing subsectors in China in 2005-2020 (only data from 2005, 2010, 2015, and 2020 are used to plot this graph; thus, the fluctuations in actual energy
intensities between 2005 and 2010 are not shown here.)
3.1.3. Final energy use trends
Using the value added and final energy intensity presented above for each manufacturing
subsector, we calculated the final energy use of each subsector in 2015 and 2020 using
equation 1. Since we have three different scenarios for future value added of subsectors, we
will have three final energy uses calculated under each scenario for the manufacturing
subsectors. This is the reason why final energy use results are presented after finl energy
intensity results.
In 2010, the total final energy use of Chinese manufacturing was 53,491 petajoule (PJ) which
is a 36 percent increase from 2005 level (39,474 PJ) and a 137 percent increase compared to
the 1995 final energy use (22,551 PJ). The increase in final energy use during the period of
1995-2010 varied among the manufacturing subsectors. The largest percentage increase in
final energy use in 2010 compared to 1995 level was for electric and electronic equipment
manufacturing (388 percent) followed by smelting and pressing of non-ferrous metals (346
percent) and manufacture of metal products (265 percent). The lowest percentage increases in
final energy use in the same period were for manufacture of medicines (18 percent) followed
by food, beverage and tobacco (23 percent) and other industries (37 percent). Overall, the
final energy use of all manufacturing subsectors in China had an increasing trend during this
period.
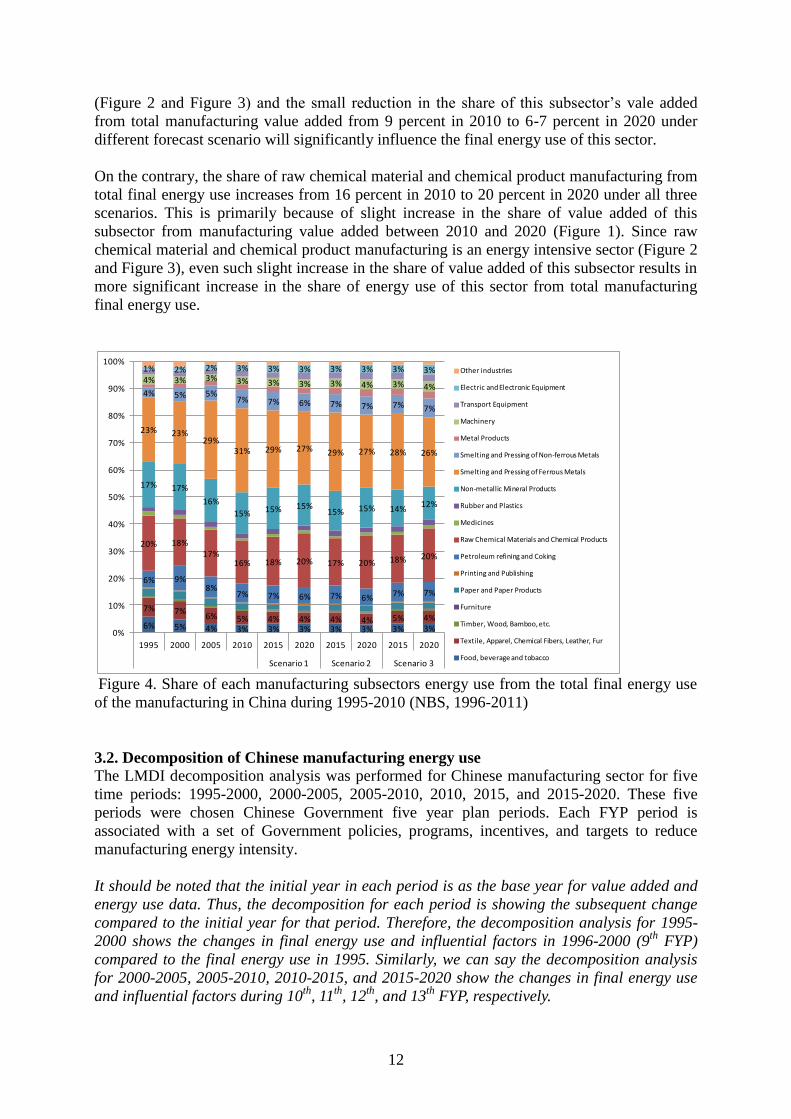
Figure 4 shows that under all three scenarios, the share of the smelting and pressing of ferrous
metals subsector from total final energy use of the manufacturing declines from 31 percent in
2010 to 27 percent in 2020 under scenario 1 and scenario 2 and to 26 percent under scenario
3. This is because smelting and pressing of ferrous metals is an energy intensive sector
Smelting and Pressing of Ferrous Metals
Non-metallic Mineral Products
Chemical industry
Smelting and Pressing of Non-ferrous Metals
Paper and Paper Products
0
5
10
15
20
25
2005 2010 2015 (end of 12th FYP) 2020 (end of 13th FYP)
TJ/m
illio
n 2
005
RM
B
Smelting and Pressing of Ferrous Metals
Non-metallic Mineral Products
Petroleum refining and Coking
Chemical industry
Smelting and Pressing of Non-ferrous Metals
Paper and Paper Products
Metal Products
Rubber and Plastics
Textile, Apparel, Chemical Fibers, Leather, Fur
Other industries
Timber, Wood, Bamboo, etc.
Medicines
Machinery
Printing and Publishing
Food, beverage and tobacco
Transport Equipment
Electric and Electronic Equipment
Furniture
12
(Figure 2 and Figure 3) and the small reduction in the share of this subsector’s vale added
from total manufacturing value added from 9 percent in 2010 to 6-7 percent in 2020 under
different forecast scenario will significantly influence the final energy use of this sector.
On the contrary, the share of raw chemical material and chemical product manufacturing from
total final energy use increases from 16 percent in 2010 to 20 percent in 2020 under all three
scenarios. This is primarily because of slight increase in the share of value added of this
subsector from manufacturing value added between 2010 and 2020 (Figure 1). Since raw
chemical material and chemical product manufacturing is an energy intensive sector (Figure 2
and Figure 3), even such slight increase in the share of value added of this subsector results in
more significant increase in the share of energy use of this sector from total manufacturing
final energy use.
Figure 4. Share of each manufacturing subsectors energy use from the total final energy use
of the manufacturing in China during 1995-2010 (NBS, 1996-2011)
3.2. Decomposition of Chinese manufacturing energy use
The LMDI decomposition analysis was performed for Chinese manufacturing sector for five
time periods: 1995-2000, 2000-2005, 2005-2010, 2010, 2015, and 2015-2020. These five
periods were chosen Chinese Government five year plan periods. Each FYP period is
associated with a set of Government policies, programs, incentives, and targets to reduce
manufacturing energy intensity.
It should be noted that the initial year in each period is as the base year for value added and
energy use data. Thus, the decomposition for each period is showing the subsequent change
compared to the initial year for that period. Therefore, the decomposition analysis for 1995-
2000 shows the changes in final energy use and influential factors in 1996-2000 (9th
FYP)
compared to the final energy use in 1995. Similarly, we can say the decomposition analysis
for 2000-2005, 2005-2010, 2010-2015, and 2015-2020 show the changes in final energy use
and influential factors during 10th
, 11th
, 12th
, and 13th
FYP, respectively.
6% 5% 4% 3% 3% 3% 3% 3% 3% 3%
7% 7%6% 5% 4% 4% 4% 4% 5% 4%
6% 9%8%
7% 7% 6% 7% 6% 7% 7%
20% 18%17%
16% 18% 20% 17% 20% 18% 20%
17% 17%
16%
15% 15% 15%15% 15% 14%
12%
23% 23%29%
31% 29% 27% 29% 27% 28% 26%
4% 5% 5%7% 7% 6% 7% 7% 7% 7%
4% 3% 3% 3% 3% 3% 3% 4% 3% 4%
1% 2% 2% 3% 3% 3% 3% 3% 3% 3%
0%
10%
20%
30%
40%
50%
60%
70%
80%
90%
100%
1995 2000 2005 2010 2015 2020 2015 2020 2015 2020
Scenario 1 Scenario 2 Scenario 3
Other industries
Electric and Electronic Equipment
Transport Equipment
Machinery
Metal Products
Smelting and Pressing of Non-ferrous Metals
Smelting and Pressing of Ferrous Metals
Non-metallic Mineral Products
Rubber and Plastics
Medicines
Raw Chemical Materials and Chemical Products
Petroleum refining and Coking
Printing and Publishing
Paper and Paper Products
Furniture
Timber, Wood, Bamboo, etc.
Textile, Apparel, Chemical Fibers, Leather, Fur
Food, beverage and tobacco
13
As mentioned in the methodology section, additive non-changing decomposition analysis was
used. Since we had three different scenarios for value added forecast data for 2015 and 2020
which subsequently results in three different final energy use forecast for manufacturing
subsectors for these two years, we have conducted the decomposition analysis for each
scenario separately. It should be noted that the results of decomposition analysis of historical
data (1995-2010) are the same across all scenarios and only the results of decomposition for
future years (2010-2015 and 2015-2020) varies across three scenarios because of different
assumptions used for subsectors value added growth rates (see Table 2).
Figure 5-7 shows the results of the additive non-changing decomposition analysis of total
final energy use for Chinese manufacturing for the time periods mentioned above under each
scenario, separately. As an example, we can see that during 11th
FYP (2005-2010), activity
effect increase the manufacturing energy use by 27,379PJ, which is the results of high output
(value added) from manufacturing. However, the structural effect slightly reduces the
manufacturing final energy use in this period by 1,081PJ. After the intensity effect which also
reduces the final energy use by 12,281PJ is taken into account, the total change in Chinese
manufacturing final energy use during 11th
FYP is equal to an increase of 14,017PJ.
Figure 5-7 shows that, under all three scenarios, except in the period of 2000-2005 (10th
FYP),
activity and intensity effects were the two dominant influences working against each other to
drive the energy use upward (activity effect) or downward (intensity effect). In the period of
2000-2005, intensity effect has a much smaller impact compared to other periods studied.
Also, 2000-2005 is the only period when structural effect is positive and driving the
manufacturing energy use upwards unlike all other periods where structural effect is negative
and helps to reduce manufacturing energy use even though its impact in rather small
compared to other effects. The primary reason why structural effect is positive in 2000-2005
(10th
FYP) is that the share of value added from smelting and pressing of ferrous metals from
total manufacturing value added increased from 7 percent in 2000 to 10 percent in 2005.
Since this sector has the highest energy intensity among all other sectors, such seemingly
small change in its share of value added from total manufacturing value added can
significantly impact the structural effect in decomposition analysis. Same issue is applicable
to raw chemical materials and chemical products manufacturing which is one of the top three
energy-intensive industries in China; hence, a slight increase in its share from total
manufacturing value added (from 7 percent in 2000 to 8 percent in 2005) can cause the
positive increase in structural effect. However, this might partly be compensated by the non-
metallic mineral products sector which is also a top energy-intensive sector, yet its share of
total manufacturing value added drops slightly from 6 percent in 2000 to 5 percent in 2005.

14
Figure 5. Scenario 1: Results of additive non-changing decomposition of final energy use of
Chinese manufacturing in the past and up to 2020
Figure 6. Scenario 2: Results of additive non-changing decomposition of final energy use of
Chinese manufacturing in the past and up to 2020
Figure 7. Scenario 3: Results of additive non-changing decomposition of final energy use of
Chinese manufacturing in the past and up to 2020
The intensity effect during 10th
FYP (2000-2005) is the smllest compare to other periods. This
is because of very small decline in overall manufacturing energy intensity during this period.
This was primrily because during this period, the energy intensity of some manufacturing
subsector, especially the top five energy-intensive manufacturing (except smelting and
pressing of ferrous metals) either remained relatively steady or even increased in some cases
(Figure 2). For example, the final energy use of non-metallic mineral product sector increased
(15,000)
(10,000)
(5,000)
-
5,000
10,000
15,000
20,000
25,000
30,000
Fin
al E
nerg
y U
se (
PJ
)Scenario 1 - Decomposition analysis results
Activity Effect
Structural Effect
Intensity Effect
Total change in energy use
(15,000)
(10,000)
(5,000)
-
5,000
10,000
15,000
20,000
25,000
30,000
Fin
al E
nerg
y U
se (
PJ
)
Scenario 2- Decomposition analysis results
Activity Effect
Structural Effect
Intensity Effect
Total change in energy use
(15,000)
(10,000)
(5,000)
-
5,000
10,000
15,000
20,000
25,000
30,000
Fin
al E
nerg
y U
se (
PJ
)
Scenario 3- Decomposition analysis results
Activity Effect
Structural Effect
Intensity Effect
Total change in energy use

15
by 55 percent during 2000-2005, while its value added only increased by 45 percent in the
same period. This resulted in increased final energy intensity for this sector in this period.
Among several reasons, such increase in energy intensity in several manufacturing subsector
was because of sudden boom in production capacity and construction of manufacturing plants
and rapid increase in production without enough attention to energy efficiency. Later in that
period (10th
FYP) and especially during 11th
FYP, in an attempt to control the energy intensity
of manufacturing, Chinese Government implemented series of policies and programs to
reduce the energy intensity of manufacturing sectors, especially the energy-intensive
industries. Programs like “Top-1000 Enterprises energy saving program” and “10 key energy
saving projects program” implemented during 11th
FYP substantially helped to control the
energy intensity of the manufacturing (Price et al. 2011).
For the 12th
FYP and 13th
FYP, the result of decomposition analyses have similar pattern
across scenarios but with different magnitude for various effects. The differences between
three scenarios and primary reasons for such differences can be summarized as:
In 12th
FYP and 13th
FYP, the activity effect is largest in scenario 1 and lowest in
scenario 3. This is directly because of higher value added AAGR assumed in scenario
1, which are mostly based on Chinese reported data, and lower value added AAGR
assumed in scenario 3, which are mostly based on experts’ judgment informed by
various sources of information and taking into account the China’s overall GDP
growth rate and the expected share of industry from overall China’s GDP in 2015 and
2020.
In 12th
FYP and 13th
FYP, contrary to the activity effect, structural effect is largest (in
negative value) in scenario 3. This is primarily because of the fact that the share of
value added of smelting and pressing of ferrous metals and non-metallic mineral
products sector, which are two top energy-intensive sectors, from total manufacturing
value added in 2015 and 2020 had a greater drop compared to 2010 shares in scenario
3 than the other two scenarios. In other words, the share of these two sectors from
total manufacturing value added in 2015 and 2020 are lower in scenario 3 compared
to scenario 1 and 2 (see Figure 1). This is the result of our assumptions on value
added AAGR for different subsectors (Table 2). In scenario 3, we assumed further
shift from energy-intensive industries to non-energy intensive industries by assuming
lower value added AAGR for energy-intensive sectors and higher value added AAGR
for less energy-intensive sectors. This is necessary if China wants to adjust the
structure of its manufacturing and move towards less energy-intensive and lower
polluting manufacturing.
In 12th
FYP and 13th
FYP, intensity effect is almost in the same range across all three
scenarios, with scenario 1 having slightly higher (in negative value) energy intensity
effect. This is mainly because of the fact that we assumed similar energy intensity
reduction rate during 12th
FYP and 13th
FYP for all three scenarios (Table 2). The
slight differences between intensity effects across scenarios come from the
differences in absolute energy use in manufacturing subsectors in 2015 and 2020
under each scenario which is the result of different value added AAGR assumptions.
As can be seen in equation 9, absolute energy use of manufacturing subsector plays a
role in the calculation on intensity effect in addition to energy intensity of subsectors.
Nonetheless, intensity effect has a strong effect in reducing final energy use during
12th
FYP and 13th
FYP. This is primarily because of aggressive policies by Chinese
government to reduce the energy use per value added of manufacturing sector. The
“Top-1000 Enterprises energy saving program” and “10 key energy saving projects
16
program” implemented during 11th
FYP are both extended to 12th
FYP with Top 1000
program expanding to “Top-10,000 Enterprises energy saving program”. These
programs along with other policies and incentives are significantly helping to reduce
the energy intensity of the manufacturing in China; hence we see strong intensity
effect in the decomposition analysis.
There are number of limitations and sources of uncertainties in this study and most other
studies that try to forecast the future value added for manufacturing subsectors as well as their
future energy intensities. Therefore, the result of such studies should be reviewed and
interpreted with caution having in mind the limitation and uncertainties.
4. Conclusions
In this study a bottom-up analysis of the energy use of Chinese manufacturing is performed
using the data at subsector level. Both retrospective and prospective analysis in conducted in
order to assess the impact of factors influenced the energy use of the manufacturing sector in
the past (1995-2010) and estimate their likely impact in the future (2010-2020).
The analysis results show that top energy-consuming subsectors such as smelting and pressing
of ferrous metals, raw chemical materials and chemical products manufacturing, and non-
metallic mineral product manufacturing use more energy per value added, and, although they
account for a large share of Chinese manufacturing final energy use (62 percent in 2010), they
together produced only 22 percent of total Chinese manufacturing value added in 2010. In
contrast, the electric and electronic equipment manufacturing, Food, beverage and tobacco
industry, and machinery manufacturing accounted for 36 percent of Chinese manufacturing
value added while just consuming 8 percent of the total Chinese manufacturing final energy
use in 2010.
The retrospective decomposition analysis described in this study shows that energy intensity
reduction was not the only reason for reduced energy use in Chinese manufacturing between
1995 and 2010. Structural effects played an important role in reducing energy demand
between 1995 and 2000 and also a minor role in 2005-2010. However, during 2000-2005 the
structural effect is positive and driving the manufacturing energy use upwards primarily
because of fact that the share of value added from top energy-intensive sector like smelting
and pressing of ferrous metals and raw chemical materials and chemical products
manufacturing from total manufacturing value added increased during this period.
The forward looking (prospective) decomposition analysis for 2010-2020 indicates that three
scenarios show almost a similar pattern for different effect with varying magnitude for each
effect across scenarios. The activity effect is largest under scenarios 1 because of higher value
added AAGR assumed for manufacturing subsectors under this scenario. Structural effect,
however, is largest in scenario 3 because of the share of value added of energy-intensive
subsectors such as smelting and pressing of ferrous metals and non-metallic mineral products
sectors from total manufacturing value added in 2015 and 2020 are lower in scenario 3
compared to other two scenarios.
The scenario analysis indicates that if Chinese Government plans to have structural change in
manufacturing sector by shifting from energy-intensive and polluting industry to less energy-
intensive industries, the value added AAGR up to 2015 and 2020 should be more in line with

17
scenario 3. The assumed value added AAGR for scenario 3 are rather realistic and are
informed by possible growth rate that is foreseen for each subsector; thus, they can be
achieved if proper Government regulation and target will be in place.
The results also show that the intensity effect always pushes the final energy use downward
during the study period. This could be because of various reasons including Government
aggressive policies and programs to reduce energy intensity, fiscal incentive given by the
Chinese Government for energy efficiency projects (e.g. 10 key energy saving projects
program), modernization of the industry and phasing out of the inefficient, backward
technologies, increased energy prices, etc. These reasons along with other influential factor
have continued pressuring industries to improve energy efficiency to comply with regulations
and to reduce costs. This is likely to continue up to 2020 and perhaps beyond.
Acknowledgments
This work was supported by the China Sustainable Energy Program of the Energy Foundation
through the U.S. Department of Energy under Contract No. DE-AC02-05CH11231. We would
like to thank Bob Taylor of Energy Pathways, Jing Ke of LBNL, Lingbo Kong from State Key
Laboratory of Pulp and Paper Engineering, South China University of Technology, and Yue
Dai from the University of Texas at Austin for their contribution to this study.
References
Ang, B.W., 2004. Decomposition analysis for policymaking in energy: which is the preferred
method? Energy Policy 32 (2004), pp. 1131–1139.
Ang B.W. and S.Y. Lee, Decomposition of industrial energy consumption: some
methodological and application issues. Energy Economics 16 (1994), pp. 83–92.
Asia Pacific Energy Research Centre (APERC), 2001.Energy Efficiency Indicators: a Study
of Energy Efficiency Indicators in APEC Economies. March 2001.
de la Rue du Can, S., J. Sathaye, L. Price, and M. McNeil. 2010. Energy Efficiency Indicators
Methodology Booklet. Berkeley, CA: Lawrence Berkeley National Laboratory. LBNL-
3702E. May.
Industrial Economics Research Department, Development Research Center of the State
Council, (IERD), Energy Research Institute of the National Development and Reform
Commission (ERI), Institute of Nuclear and New Energy Technology, Tsinghua
University (INNET). 2009. 2050 China Energy and CO2 Emissions Report (first print in
July 2009). Available at http://www.ebookcn.com/book/151059
International Energy Agency (IEA), 2011. CO2 Emissions from Fuel Combustion: Highlights.
Paris: IEA. http://www.iea.org/co2highlights/
International Energy Agency (IEA). 2004. Oil Crises & Climate Challenges- 30 Years of
Energy Use in IEA Countries. Available at
http://www.iea.org/publications/free_new_Desc.asp?PUBS_ID=1260.
Liu, F.L.; Ang, B.W. 2003. Eight methods for decomposing the aggregate energy-intensity of
industry. Applied Energy 76 (2003) 15–23.
Liu, L.C., Y. Fan, G. Wu, Y.M. Wei, 2007. Using LMDI method to analyze the change of
China’s industrial CO2 emissions from final fuel use: An empirical analysis. Energy
Policy 35 (2007) 5892–5900

18
Ma, C. and D. I. Stern. 2008. China's changing energy intensity trend: A decomposition
analysis. Energy Economics 30 (2008) 1037–1053
Ministry of Industry and Information Technology (MIIT), China. 2012a. “12th Five-Year-Plan
for Electronic Information Industry.” Available at
http://www.miit.gov.cn/n11293472/n11293832/n11293907/n11368223/14473442.html
MIIT. 2012b. “12th Five-Year-Plan for Fertilizer Industry .” Available at
http://www.hfgj.gov.cn/n7216006/n18905487/n18909846/n18913375/n22966521.files/n
22966578.pdf
MIIT. 2012c. “12th Five-Year-Plan for Fiber Chemical Industry.” Available at
http://www.miit.gov.cn/n11293472/n11293877/n13434815/n13434832/n14445026.files/
n14439752.pdf
MIIT. 2012d. “12th Five-Year-Plan for Food Industry.”Available at
http://www.miit.gov.cn/n11293472/n11293877/n13434815/n13434832/14444911.html
MIIT. 2012e. “2011-2020 Development Plan for Food Processing Industry.”State
Administration of Grain of the People’s Republic of China. Available at
http://download.chinagate.cn/ch/pdf/liangshi.pdf
MIIT. 2012f. “12th Five-Year-Plan for IC Industry.” Available at
http://www.miit.gov.cn/n11293472/n11293877/n13434815/n13434832/14473887.html
MIIT. 2012g. “12th Five-Year-Plan for Light Industry.” Available at
http://www.miit.gov.cn/n11293472/n11293877/n13434815/n13434832/14444957.html
MIIT. 2012h. “12th Five-Year-Plan for Meat Industry.” Available at
http://www.miit.gov.cn/n11293472/n11293877/n13434815/n13434832/14475528.html
MIIT. 2012i. “12th Five-Year-Plan for Olefin Industry.” Available at
http://www.miit.gov.cn/n11293472/n11293877/n13434815/n13434832/n14473959.files/
n14450226.pdf
MIIT. 2012j. “12th Five-Year-Plan for Petro-Chemical & Chemical Industry.” Available at
http://www.miit.gov.cn/n11293472/n11293877/n13434815/n13434832/n14473959.files/
n14450225.pdf
MIIT. 2012k. “12th Five-Year-Plan for Pharmaceutical Industry.” Available at
http://www.miit.gov.cn/n11293472/n11293877/n13434815/n13434832/14445003.html
MIIT. 2012l. “12th Five-Year-Plan for Potato Processing Industry.” Available at
http://www.miit.gov.cn/n11293472/n11293877/n13434815/n13434832/n14444888.files/
n14439775.pdf
MIIT. 2012m. “12th Five-Year-Plan for Sugar Industry.” Available at
http://www.miit.gov.cn/n11293472/n11293877/n13434815/n13434832/n14445072.files/
n14439675.pdf
MIIT. 2012n. “12th Five-Year-Plan for Textile Industry.” Available at
http://www.miit.gov.cn/n11293472/n11293877/n13434815/n13434832/n14444980.files/
n14439654.pdf
MIIT. 2011a. “Appendix 3: the 12th Five-Year-Plan for Architectural & Sanitary Ceramics
Industry, of 12th FYP for Building Materials Industry. Available at
http://www.miit.gov.cn/n11293472/n11293832/n11293907/n11368223/n14335483.files/
n14335391.pdf

19
MIIT. 2011b. “12th Five-Year-Plan for Building Materials Industry.” Available at
http://www.miit.gov.cn/n11293472/n11293832/n11293907/n11368223/n14335483.files/
n14335391.pdf
MIIT. 2011c. “Appendix 1: the 12th Five-Year-Plan for Cement Industry, of 12the FYP for
Building Materials Industry.” Available at
http://www.miit.gov.cn/n11293472/n11293832/n11293907/n11368223/n14335483.files/
n14335391.pdf
MIIT. 2011d. “Appendix 2: the 12th Five-Year-Plan for Flat Glass Industry, of 12the FYP for
Building Materials Industry.”Available at
http://www.miit.gov.cn/n11293472/n11293832/n11293907/n11368223/n14335483.files/
n14335391.pdf
MIIT. 2011e. “12th Five-Year-Plan for Iron & Steel Industry.”Available at
http://www.sxgxt.gov.cn/0/1/8/46/8871.htm
MIIT. 2011f. “Appendix 4: the 12th Five-Year-Plan for New Building Material Industry, of
12th FYP for Building Materials Industry.”Available at
http://www.miit.gov.cn/n11293472/n11293832/n11293907/n11368223/n14335483.files/
n14335391.pdf
MIIT. 2011g. “Appendix 5: the 12th Five-Year-Plan for Non-Metallic Minerals Industry, of
12th FYP for Building Materials Industry.” Available at
http://www.miit.gov.cn/n11293472/n11293832/n11293907/n11368223/n14335483.files/
n14335391.pdf
National Bureau of Statistics (NBS), 1981-2011. China Statistical Yearbook. China Statistics
Press. Beijing, China.
National Bureau of Statistics (NBS), 1996-2011. China Energy Statistical Yearbook-various
years. China Statistics Press. Beijing, China.
National Bureau of Statistics (NBS), 2011. China Energy Statistical Yearbook 2011. China
Statistics Press. Beijing, China.
Oxford Economics, 2012. China: Industry Forecast. Available at
www.oxfordeconomics.com/Samples/chiniis.pdf
Patterson M. G., 1993. An accounting framework for decomposing the energy-to-GDP ratio
into its structural components of change, Energy, Volume 18, Issue 7, July 1993, Pages
741-761.
Phylipsen, G. J. M., K. Blok and E. Worrell. 1998. Handbook on International Comparisons
of Energy Efficiency in the Manufacturing Industry. Utrecht: Department of Science,
Technology and Society, Utrecht University.
Price, L., M. D. Levine, N. Zhou, D. Fridley, N. Aden, H. Lu, M. McNeil, N. Zheng, Y. Qin, P.
Yowargana. 2011. Assessment of China’s Energy-Saving and Emission-Reduction
Accomplishments and Opportunities During the 11th
Five Year Plan. Energy Policy,
Volume 39, Issue 4, April 2011, Pages 2165-2178
Schipper, L. 1997. Indicators of energy use and human activity: Linking energy use and
human activity. Paris: International Energy Agency.
Schipper L., F. Unander, S. Murtishaw, and M. Ting. 2001. “Indicators of energy use and
carbon emissions: explaining the energy economy link.” Annual Review of Energy &
the Environment 26: 49-81.
20
Schipper, L.; Meyers, S.; Howarth, R.B.; Steiner, R. 1992. Energy Efficiency and Human
Activities: Past Trends, Future Prospects. Cambridge University Press, Cambridge, UK.
Wenchao W., H. Mu, X. Kang, R. Song, Y. Ning. 2010. Changes in industrial electricity
consumption in china. Energy Policy 38 (2010) 3684–3690
Worrell, Ernst, Lynn Price, Nathan Martin, Jacco Farla and Roberto Schaeffer. 1997.Energy
intensity in the iron and steel industry: a comparison of physical and economic
indicators. Energy Policy, 25(7-9): 727-744.
Wu. Y. 2012. Energy intensity and its determinants in China’s regional economies. Energy
Policy 41 (2012) 703–711