boston universitycidarlab.org/wp-content/uploads/2013/11/ghamariiwbds2011.pdf · boston university...
TRANSCRIPT

'
&
$
%
APPLYING HARDWARE DESCRIPTION
LANGUAGES TO GENETIC CIRCUIT DESIGN
ROZA GHAMARI
Thesis submitted in partial fulfillment
of the requirements for the degree of
Master of Science
BOSTON
UNIVERSITY


BOSTON UNIVERSITY
COLLEGE OF ENGINEERING
Thesis
APPLYING HARDWARE DESCRIPTION LANGUAGES
TO GENETIC CIRCUIT DESIGN
by
ROZA GHAMARI
B.S., Razi University, 2008
Submitted in partial fulfillment of the
requirements for the degree of
Master of Science
2011

Approved by
First Reader
Douglas M. Densmore, PhDAssistant Professor of Electrical and Computer Engineering
Second Reader
Ayse Coskun, PhDAssistant Professor of Electrical and Computer Engineering
Third Reader
James J. Collins, PhDUniversity ProfessorProfessor of Biomedical Engineering
The wise learn from the experience of others, and the creative know how tomake a crumb of experience go a long way.Eric Hoffer
Acknowledgments
Writing a Masters Thesis, like any major research, is collaboration, and I am grateful
to many people for helping me throughout this ordeal.
Foremost, I would like to express my sincere gratitude to my advisor Professor Dou-
glas Densmore. For his continues support of my research, for his immense knowledge,
patience, and humor. His passion and interest in the area was contagious and motivated
me to excel and explore the subject area even further. He has taught me how to be
a better researcher, and how to apply my knowledge in other disciplines for Synthetic
Biology. It has been an honor to have him as my advisor.
I would also like to thank my fellow lab mates at CIDAR. Dr. Swapnil Bhatia would
often take time from his busy schedule to teach me new concepts and ways of looking
at the problem. The assistance of Dr. Traci Haddock and Anna Tassinari was also
instrumental for implementing the circuits and running the experiments in the biological
laboratory. Both of those individuals went above and beyond what they were supposed
to do, and I feel blessed to have worked with such a supportive group of researchers.
Professor Christopher Voigt, Dr. Brynne Stanton, and Alec Nielson from MIT were
always available to help and brought in new perspectives in the collaborative nature of
this work.
I would also like to thanks Dr. Todd Peterson and Dr. Kevin Clancy at Life Tech-
nologies for their support of this project.
Last but not the least, I would like to thank my parents, and my younger brother.
Nothing in my life would be possible without their love and strong support.
iv

APPLYING HARDWARE DESCRIPTION LANGUAGES
TO GENETIC CIRCUIT DESIGN
ROZA GHAMARI
ABSTRACT
Synthetic biology has recently gained attention for its focus on forward engineering
new biological systems. In particular, many researchers have investigated how to as-
semble genetic regulatory networks; these networks are a collection of elements enabling
DNA transcription (promoters) and translation (genes). If one views transcriptional sig-
nals and translational products as either present (1) or absent (0) then analogies can be
made between certain genetic regulatory networks and digital electronic logic circuits.
Consequently, by applying existing approaches in electronic circuit design to genetic
circuits, the complexity, reliability, and robustness of genetic regulatory networks will
greatly increase.
In this work, we propose a methodology and a software framework for applying
various electronic digital circuit design methodologies to genetic regulatory networks.
The study of electronic circuit design has matured in many areas; hence, the algorithms
and approaches utilized for silicon based circuits are highly optimized and understood.
We focus on Verilog, a commonly used hardware description language (HDL) for the
design of complex electronic systems. Although Verilog supports implementing different
types of designs such as analog, mix-mode and digital sequential circuits, we chose digital
combinational circuits which form the basis of the other types of circuits. Furthermore,
by supporting combinational genetic circuits in Verilog, other researches can elaborate
on our approach to design other circuits types and families.
The main contribution of this thesis is a software tool named Cello (Cell Logic). By
implementing “Compilation”, “Mapping” and “Assignment” stages in Cello, we provide
v

a complete design flow for genetic regulatory networks from specification to final DNA
sequence. Moreover, for each stage in Cello’s synthesis process an optimization algo-
rithm is implemented. In general, the goal of the optimization algorithms is to decrease
the complexity of design and increase the reliability of the final genetic regulatory net-
work. We demonstrate the feasibility of the proposed algorithms and methods as well
as beginning the process of experimentally validating the results.
vi
Contents
1 Introduction 1
2 Background 5
2.1 A brief history . . . . . . . . . . . . . . . . . . . . . . . . . . . . . . . . . 5
2.2 Clotho data model . . . . . . . . . . . . . . . . . . . . . . . . . . . . . . 9
2.3 High level languages for synthetic biology . . . . . . . . . . . . . . . . . . 11
2.4 Compilation and synthesis tools for synthetic biology . . . . . . . . . . . 12
3 Overview 14
4 Design Process 18
4.1 Compilation . . . . . . . . . . . . . . . . . . . . . . . . . . . . . . . . . . 19
4.1.1 Compilation and DAG generation . . . . . . . . . . . . . . . . . . 20
4.1.2 Technology Transformation . . . . . . . . . . . . . . . . . . . . . 21
4.1.3 Gate Level Optimization . . . . . . . . . . . . . . . . . . . . . . . 23
4.2 Mapping . . . . . . . . . . . . . . . . . . . . . . . . . . . . . . . . . . . . 26
4.2.1 Genetic motif selection . . . . . . . . . . . . . . . . . . . . . . . . 27
4.2.2 Technology mapping . . . . . . . . . . . . . . . . . . . . . . . . . 28
4.2.3 Motif level optimization . . . . . . . . . . . . . . . . . . . . . . . 32
4.3 Assignment . . . . . . . . . . . . . . . . . . . . . . . . . . . . . . . . . . 33
4.3.1 Constraints determination . . . . . . . . . . . . . . . . . . . . . . 35
4.3.2 Selection of Orthogonal features . . . . . . . . . . . . . . . . . . . 35
4.3.3 Feature assignment . . . . . . . . . . . . . . . . . . . . . . . . . . 39
vii
4.3.4 Part level optimization . . . . . . . . . . . . . . . . . . . . . . . . 43
4.3.5 Packaging of output . . . . . . . . . . . . . . . . . . . . . . . . . 45
4.4 Post-synthesis assembly preparation . . . . . . . . . . . . . . . . . . . . . 46
5 Experimental Result 47
5.1 Biological Experiments . . . . . . . . . . . . . . . . . . . . . . . . . . . . 47
5.2 Computational Analysis . . . . . . . . . . . . . . . . . . . . . . . . . . . 49
6 Conclusion 56
6.1 Future work . . . . . . . . . . . . . . . . . . . . . . . . . . . . . . . . . . 57
A Cello compatible Verilog 59
References 60
Curriculum Vitae 64
viii
List of Figures
1·1 High level design flow . . . . . . . . . . . . . . . . . . . . . . . . . . . . . 4
2·1 Stages of the central dogma . . . . . . . . . . . . . . . . . . . . . . . . . 7
2·2 Examples of genetic regulatory networks . . . . . . . . . . . . . . . . . . 8
2·3 Partial view of the Clotho data model . . . . . . . . . . . . . . . . . . . . 10
3·1 Stages of genetic circuits synthesis process flow . . . . . . . . . . . . . . . 17
4·1 The ccVerilog code for running example of Chapter 4 . . . . . . . . . . . 19
4·2 The inefficiency of the Verilog AST. . . . . . . . . . . . . . . . . . . . . . 20
4·3 DAG data structure pseudo code . . . . . . . . . . . . . . . . . . . . . . 21
4·4 Generated DAG from AST . . . . . . . . . . . . . . . . . . . . . . . . . . 22
4·5 The equivalent NOT/NOR based subgraphs for OR and AND boolean
operations . . . . . . . . . . . . . . . . . . . . . . . . . . . . . . . . . . . 23
4·6 DAGs generated during Compilation stage . . . . . . . . . . . . . . . . . 25
4·7 Different schematics of a NOR motif . . . . . . . . . . . . . . . . . . . . 27
4·8 Motifs of Inverter and three input NOR motifs . . . . . . . . . . . . . . . 29
4·9 The boolean equivalent for three input NOR . . . . . . . . . . . . . . . . 30
4·10 The motif level DAG’s generated after mapping . . . . . . . . . . . . . . 31
4·11 Example of motif level DAG before and after optimization . . . . . . . . 34
4·12 Outputs of the Assignment stage on two different mappings. . . . . . . . 42
4·13 Part level optimization on the assignment of primitives . . . . . . . . . . 44
5·1 The running example for biological experiments . . . . . . . . . . . . . . 48
ix

5·2 Assembly plan for test GRN. . . . . . . . . . . . . . . . . . . . . . . . . . 50
5·3 Computational analysis examples . . . . . . . . . . . . . . . . . . . . . . 51
x

List of Abbreviations
AGRN . . . . . . Abstract Genetic Regulatory NetworkAST . . . . . . Abstract Syntax TreeBDA . . . . . . Biological Design AutomationCAD . . . . . . Computer-Aided DesignccVerilog . . . . . . Cello Compatible VerilogDAG . . . . . . Directed Acyclic GraphDAsG . . . . . . Directed Acyclic subGraphEDA . . . . . . Electronic Design AutomationGRN . . . . . . Genetic Regulatory NetworkHDL . . . . . . Hardware Description LanguageHLL . . . . . . High Level LanguageINV . . . . . . InverterNOR2 . . . . . . Two input NORNOR3 . . . . . . Three input NORTF . . . . . . Transcription Factor
xi

1
Chapter 1
Introduction
In the recent years, synthetic biology has gained the attention of many researchers in
various disciplines. The goals of this field are to design and construct novel biological
systems. Often, this requires creating new biological parts, devices and circuits based
on specific applications. The main four category of the applications of this field are:
biotherapeutics, bioremediation, bio materials and bio sensing. Reuse of constructs is
another target in the scope of synthetic biology (Baker et al., 2006). Ideas such as
abstraction, standardization and modularity are key elements of synthetic biology.
Synthetic biology truly is the intersection of three different fields, Biology, Chemistry
and Engineering, where researchers engineer devices considering the chemical reactions
of biological elements (Endy, 2005).
In system biology, scientists study the complex interactions among biological systems
and are often concerned about modeling existing systems accurately. On the other
hand, synthetic biology focuses much more on forward engineering of complex artificial
living systems to investigate natural biological phenomena and implement a variety of
applications.
In the field of synthetic biology, systems can be designed for various applications.
For instance in bio-therapeutic applications, researchers modify Escherichia coli (E.
coli) bacteria’s DNA for enabling it to seek out and destroy cancerous tumors (An-
derson et al., 2006). Another example of the synthetic biology’s application is drug
synthesis, such as the antimalarial drug precursor engineered in yeast (Ro et al., 2006).
2
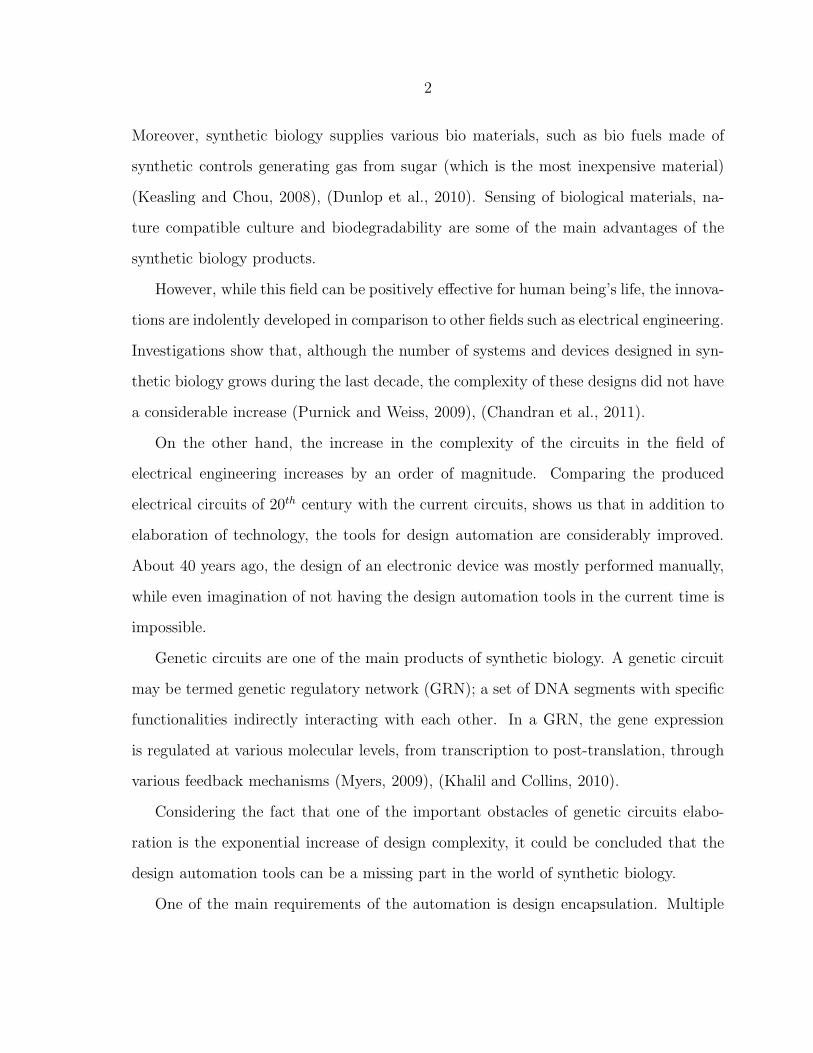
Moreover, synthetic biology supplies various bio materials, such as bio fuels made of
synthetic controls generating gas from sugar (which is the most inexpensive material)
(Keasling and Chou, 2008), (Dunlop et al., 2010). Sensing of biological materials, na-
ture compatible culture and biodegradability are some of the main advantages of the
synthetic biology products.
However, while this field can be positively effective for human being’s life, the innova-
tions are indolently developed in comparison to other fields such as electrical engineering.
Investigations show that, although the number of systems and devices designed in syn-
thetic biology grows during the last decade, the complexity of these designs did not have
a considerable increase (Purnick and Weiss, 2009), (Chandran et al., 2011).
On the other hand, the increase in the complexity of the circuits in the field of
electrical engineering increases by an order of magnitude. Comparing the produced
electrical circuits of 20th century with the current circuits, shows us that in addition to
elaboration of technology, the tools for design automation are considerably improved.
About 40 years ago, the design of an electronic device was mostly performed manually,
while even imagination of not having the design automation tools in the current time is
impossible.
Genetic circuits are one of the main products of synthetic biology. A genetic circuit
may be termed genetic regulatory network (GRN); a set of DNA segments with specific
functionalities indirectly interacting with each other. In a GRN, the gene expression
is regulated at various molecular levels, from transcription to post-translation, through
various feedback mechanisms (Myers, 2009), (Khalil and Collins, 2010).
Considering the fact that one of the important obstacles of genetic circuits elabo-
ration is the exponential increase of design complexity, it could be concluded that the
design automation tools can be a missing part in the world of synthetic biology.
One of the main requirements of the automation is design encapsulation. Multiple

3
researches have been performed and categorized the abstraction levels into DNA, parts,
devices and systems (Baker et al., 2006). Some bio-design automation tools have been
considering these categorization in their data models (Marchisio and Stelling, 2009) and
(Bilitchenko et al., 2011).
In addition to data models, tools for describing circuits and interpreting their models
are also required. Similar to electronic circuits, a genetic circuit can be modeled in a
schematic level, in which the pre-developed components are connected to each other
using a graphical user interface. The schematic level description also provides the de-
signer with designing hierarchical systems. Two examples of schematic based design
environments are TinkerCell by (Chandran et al., 2009) , (Chandran et al., 2010) and
Spectacle which is a part of Clotho tool suite by (Xia et al., 2011), (Densmore et al.,
2009). However, the ability to design complex systems using schematics is limited, since
the modeling is completely structural and includes high human interaction.
Hardware Description Languages (HDL) are utilized for electronic circuit design for
about five decades (Mermet, 1993). The main goal of these languages is to provide the
user with the ability to describe and model a circuit in an abstract level. High number
of automation tools are developed for interpreting these HDL’s and synthesizing the
actual circuit considering the design constraints. Verilog is one the well-reputed HDL’s
among Electronic Engineers (Thomas and Moorby, 1995).
In this thesis, a methodology is proposed to synthesize genetic circuits described in
Verilog. The functional description of the GRN is modeled using Verilog HDL and the
synthesis tool automates the design of GRN’s. A high level illustration of the design
flow is shown in Figure 1·1. The goal of this work is to automate a design flow in which a
desired system is described in a high level language. This description represents a set of
interconnections among logic operators, being later transformed to an abstract genetic
regulatory network (AGRN). The resultant AGRN is converted to a DNA sequence

4
Figure 1·1: High level illustration of the design flow. An idea is describedusing a high level languages which constructs the structure of a circuit.An abstract genetic regulatory network (AGRN) is generated from thestructure. Next, the AGRN is assigned to the parts stored in an accessibledatabase and the actual sequence is generated. The final stage is assemblyof sequences on biological lab and system experiment.
based on an accessible library of available synthetic genetic parts. Finally, the physical
system is implemented and experimented in the biological laboratory.

5
Chapter 2
Background
2.1 A brief history
The Central Dogma of molecular biology is the process of protein production from de-
oxyribonucleic acid (DNA): DNA replication, transcription and translation. The central
dogma illustrates that once a protein is produced it does not return to the DNA en-
coding it. In the first stage of this process, DNA replicates itself. Transcription is the
second stage of the process during which mRNA (messenger ribonucleic acid) is created
from DNA by RNA polymerase. The last stage is the translation of RNA to protein.
In this stage the ribosome binds to RNA and translates the code of triple nucleotides
(codons) to amino acids according to the genetic code. Figure 2·1 shows the stages of
the central dogma and their inputs and outputs.
DNA is the long term storage molecule of biological information for the construction
and function of living organisms. DNA is a sequence of four basic chemical compounds
which are called bases: Adenine (A), Thymine (T), Guanine (G) and Cytosine (C).
The structure of DNA is a double helix. Due to the hydrogen bonds created between
bases, base A pairs with T with two hydrogen bonds between them and base G pairs
with C with three hydrogen bonds between them. This results in a stable double helix
of DNA where the bases in one strand are bound to their complements in the other
strand. Since DNA is made of double stranded pairing between the four bases, the
length measurement unit for DNA is “base pair” (bp).
6
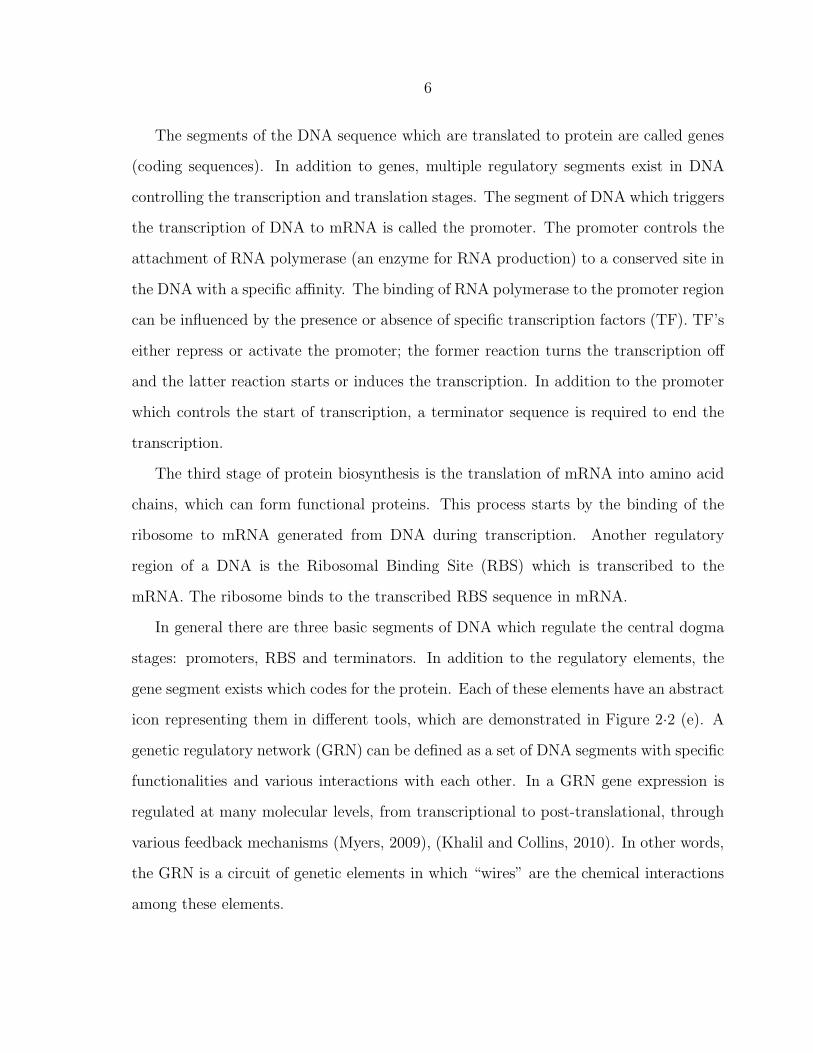
The segments of the DNA sequence which are translated to protein are called genes
(coding sequences). In addition to genes, multiple regulatory segments exist in DNA
controlling the transcription and translation stages. The segment of DNA which triggers
the transcription of DNA to mRNA is called the promoter. The promoter controls the
attachment of RNA polymerase (an enzyme for RNA production) to a conserved site in
the DNA with a specific affinity. The binding of RNA polymerase to the promoter region
can be influenced by the presence or absence of specific transcription factors (TF). TF’s
either repress or activate the promoter; the former reaction turns the transcription off
and the latter reaction starts or induces the transcription. In addition to the promoter
which controls the start of transcription, a terminator sequence is required to end the
transcription.
The third stage of protein biosynthesis is the translation of mRNA into amino acid
chains, which can form functional proteins. This process starts by the binding of the
ribosome to mRNA generated from DNA during transcription. Another regulatory
region of a DNA is the Ribosomal Binding Site (RBS) which is transcribed to the
mRNA. The ribosome binds to the transcribed RBS sequence in mRNA.
In general there are three basic segments of DNA which regulate the central dogma
stages: promoters, RBS and terminators. In addition to the regulatory elements, the
gene segment exists which codes for the protein. Each of these elements have an abstract
icon representing them in different tools, which are demonstrated in Figure 2·2 (e). A
genetic regulatory network (GRN) can be defined as a set of DNA segments with specific
functionalities and various interactions with each other. In a GRN gene expression is
regulated at many molecular levels, from transcriptional to post-translational, through
various feedback mechanisms (Myers, 2009), (Khalil and Collins, 2010). In other words,
the GRN is a circuit of genetic elements in which “wires” are the chemical interactions
among these elements.

7
Figure 2·1: The central dogma describes the stages of protein biosynthe-sis. DNA is replicated and make copies of itself in the first stage. DNAis transcribed to RNA by RNA polymerase. Translation is the final stageduring which the codons of RNA are translated to protein amino acids.
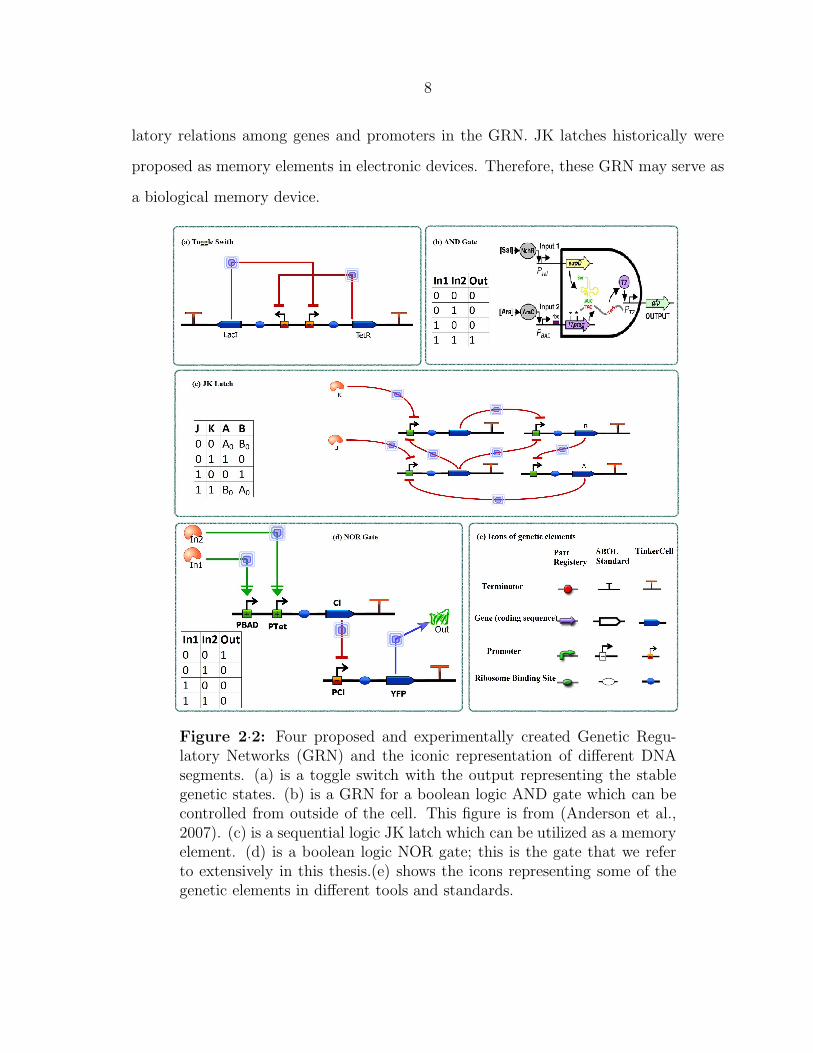
Various genetic circuits have been proposed and experimented during the recent
decade. Figure 2·2 illustrates some examples of proposed genetic circuits. The Collins
Lab proposed a genetic toggle switch (Gardner et al., 2000) in which the cell’s output is
changed between stable genetic states (Figure 2·2 (a)).This switch is constructed from
two subcircuits made of a promoter regulating a gene. Moreover, the genes inside two
subcircuits regulate the promoters on the other set.
The GRN (b) in Figure 2·2 shows the boolean logic AND gate proposed by Chris
Anderson (Anderson et al., 2007). The output of this gate fluoresces green if both
inputs are present. This GRN has both transcription level regulations controlling the
input promoters, and the translation level regulation of two internal genes’ RNA’s.
There are also sequential logic based genetic circuits investigated by synthetic bi-
ologists such as the JK latch proposed by Alfonso Jaramillo (Rodrigo and Jaramillo,
2007). This circuit, in Figure 2·2 (c), has more complex structure with multiple regu-
8
latory relations among genes and promoters in the GRN. JK latches historically were
proposed as memory elements in electronic devices. Therefore, these GRN may serve as
a biological memory device.
Figure 2·2: Four proposed and experimentally created Genetic Regu-latory Networks (GRN) and the iconic representation of different DNAsegments. (a) is a toggle switch with the output representing the stablegenetic states. (b) is a GRN for a boolean logic AND gate which can becontrolled from outside of the cell. This figure is from (Anderson et al.,2007). (c) is a sequential logic JK latch which can be utilized as a memoryelement. (d) is a boolean logic NOR gate; this is the gate that we referto extensively in this thesis.(e) shows the icons representing some of thegenetic elements in different tools and standards.

9
Figure 2·2 (d) shows the boolean logic NOR gate proposed by Voigt Lab (Tamsir
et al., 2011). This gate is extensively referred in this work. The presence of In1 and
In2 small molecules (or transcription factors), which are respectively Arabinose and
Tetracycline for the illustrated implementation, controls the regulation of the CI gene.
Hence, if any of the two inputs are present the CI production will be turned on. The
TF of CI represses the CI promoter (pCI) in the second part of the circuit. As a result,
by translation of CI’s RNA, the pCI will be repressed which consequently turns off the
yellow florescent protein’s (YFP) production. As a result, we will see yellow fluorescent
only if both inputs are absent.
An abstract genetic regulatory network (AGRN) is a GRN with no specific sequence
assigned to the genetic elements. We extensively use two specific terms in this thesis:
genetic motifs and genetic primitives. The definition of a genetic motif is a set of
genetic primitives which present the topology of a genetic gate at an abstract level.
In other words, a genetic motif is an AGRN of a single genetic gate such as a NOR
motif. Consequently, a genetic primitive is an abstraction of a specific genetic element
without having any assigned DNA sequence. For instance a “repressible promoter” is a
genetic primitive which represents a promoter repressible by, small molecules, such as
Tetracycline, or transcription factors (TF), such as LacI.
2.2 Clotho data model
The designed software framework for our synthesis flow is implemented as a Clotho App.
Clotho (Xia et al., 2011) is a software suite designed for engineering synthetic biology
systems and managing the data related to them. Clotho offers a data model captur-
ing the demands of synthetic biology data. Furthermore, the connection to different
databases in different locations is provided by this data model. Many different objects
are defined in this model among which “parts” and “features” are extensively employed

10
in this work.
Parts are objects assigned with specific DNA sequences and assembly protocol for-
mats. It is possible to make composite parts by packaging more than one part together.
Features, similarly, have sequences assigned to them. However, they do not have any
specific format; hence, they are not compatible with any assembly protocols. Features
are meant to capture biological functionality. Clotho provides its users with the abil-
ity to create and modify features and parts, and store them in different databases.
The Clotho features are organized in families. Families represent the functionality of a
feature which allows for relationships between promoters and genes to be established.
Figure 2·3 shows an abstract view of the Clotho data model discussed in this section.
Figure 2·3: Partial abstract view of the Clotho data model. The datamodel provides the user with different objects. Two of these objects are“parts” and “features” demonstrated in this figure. Features have familieswhich categorize them based on their genetic functionalities. The otherspecification of Clotho is connectivity to different databases among variousresearch centers or institutions.

11
2.3 High level languages for synthetic biology
High level languages (HLL) provide mechanisms for designers to model or describe a
structure that is often able to be interpreted by computers. HLL’s are often designed to
be human readable and to conceal low level details from the user. Various HLL’s have
been developed for many of the science and engineering disciplines (for instance C++,
Java and Perl among others).
Similarly, in synthetic biology, some research has been devoted to investigating HLL’s
for genetic circuit design. Proto is a spatial computing language for deign and imple-
mentation of biological systems (Beal et al., 2011). In another work (Bilitchenko et al.,
2011) a HLL, named Eugene, is introduced for specification of synthetic biological de-
signs. In this language, the user has the ability to define very expressive hierarchical
primitives and constraints and build a system based on these. Pedersen and Phillips
proposed GEC language (Genetic Engineering of living Cells) which renders the logi-
cal expressions to the interactions of proteins and genes (Pedersen and Phillips, 2009).
GEC’s interpreter, similarly to Eugene, generates the DNA sequence for the resultant
composite part.
However, all of these researchers propose new languages (Purnick and Weiss, 2009),
(MacDonald et al., 2011). In this work, we utilized an existing language developed for
electronic circuit design. We proposed using a hardware description language (HDL)
called Verilog (Thomas and Moorby, 1995) for describing synthetic biological systems.
Using Verilog has several potential advantages:
• It provides a very mature, expressive language with a large user base, tremendous
library support, and synthesis tools from higher level languages.
• Algorithms and techniques for logic synthesis of electronic circuits can now be
re-cast more easily to apply to genetic circuits.

12
• It connects electrical engineers to the field of synthetic biology providing increased
collaborative opportunities.
One of the main goals of this thesis is to determine whether using an existing language
with wide user base such as Verilog will be possible and beneficial for designing genetic
circuits or not.
2.4 Compilation and synthesis tools for synthetic biology
In the design automation process, the HLL’s facilitate describing designs and modeling
them at an abstract level. In addition to the HLL’s, automation requires a compiler
to interpret the input description and transform it to a processable format. Moreover,
extraction of an implementable system requires a synthesizer parsing the compiled de-
scription and generating the output based on a set of defined constraints.
Tools developed for automation of synthetic biological systems also proposed various
compilers and synthesizers. For example, BioCompiler creates a gene network based on a
set of regulatory motifs (Beal et al., 2011). Similar to the synthesis method investigated
in this thesis, some optimization algorithms are also provided for the compiler. The
main difference between BioCompiler and Cello is that the generated mapped GRN in
the former is based on the spatial data flow representation and in the latter is based on
the interconnection of functional logic gates.
GenoCAD is another tool for designing synthetic DNA sequences (Czar et al., 2009).
In this work, the results produce systems considering a set of motif based “production
rules”. Similar to Cello, GenoCAD has its own data model and provides the users with
access to shared and protected part libraries. There are two main differences between
GenoCAD and Cello. First, GenoCAd does not support any HLL for designing circuits.
Moreover, GenoCAD performs based on the rules and does not include any optimization
techniques.
13
In this thesis, the synthesis flow is derived from synthesis methodologies in electronic
engineering. The key component in electronic circuit synthesis is called “technology
mapping” in which a technology independent logic network is transformed into gates
available in the standard cell library of the target hardware platform. The technology
mapping methods are mostly based on algorithms for mapping directed acyclic graphs
(DAG) (Stok and Tiwari, 2002), (Keutzer, 1987). The steps of technology mapping are
decomposition to primitive cells, pattern matching of the library elements to nodes in
the generated DAG, and finally covering of the DAG based on the most optimal matches.
In our proposed synthesis process, the technology mapping stage transforms the
nodes in the DAG to their functional or structural matches in the available biological
motifs library. As a result, each biological motif includes a directed acyclic subgraph
(DAsG) which represents its functionality and structure at the gate level. The algorithm
for mapping is optimized for finding a mapped DAG with the minimum number of nodes.

14
Chapter 3
Overview
In this thesis, we propose a process flow and a software framework for designing genetic
regulatory networks using hardware design methodologies. The input of our process
flow (as well as the software toll) is a circuit description in Verilog language. The
final output is a DNA sequence which if implemented will demonstrate the described
behaviors. The main flow of our synthesis approach can be categorized into three basic
stages. The process of synthesis inside our software tool, Cello, starts from compiling
the input description of the circuit. We called this first stage “Compilation”. Next,
in the “Mapping” stage, we replace the basic boolean operators, which are utilized
in the input circuit description, with equivalent motifs of genetic gates. In the final
stage, “Assignment”, Cello assigns actual sequences to the motifs and generates the
final sequence.
Figure 3·1 shows a high-level view of each process stage. Each colored box in the
figure demonstrates one stage of process with the resulted output of that stage.
1. Compilation
The input for the Compilation stage is a compatible Verilog file (ccVerilog). Cello
currently supports a limited subset of available features in Verilog. The Directed
Acyclic Graph (DAG) data structure is utilized for representing compiled input
description. At this stage, Cello transforms the compiled description to a single
gate based DAG. Furthermore, a gate level optimization is performed on gate-level
15
DAG. More detailed information about the compiler and the algorithms is given
in chapter 4 section 4.1.
2. Mapping In the Mapping stage, operational vertices of the DAG are replaced by
elements from a library of biological logic gates. This stage is conceptually analo-
gous to technology mapping in electronic circuit design (Keutzer, 1987) , (Lehman
et al., 1995), in which operations are mapped to their equivalent transistor based
gates. Often in electronic circuits the logic decompositions are converted to NAND
based single gate circuits since this structure is favorable in silicon. However, in
synthetic biology, there are feaw basic gates and no consensus of optimality. More-
over, different types of gates can be used in a genetic circuits, some of which can
function based on transcription elements (e.g. promoters) (Frezza et al., 2007),
(Tamsir et al., 2011), (Yokobayashi et al., 2002) while others are based on transla-
tional elements (e.g. ribosome) (Rinaudo et al., 2007), (Stojanovic and Stefanovic,
2003), (Anderson et al., 2007). Hence, having a library of basic parts enables users
to implement circuits according to their needs and constraints. At the end of this
stage, a motif level graph of the genetic circuit is created which consists of genetic
primitives such as promoters, coding sequences and ribosomal binding sites. In
chapter 4 section 4.2 the details of this stage is pointed.
3. Assignment In the final stage, real sequences are assigned to the primitives inside
the motif-level DAG. user selects a set of transcription factors that can be consid-
ered in the circuit and assigns each input and output port a transcription factor
(this can be extended to wires which are not currently available in Cello). This
selection will effect assignments to the other primitives. An orthogonal set of parts
regarding to circuit primitives are fetched from a connected database. Therefore,
cross-talks among parts inside the circuit are removed. At the end a sequence of

16
DNA which is in fact a set of composite parts is generated by Cello. The genetic
network represented in final sequence is consistent with the initial input model of
the circuit. We discuss this stage in particular in chapter 4 section 4.3.
All of these three stages include optimization algorithms for improving output circuit.
For a more complete design flow, two additional level of optimization are also required.
Although this project does not address these additional optimizations, they have been
investigated by other research groups. The first level of optimization can be applied on
the Verilog description code to make design more effective based on different targets.
In electrical engineering field many researchers have been investigated approaches to
translate the behavioral Verilog description to structural description. For instance,
Cadence RTL Compiler (Systems, 2011) provides a global solution for synthesizing an
optimized net-list for the input description. The trade off among different optimization
goals are also considered in such tools. However, as a future work a synthesizer tool
could be designed considering the requirements of the genetic circuits design. Moreover,
in order to be physically implementable, the output DAN sequence needs to be processed
and checked for assembly requirements.

17
Figure 3·1: Three stages of genetic circuits synthesis process flow. Theinput circuit model is compiled into a gate level DAG in the first stage.Next, compatible motifs are assigned to each operational vertex in theDAG and the Mapping stage creates a motif level DAG. Finally in theAssignment stage, the actual DNA sequence constructing the genetic reg-ulatory network is generated.

18
Chapter 4
Design Process
This chapter discusses the methodologies and algorithms used to process the Cello com-
patible verilog (ccVerilog) input description and create the final DNA sequence repre-
sented by a set of composite parts. We propose the following design flow:
1. Compilation (input: ccVerilog; output: gate level DAG)
(a) Compilation and DAG generation (section 4.1.1 )
(b) Technology transformation (section 4.1.2)
(c) Gate level optimization (section 4.1.3)
2. Mapping (input: gate level DAG; output: motif level DAG)
(a) Genetic motif selection (section 4.2.1)
(b) Technology mapping (section 4.2.2)
(c) Motif level optimization (section 4.2.3)
3. Assignment (input: motif level DAG; output: DNA sequence)
(a) Constraint determination (section 4.3.1)
(b) Orthogonal feature selection (section 4.3.2)
(c) Feature assignment (section 4.3.3)
(d) Part level optimization (section 4.3.4)

19
(e) Output packaging (section 4.3.5)
The details of each of these stages are discussed in their associated subsections.
In order to have a more cohesive discussion we use a running example based on the
ccVerilog code shown in Figure 4·1 . The examples and figures of all of the sections in
this chapter refer to this example.
It should be mentioned that in order to automate the implementation process some
post-synthesis processes are required. These external processes prepare the resultant
composite parts for liquid handling robot assembly. Information about the post-synthesis
stages conludes this chapter in section 4.4.
Figure 4·1: The ccVerilog code for the running example of Chapter 4.This is a single output (O) circuit, which creates a combinational logicexpression using the input A, B and C. This module only includes a singlecontinuous assignment statement.
4.1 Compilation
In this first stage the input ccVerilog file is read and compiled. A directed acyclic
graph (DAG) representing the compiled code is prepared for the Mapping stage after
transformation and optimization.
20
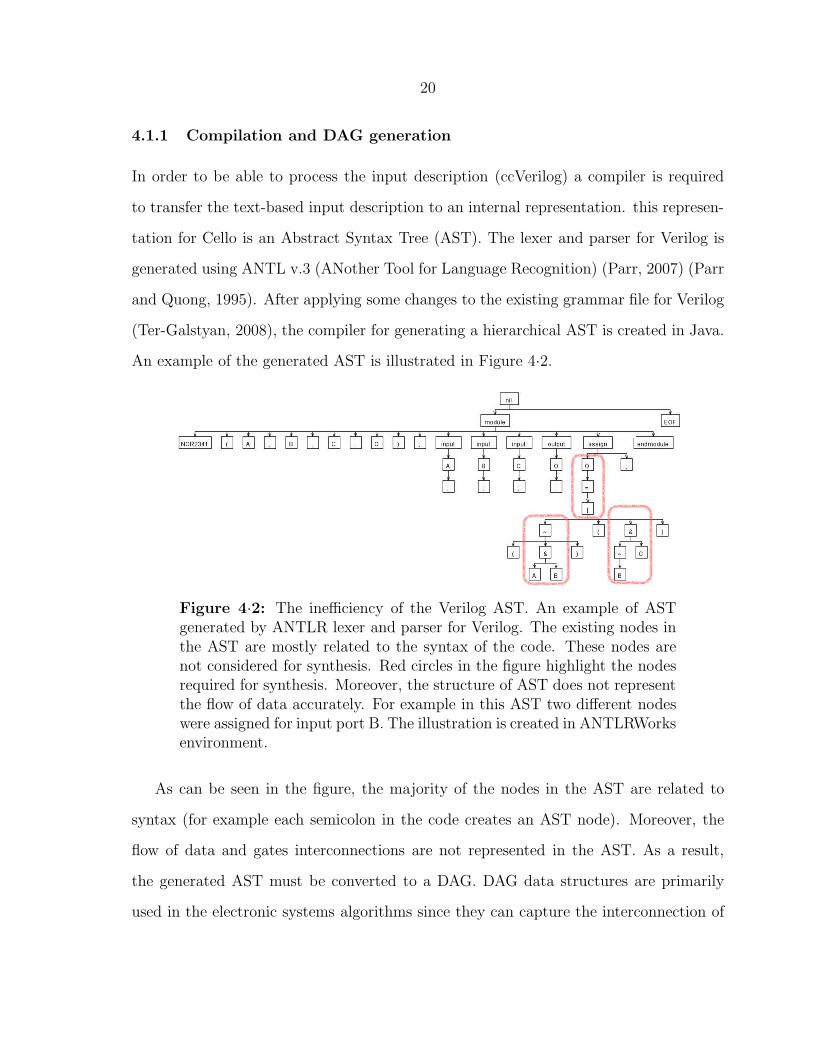
4.1.1 Compilation and DAG generation
In order to be able to process the input description (ccVerilog) a compiler is required
to transfer the text-based input description to an internal representation. this represen-
tation for Cello is an Abstract Syntax Tree (AST). The lexer and parser for Verilog is
generated using ANTL v.3 (ANother Tool for Language Recognition) (Parr, 2007) (Parr
and Quong, 1995). After applying some changes to the existing grammar file for Verilog
(Ter-Galstyan, 2008), the compiler for generating a hierarchical AST is created in Java.
An example of the generated AST is illustrated in Figure 4·2.
Figure 4·2: The inefficiency of the Verilog AST. An example of ASTgenerated by ANTLR lexer and parser for Verilog. The existing nodes inthe AST are mostly related to the syntax of the code. These nodes arenot considered for synthesis. Red circles in the figure highlight the nodesrequired for synthesis. Moreover, the structure of AST does not representthe flow of data accurately. For example in this AST two different nodeswere assigned for input port B. The illustration is created in ANTLRWorksenvironment.
As can be seen in the figure, the majority of the nodes in the AST are related to
syntax (for example each semicolon in the code creates an AST node). Moreover, the
flow of data and gates interconnections are not represented in the AST. As a result,
the generated AST must be converted to a DAG. DAG data structures are primarily
used in the electronic systems algorithms since they can capture the interconnection of

21
components, and also the direction of the information (current) flow (Keutzer, 1987),
(Lehman et al., 1995). Moreover, DAG ’s are inherently acyclic for output and input
connections, which is ideal for combinational circuits.
c l a s s Vertex {i n t index ;Edge outgo ing ;
}
c l a s s Edge {i n t index ;Vertex from ;Vertex to ;Edge next ;
}
Figure 4·3: The pseudo code for the DAG data structure utilized inCello. Since edges are linked to each other, the output degree of eachnode is unlimited.
The pseudo code of the DAG data structure that we used in this work is presented
in Figure 4·3. This data structure provides us with the ability to have an unrestricted
output degree for each node by having a linked list based implementation of edges.
Considering this data structure, a DAG is simply a list of pointers to vertices and edges.
An illustration of the generated DAG for the given AST is shown in Figure 4·4. The
generated DAG, in other words the “netlist” of the input circuit description, shows
the connectivity of the design. See Appendix A for a discussion on the restrictions on
standard Verilog for Cello.
4.1.2 Technology Transformation
The main goal of the Compilation stage is to prepare the input circuit description to be
implemented using the genetic motifs. This concept is similar to technology mapping
in electrical circuit design. In integrated circuit (IC) design all of the logic operators

22
Figure 4·4: DAG for the AST example shown in Figure 4·2. The requiredinformation for the next stages in the synthesis process is now embeddedin the DAG representation. The flow of data is from output node (O inthis case) towards inputs (A, B and C in this case) in order to have acanonical structure. The generated DAG is considered the “netlist” ofthe input circuit description.
used in the input description are transformed to a single gate type. Since every boolean
logic function can be expressed using either NAND or NOR operators, the whole circuit
description is transformed to either a NAND-based circuit or a NOR-based circuit. In
this work our base genetic motif is based on the NOR gate proposed by (Tamsir et al.,
2011) and described in the background section 2. we substitute all of the logic operations
in the DAG to their equivalent by NOT and NOR operations.
The algorithm in this work finds all of the non-NOR operation vertices in the graph
and substitutes that node with the equivalent subgraph. The equivalent subgraphs for
AND and OR operators are illustrated in Figure 4·5.

23
Figure 4·5: The equivalent NOT/NOR based subgraphs for OR andAND boolean operations. The OR and AND operation nodes in the DAGare replaced by their equivalent DAsG. As a result, the transformed DAGwill be solely based on NOR and NOT gate types.
4.1.3 Gate Level Optimization
The applied transformation approach does not guarantee to produce the optimal result
(i.e. minimum number of boolean algebraic terms). In other words, the number of
boolean terms after transformation may have increased. As a result, we add another
level of optimization termed “gate level optimization”. One of the main side effects
of transformation to NOR/INV based boolean network is double negation. This work
implements an optimization algorithm which finds all of the tandem inverters in the
graph and removes them.
In order to provide the user with flexibility, an option is provided to remove double
inverters if the transformed circuit is OR/INV based or NOR/INV based. In the former
case, all of the double negations will be removed from the circuit, while in the latter case
we need to keep the format of NOR (which has an INV in front of OR) and remove double
inverters that are NOT part of the NOR gate. Based on the experimental results shown
in the supplementary materials of (Tamsir et al., 2011) the implementations that have
outputs affected by repressible promoters have higher thresholds between high and low
outputs. Consequently, using a NOR/INV based network may increase the reliability of

24
the circuit.
Other logic minimization techniques can be applied at this level. Quine and Mc-
Cluskey logic minimization algorithm (Katz, 1993) is one of the most popular approaches
and can be automated; however, it has high time and memory complexity and limits
on the number of variables. A heuristic based approach such as Espresso (Rudell and
Sangiovanni-Vincentelli, 1987) can be used at this level. However, this method is de-
signed for Programmable Logic Array (PLA) based circuits and generates two-level
optimized expression. A multi level optimized expression can be extracted from the
optimized two-level output of Espresso by factorization. However, it again requires
transformation to NOR based network which results in a non-optimal circuit.
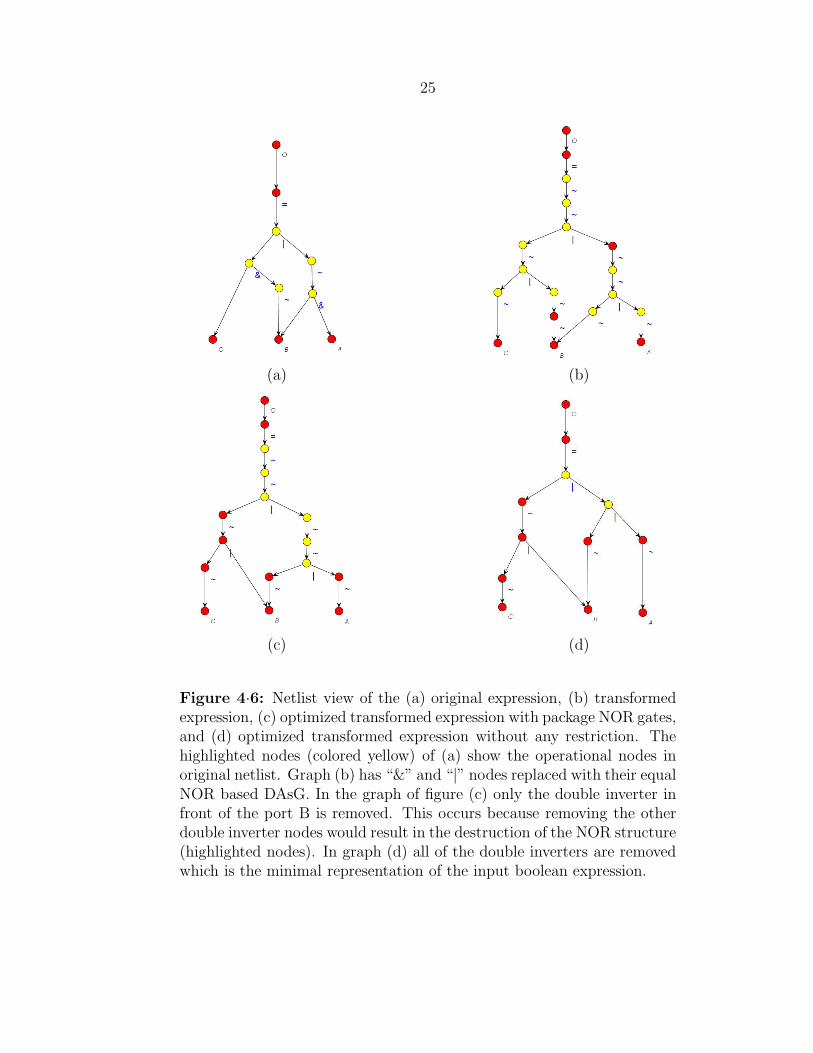
An abstract view of the netlist graph for the running example is shown in Figure
4·6. Graph (a) shows the original netlist which is generated after compiling the Verilog
code and creating the DAG. By running the transformation algorithm graph (b) is
generated. The substituted equivalent DAsG’s for “&” and “|” nodes are shown in Figure
4·5. Graph (c) shows the result of moving of double negations from the transformed
graph considering the NOR/INV basic gates. Finally, a complete removal of all tandem
inverters generates graph (d) which is actually an OR/INV based circuit.
25
(a) (b)
(c) (d)
Figure 4·6: Netlist view of the (a) original expression, (b) transformedexpression, (c) optimized transformed expression with package NOR gates,and (d) optimized transformed expression without any restriction. Thehighlighted nodes (colored yellow) of (a) show the operational nodes inoriginal netlist. Graph (b) has “&” and “|” nodes replaced with their equalNOR based DAsG. In the graph of figure (c) only the double inverter infront of the port B is removed. This occurs because removing the otherdouble inverter nodes would result in the destruction of the NOR structure(highlighted nodes). In graph (d) all of the double inverters are removedwhich is the minimal representation of the input boolean expression.

26
4.2 Mapping
After compiling the input model and preparing it by transforming to single gate type
netlist, the Mapping stage begins. In this stage, an operation analogous to technology
mapping in electrical circuit design is applied to the input netlist based on a library of
available genetic motifs. The definition of a genetic motif is a set of genetic primitives
which present the topology of a genetic gate at an abstract level. Consequently, a genetic
primitive is an abstraction of a specific genetic part without having any assigned DNA
sequence. For instance a Repressible Promoter is a genetic primitive which represents
a promoter repressible by small molecules, such as Tetracycline, or transcription factors
(TF), such as LacI.
The motif for the biological NOR gate is based on the proposed NOR gate in (Tamsir
et al., 2011). This motif is shown in Figure 4·7. In part (a) of this figure this motif
diagram is drawn using a CAD tool for synthetic biology named TinkerCell (Chandran
et al., 2009). In Cello since inputs and outputs of a motif can be connected to other
motifs or I/O ports (TF’s), we need to represent the topology of the motif as well as
the primitives. As a result, each motif has a directed acyclic subgraph (DAsG) related
to it which abstracts the interconnection of the constructing primitives. Furthermore,
using the DAG data structure the restriction of not having cross-talk within the gate
can be enforced. Cross talk may be defined as the undesirable effect of elements inside
a construct on each other. The DAG of NOR motif is demonstrated in Figure 4·7(b).
Please notice that the direction of the edges in the DAG is from output to inputs (in
order to have a canonical representation).
Details regarding the internal methods of the Mapping stage are discussed in the
following sub sections.

27
(a) (b)
Figure 4·7: Two views of a NOR motif (a) is created using the TinkerCelltool and (b) is the view of the NOR DAsG in Cello. Having separatedinput promoters in DAsG representation eases the parsing of the netlistDAG and running of optimization algorithms.
4.2.1 Genetic motif selection
One of the main goals of this synthesis flow is to provide users with a flexible design
environment. This can be achieved by providing the ability to select the type of motifs
(i.e. abstract genetic gates) that can be utilized in the circuit. The granularity of motifs
can be different and a motif can have a multi-layer hierarchy (similar to modules in
electronic design). Basically, a user can select a motif or define a motif and describe its
boolean functionality. For instance, a motif can be a simple buffer or inverter, or it can be
a module which instantiates other previously designed motifs. This idea is conceptually
similar to the IP-cores (intellectual property cores) in reconfigurable electronics (e.g.
Field Programmable Gate Arrays).
In addition to the structure of the motif, its functional characteristic is also flexible.

28
A user can select for example a NOR motif which functions in the transcriptional level
and connect it to an AND motif which is in the translational level. Providing a design
tool with this level of flexibility may lead to more optimized, complex and reliable
designs. However, these features demand more standardized characterization criteria in
order to design final circuits. For instance, transfer functions for each motif need to be
specified since the input and output signals of two connected modules must be matched.
In other words, the high and low threshold levels of an input signal of a front gate should
be matched with those of the connected output port of the input gate. A similar work
has been done in (Yaman et al., 2011).
Cello is implemented as a Clotho app and has access to the Clotho data model and
database. However, in the current version of the Clotho data model genetic motifs and
primitives are not defined. As a result, we do not have a library of genetic motifs with
digital behaviors. Consequently, the stage of motif selection from an external library
is not completely implemented in Cello. However, the structure of the Mapping stage
is designed to be flexible for the future addition of a library and the ability to select
various motifs. In the current version of Cello, three hard-coded motifs are implemented.
The first motif functions as an inverter. The second is a two input NOR motif based
on (Tamsir et al., 2011) article. Finally, we proposed a three input NOR structure
in which we simply added a third input promoter to the two input NOR structure.
No experimental tests have been done on the three input NOR yet. Illustrations of
an inverter and a three input NOR motifs are provided in Figure 4·8 (a) and (b),
respectively.
4.2.2 Technology mapping
The Verilog description of an input design can be written using any set of boolean
operators. On the motif library side, we can design and implement different motifs and

29
(a) (b)
Figure 4·8: Schematics of (a) Inverter and (b) three input NOR motifsdrawn by TinkerCell CAD tool. The explanations about how these gatesfunction are given in detail in Chapter 2.
genetic gates with multifarious boolean functionalities. As a result, in order to be able
to map an input operator to a motif, an interface boolean function is required. Using
this boolean function, both the functionality of input description and the behavior of
genetic motifs need to be represented. The main difference between technology mapping
in electronic circuit design and genetic circuit design appears in the fact that in electronic
circuits a single gate based technology is selected (for instance NAND CMOS circuit or
Look-Up Tables) while in genetic circuits different types of gates can be used.
Taking this issue into consideration, the boolean functions of all motifs are trans-
formed to two input NOR based functions. For instance, Figure 4·9 illustrates the for
the transformed circuit for three input NOR gate. Two exceptions are inverter and
buffer motifs, which are not transformed to NOR gates.
The implemented algorithm for mapping is based on pattern matching among the
input graph and the transformed NOR-based graphs of motifs. The subgraph isomor-
phism problem is known to be NP-complete (Garey and Johnson, 1979). However, in
this work, we used a cost based heuristic in order to reduce the time complexity. A list

30
Figure 4·9: The boolean equivalent structure for three input NOR gateconstructed by NOR2/INV gates. Similarly to three input NOR, all ofthe other motifs’ boolean functions are transformed to NOR2/INV basedstructures.
of available motifs is created in which motifs are sorted based on their costs. The cost
here is defined as the ratio of number of primitives to number of operational nodes in
the transformed boolean graph. For instance, in the case of having motifs for inverter,
NOR2 and NOR3, the order of the list will be 1- NOR3 2- NOR2 and 3- INV.
Two main loops in the algorithm iterate over the DAG. In the outer loop, the algo-
rithm runs a breadth first search and finds the operational nodes. For each operational
node, in an inner loop, the algorithm explores the connected subgraph of that node
while the parsed pattern matches with at least one of the available motifs in the list.
The found subgraph will be covered by the motif with the lowest cost.
If a node is covered previously, the algorithm does not iterate its inherited graphs.
As a result, not all of the possible combinations are checked, and the best mapping
may not be reached at the end. After all of the nodes in the graph are parsed by the
algorithm, the covered subgraphs are substituted by their equivalent motif DAsG’s in
another iteration. The output of the mapping algorithm is a motif level DAG which is
an interconnection of genetic primitives.
In Figure 4·10, we demonstrate the results of mapping on the gate level DAG of
Figure 4·6 (c). In 4·10(a) the blue circles point to the NOR operators in the gate level
DAG. One of the inverter nodes is circled by an orange line. After running the mapping
algorithm which only includes two input NOR and NOT motifs, the motif level DAG
4·10(b) is created. The substituted motifs for each of the operators pointed in the DAG

31
4·10(a) are enclosed by the same color lines in the motif level DAG 4·10(b). There are
48 primitive nodes in the DAG (b).
The motif level DAG 4·10(c) is created after mapping the gate level DAG to the mo-
tifs of three input NOR, two input NOR and NOT. As can be seen in the Figure 4·10(c),
by using a three input NOR, two of the connected NOR operators and the inverter be-
tween them are combined. The motif circled in green in 4·10(c) is the combination of
the two NORs and the INV in the gate level DAG of 4·10(a). Using this new set of
motifs, the motif level DAG 4·10(c) is generated by 13 fewer primitives (35 nodes).
(a) (b) (c)
Figure 4·10: The motif level DAG’s generated after mapping the gatelevel DAG of Figure 4·4 using different sets of available motifs. The coloredshapes in (a) show the NOR and NOT operators. The motifs mapped tothe operators are also shown enclosed by a same color box. In motiflevel DAG of (b) two input NOR (blue shapes) and NOT (orange shapes)motifs are mapped. Graph (c) shows the motif level DAG mapped to aset of three input NOR (green shapes), two input NOR and NOT motifs.

32
We know of no work that definitively demonstrates a relation between the number of
primitives inside a genetic regulatory network and the reliability or the optimality of the
network. However, since the number of available genetic parts are limited, a circuit with
a lower number of primitives is more feasible from a physical implementation standpoint.
4.2.3 Motif level optimization
As stated before fewer researchers have investigated the optimization of genetic reg-
ulatory networks. In other fields, various optimization criteria have been researched
and methods have been developed. For instance, in electronic circuit design the main
optimization targets are area, timing delay and power consumption.
In genetic networks, no specific optimization target has been clearly defined. Some
criteria have been proposed such as (Beal et al., 2011) and (Marchisio and Stelling,
2009). In our synthesis process, however, we developed an optimization algorithm which
removes the redundant genetic elements from a designed network. Beginning with the
whole structure of the genetic circuit in the motif level DAG, we can find the redundant
parts of the DAG. A redundant part is a part which does not have any effect on the
overall logical behavior of the circuit. For instance a buffer does not have any logical
effect on the output value of a circuit.
The motif level DAG is created by connecting different motifs to each other. Buffers
can be created by linking these motifs to each other. The structure of a buffer is a
coding sequence which is followed by an inducible promoter. In fact, there is a direct
gene induction (activation) which is same as a buffer. Hence, if we remove these elements
and connect the input of the buffer to its output, the functionality of the circuit will not
change.
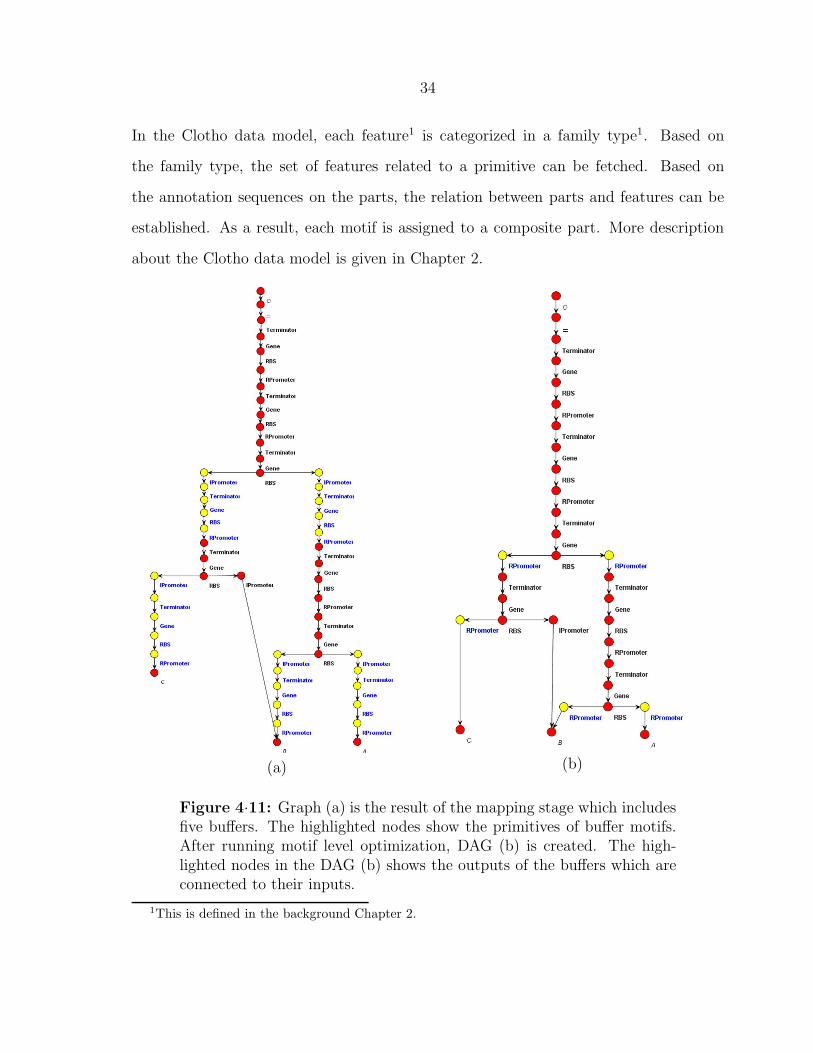
For instance, the buffer sites in the motif level DAG of Figure 4·10 (b) are illustrated
in Figure 4·11. The highlighted nodes (yellow colored) in the DAG 4·11(a) show the

33
buffer sites in the motif level DAG. The algorithm finds five buffers in this example and
removes their nodes from the DAG. Following that, the input of each buffer is connected
to its output. The result of motif level optimization with buffer removal is shown in
Figure 4·11(b). Each highlighted node in 4·11(b) shows the output of buffer which is now
linked to its input. In the optimized motif level DAG 21 fewer nodes (i.e. primitives)
exist in comparison to the non-optimized DAG.
The removal of buffers can be considered an optimization since by doing so the
number of required motifs decreases. However, the redundant buffers may have other
effects on the circuit. For example, a circuit might be more reliable if the buffers are
not removed. Future work should involve experimentally exploring these concepts after
physical implementation of both optimized and non-optimized circuits in the laboratory
environment.
4.3 Assignment
Our proposed synthesis process starts from the compilation of the input ccVerilog circuit
description (which creates a netlist DAG of the circuit). The generated gate level DAG
can be transformed to single gate type structure and optimized. After this first stage,
the gate level DAG is converted to a motif level DAG in the mapping stage. The motif
level DAG represents the abstract genetic regulatory network (AGRN) of the input
description. Another level of optimization can also be performed at the motif level.
After the first two stages, we have the Assignment stage. The aim of this stage is to
assign real DNA sequences to the primitives comprising the motif level DAG (AGRN).
The output of this stage is the actual DNA sequence for a set of composite parts. In
other words, the physical realization of the input circuit description is generated.
This stage is completely linked to the Clotho data model and the associated database.
The sequences of parts assigned to primitives are fetched from the Clotho database.
34
In the Clotho data model, each feature1 is categorized in a family type1. Based on
the family type, the set of features related to a primitive can be fetched. Based on
the annotation sequences on the parts, the relation between parts and features can be
established. As a result, each motif is assigned to a composite part. More description
about the Clotho data model is given in Chapter 2.
(a) (b)
Figure 4·11: Graph (a) is the result of the mapping stage which includesfive buffers. The highlighted nodes show the primitives of buffer motifs.After running motif level optimization, DAG (b) is created. The high-lighted nodes in the DAG (b) shows the outputs of the buffers which areconnected to their inputs.
1This is defined in the background Chapter 2.
35
4.3.1 Constraints determination
We assume that a genetic circuit will have various limitations on the type of the genetic
elements with which it is constructed. As a result, a final DNA sequence requires that
these constraints be applied to the circuit. In the current implementation of the synthesis
process and consequently Cello, we consider constraints applied on all the transcription
factors (TF) which exist in the whole genetic regulatory network. For instance, we
assume the cell in which the designed network is implemented will be defective if a
specific type of TF exists. Hence, the designer of the circuit can apply this constraint
by specifying the set of applicable TF existing in the database.
With the selection of TF’s, the applicable promoters and coding sequence genes are
also implicitly specified. The design space only includes the promoters that can be
regulated by one of the selected TF’s and coding sequence genes that can produce those
TF’s.
Another level of constraints can be determined for the input and output of the GRN.
Our assumption here is that a circuit is designed for a specific application. Therefore,
specific types of TF’s can control the design. In addition to the inputs, outputs of a
circuit need to be specified based on the application. By specifying the TF’s related to
the inputs and outputs of the circuit, we establish what a device can sense and how it
reacts to the external stimulus.
4.3.2 Selection of Orthogonal features
For a genetic circuit to function accurately, all of the regulatory relations among its
elements need to be mutually exclusive (orthogonal). We separate types of relations into
two main categories. The first category is the activation regulation which is between
TF’s and promoters. A TF can induce or repress different promoters. Also, a promoter
can be induced or repressed by different TF’s. As a result some of the promoters are

36
not independent or in other words they are not orthogonal. The other main category
of relations are production of TF’s by coding sequences. Different coding sequences can
produce the same TF’s.
Each of these two categories can be represented in a two dimensional matrix which
we process for finding the orthogonal subset. An example of an activation regulation
matrix is demonstrated in Table 4.1 . The vertical axes of matrix are the promoters and
the horizontal axes are the TF’s. The cells are equal to 1 if an activation relation exists
among the promoter and the TF. The TF columns are ordered from left to right based
on their necessity for circuit implementation. Hence, if a TF is assigned for an input
then it should be in a column further left. In addition to ordering based on necessity,
the TF’s which have a lower number of relations are located in the more left columns,
because they have less cross-talk.
Assume we have a set of four TF’s and six promoters. The activation regulation
matrix of these TF’s and promoters is demonstrated in Table 4.1. The X and Y TF’s
are assigned to input ports of the circuit. Notice that here we do not consider the
running example circuit of Chapter 4. For sake of simplicity, we consider a design that
can be implemented using three TF’s and has two inputs.
In the first stage of the algorithm, Prom2 is selected for TFx. As a result, the column
of TFx is removed for the next stage. Moreover, all of the columns which have 1 in the
row of Prom2 need to be removed. Hence, the column related to TFy is completely
inactivated. Table 4.2(a) shows the initial matrix with selection of Prom2 for TFx in
pink color and the affected cells in light gray and dark gray colors. When a TF and a
promoter are paired, the row and column related to them are collapsed and a reduced
table is generated. The collapsed row and column is shown in light gray color. Also
selection of Prom2 restricts the use of TFy, since TFy also have relation with the Prom2.
As a result, we need to inactivate all of the relations in the TFy column (shown in dark

37
Table 4.1: Activation regulation table for promoters and TF’s. Thevertical axes of matrix are the promoters and the horizontal axes showTF’s. The cells are equal to 1 if an activation relation exists among thepromoter and the TF.
TFx TFy TFz TFm
Prom1 0 0 0 1
Prom2 1 1 0 1
Prom3 0 1 1 0
Prom4 0 1 0 0
Prom5 1 0 1 0
Prom6 0 1 1 1
gray). Moreover, the promoters that are affected by TFx (e.g. Prom5) needs to be
inactivated. After applying these changes Table 4.2(b) is created.
As can be seen in Table 4.2(b), we do not have any available promoters to be selected
for TFy after selection of Prom2. Since TFy is one of the assigned TF’s for the inputs
of our circuit, the algorithm needs to back track to try another promoter selection for
TFx. Hence, the pair of TFx and Prom5 is selected in the next stage. The affected row,
column and cells are shown in Table 4.3(a). Moreover, the filtered table after selection
of Prom5 for TFx is demonstrated in Table 4.3 (b).
In the next stage, the algorithm pairs TFy with Prom3. The result of selection and
the filtered table is shown in Tables 4.4 (a) and (b). Prom5 and Prom3 are added to
the list of orthogonal promoters at the conclusion of this selection.
Given the Table 4.4(b), the algorithm cannot find any promoter for TFz. However,
this TF is not assigned to any input port; consequently, there is no obligation to have
TFz available. Since we are still looking for one more TF-promoter pair (remember
the circuit requires three TFs for implementation), algorithm removes the column TFz

38
Table 4.2: The activation regulation table and changes that needs to beapplied after selection of Prom2 for Tfx (the pink cell in (a)). The lightgray row and column are removed for creation of the new table. The cellsin dark gray are also inactivated in the new table. (b) shows the tableafter applying required changes. Since TFy does not have any availablepromoter for selection while it is a required TF, the algorithm traces backto selection of another promoter for TFx.
(a)
TFx TFy TFz TFm
Prom1 0 0 0 1
Prom2 1 1 0 1
Prom3 0 1 1 0
Prom4 0 1 0 0
Prom5 1 0 1 0
Prom6 0 1 1 1
(b)
TFy TFz TFm
Prom1 0 0 X
Prom3 X 1 0
Prom4 X 0 0
Prom5 0 X 0
Prom6 X 1 X
from table (Table 4.5(a)) and creates the new Table 4.5(b). From this new table, the
algorithm selects Prom1 for TFm and adds it to the orthogonal promoters set. At
the end of this stage we have a sufficient number of promoters and algorithm returns
{Prom1, Prom3, Prom5} as orthogonal promoters.
The same algorithm runs on the gene production regulation matrix. Only TF’s that
have orthogonal promoters regulated are checked in the production regulation table. In
this matrix (table) on the vertical axes are genes and on the horizontal axes are TF’s.
The TF’s in this table are ordered based on the assignment to outputs, the assignment
to inputs, and the number of regulatory genes related to them. The output of this run
is a set of orthogonal genes and the TF’s which they are producing.
By taking the intersection of the two output orthogonal sets of the (gene, TF) and
(TF, promoter), we have a set of paired orthogonal (gene, promoter). Using this new
set we can assign appropriate features to the primitives of type “coding sequence” and

39
Table 4.3: The activation regulation table and changes applied afterselection of Prom5 for Tfx (the pink cell in (a)). The light gray row andcolumn are removed for creation of the new table. The cells in dark grayare also inactivated in the new table. (b) shows the table after applyingrequired changes.
(a)
TFx TFy TFz TFm
Prom1 0 0 0 1
Prom2 1 1 0 1
Prom3 0 1 1 0
Prom4 0 1 0 0
Prom5 1 0 1 0
Prom6 0 1 1 1
(b)
TFy TFz TFm
Prom1 0 0 1
Prom2 X 0 X
Prom3 1 X 0
Prom4 1 0 0
Prom6 1 X 1
“promoters” when the former primitive has an induction/repression relation with the
latter primitive.
The other primitive types such as terminator and RBS do not require to be checked
for orthogonality since they cannot have cross-talk. Based on the type of these primi-
tives, appropriate features are fetched from the database using Clotho.
4.3.3 Feature assignment
In this stage the DNA sequence for each primitive in a motif level DAG is assigned. The
order of assignment steps is:
1. Input promoters - First, based on the assigned input TF’s, the promoters con-
nected to the input ports are assigned to their related promoter features in the
orthogonal set. In this level some of the promoter types may not match with the
selected orthogonal promoter. We discuss the solution for this problem in the
section 4.3.4.

40
Table 4.4: The activation regulation table and changes applied afterselection of Prom3 for Tfy (the pink cell in (a)). The light gray row andcolumn are removed for creation of the new table. The cells in dark grayare also inactivated in the new table. (b) shows the table after applyingrequired changes.
(a)
TFy TFz TFm
Prom1 0 0 1
Prom2 X 0 X
Prom3 1 X 0
Prom4 1 0 0
Prom6 1 X 1
(b)
TFz TFm
Prom1 0 1
Prom2 0 0
Prom4 0 0
Prom6 X X
2. Internal promoters - After assigning the input promoters, the internal pro-
moters are assigned. For these promoters, since a gene (coding sequence) either
represses or induces the promoter’s activity, we make the feature assignment based
on the orthogonal (gene, promoter) set created in the previous stage.
3. Internal coding sequences - Next, based on the internal promoter assignment,
the coding sequences related to promoters are assigned. Hence, for each coding
sequence in the motif level DAG, the regulated promoter which follows it is fetched.
Then, the paired feature is fetched from the orthogonal (gene, promoter) set.
4. Output coding sequences - As discussed previously, for each output of the cir-
cuit a TF is assigned by the designer. Based on the output TF the coding sequence
that can produce it is fetched from the orthogonal (gene, TF) set generated in the
previous stage.
5. Ribosomal binding sites - In the current implementation of Cello, we set the
same feature for all of the RBS’s in a circuit. However, in our synthesis process,

41
Table 4.5: The activation regulation table and change applied after se-lection of Prom1 for Tfm (the pink cell in (b)). The light gray columnis removed for creation of the new table since not any promoter can beselected for TFz. After this stage algorithm returns {Prom1, Prom3,Prom5} set as orthogonal promoters.
(a)
TFz TFm
Prom1 0 1
Prom2 0 0
Prom4 0 0
Prom6 X X
(b)
TFm
Prom1 1
Prom2 0
Prom4 0
Prom6 X
an optimization approach based on the RBS calculator designed by the Voigt Lab
and the Salis Lab (Salis et al., 2009) is proposed. More details about this proposal
is explained in section 4.3.4.
6. Terminators - All terminators are also assigned to the same feature which is
fetched from the database.
Due to the limits in the number of available biological parts, some of the primitives
may remain unassigned in more complex circuits. The assignment process is not stopped
due to lack of resources unless no features can be found for input or an output of the
circuit. For instance, after execution of the Assignment stage on the running example of
Chapter 4, the graph of Figure 4·12 is generated. The name of the nodes demonstrate
the assigned feature’s name. The highlighted nodes are unassigned nodes for which the
label is the type of the primitive. Graph (a) is the assigned version of the optimized
mapped input graph utilizing two input NOR (Figure 4·10 (b)). In this graph (a),
eight unassigned nodes can be seen. However, using the three input NOR motif for
mapping and optimizing the motif level DAG, the assigned version has six unassigned
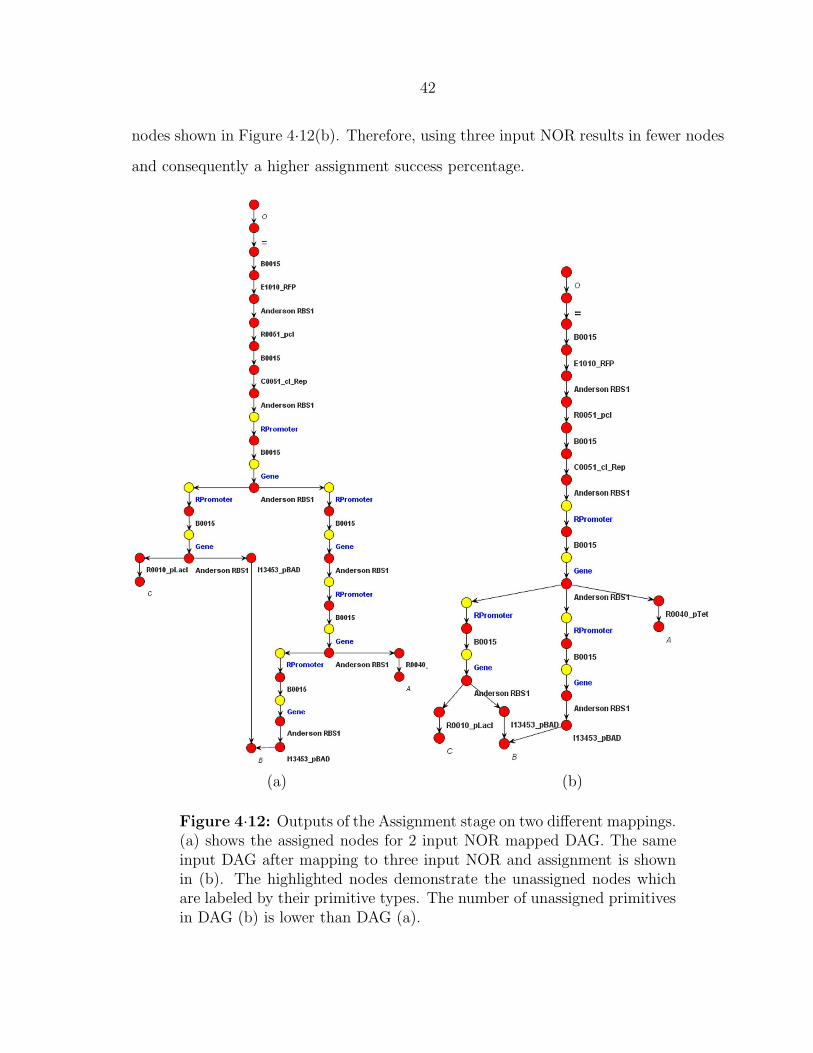
42
nodes shown in Figure 4·12(b). Therefore, using three input NOR results in fewer nodes
and consequently a higher assignment success percentage.
(a) (b)
Figure 4·12: Outputs of the Assignment stage on two different mappings.(a) shows the assigned nodes for 2 input NOR mapped DAG. The sameinput DAG after mapping to three input NOR and assignment is shownin (b). The highlighted nodes demonstrate the unassigned nodes whichare labeled by their primitive types. The number of unassigned primitivesin DAG (b) is lower than DAG (a).

43
4.3.4 Part level optimization
We named this optimization stage “part level optimization” since the optimization is
done either during the assignment of the motifs or on the assigned motifs. In the current
version of the tool, only one of the following proposed methods is implemented.
By assigning TF’s for input ports, after running the orthogonal selection of features
stage, a promoter feature is assigned to the promoter primitive connected to that port.
However, in some cases the type of the regulation of the primitive does not match
with the selected feature’s type. For instance, in Figure 4·11 (b) (page 34 )port B is
connected to a repressible promoter which is shown by a green circle. On the other
hand, the TF selected for this port is Arabinose which induces the PBad promoter.
As a result, we cannot assign PBad to the “rpromoter” primitive. In the part level
optimization stage, a buffer is added in front of the repressible promoter converting the
inducer input TF Arabinose to a represser (Figure 4·13 (a) blue square). However, due
to an insufficient number of repressor coding sequences and repressible promoter pairs
this buffer cannot be assigned completely. Since the other promoter connected to B is
an inducible promoter no buffers need to be added for conversion.
The other case of unmatched promoters is when the selected promoter can be re-
pressed by the input TF and the primitive type is an inducible promoter. In this case
the optimizer algorithm adds an inverter motif (repressible promoter + RBS + cod-
ing sequence + terminator) and also substitutes the inducible promoter motif with a
promoter that can be repressed by the coding sequence of the inverter. For instance,
assume for the example in Figure 4·11 for port B TF Tetracycline is selected. For this
TF, the orthogonal feature selection algorithm returns pTet repressible promoter. In
this case, port B cannot be connected to “ipromoter” primitive. Figure 4·13 (b) shows
the substituted inverter and repressible promoter in the violet square.

44
(a) (b)
Figure 4·13: Part level optimization on the assignment of primitives.In the DAG (a) the buffer motif and in the DAG (b) the inverter andrepressible promoter motifs are added for matching the input TF withthe related promoter.
Another important issue in the genetic circuit synthesis is the various protein pro-
duction levels among the elements of circuit. Depending on many different factors, the
protein production rate of a circuit can be changed. As a result, when an interconnec-
tion is made between two circuits, it is important that the input and output signals of
the two can be matched. In (Yaman et al., 2011), an automation algorithm for match-
ing these input and output signals of GRN elements based on their production rates is
proposed.
45
Our proposal for optimization of the synthesized GRN is to tune the Ribosomal
Binding Sites (RBS). Consider a circuit with two tandem genetic gates, g1 and g2, in
which g1’s output is connected to g2’s input. We propose that using the RBS calculator
proposed in (Salis et al., 2009) either the output protein production rate of g1 can be
tuned to match the required input rate of g2 or vice versa. Currently, we use a generic
RBS. This tuning process is proposed in the future work section.
4.3.5 Packaging of output
The assignment stage is completed by preparation of the output of the synthesis flow.
The output of Cello is a set of composite parts which includes the parts (implicitly nu-
cleotide sequences) required for implementation of the GRN. In the assignment stage,
first, a feature from the database of Clotho is assigned to each primitive of the mo-
tifs inside AGRN. After completion of the orthogonal feature selection and part level
optimization stages, the biological parts related to each assigned feature require to be
fetched from the database.
After the parts are queried from the database, these parts are packaged into com-
posite parts based on the covering partitions. The primitives related to a mapped motif
have same covering partition. However, inside a motif not all of the primitives (parts)
are required to be physically connected (i.e. have attached sequences). These type of
primitives are ”transparently connected”. In order to be able to distinguish such trans-
parent connections, the related edges inside a DAG can be labeled. After packaging is
done, a set of composite parts are generated which is the output of the synthesis process
(Cello).

46
4.4 Post-synthesis assembly preparation
In order to have a complete flow from the high level description of a genetic circuit to
its implementation in the biological laboratory, two post-synthesis stages are required
to be performed. These post-synthesis stages are proposed by CIDAR group at Boston
University.
The first stage is the preparation of the output composite part sequence for assembly.
The assembly of parts requires a specific plan, which shows the stages of the assembly
process and the parts that can be assembled in each stage. The Assembly manager
in an App in Clotho which provides a plan for creation of the composite parts. The
applied approach in this tool is based on (Densmore et al., 2010). The Assembly Manager
generates an assembly graph which is converted to a protocol graph based on the selected
implementation protocol.
After protocol graph is generated, the Puppeteer language is used (Vasilev et al.,
2011). The first stage requires existing samples to be fetched from a database and a
protocol library, an instruction code is generated for a liquid handling robot. In order
to generate instructions which are compatible with the robot, the settings of the robot
is also parsed by the code generator.
The final stage of the automation is performed by a tool named Puppet Show (Vasilev
et al., 2011). Puppet Show parses the robot code generated by the Puppeteer and sends
out the required instructions to the liquid handling robot to execute.

47
Chapter 5
Experimental Result
5.1 Biological Experiments
Our synthesis flow proposes a methodology to design a genetic circuit using a high level
language. The input of the flow is a genetic circuit description and the output is a
DNA sequence. To verify the validation os the proposed flow, we need to show that
the implementation of the output DNA sequence in the laboratory environment has
behavior compatible with the input model.
The limited number of biological parts available for assembly in the laboratory pro-
hibits the implementation of complex circuits. Thus, the experimental testing is per-
formed on a simple three input, one output circuit. Figure 5·1 shows the Verilog de-
scription, the correlated truth table, and the boolean gate level schematic of the test
circuit. Based on the library of available parts, the generated GRN cannot be completely
assigned without running the motif level optimization algorithm (Figure 5·1 top GRN).
However, after removing the buffer (annotated by orange dashed lines) the optimized
GRN can be completely assigned (Figure 5·1 bottom GRN).
Table 5.1 lists the parts utilized for implementing the test GRN. As established by
Cello, these parts are biologically orthogonal. The Biobrick assembly protocol (Knight,
2003) is selected for implementation of the test GRN in the laboratory. This protocol is
a binary assembly process; in other words, at each stage of this process only two parts
(or composite parts) can be combined. All of the parts in Table 5.1 are compatible with

48
Figure 5·1: The Verilog description, truth table and the schematic of theselected circuit for experimental experiments illustrated in this figure. Theresultant GRN by Cello is drawn and the assigned parts’ names are alsolabeled. As illustrated, the unoptimized circuit cannot be fully assignedbecause of the limit in the number of available parts in the biologicallaboratory. However, after running the optimization and removing thebuffer, the new circuit is feasible for implementation.
the required format (RFC10 format).
Based on the protocol’s requirements, an assembly plan is created for the test GRN,
which is illustrated in Figure 5·2. Each level in the tree shows a stage of assembly.
The leaves are BioBrick parts and the root is the final GRN which can be transformed
into Escherichia coli (E.coli) competent cells. The test GRN consists of three composite
parts, illustrated in three different colors: light green, light blue and purple in Figure 5·2.
A previously assembled composite part,underlined in orange, is reused for this circuit.
The current state of the assembly is annotated with green and blue stars.

49
Table 5.1: List of the parts utilized for implementing the GRN for Figure5·1. All of the parts are compatible with BioBrick assembly protocol.Moreover, gene and promoter parts are orthogonal.
Part Number Family Description
BBa I0500 Promoter pBad - Inducuble by Arabionose
BBa R0065 Promoter pCI - Repressible by CI
BBa K091112 Promoter pLac - Respressible by Lac
BBa K091146 Promoter pLas - Inducible by Las+AHL
BBa R0040 Promoter pTet - Indcuible by aTc
BBa C0051 Gene CI - Repressor gene
BBa C0012 Gene LacI - Repressor gene
BBa C0078 Gene LasI - Activator gen
BBa E1010 Gene Red Flourscent Protein - Reporter Gene
BBa B0015 Terminator double terminator
BBa B0034 RBS
5.2 Computational Analysis
A software tool running the proposed synthesis flow, named Cello, is implemented as a
Clotho App. Clotho is a tool suite designed for managing synthetic biology data. Clotho
also provides design tools for engineering synthetic biological systems. In this section,
we analyze our proposed flow and the related algorithms for two different examples.
To provide a clear and understandable analysis, we use a simple circuit with three
inputs and a single output. This example is used for demonstrating the effects of different
algorithms in the flow. The Verilog description, as well as the boolean logic based
schematic of the circuit, are shown in Figure 5·3. As illustrated, this circuit is described
using a boolean expression consisting of two NOR and one inverter operations.
Cello provides the options for running the flow using different optimizations or li-

50
Figure 5·2: Assembly plan for implementation of the test GRN is de-signed based on the BioBrick assembly protocol. A previously assembledsection of the GRN, underlined in orange, is reused for this circuit. Thecurrent state of the assembly is annotated by green and blue stars.
brary elements. The first optional algorithm is the technology transformation to NOR
(Chapter 4.1.2). Since the motifs available in the database of Cello are all NOR and INV
based, the technology mapping step is currently mandatory. However, if other future
motifs for different operations are defined in the database, this stage can be optional.
The three main options that we considered in this analysis begins with gate level opti-
mization (Chapter 4.1.3). In this step, the removal of double inverters can be optionally
performed and the selection may impact the final output circuit. The following selection
is for the genetic motif selection step (Chapter 4.2.1), which effects the technology map-
ping (Chapter 4.2.2). In this step, two different motif packages can be selected. The first
package includes a two input NOR and inverter motifs (NOR2/INV). The second pack-
age choice adds a three input NOR motif to the previous package (NOR3/NOR2/INV).
Another option is motif level optimization (Chapter 4.2.3). If this step is performed,
the buffer motifs are removed from the design.
It is required to state that, in this analysis, we assumed Cello is connected to a
Clotho library which includes four Repressible promoters, four Repressor genes, four
Inducible promoters, and one reporter gene. We also assumed all of these parts are
orthogonal. The number of orthogonal parts in the library has a direct influence on the

51
(a)Example ex-A (b)Example ex-A’
Figure 5·3: The Verilog code, truth table and structure schematic ofrunning examples of computational analysis. (a) shows ex-A with threeinputs and a single output. (b) illustrates the equivalent boolean equationdescribed differently in Verilog. The transformed structure of the inputexpression is also shown which consists one more NOR gate (the greenschematic).
size of an implementable circuit.Unlike other primitive parts, RBS and terminators do
not have an orthogonality constraint. These parts (RBS and terminator) may effect the
reliability of the GRN, in general, and the protein expression rate, in particular. The
promoters and genes are the actual limiting factors for designing a GRN, since they are
required to be orthogonal and may impact each other. As a result in the tables below,
the number of inducible/repressible promoters and genes are reported for each output
circuit.
Since there are three different optional steps, each with two choices, Cello can gen-
52
erate eight different results based on the different choices. Table 5.2 reports the statics
for number of motifs and primitives forming the generated outputs for ex-A applying
different optimization steps and mapping criteria. Since ex-A is completely described
using NOR and INV operations and does not have any double inverter, the gate level
optimization (GOPT) does not impact the final output. The modeled circuit consists of
three boolean NOR and INV operators. As a result, by mapping the design using the set
of NOR2/INV, the average number of primitives per gate without optimization is equal
to seven. However, the description can be mapped to a single three input NOR, which
results in a lower value of primitives per boolean operator (three to four primitives per
gate). Furthermore, it can be seen that by performing motif level optimization (MOPT)
the final output mapped by NOR2/INV set can be completely assigned (row 5).
In order to show the effect of Verilog description on the result of synthesis process,
we analyzed the boolean equivalent of ex-A which is shown in Figure 5·3(b). As it is
illustrated, the generated netlist of ex-A’ includes three AND gates and four invert-
ers. After transforming the AND operators to NOR, the new netlist has 10 inverters
and three NOR’s. Example ex-A’ also shows the effect of optimization and mapping
steps more clearly. Table 5.3 illustrates the generated outputs for ex-A’ applying dif-
ferent optimization steps and mapping criteria. After transformation to NOR, the new
structure has 4 double inverters removable by running gate level optimization (GOPT).
However, even after applying GOPT the structure cannot be completely assigned by
mapping to NOR2/INV set. Based on the available parts in the connected library, this
design can only assigned completely when GOPT and motif level optimization (MOPT)
is performed and the selected mapping set is NOR3/NOR2/INV.

53
Table 5.2: The statics for motifs and primitives forming the generated outputs for ex-A applyingdifferent optimization steps and mapping criteria. Since ex-A is completely described using NOR andINV operations and does not have any double inverter, the gate level optimization (GOPT) does notimply any effect on the final output. However, the description can be mapped to a single three inputNOR, which results in a lower value of primitives per boolean operator. Moreover, it can be seen thatby performing motif level optimization (MOPT) the final output mapped by NOR2/INV set can becompletely assigned.
Output
Options Motif Level Statistics Primitive Level Statistics
GOPT NOR2INV
NOR3NOR2INV
MOPT Gates NOR2’s NOR3’s INV’s IProm RProm Genes Primitives/Gate
CompletelyAssigned
1 X 3 2 0 1 4 3 5 7 No
2 X X 3 2 0 1 4 3 5 7 No
3 X 3 0 1 0 3 1 2 3 - 4 Yes
4 X X 3 0 1 0 3 1 2 3 - 4 Yes
5 X X 3 2 0 1 3 3 4 6 Yes
6 X X X 3 2 0 1 3 3 4 6 Yes
7 X X 3 0 1 0 3 1 2 3 - 4 Yes
8 X X X 3 0 1 0 3 1 2 3 - 4 Yes

54
Table 5.3: The statics for motifs and primitives forming the generated outputs for ex-A’ applyingdifferent optimization steps and mapping criteria. The created netlist for input Verilog description ofex-A’ includes three AND and four INV is operators. After transformation to NOR, the new structurehas 4 double inverters which are removed by running gate level optimization (GOPt). However, evenafter applying GOPT the structure cannot be completely assigned by mapping to NOR2/INV set. Basedon the available parts in the connected library, this design is assigned completely only when GOPT andmotif level optimization is performed and the mapping set is NOR3/NOR2/INV.
Output
Options Motif Level Statistics Primitive Level Statistics
GOPT NOR2INV
NOR3NOR2INV
MOPT Gates NOR2’s NOR3’s INV’s IProm RProm Genes Primitives/Gate
CompletelyAssigned
1 X 13 3 0 10 6 13 16 5 - 6 No
2 X X 5 3 0 2 6 5 8 7 No
3 X 13 1 1 9 9 11 17 5 - 6 No
4 X X 5 1 1 1 5 3 5 4 - 5 No
5 X X 13 3 0 10 4 13 14 4 - 5 No
6 X X X 5 3 0 2 4 5 6 5 - 6 No
7 X X 13 1 1 9 4 11 12 7 No
8 X X X 5 1 1 1 4 3 4 3 - 4 Yes

55
By comparing statistics reported in Tables 5.2 for ex-A and table 5.3 for ex-A’, it
can be concluded that the primary input description may effect the synthesized output
GRN. Out of eight different synthesized network for ex-A, six can be completely assigned
and implemented using the available set of parts. On the other hand, for the boolean
equivalent of ex-A, which is ex-A’, only one generated output circuit can be completely
assigned using the equal number of parts.
Based on these results, the importance of having design space exploration for the
input description can be concluded. By investigating different equivalent implementa-
tions for an input description, the best feasible solution can be generated. The electronic
design automation researchers have investigated this subject for electronic circuit syn-
thesis. As part of the future work for this project, elaborated design space exploration
algorithms can be added to the synthesis flow to improve the percentage of feasible
output genetic circuits for a given logic circuit description.
Furthermore, the results for ex-A’ reported in Table 5.3 shows that only one out
of eight different synthesized genetic circuits can be completely assigned with available
parts in the correspondent library. This ratio points out the effect of optimization
algorithms on shrinking the size of a circuit from 67 to 29 primitive. In addition to the
optimization algorithms, the availability of different type of motifs with high coverage
such as NOR3 has a direct effect on the decrement of the circuit size.
The ratio of primitives per gate is calculated for results of both examples. Based on
Table 5.3, it could be assumed that the circuits having a ratio lower than four primitives
per gate can be completely assigned. However, this assumption is false since Table 5.2
shows that for a ratio of six primitives per gate the outputs number five and six are
feasible. Therefore, the rate of primitives per gate is not determinative for feasibility
and complete assignment of the circuit.
56
Chapter 6
Conclusion
Design automation tools are in demand for synthetic biology in order to increase the
pace of investigations and developments in this field. In this project, we consider the
approach of applying the methodologies used for electronic design automation (EDA)
to biological design automation (BDA). For certain, while the general concepts in EDA
can be mapped to BDA, major modifications are also required.
In this thesis I explained an automation flow which interprets a design description in
a high level language and generates the required DNA sequence for the implementation of
the modeled behavior. In this automation methodology, I break down the synthesis flow
to three stages: Compilation, Mapping and Assignment. While the former two stages are
analogous to logic circuit synthesis stages (however, modifications are required based on
biological constraints), the latter stage completely deals with the requirements of GRN
design.
The analytical results for the proposed synthesis flow are discussed in Chapter 5.2.
These results report the impact of this BDA flow on increasing the feasibility of a circuit
for a given description. For instance, in one of the studied examples only one out of
eight different resultant GRN’s can be implemented using the available parts, which
shows that optimizations are needed to find small sets of feasible designs in large design
spaces.
Moreover, the computational analysis reveals that the output of this proposed flow
is dependent to the input description. The comparison made between two functionally

57
equivalent circuits with various input descriptions shows that the percentage of com-
pletely assignable outputs in equal conditions are different for each design. While one
design has 75% feasible design points, the other design has only 12.5% feasible designs.
Hence, design space exploration is mandatory in order to find the best solution for any
input description. This problem has been investigated by EDA researchers and can be
contributed to HLL based BDA approaches.
A software tool has been developed based on the proposed synthesis flow, named
Cello. As an extension app for Clotho tool suite, Cello has access to a custom data model
based on synthetic biology’s requirements. The implemented compilers and algorithms in
addition to the connection to biological libraries enable Cello to run the flow thoroughly
starting from a Verilog description and to generate the required GRN. Cello is an open
source application and it can be accessed and downloaded from www.clothocad.org.
In order to verify the synthesis flow, the physical implementation of an experimental
GRN generated by Cello has begun in the laboratory environment. The main target in
the biological experiments is to implement various Cello generated genetic circuits for
the examined description, test the functionality, and investigate the reliability of each
output.
6.1 Future work
One of the most immediate future directions for this project is to complete the im-
plementation of the test design in the biological laboratory. By finishing the physical
implementation of the test GRN and transforming the DNA to competent cells, a FACS
machine can characterize the circuit for each of the eight different permutations. We
can then distinguish the performance. Moreover, as discussed previously, other possible
GRN’s for the same description can be tested to compare the reliability of designs. More-
over, by increasing the number of available genetic parts, designs with higher complexity

58
can be generated by Cello and examined in the biological laboratory.
Elaboration of compilation and extending it by automated design space exploration
methodologies are of high priority for a truly powerful synthesis flow. The current com-
piler does not support many of the available features of Verilog (for example behavioral
design description and sequential circuit description among others). Moreover, the gate
level optimization algorithms can also be customized based on genetic circuit design
specifications.
The current version of Cello designed circuits are based on three available motifs of
NOR2, NOR3 and INV. However, the synthesis flow can be strengthened by introducing
libraries of different type of motifs similar to the EDA synthesis tools. In addition to
designing new motifs, investigating efficiency criteria for making comparison among
different motifs is required.
The motif level optimization step is another potential stage to modify for improving
the synthesis results. In the current version, only buffers are removed as far as the motif
level optimization is concerned. However, finding repeated paths and removing tandem
repressions are two sample extensions for motif level optimization.
Augmenting the reliability of synthesis flow outputs can be another focus of future
work. Approaches such as signal matching and RBS tuning can be investigated more
thoroughly. Furthermore, the resultant circuits of the synthesis can be functionally
verified using existing formal languages and verification algorithms.

Appendix A
Cello compatible Verilog
A design in Verilog can be described using behavioral or structural statements. The
structural statements are either the instantiation of other modules or the continuous
assignment of boolean expressions to ports. The current version of Cello only compiles
structural Verilog descriptions made with continuous assignment statement. Registers
and wires are not acceptable in the compiler currently. All of the binary logical operators
(&, | and ∼) can be used for the input Verilog description of Cello. Multi-bit vector
input/output ports will be interpreted as single-bit ports.
Considering these limitations any boolean expression can be written in the Verilog
file and there is no limit in the number of expression levels. Two-level logic is also
available and an expression can be written either in Sum-of-Product or Product-of-Sum
format.
59

References
Anderson, J. C., Clarke, E. J., Arkin, A. P., and Voigt, C. A. (2006). Environmen-tally controlled invasion of cancer cells by engineered bacteria. Journal of MolecularBiology, 355(4):619–627.
Anderson, J. C., Voigt, C. A., and Arkin, A. P. (2007). Environmental signal integrationby a modular and gate. Molecular Systems Biology, 3(133):133.
Baker, D., Church, G., Collins, J., Endy, D., Jacobson, J., Keasling, J., Modrich, P.,Smolke, C., and Weiss, R. (2006). Engineering life: building a fab for biology.Scientific American, 294(6):44–51.
Beal, J., Lu, T., andWeiss, R. (2011). Automatic compilation from high-level biologically-oriented programming language to genetic regulatory networks. PLoS ONE, 6(8):e22490.
Bilitchenko, L., Liu, A., Cheung, S., Weeding, E., Xia, B., Leguia, M., Anderson, J. C.,and Densmore, D. (2011). Eugene a domain specific language for specifying andconstraining synthetic biological parts, devices, and systems. PLoS ONE, 6(4):e18882.
Chandran, D., Bergmann, F., and Sauro, H. (2009). Tinkercell: modular cad tool forsynthetic biology. Journal of Biological Engineering, 3(1):19.
Chandran, D., Bergmann, F. T., and Sauro, H. M. (2010). Computer-aided design ofbiological circuits using tinkercell. Bioengineered bugs, 1(4):274–281.
Chandran, D., Bergmann, F. T., Sauro, H. M., and Densmore, D. (2011). Computer-aided design for synthetic biology. In Koeppl, H., Setti, G., di Bernardo, M., andDensmore, D., editors, Design and Analysis of Biomolecular Circuits, pages 203–224.Springer New York.
Czar, M. J., Cai, Y., and Peccoud, J. (2009). Writing dna with genocad. Nucleic AcidsResearch, 37(Web Server issue):W40–W47.
Densmore, D., Hsiau, T. H. C., Kittleson, J. T., DeLoache, W., Batten, C., and Ander-son, J. C. (2010). Algorithms for automated dna assembly. Nucleic Acids Research,38(8):2607–2616.
Densmore, D., Van Devender, A., Johnson, M., and Sritanyaratana, N. (2009). Aplatform-based design environment for synthetic biological systems. In The Fifth
60
61
Richard Tapia Celebration of Diversity in Computing Conference: Intellect, Initia-tives, Insight, and Innovations, TAPIA ’09, pages 24–29, New York, NY, USA. ACM.
Dunlop, M. J., Keasling, J. D., and Mukhopadhyay, A. (2010). A model for improvingmicrobial biofuel production using a synthetic feedback loop. Systems and syntheticbiology, 4(2):95–104.
Endy, D. (2005). Foundations for engineering biology. Nature, 438(7067):449–453.
Frezza, B. M., Cockroft, S. L., and Ghadiri, M. R. (2007). Modular multi-level circuitsfrom immobilized dna-based logic gates. Journal of the American Chemical Society,129(48):14875–14879.
Gardner, T. S., Cantor, C. R., and Collins, J. J. (2000). Construction of a genetictoggle switch in escherichia coli. Nature, 403(6767):339–342.
Garey, M. R. and Johnson, D. S. (1979). Computers and Intractability: A Guide to theTheory of NP-Completeness. W. H. Freeman.
Katz, R. H. (1993). Contemporary logic design. Benjamin-Cummings Publishing Co.,Inc., Redwood City, CA, USA.
Keasling, J. D. and Chou, H. (2008). Metabolic engineering delivers next-generationbiofuels. Nature Biotechnology, 26(3):298–299.
Keutzer, K. (1987). Dagon: technology binding and local optimization by dag matching.In Proceedings of the 24th ACM/IEEE Design Automation Conference, DAC ’87,pages 341–347, New York, NY, USA. ACM.
Khalil, A. S. and Collins, J. J. (2010). Synthetic biology: applications come of age.Nature Reviews Genetics, 11(5):367–379.
Knight, T. (2003). Idempotent vector design for standard assembly of biobricks. Secu-rity, pages 1–11.
Lehman, E., Watanabe, Y., Grodstein, J., and Harkness, H. (1995). Logic decomposi-tion during technology mapping. In Proceedings of the 1995 IEEE/ACM internationalconference on Computer-aided design, ICCAD ’95, pages 264–271, Washington, DC,USA. IEEE Computer Society.
MacDonald, J. T., Barnes, C., Kitney, R. I., Freemont, P. S., and Stan, G.-B. V. (2011).Computational design approaches and tools for synthetic biology. Integrative biologyquantitative biosciences from nano to macro, 3(2):97–108.
Marchisio, M. A. and Stelling, J. (2009). Computational design tools for syntheticbiology. Current Opinion in Biotechnology, 20(4):479–485.

62
Mermet, J. P. (1993). Fundamentals and Standards in Hardware Description Languages:Proceedings of the NATO Advanced Study Institute, in Ciocco, Barga, Italy, April 16-26, 1993. Kluwer Academic Publishers, Norwell, MA, USA.
Myers, C. J. (2009). Engineering Genetic Circuits. Chapman and Hall.
Parr, T. (2007). The Definitive ANTLR Reference: Building Domain-Specific Lan-guages. Pragmatic Bookshelf.
Parr, T. J. and Quong, R. W. (1995). Antlr: A predicated-ll(k) parser generator.Software: Practice and Experience, 25(7):789–810.
Pedersen, M. and Phillips, A. (2009). Towards programming languages for geneticengineering of living cells. Journal of the Royal Society Interface the Royal Society,6(4):S437–S450.
Purnick, P. E. M. and Weiss, R. (2009). The second wave of synthetic biology: frommodules to systems. Nature Reviews Molecular Cell Biology, 10(6):410–422.
Rinaudo, K., Bleris, L., Maddamsetti, R., Subramanian, S., Weiss, R., and Benenson,Y. (2007). A universal rnai-based logic evaluator that operates in mammalian cells.Nature Biotechnology, 25(7):795–801.
Ro, D.-K., Paradise, E. M., Ouellet, M., Fisher, K. J., Newman, K. L., Ndungu, J. M.,Ho, K. A., Eachus, R. A., Ham, T. S., Kirby, J., and et al. (2006). Productionof the antimalarial drug precursor artemisinic acid in engineered yeast. Nature,440(7086):940–943.
Rodrigo, G. and Jaramillo, A. (2007). Computational design of digital and memorybiological devices. Systems and synthetic biology, 1(4):183–195.
Rudell, R. and Sangiovanni-Vincentelli, A. (1987). Multiple-valued minimization for plaoptimization. IEEE Transactions on Computer-Aided Design of Integrated Circuitsand Systems, 6(5):727–750.
Salis, H. M., Mirsky, E. A., and Voigt, C. A. (2009). Automated design of synthetic ri-bosome binding sites to control protein expression. Nature Biotechnology, 27(10):946–950.
Stojanovic, M. and Stefanovic, D. (2003). A deoxyribozyme-based molecular automa-ton. Nature Biotechnology, 21(9):1069–1074.
Stok, L. and Tiwari, V. (2002). Technology mapping, pages 115–139. Kluwer AcademicPublishers, Norwell, MA, USA.
Systems, C. D. (2011). Cadence encounter rtl compiler. http://www.cadence.com.

63
Tamsir, A., Tabor, J. J., and Voigt, C. A. (2011). Robust multicellular computing usinggenetically encoded NOR gates and chemical ‘wires’. Nature, 469:212–215.
Ter-Galstyan, A. (2008). Verilog grammar for antlr v3. http://www.antlr.org/
grammar/1227766760039/Verilog3.g.
Thomas, D. E. and Moorby, P. (1995). The Verilog hardware description language (2.ed.). Kluwer.
Vasilev, V., Liu, C., Haddock, T., Bhatia, S., Adler, A., Yaman, F., Beal, J., Babb, J.,Weiss, R., and Densmore, D. (2011). A software stack for specication and robotic ex-ecution of protocols for synthetic biological engineering. 3rd International Workshopon Bio-Design Automation.
Xia, B., Bhatia, S., Bubenheim, B., Dadgar, M., Densmore, D., and Anderson, J. C.(2011). Developers and user’s guide to clotho v2.0 a software platform for the creationof synthetic biological systems. Methods in Enzymology, 498:97–135.
Yaman, F., Bhatia, S., Adler, A., Densmore, D., Beal, J., Babb, J., Davidsohn, N.,Haddock, T., Loyall, J., Schantz, R., and Weiss, R. (2011). Toward automatedselection of parts for genetic regulatory networks. 3rd International Workshop onBio-Design Automation.
Yokobayashi, Y., Weiss, R., and Arnold, F. H. (2002). Directed evolution of a geneticcircuit. Proceedings of the National Academy of Sciences of the United States ofAmerica, 99(26):16587–16591.

CURRICULUM VITAE
Roza Ghamari
Department of Electrical and Computer En-gineeringBoston University8 Saint Marry St.Boston, MA 02215
Phone: (857) 305 5692Office: 209 PHOEmail:[email protected]
Education
M.S. Computer Engineering, Boston University, 2011.
Thesis: Applying Hardware Description Languages on Genetic Circuit Design.
M.S. (24 credits towards degree) Computer Engineering, Bogazici University, 2010.
B.S. Computer Engineering (Software), Razi University, 2008.
Thesis: Dependability Enhancement of Dynamic Instruction Scheduling
Employment
Research Assistant, CIDAR, Boston University, Jan 2011–present.
Research Assistant, CASLAB, Bogazici University, Nov 2008–Jan 2010
Software Engineer, Electric Power Technology Development Center, Iran, Apr 2008–Sep 2008
Publications and Reasearch
Peer reviewed/Conferences
Ghamari, R. and Rajabzadeh, A., ”FTDIS: A Fault Tolerant Dynamic Instruc-tion Scheduling,” Third International Conference on Dependability 2010, (DE-PEND10), vol., no., pp.32-37, 18-25 July 2010.
Ghamari, R. and Yurdakul, A., Register File Design in Automatically GeneratedASIPs, 4th HiPEAC Workshop on Reconfigurable Computing (WRC10), Jan 23,2010, Pisa, Italy.

65
Kurumahmut, B., Kabukcu, G., Ghamari, R. and Yurdakul, A., ”Design automa-tion model for application-specific processors on reconfigurable fabric,” Forum onSpecification and Design Languages, 2009 (FDL09), vol., no., pp.1-6, 22-24 Sept.2009.
Book Chapter
Yurdakul, A., Ghamari, R., Kurumahmut B. and Kabukcu, G., Design Automa-tion Model for Application-Specific Processors on Reconfigurable Fabric, Ad-vances In Design Methods From Modeling Languages For Embedded SystemsAnd Socs Lecture Notes in Electrical Engineering, 2010, Volume 63, Part 2, 107-124.
Poster Presentations
Ghamari R., Stanton B., Haddock T., Bhatia S., Clancy K., Peterson T., Voigt C.and Densmore D., Applying Hardware Description Languages to Genetic CircuitDesign Third International Workshop on Bio-Design Automation (IWBDA), SanDiego, CA, June 2011.
Ghamari R., Bhatia S., Voigt C. and Densmore D., Applying CombinationalLogic Design Methodologies on Genetic Circuits, TAPIA 11, San Francisco, CA,April 2011.
Awards
The Hariri Award for Transformative Computational Science Research award for theposter titled DNA Computation Using Combinational Logic Design Methodologies
Travel Grants for TAPIA 11, and IWBDA 11.