bor clr 1112t5432t -...
TRANSCRIPT

A member of The Texas State University System
Board of Regents Fact SheetNovember 2012

Table of ContentsI. Graphs Student Population Data: Graph 1. Student Enrollment by Level 1 Graph 2. Semester Credit Hours by Level 1 Graph 3. Minority Distribution of Students 2 Graph 4. Gender Distribution of Students 2 Graph 5. Fall Enrollment Texas State vs. State Average 2 Graph 6. Enrollment of Top 10 Texas Senior 3 Public Institutions Graph 7. Median Retention & Graduation Rates of Public 3 4-YearInstitutionsbyCarnegieClassification Graph 8. First-Year Full-time Freshmen Retention 4 Graph 9. First-Year Full-time Transfer Retention 4 Graph 10. Six-Year Full-time Freshmen Graduation 5 Graph 11. Four-Year Full-time Transfer Graduation 5 Graph 12. Student Majors by College 6 Graph 13. Degrees Awarded by Fiscal Year 6 Faculty and Staff Data: Graph 14. Full-time & Tenured Faculty Headcount by Rank 7 Graph 15. Full-time & Tenured Faculty Headcount by 7 Rank and Gender Graph 16. Minority Distribution of Full-time & Tenured 7 Faculty Headcount Graph 17. Full-time & Tenured Faculty Headcount 8 Graph 18. Faculty FTE 8 Graph 19. Average Faculty Salary Comparisons 8 Graph 20. Full-time Staff Headcount by EEO Category 9 Graph 21. Full-time Staff Headcount by 9 EEO Category and Gender Graph 22. Full-time Staff Headcount by 9 EEO Category and Ethnicity Financial Data: Graph 23. Total Estimated Expenditures 10 Graph 24. Total Operating Budget 10 Graph 25. State E&G Appropriations 11 Graph 26. Student Financial Aid 13 Graph 27. Average (Mean) Tuition and Fee Comparison 13

Financial Data: (cont.) Graph 28. Average (Mean) Tuition and Fees at 14 Public Universities: 10 Most Populous States Graph 29. Average (Mean) Tuition and Fees at Public 14 Universities: Max and Min Average Compared to Texas Facilities Data: Predicted vs. Actual Square Footage Graph 30. Teaching Space 16 Graph31. OfficeSpace 16 Graph 32. Library Space 16 Graph 33. Research Space 17 Graph 34. Support Space 17 Graph 35. Total Space 17
II. Tables Financial Data: Table 1. Total Estimated Expenditures 10 Table 2. Total Operating Budget 10 Table 3. State E&G Appropriations 11 Table 4. Estimated Budget Requirements from E&G 11 Table 5. State Appropriations: General Revenue Per Capita 12 Table 6. Student Financial Aid 13 Table 7. Average (Mean) Tuition and Fee Comparison 13 Table 8. Room Rates for Housing Survey Respondents 15 Facilities Data: Table 9. Construction Expenditures 18 Table 10. Parking Space 18
III. Attachments Attachment I. Texas Public Universities: General Revenue Funds 19 Per Semester Credit Hour Attachment II. Tuition and Fees for Texas Public Universities 20 Attachment III. Tuition and Fees for Texas State and 21 National Peers and Aspirants Attachment IV. Average Tuition and Fees at 22 Public Universities by State Attachment V. Predicted vs. Actual Total E&G/FTSE for 23 Texas Public Universities Attachment VI. Major Campus Construction 24

Student Population Data
1 Office of Institutional Research
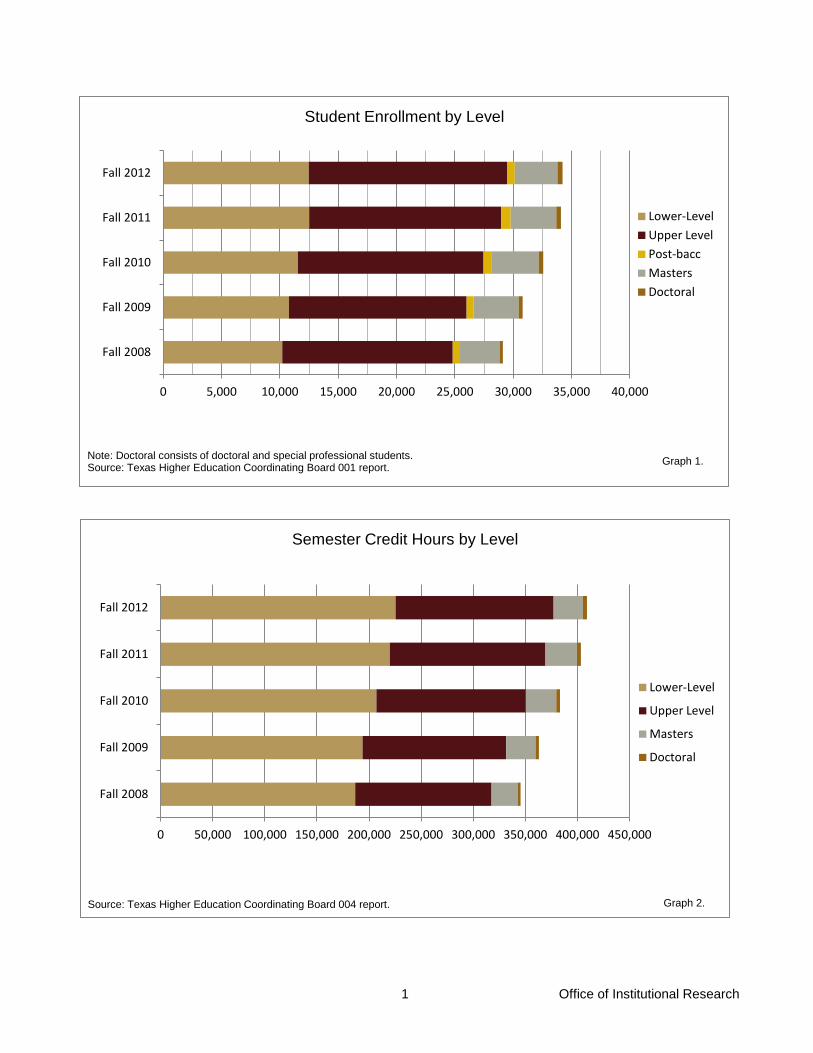
0 5,000 10,000 15,000 20,000 25,000 30,000 35,000 40,000
Fall 2008
Fall 2009
Fall 2010
Fall 2011
Fall 2012
Student Enrollment by Level
Lower-LevelUpper LevelPost-baccMastersDoctoral
Note: Doctoral consists of doctoral and special professional students. Source: Texas Higher Education Coordinating Board 001 report. Graph 1.
0 50,000 100,000 150,000 200,000 250,000 300,000 350,000 400,000 450,000
Fall 2008
Fall 2009
Fall 2010
Fall 2011
Fall 2012
Semester Credit Hours by Level
Lower-Level
Upper Level
Masters
Doctoral
Source: Texas Higher Education Coordinating Board 004 report. Graph 2.
2 Office of Institutional Research
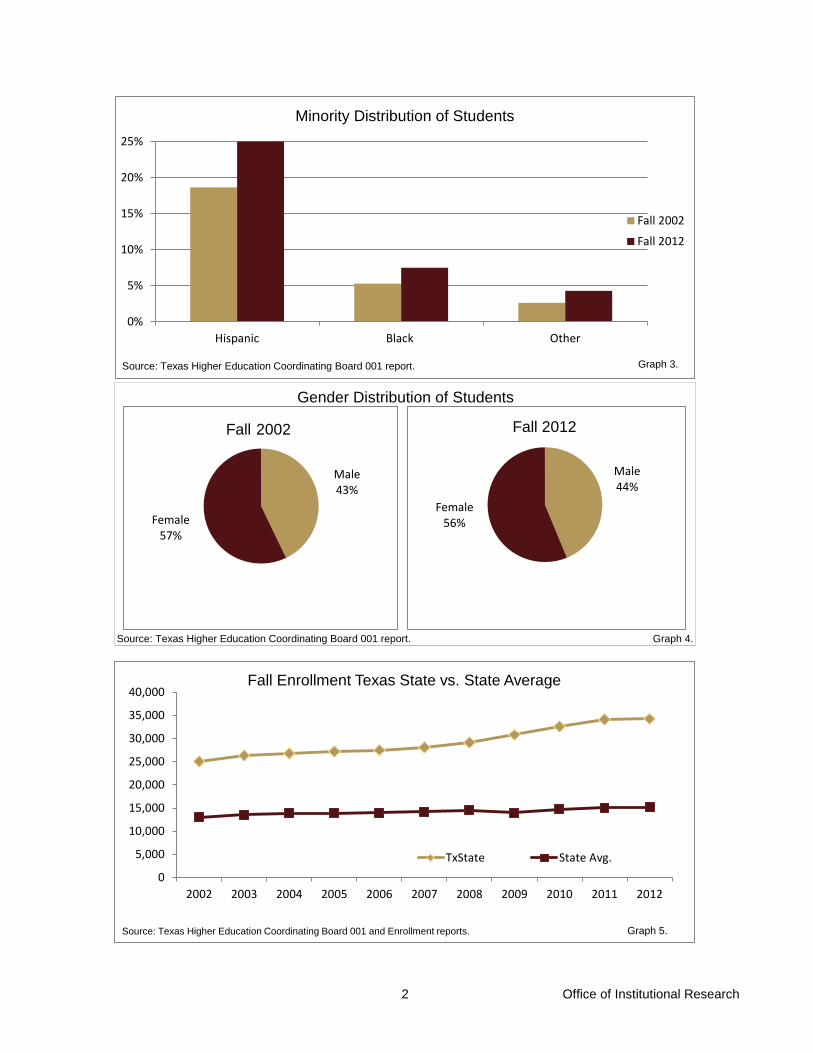
Source: Texas Higher Education Coordinating Board 001 report. Graph 4.
Gender Distribution of Students
0
5,000
10,000
15,000
20,000
25,000
30,000
35,000
40,000
2002 2003 2004 2005 2006 2007 2008 2009 2010 2011 2012
Fall Enrollment Texas State vs. State Average
TxState State Avg.
0%
5%
10%
15%
20%
25%
Hispanic Black Other
Minority Distribution of Students
Fall 2002
Fall 2012
Graph 3. Source: Texas Higher Education Coordinating Board 001 report.
Male 43%
Female 57%
Fall 2002
Male 44%
Female 56%
Fall 2012
Graph 5. Source: Texas Higher Education Coordinating Board 001 and Enrollment reports.

3 Office of Institutional Research
19,626
22,749
30,607
32,611
33,267
34,229
35,836
38,758
50,353
52,213
UT Dallas
UT El Paso
UT San Antonio
Texas Tech
UT Arlington
Texas State
U of North Texas
U of Houston
Texas A&M
UT Austin
Fall 2012 Preliminary Enrollment of Top 10 Texas Senior Public Institutions
76%
83%
73%
72%
79%
49%
61%
42%
44%
56%
Total
Research
Doctoral
Master's
Texas State
Median Retention & Graduation Rates of Public 4-Year Institutions by Carnegie Classification
(First-Year Retention 2010 Cohort & Six-Year Graduation 2005 Cohort)
Graduation
Retention
Graph 6. Source: Texas Higher Education Coordinating Board Comparison of Enrollments report.
Source: Integrated Postsecondary Data System (IPEDS), U.S. Department of Education. Graph 7.

4 Office of Institutional Research
0%
20%
40%
60%
80%
100%
White Non-Hisp Black Non-Hisp Hispanic Other Total
First-Year Full-time Freshmen Retention
201020112012
0%
20%
40%
60%
80%
100%
White Non-Hisp Black Non-Hisp Hispanic Other Total
First-Year Full-time Transfer Retention (Students entering with 30+ hours)
201020112012
Graph 8. Source: Texas State Database (IPEDS Student Right-to-Know definition).
Graph 9. Source: Texas State Database (THECB Accountability System definition).

5 Office of Institutional Research
0%
10%
20%
30%
40%
50%
60%
70%
80%
White Non-Hisp Black Non-Hisp Hispanic Other Total
Six-Year Full-time Freshmen Graduation
201020112012
0%
10%
20%
30%
40%
50%
60%
70%
80%
White Non-Hisp Black Non-Hisp Hispanic Other Total
Four-Year Full-time Transfer Graduation (Students Entering with 30+ Hours)
201020112012
Graph 10. Source: Texas State Database (IPEDS Student Right-to-Know definition).
Graph 11. Source: Texas State Database (THECB Accountability System definition).
6 Office of Institutional Research
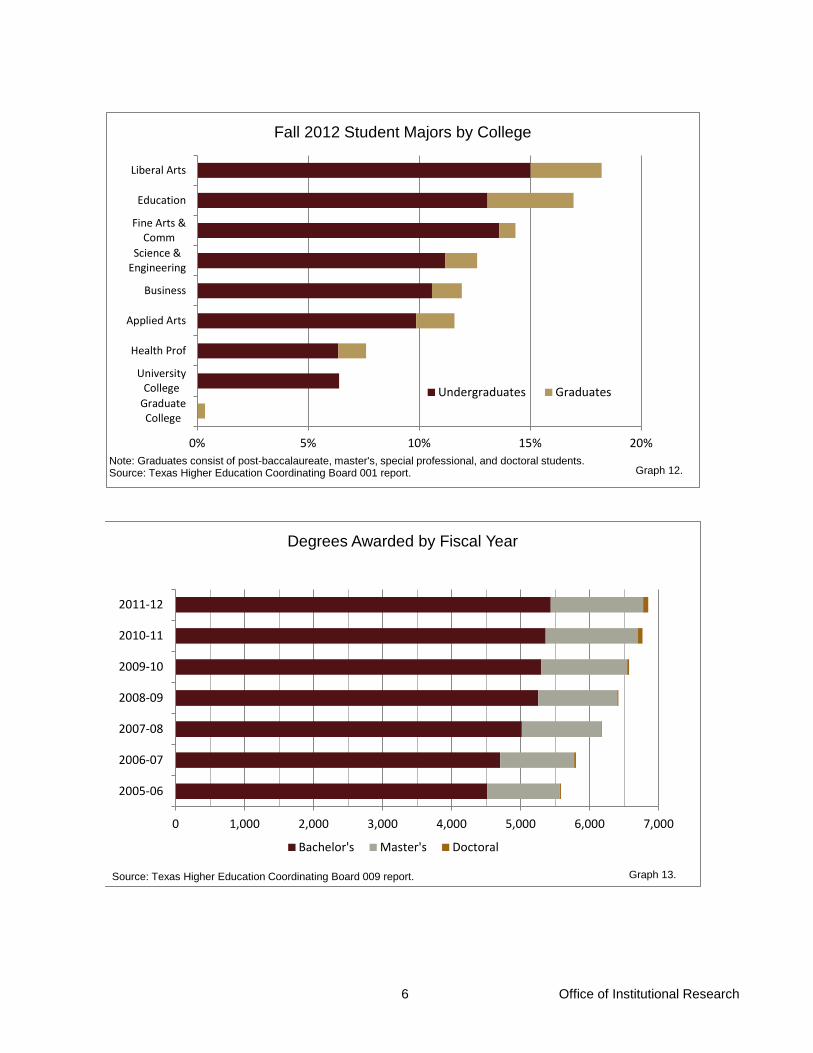
0% 5% 10% 15% 20%
GraduateCollege
UniversityCollege
Health Prof
Applied Arts
Business
Science &Engineering
Fine Arts &Comm
Education
Liberal Arts
Fall 2012 Student Majors by College
Undergraduates Graduates
Graph 12. Note: Graduates consist of post-baccalaureate, master's, special professional, and doctoral students. Source: Texas Higher Education Coordinating Board 001 report.
0 1,000 2,000 3,000 4,000 5,000 6,000 7,000
2005-06
2006-07
2007-08
2008-09
2009-10
2010-11
2011-12
Degrees Awarded by Fiscal Year
Bachelor's Master's Doctoral
Source: Texas Higher Education Coordinating Board 009 report. Graph 13.

Faculty and Staff Data
7 Office of Institutional Research
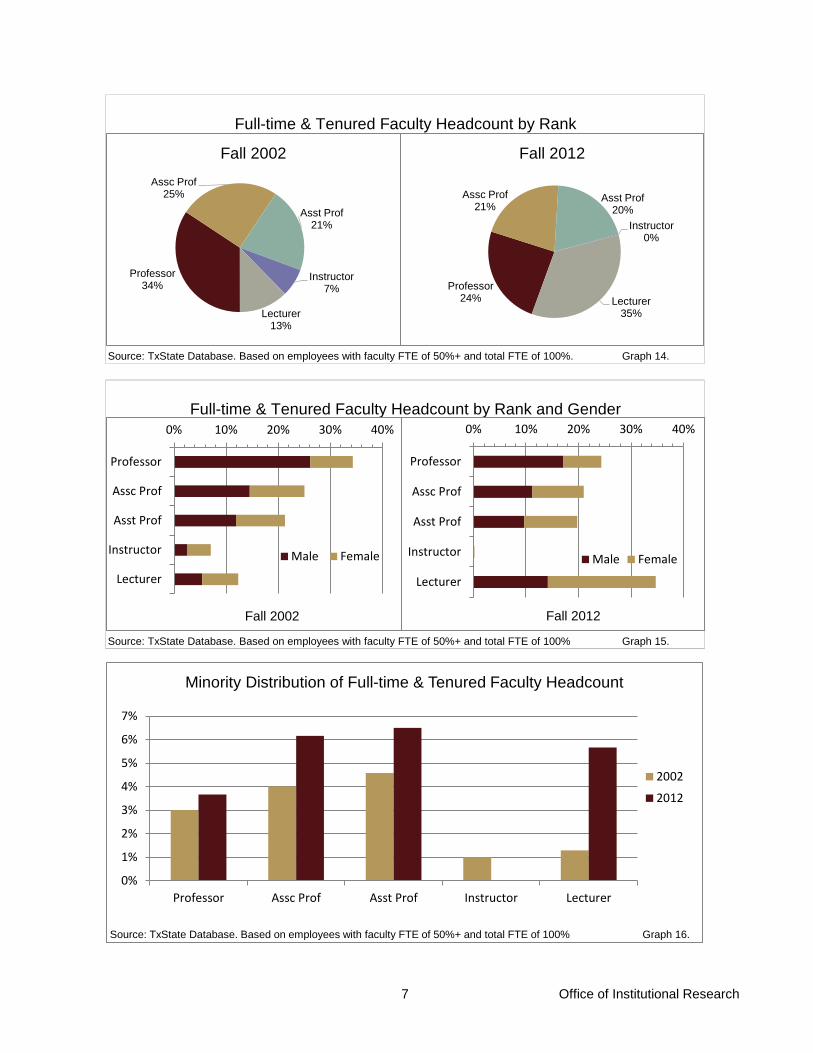
Source: TxState Database. Based on employees with faculty FTE of 50%+ and total FTE of 100%. Graph 14.
Source: TxState Database. Based on employees with faculty FTE of 50%+ and total FTE of 100% Graph 15.
Full-time & Tenured Faculty Headcount by Rank
Full-time & Tenured Faculty Headcount by Rank and Gender
Professor 34%
Assc Prof 25%
Asst Prof 21%
Instructor 7%
Lecturer 13%
Fall 2002
0% 10% 20% 30% 40%
Professor
Assc Prof
Asst Prof
Instructor
Lecturer
Fall 2002
Male Female
Professor 24%
Assc Prof 21%
Asst Prof 20%
Instructor 0%
Lecturer 35%
Fall 2012
0% 10% 20% 30% 40%
Professor
Assc Prof
Asst Prof
Instructor
Lecturer
Fall 2012
Male Female
0%
1%
2%
3%
4%
5%
6%
7%
Professor Assc Prof Asst Prof Instructor Lecturer
Minority Distribution of Full-time & Tenured Faculty Headcount
2002
2012
Graph 16. Source: TxState Database. Based on employees with faculty FTE of 50%+ and total FTE of 100%

8 Office of Institutional Research
0 200 400 600 800 1,000 1,200 1,400
Full-
time
& T
enur
ed F
acul
tyHe
adco
unt
Full-time & Tenured Faculty Headcount
20022012
$0
$20,000
$40,000
$60,000
$80,000
$100,000
$120,000
$140,000
Assistant Associate Professor Top 4 Ranks
Fiscal Year 2012 Average Faculty Salary Comparison
TxState
State
Tx Ten Largest
Note: Tx Ten Largest average excludes Texas State University. Source: Texas Higher Education Coordinating Board. Graph 19.
Graph 17. Source: TxState Database. Based on employees with faculty FTE of 50%+ and total FTE of 100%.
0 200 400 600 800 1,000 1,200 1,400
Facu
lty F
TE
Faculty FTE
20022012
Graph 18. Source: TxState Database. Based on employees with a faculty FTE.

9 Office of Institutional Research
Source: TxState Database. Based on employees with faculty FTE < 50% and total FTE of 100%. Graph 20.
Source: TxState Database. Based on employees with faculty FTE < 50% and total FTE of 100%. Graph 21.
Source: TxState Database. Graph 22.
Full-time Staff Headcount by EEO Category and Ethnicity
Full-time Staff Headcount by EEO Category
Full-time Staff Headcount by EEO Category and Gender
0%
10%
20%
30%
40%
Cler
ical
Prof
.
Serv
ice
Adm
in.
Tech
.
Skill
ed
Fall 2002
Female Male
0%
10%
20%
30%
40%Cl
eric
al
Prof
.
Serv
ice
Adm
in.
Tech
.
Skill
ed
Fall 2012
Female Male
0%
10%
20%
30%
40%
Cler
ical
Prof
.
Serv
ice
Adm
in.
Tech
.
Skill
ed
Fall 2002
MinorityWhite
0%
10%
20%
30%
40%
Cler
ical
Prof
.
Serv
ice
Adm
in.
Tech
.
Skill
ed
Fall 2012
MinorityWhite
Clerical 24%
Prof 33%
Service 14%
Admin 7%
Technical 12% Skilled
4%
Fall 2012
Clerical 33%
Prof 25%
Service 17%
Admin 9%
Technical 11%
Skilled 6%
Fall 2002

Financial Data

10 Office of Institutional Research
Table 1. Total Estimated ExpendituresFY 2012 FY 2013
E & G 47.6% 46.7%Designated Funds 29.5% 29.7%Auxiliary 22.9% 23.6%SUB-TOTAL 100.0% 100.0%
TOTALSource: Operating Budget.
Table 2. Total Operating BudgetFY 2012 FY 2013
Faculty Salaries 25.4% 24.5%Staff Salaries 21.9% 22.8%Operating 52.6% 52.7%SUB-TOTAL 100.0% 100.0%TransfersTOTALSource: Operating Budget.
$188,735,631.00 $196,847,024.00$117,060,610.00 $125,427,946.00
$450,287,998.00 $477,869,639.00
Total Operating Budget
$90,800,079.00 $99,558,952.00$396,596,320.00 $421,833,922.00
$53,691,678.00 $56,035,717.00
$208,718,728.71 $222,494,662.60
$100,888,528.01 $103,292,521.03$86,989,063.28 $96,046,738.37
$450,287,998.00 $477,869,639.00
$396,596,320.00 $421,833,922.00$53,691,678.00 $56,035,717.00
Faculty Salaries 24.5%
Staff Salaries 22.8% Operating
52.7%
FY 2013
Faculty Salaries 25.4%
Staff Salaries 21.9%
Operating 52.6%
FY 2012
0%
10%
20%
30%
40%
50%
60%
70%
E & G Designated Funds Auxiliary
Total Estimated Expenditures
FY 2012FY 2013
Graph 23.
Graph 24.

11 Office of Institutional Research
Table 3. State E&G AppropriationsBase Approp./
Year SCH SCHFY 2012:
State 13,709,712 $211Tx Ten Largest 7,707,558 $219
TxState 827,683 $154FY 2013:
State 13,709,712 $210Tx Ten Largest 7,707,558 $218
TxState 827,683 $154Note: Tx Ten Largest excludes Texas State University.Source: 81th Legislature, Regular Session: Text of Conference Committee Report.
Table 4. Estimated Budget Requirements from E&G
Resident Instruction: Faculty Salaries 52.1% 52.2% Department Oper. 5.7% 5.3% Organized Activ. 0.3% 0.4%Instruc. Admin. 2.9% 3.0%Rsrch. Enhance. 1.5% 1.4%Library 2.6% 2.6%
Physical Plant 5.3% 5.3%Institution Support 5.2% 5.2%Student Services 3.0% 3.0%Staff Benefits 19.8% 20.0%Special Items 1.6% 1.6%TOTAL** 100.0% 100.0%Source: Operating Budget.
** Transfer and Service Department funds excluded.
$2,877,168,998
E & GAppropriations
$2,887,789,625
$1,687,499,343
$127,081,274
$1,683,241,526
$127,411,370
FY 2012 FY 2013
$98,271,057.00 $102,745,111.00$10,811,037.00 $10,435,397.00
$645,295.00 $820,600.00
$4,966,921.00 $5,100,976.00
$5,445,554.00 $5,949,737.00$2,888,518.00 $2,747,727.00
$9,760,370.00 $10,244,354.00$9,910,018.00 $10,343,072.00
$5,703,748.00 $5,890,138.00$37,287,359.00 $39,386,179.00$3,045,754.00 $3,183,733.00
$188,735,631.00 $196,847,024.00
$0
$50
$100
$150
$200
$250
State Tx Ten Largest TxState
State E&G Appropriations per SCH FY 2012FY 2013
Graph 25.

12 Office of Institutional Research
Table 5. State Appropriations: General Revenue Per CapitaFY 2012 2011 Gen Rev
State Appropriations1 Population Per CapitaAlabama 10 1,470,951,799$ 4,802,740 $306Alaska 3 355,184,600$ 722,718 $491Arizona 49 814,457,600$ 6,482,505 $126Arkansas 9 903,589,798$ 2,937,979 $308California 20 9,663,254,000$ 37,691,912 $256Colorado 48 647,496,274$ 5,116,796 $127Connecticut 17 944,554,802$ 3,580,709 $264Delaware 27 213,193,700$ 907,135 $235Florida 37 3,622,861,769$ 19,057,542 $190Georgia 16 2,631,581,219$ 9,815,210 $268Hawaii 6 512,327,897$ 1,374,810 $373Idaho 31 333,669,600$ 1,584,985 $211Illinois 14 3,585,962,200$ 12,869,257 $279Indiana 26 1,549,460,261$ 6,516,922 $238Iowa 23 739,051,670$ 3,062,309 $241Kansas 19 739,612,189$ 2,871,238 $258Kentucky 12 1,235,421,786$ 4,369,356 $283Louisiana 13 1,290,047,558$ 4,574,836 $282Maine 32 270,802,839$ 1,328,188 $204Maryland 15 1,605,768,781$ 5,828,289 $276Massachusetts 40 1,150,151,325$ 6,587,536 $175Michigan 43 1,641,658,900$ 9,876,187 $166Minnesota 24 1,283,690,000$ 5,344,861 $240Mississippi 8 954,183,795$ 2,978,512 $320Missouri 44 930,089,844$ 6,010,688 $155Montana 33 202,105,316$ 998,199 $202Nebraska 7 650,437,323$ 1,842,641 $353Nevada 42 473,255,848$ 2,723,322 $174New Hampshire 50 83,299,717$ 1,318,194 $63New Jersey 28 1,998,300,000$ 8,821,155 $227New Mexico 5 798,972,305$ 2,082,224 $384New York 25 4,673,771,710$ 19,465,197 $240North Carolina 4 3,906,415,804$ 9,656,401 $405North Dakota 2 343,964,303$ 683,932 $503Ohio 41 2,013,797,074$ 11,544,951 $174Oklahoma 22 945,260,277$ 3,791,508 $249Oregon 45 598,020,319$ 3,871,859 $154Pennsylvania 46 1,826,879,000$ 12,742,886 $143Rhode Island 38 193,745,895$ 1,051,302 $184South Carolina 39 859,408,982$ 4,679,230 $184South Dakota 30 179,516,376$ 824,082 $218Tennessee 29 1,414,996,174$ 6,403,353 $221Texas 21 6,464,046,632$ 25,674,681 $252Utah 18 728,929,400$ 2,817,222 $259Vermont 47 88,225,042$ 626,431 $141Virginia 35 1,624,026,722$ 8,096,604 $201Washington 36 1,361,376,000$ 6,830,038 $199West Virginia 11 536,382,781$ 1,855,364 $289Wisconsin 34 1,153,558,680$ 5,711,767 $202Wyoming 1 336,097,525$ 568,158 $592U.S. (excludes District of Columbia) 72,543,813,412$ 310,973,921 $233
Source: Appropriations - "Grapevine" annual survey, Center for the Study of Education Policy, Illinois State UniversityPopulation - 2011 Population Estimate, U.S. Census Bureau
RankPer Capita
1 FY2012 figures include Federal Stimulus monies and represent initial allocations or estimates reported by the states in 12/2010

13 Office of Institutional Research
Table 6. Student Financial Aid: FY 2012Avg. Amount per
PersonWork Study $2,440Grants $5,266Scholarships $3,353Loans $9,981Total $12,412% Change (FY '11 to FY '12) 0.8%Source: TxState Financial Aid Office.
Table 7. Average (Mean) Tuition and Fee Comparison2008-09 2009-10 2010-11 2011-12 2012-13
TxState $6,994 $7,428 $7,838 $8,232 $8,772Tx Ten Largest $7,114 $7,528 $7,967 $8,339 $9,084Nat'l Peers/Aspirants $6,549 $6,995 $7,632 $8,371 $8,738Note: See attachment III for National Peers and Aspirants. Tx Ten Largest excludes Texas State University.Source: Chronicle of Higher Education web site (see Attachment III). Based on College Board Survey which asks for tuition and fees charged by first-year full-time (15 SCH) for the academic year, then they weight the figures by enrollment to reflect costs incurred by the average undergraduate.
Total Dollar Amount
7.9%
592
8.7%
$1,444,496$82,997,833$12,288,546
$209,272,264$306,003,139
No. of People Awarded
15,7623,665
20,96724,654
$0
$2,000
$4,000
$6,000
$8,000
$10,000
2008-09 2009-10 2010-11 2011-12 2012-13
Average (Mean) Tuition and Fee Comparison
TxState Tx Ten Largest Nat'l Peers/Aspirants
$0 $2,000 $4,000 $6,000 $8,000 $10,000 $12,000 $14,000
Work Study
Grants
Scholarships
Loans
Total
Student Financial Aid: FY 2012
Avg/PersonGraph 26.
Graph 27.

14 Office of Institutional Research
$0$1,000$2,000$3,000$4,000$5,000$6,000$7,000$8,000$9,000
$10,000$11,000$12,000$13,000$14,000$15,000$16,000
New Hampshire Texas Wyoming U.S. Median
FY 2013 Average (Mean) Tuition and Fees at Public Universities: Maximum and Minimum Average Compared to Texas
Graph 29.
$0$1,000$2,000$3,000$4,000$5,000$6,000$7,000$8,000$9,000
$10,000$11,000$12,000
FY 2013 Average (Mean) Tuition and Fees at Public Universities: 10 Most Populous States
Graph 28. Source: 2012 Trends in College Pricing, College Board (see Attachment IV).
Source: 2012 Trends in College Pricing, College Board (see Attachment IV).

15 Office of Institutional Research
Table 8. Fall 2012 Room Rates for Housing Survey Respondents
University Private Bath Suite Bath Community BathMidwestern State $3,000 $2,700 $1,675Sam Houston State $2,532 $1,940Stephen F. Austin State $2,333 $2,219 $1,804Texas A&M $2,787 $2,787 $1,894Texas A&M Kingsville $1,993 $1,837Texas State $3,113 $2,675 $2,335Texas Tech $3,166 $2,830 $2,190University of Houston $4,125 $2,676 $2,186
TxState Rank (Low to High) 5 of 7 4 of 8 7 of 7
Mean $3,008 $2,478 $1,989*The most common rate was chosen for each school.Source: TxState Room and Board Survey, Fall 2012.
Room Type*

Facilities Data

16 Office of Institutional Research
Note: Actual sqft. include E&G CB approved not on-line sqft. Tx Ten Largest excludes Texas State University.Source: Coordinating Board's Components of Space Projection Model.
Fall 2011 Predicted vs. Actual Square Footage
0
500,000
1,000,000
1,500,000
TxState Tx Ten Largest State Average
Teaching Space
Predicted
Actual
0200,000400,000600,000800,000
1,000,0001,200,0001,400,0001,600,000
TxState Tx Ten Largest State Average
Office Space
Predicted
Actual
0
100,000
200,000
300,000
400,000
500,000
600,000
TxState Tx Ten Largest State Average
Library Space
Predicted
Actual
Graph 30.
Graph 31.
Graph 32.

17 Office of Institutional Research
Note: Actual sqft. include E&G CB approved not on-line sqft. Tx Ten Largest excludes Texas State University.Source: Coordinating Board's Components of Space Projection Model.
Fall 2011 Predicted vs. Actual Square Footage (Cont'd)
0
100,000
200,000
300,000
400,000
500,000
600,000
TxState Tx Ten Largest State Average
Research Space
Predicted
Actual
0
100,000
200,000
300,000
400,000
TxState Tx Ten Largest State Average
Support Space
PredictedActual
0
1,000,000
2,000,000
3,000,000
4,000,000
5,000,000
TxState Tx Ten Largest State Average
Total Space
Predicted
Actual
Graph 33.
Graph 34.
Graph 35.

18 Office of Institutional Research
Table 9. Construction ExpendituresTotal Cost
Completed Construction 1999 to Present $370,498,304Construction in Progress $851,880,236Total Cost $1,222,378,540Source: TxState Office of Finance and Support Services, (see Attachment VII).
Table 10. Parking Space
Parking Area San Marcos Round RockAll Zone 4,643 0Apartment 906 0Car Pool 36 0Commuter 473 919Disabled Person 349 30Motorcycle 79 2Reserved 199 0Resident Hall 2,637 0Resident Hall Director 19 0Restricted 2,262 78Service/Delivery 17 5Visitor 584 26Total available spaces: 12,204 1,060Note: 40 Spaces/100 Students is a standard measure of "adequate parking." This computes to 13,690 spaces based on Fall 2012 student enrollment.Source: University Police Department, Nov. 2012.
Number of Spaces

Attachments
19 Office of Institutional Research
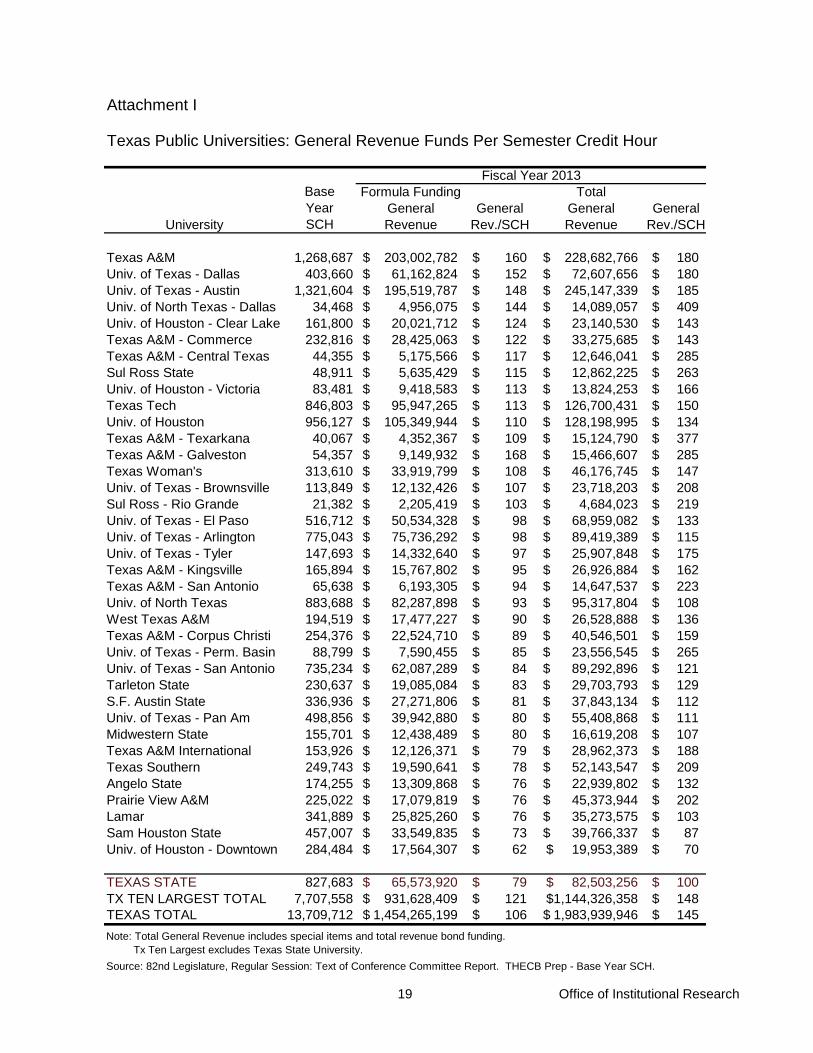
Attachment I
Texas Public Universities: General Revenue Funds Per Semester Credit Hour
Base Formula Funding TotalYear General General General General
University SCH Revenue Rev./SCH Revenue Rev./SCH
Texas A&M 1,268,687 203,002,782$ 160$ 228,682,766$ 180$ Univ. of Texas - Dallas 403,660 61,162,824$ 152$ 72,607,656$ 180$ Univ. of Texas - Austin 1,321,604 195,519,787$ 148$ 245,147,339$ 185$ Univ. of North Texas - Dallas 34,468 4,956,075$ 144$ 14,089,057$ 409$ Univ. of Houston - Clear Lake 161,800 20,021,712$ 124$ 23,140,530$ 143$ Texas A&M - Commerce 232,816 28,425,063$ 122$ 33,275,685$ 143$ Texas A&M - Central Texas 44,355 5,175,566$ 117$ 12,646,041$ 285$ Sul Ross State 48,911 5,635,429$ 115$ 12,862,225$ 263$ Univ. of Houston - Victoria 83,481 9,418,583$ 113$ 13,824,253$ 166$ Texas Tech 846,803 95,947,265$ 113$ 126,700,431$ 150$ Univ. of Houston 956,127 105,349,944$ 110$ 128,198,995$ 134$ Texas A&M - Texarkana 40,067 4,352,367$ 109$ 15,124,790$ 377$ Texas A&M - Galveston 54,357 9,149,932$ 168$ 15,466,607$ 285$ Texas Woman's 313,610 33,919,799$ 108$ 46,176,745$ 147$ Univ. of Texas - Brownsville 113,849 12,132,426$ 107$ 23,718,203$ 208$ Sul Ross - Rio Grande 21,382 2,205,419$ 103$ 4,684,023$ 219$ Univ. of Texas - El Paso 516,712 50,534,328$ 98$ 68,959,082$ 133$ Univ. of Texas - Arlington 775,043 75,736,292$ 98$ 89,419,389$ 115$ Univ. of Texas - Tyler 147,693 14,332,640$ 97$ 25,907,848$ 175$ Texas A&M - Kingsville 165,894 15,767,802$ 95$ 26,926,884$ 162$ Texas A&M - San Antonio 65,638 6,193,305$ 94$ 14,647,537$ 223$ Univ. of North Texas 883,688 82,287,898$ 93$ 95,317,804$ 108$ West Texas A&M 194,519 17,477,227$ 90$ 26,528,888$ 136$ Texas A&M - Corpus Christi 254,376 22,524,710$ 89$ 40,546,501$ 159$ Univ. of Texas - Perm. Basin 88,799 7,590,455$ 85$ 23,556,545$ 265$ Univ. of Texas - San Antonio 735,234 62,087,289$ 84$ 89,292,896$ 121$ Tarleton State 230,637 19,085,084$ 83$ 29,703,793$ 129$ S.F. Austin State 336,936 27,271,806$ 81$ 37,843,134$ 112$ Univ. of Texas - Pan Am 498,856 39,942,880$ 80$ 55,408,868$ 111$ Midwestern State 155,701 12,438,489$ 80$ 16,619,208$ 107$ Texas A&M International 153,926 12,126,371$ 79$ 28,962,373$ 188$ Texas Southern 249,743 19,590,641$ 78$ 52,143,547$ 209$ Angelo State 174,255 13,309,868$ 76$ 22,939,802$ 132$ Prairie View A&M 225,022 17,079,819$ 76$ 45,373,944$ 202$ Lamar 341,889 25,825,260$ 76$ 35,273,575$ 103$ Sam Houston State 457,007 33,549,835$ 73$ 39,766,337$ 87$ Univ. of Houston - Downtown 284,484 17,564,307$ 62$ 19,953,389$ 70$
TEXAS STATE 827,683 65,573,920$ 79$ 82,503,256$ 100$ TX TEN LARGEST TOTAL 7,707,558 931,628,409$ 121$ 1,144,326,358$ 148$ TEXAS TOTAL 13,709,712 1,454,265,199$ 106$ 1,983,939,946$ 145$
Source: 82nd Legislature, Regular Session: Text of Conference Committee Report. THECB Prep - Base Year SCH.
Fiscal Year 2013
Note: Total General Revenue includes special items and total revenue bond funding. Tx Ten Largest excludes Texas State University.
20 Office of Institutional Research
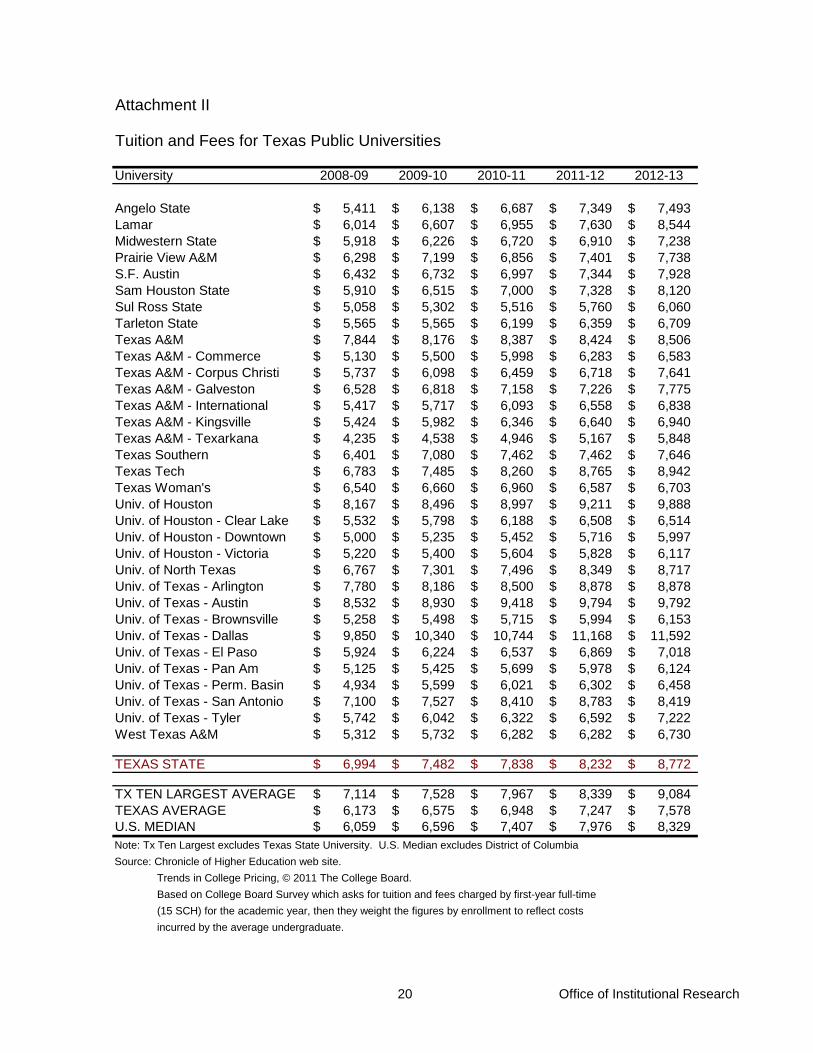
Attachment II
Tuition and Fees for Texas Public Universities
University 2008-09 2009-10 2010-11 2011-12 2012-13
Angelo State 5,411$ 6,138$ 6,687$ 7,349$ 7,493$ Lamar 6,014$ 6,607$ 6,955$ 7,630$ 8,544$ Midwestern State 5,918$ 6,226$ 6,720$ 6,910$ 7,238$ Prairie View A&M 6,298$ 7,199$ 6,856$ 7,401$ 7,738$ S.F. Austin 6,432$ 6,732$ 6,997$ 7,344$ 7,928$ Sam Houston State 5,910$ 6,515$ 7,000$ 7,328$ 8,120$ Sul Ross State 5,058$ 5,302$ 5,516$ 5,760$ 6,060$ Tarleton State 5,565$ 5,565$ 6,199$ 6,359$ 6,709$ Texas A&M 7,844$ 8,176$ 8,387$ 8,424$ 8,506$ Texas A&M - Commerce 5,130$ 5,500$ 5,998$ 6,283$ 6,583$ Texas A&M - Corpus Christi 5,737$ 6,098$ 6,459$ 6,718$ 7,641$ Texas A&M - Galveston 6,528$ 6,818$ 7,158$ 7,226$ 7,775$ Texas A&M - International 5,417$ 5,717$ 6,093$ 6,558$ 6,838$ Texas A&M - Kingsville 5,424$ 5,982$ 6,346$ 6,640$ 6,940$ Texas A&M - Texarkana 4,235$ 4,538$ 4,946$ 5,167$ 5,848$ Texas Southern 6,401$ 7,080$ 7,462$ 7,462$ 7,646$ Texas Tech 6,783$ 7,485$ 8,260$ 8,765$ 8,942$ Texas Woman's 6,540$ 6,660$ 6,960$ 6,587$ 6,703$ Univ. of Houston 8,167$ 8,496$ 8,997$ 9,211$ 9,888$ Univ. of Houston - Clear Lake 5,532$ 5,798$ 6,188$ 6,508$ 6,514$ Univ. of Houston - Downtown 5,000$ 5,235$ 5,452$ 5,716$ 5,997$ Univ. of Houston - Victoria 5,220$ 5,400$ 5,604$ 5,828$ 6,117$ Univ. of North Texas 6,767$ 7,301$ 7,496$ 8,349$ 8,717$ Univ. of Texas - Arlington 7,780$ 8,186$ 8,500$ 8,878$ 8,878$ Univ. of Texas - Austin 8,532$ 8,930$ 9,418$ 9,794$ 9,792$ Univ. of Texas - Brownsville 5,258$ 5,498$ 5,715$ 5,994$ 6,153$ Univ. of Texas - Dallas 9,850$ 10,340$ 10,744$ 11,168$ 11,592$ Univ. of Texas - El Paso 5,924$ 6,224$ 6,537$ 6,869$ 7,018$ Univ. of Texas - Pan Am 5,125$ 5,425$ 5,699$ 5,978$ 6,124$ Univ. of Texas - Perm. Basin 4,934$ 5,599$ 6,021$ 6,302$ 6,458$ Univ. of Texas - San Antonio 7,100$ 7,527$ 8,410$ 8,783$ 8,419$ Univ. of Texas - Tyler 5,742$ 6,042$ 6,322$ 6,592$ 7,222$ West Texas A&M 5,312$ 5,732$ 6,282$ 6,282$ 6,730$
TEXAS STATE 6,994$ 7,482$ 7,838$ 8,232$ 8,772$
TX TEN LARGEST AVERAGE 7,114$ 7,528$ 7,967$ 8,339$ 9,084$ TEXAS AVERAGE 6,173$ 6,575$ 6,948$ 7,247$ 7,578$ U.S. MEDIAN 6,059$ 6,596$ 7,407$ 7,976$ 8,329$ Note: Tx Ten Largest excludes Texas State University. U.S. Median excludes District of ColumbiaSource: Chronicle of Higher Education web site. Trends in College Pricing, © 2011 The College Board. Based on College Board Survey which asks for tuition and fees charged by first-year full-time (15 SCH) for the academic year, then they weight the figures by enrollment to reflect costs incurred by the average undergraduate.

21 Office of Institutional Research
Attachment III
2012-2013 Tuition and Fees for Texas State and National Peers and Aspirants
In-State Out-of-StateUniversity Tuition Tuition
PeersCal State - Fresno 6,762$ 17,922$ Cal State - Fullerton 6,626$ 17,786$ Cal State - Sacramento 7,100$ 18,260$ Eastern Michigan 9,026$ 24,008$ Middle Tennessee 7,492$ 22,840$ San Francisco State 6,774$ 17,934$ San Jose State 7,427$ 18,587$ Univ. of Nevada - Las Vegas 6,585$ 20,495$ Univ. of North Texas 8,717$ 19,247$ Univ. of Texas - San Antonio 8,419$ 18,949$ Univ. of Texas - Arlington 8,878$ 19,408$
AspirantsBall State 8,980$ 23,650$ Bowling Green 10,514$ 17,822$ George Mason 9,620$ 27,764$ Illinois State 12,318$ 19,608$ Northern Illinois 11,484$ 20,377$ Kent State 9,672$ 17,632$ Northern Arizona 9,271$ 21,626$ Old Dominion 8,450$ 23,330$ Texas Tech 8,942$ 19,472$ Univ. of Wisconsin-Milwaukee 9,187$ 18,915$ Western Michigan 9,982$ 23,262$
TEXAS STATE 8,772$ 19,302$
PEER AVERAGE 7,619$ 19,585$ ASPIRANT AVERAGE 9,856$ 21,223$ PEER/ASPIRANT AVERAGE 8,738$ 20,404$ Note: Peer and Aspirant exclude Texas State University.Source: Chronicle of Higher Education web site.

22 Office of Institutional Research
Attachment IV
Average Tuition and Fees at Public Universities by StateFY 2013 2011 Pop
State Average Population RankAlabama 8,741$ 4,802,740 23Alaska 5,818$ 722,718 47Arizona 9,729$ 6,482,505 16Arkansas 6,968$ 2,937,979 32California 9,368$ 37,691,912 1Colorado 8,416$ 5,116,796 22Connecticut 9,630$ 3,580,709 29Delaware 10,890$ 907,135 45Florida 6,232$ 19,057,542 4Georgia 7,504$ 9,815,210 9Hawaii 8,665$ 1,374,810 40Idaho 5,991$ 1,584,985 39Illinois 12,118$ 12,869,257 5Indiana 8,704$ 6,516,922 15Iowa 7,830$ 3,062,309 30Kansas 7,277$ 2,871,238 33Kentucky 8,455$ 4,369,356 26Louisiana 5,812$ 4,574,836 25Maine 9,471$ 1,328,188 41Maryland 8,220$ 5,828,289 19Massachusetts 10,619$ 6,587,536 14Michigan 11,172$ 9,876,187 8Minnesota 10,388$ 5,344,861 21Mississippi 6,147$ 2,978,512 31Missouri 7,917$ 6,010,688 18Montana 6,139$ 998,199 44Nebraska 7,199$ 1,842,641 38Nevada 6,371$ 2,723,322 35New Hampshire 14,576$ 1,318,194 42New Jersey 12,399$ 8,821,155 11New Mexico 5,687$ 2,082,224 36New York 6,560$ 19,465,197 3North Carolina 6,220$ 9,656,401 10North Dakota 6,973$ 683,932 48Ohio 9,190$ 11,544,951 7Oklahoma 6,350$ 3,791,508 28Oregon 8,303$ 3,871,859 27Pennsylvania 12,330$ 12,742,886 6Rhode Island 10,849$ 1,051,302 43South Carolina 10,698$ 4,679,230 24South Dakota 7,082$ 824,082 46Tennessee 7,676$ 6,403,353 17Texas 8,354$ 25,674,681 2Utah 5,595$ 2,817,222 34Vermont 13,582$ 626,431 49Virginia 9,907$ 8,096,604 12Washington 10,774$ 6,830,038 13West Virginia 5,883$ 1,855,364 37Wisconsin 8,690$ 5,711,767 20Wyoming 4,278$ 568,158 50U.S. Median Tuition 8,329$ 310,973,921Note: Excludes District of ColumbiaSource: Average Tuition - Trends in College Pricing, © 2012 The College Board.
Population - 2011 Population Estimate, U.S. Census Bureau. (2012 Estimates to be published 12/12.)
23 Office of Institutional Research
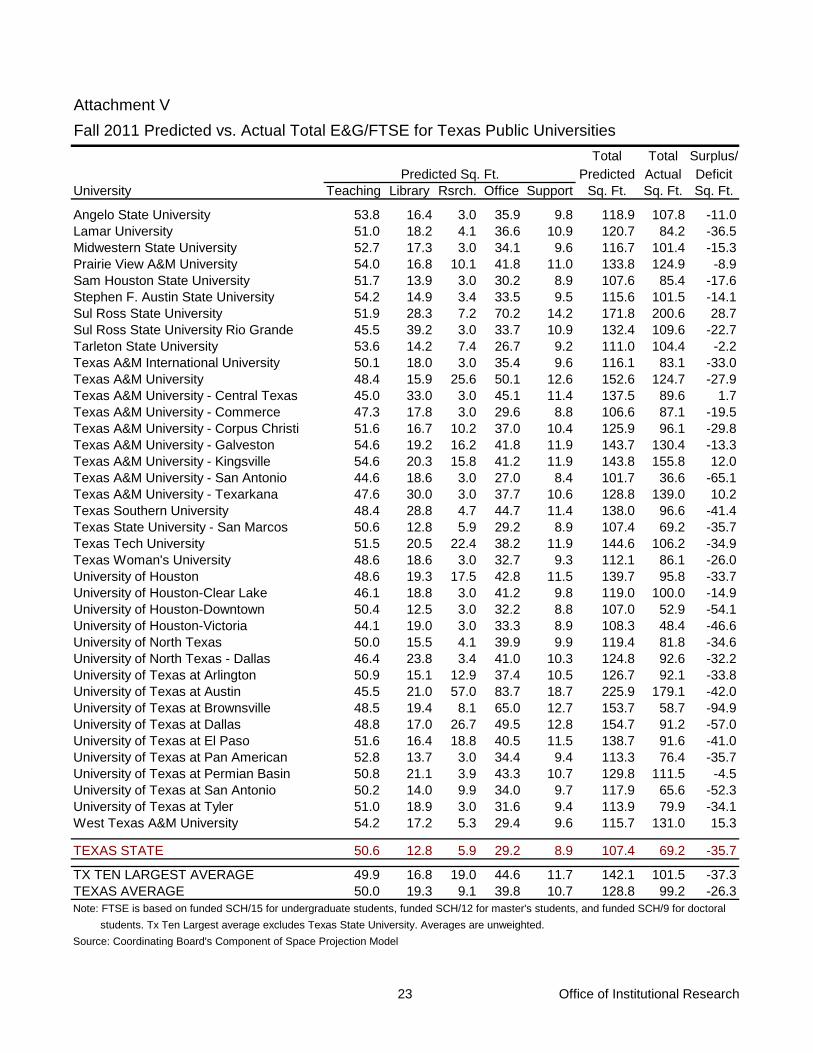
Attachment VFall 2011 Predicted vs. Actual Total E&G/FTSE for Texas Public Universities
Total Total Surplus/Predicted Actual Deficit
University Teaching Library Rsrch. Office Support Sq. Ft. Sq. Ft. Sq. Ft.
Angelo State University 53.8 16.4 3.0 35.9 9.8 118.9 107.8 -11.0Lamar University 51.0 18.2 4.1 36.6 10.9 120.7 84.2 -36.5Midwestern State University 52.7 17.3 3.0 34.1 9.6 116.7 101.4 -15.3Prairie View A&M University 54.0 16.8 10.1 41.8 11.0 133.8 124.9 -8.9Sam Houston State University 51.7 13.9 3.0 30.2 8.9 107.6 85.4 -17.6Stephen F. Austin State University 54.2 14.9 3.4 33.5 9.5 115.6 101.5 -14.1Sul Ross State University 51.9 28.3 7.2 70.2 14.2 171.8 200.6 28.7Sul Ross State University Rio Grande 45.5 39.2 3.0 33.7 10.9 132.4 109.6 -22.7Tarleton State University 53.6 14.2 7.4 26.7 9.2 111.0 104.4 -2.2Texas A&M International University 50.1 18.0 3.0 35.4 9.6 116.1 83.1 -33.0Texas A&M University 48.4 15.9 25.6 50.1 12.6 152.6 124.7 -27.9Texas A&M University - Central Texas 45.0 33.0 3.0 45.1 11.4 137.5 89.6 1.7Texas A&M University - Commerce 47.3 17.8 3.0 29.6 8.8 106.6 87.1 -19.5Texas A&M University - Corpus Christi 51.6 16.7 10.2 37.0 10.4 125.9 96.1 -29.8Texas A&M University - Galveston 54.6 19.2 16.2 41.8 11.9 143.7 130.4 -13.3Texas A&M University - Kingsville 54.6 20.3 15.8 41.2 11.9 143.8 155.8 12.0Texas A&M University - San Antonio 44.6 18.6 3.0 27.0 8.4 101.7 36.6 -65.1Texas A&M University - Texarkana 47.6 30.0 3.0 37.7 10.6 128.8 139.0 10.2Texas Southern University 48.4 28.8 4.7 44.7 11.4 138.0 96.6 -41.4Texas State University - San Marcos 50.6 12.8 5.9 29.2 8.9 107.4 69.2 -35.7Texas Tech University 51.5 20.5 22.4 38.2 11.9 144.6 106.2 -34.9Texas Woman's University 48.6 18.6 3.0 32.7 9.3 112.1 86.1 -26.0University of Houston 48.6 19.3 17.5 42.8 11.5 139.7 95.8 -33.7University of Houston-Clear Lake 46.1 18.8 3.0 41.2 9.8 119.0 100.0 -14.9University of Houston-Downtown 50.4 12.5 3.0 32.2 8.8 107.0 52.9 -54.1University of Houston-Victoria 44.1 19.0 3.0 33.3 8.9 108.3 48.4 -46.6University of North Texas 50.0 15.5 4.1 39.9 9.9 119.4 81.8 -34.6University of North Texas - Dallas 46.4 23.8 3.4 41.0 10.3 124.8 92.6 -32.2University of Texas at Arlington 50.9 15.1 12.9 37.4 10.5 126.7 92.1 -33.8University of Texas at Austin 45.5 21.0 57.0 83.7 18.7 225.9 179.1 -42.0University of Texas at Brownsville 48.5 19.4 8.1 65.0 12.7 153.7 58.7 -94.9University of Texas at Dallas 48.8 17.0 26.7 49.5 12.8 154.7 91.2 -57.0University of Texas at El Paso 51.6 16.4 18.8 40.5 11.5 138.7 91.6 -41.0University of Texas at Pan American 52.8 13.7 3.0 34.4 9.4 113.3 76.4 -35.7University of Texas at Permian Basin 50.8 21.1 3.9 43.3 10.7 129.8 111.5 -4.5University of Texas at San Antonio 50.2 14.0 9.9 34.0 9.7 117.9 65.6 -52.3University of Texas at Tyler 51.0 18.9 3.0 31.6 9.4 113.9 79.9 -34.1West Texas A&M University 54.2 17.2 5.3 29.4 9.6 115.7 131.0 15.3
TEXAS STATE 50.6 12.8 5.9 29.2 8.9 107.4 69.2 -35.7
TX TEN LARGEST AVERAGE 49.9 16.8 19.0 44.6 11.7 142.1 101.5 -37.3TEXAS AVERAGE 50.0 19.3 9.1 39.8 10.7 128.8 99.2 -26.3Note: FTSE is based on funded SCH/15 for undergraduate students, funded SCH/12 for master's students, and funded SCH/9 for doctoral students. Tx Ten Largest average excludes Texas State University. Averages are unweighted.Source: Coordinating Board's Component of Space Projection Model
Predicted Sq. Ft.

24 Office of Institutional Research
Attachment VIMajor Campus Construction 1999-2018
Type of Gross Parking ConstructionConstruction Completion Sq Ft Spaces Costs
Cogen Expansion, Phase I (chiller) New 1999 N/A N/A 1,206,399$ Cogen Expansion, Phase II (chiller & utility ext.) New 1999 N/A N/A 4,336,000$ Admissions Center Expansion New 2000 5,400 N/A 698,627$ West Campus Athletic Field New 2001 N/A N/A 1,589,975$ University Print Shop Rehab 2001 10,000 N/A 554,026$ ASB South Rehab 2001 N/A N/A 834,192$ Addition to LBJ Parking Garage New 2001 N/A N/A 2,339,069$ Campus Signage New 2001 N/A N/A 530,181$ Wetlands Boardwalk New 2001 N/A N/A 516,725$ Southeast Utility Extension New 2002 N/A N/A 806,776$ Cogen Expansion, Phase III Rehab 2002 N/A N/A 5,989,521$ Cogen Facility Upgrades New 2002 N/A N/A 1,706,854$ Nueces (USC) Renovation Rehab 2002 38,220 N/A 5,124,766$ Running Track - Football Field Improvements Rehab 2002 N/A N/A 995,000$ Athletic Facilities Improvements Phase I New/Rehab 2002 53,084 N/A 9,452,692$ MCS-Conversion of Offices to Labs Rehab 2002 3,000 N/A 809,939$ Residence Hall Renovations (code compliance): Phase I (Tower & Jackson) Phase II (College Inn) Rehab 2003 N/A N/A 17,660,510$ Spring Lake Dam Spillway Repairs Rehab 2003 N/A N/A 582,841$ Mitte Complex New 2003 240,326 N/A 45,966,510$ Technology I for Occ Ed Rehab 2004 5,163 N/A 400,000$ Business Building Parking Garage New 2004 475 N/A 3,829,104$ Strahan Coliseum Expansion New 2004 10,770 N/A 2,856,093$ Lantana Hall HVAC Improvements Rehab 2005 N/A N/A 527,993$ Alkek 1st Floor Renovation Rehab 2005 3,000 N/A 810,558$ Student Health Center New 2005 20,000 N/A 5,489,640$ Education Modifications New/Rehab 2005 65,595 N/A 5,619,073$ Baseball & Softball Fields-Drainage Improvements Rehab 2005 N/A N/A 494,629$ Health Science Center Renovation Rehab 2006 N/A N/A 1,381,699$ Renovation Inn Texas Rivers Ctr Phase I Rehab 2006 N/A N/A 3,289,000$ Round Rock Higher Education Center New 2005 127,000 1,000 28,455,630$ McCoy College of Business Building New 2006 127,000 N/A 23,567,675$ Cogen Chiller Replacement Rehab/New 2006 N/A N/A 1,149,600$ Fine Arts Feasibility Study New 2007 N/A N/A 280,000$ Commons Complex Renovation-Beretta Rehab 2007 N/A N/A 3,517,131$ Woods St-Jones Diner Upgrades New 9/2007 N/A N/A 344,538$ JC Kellam 1st Floor Renovation Rehab 4/2008 N/A N/A 235,865$ Mitte 5th Floor Finish Out New 5/2008 19,600 N/A 3,625,000$ Speck Street Parking Garage New 7/2008 N/A 721 14,938,183$ Trinity Renovation Rehab 1/2009 6,400 N/A 850,342$ Concho Green Projects New 12/2009 N/A N/A 3,033,830$ Cogen Expansion Rehab/New 12/2009 2,000 Tons N/A 8,918,143$ N. LBJ Bus Loop New 12/2009 N/A N/A 4,690,495$ Baseball and Softball Complex Improvements Rehab 3/2009 N/A N/A 8,883,311$ Student Recreation Center Addition Add/Renovation 5/2009 107,984 N/A 28,079,230$
COMPLETED CONSTRUCTIONProject

25 Office of Institutional Research
Attachment VI (Cont.)Type of Gross Parking Construction
Project Construction Completion Sq Ft Spaces CostsHarris Plant Rehab Rehab/New 8/2009 2,200 Tons N/A 8,786,361$ Alkek Library-7th Floor Renovation Rehab 9/2009 N/A N/A 962,144$ Jowers Center Renovation Rehab 8/2008 70,000 N/A 1,560,000$ Laurel Hall Renovation Rehab 8/2009 31,682 N/A 6,100,000$ Bobcat Stadium West Side Expansion New/Rehab 7/2010 N/A N/A 17,249,063$ Demolition-UPACC Demo 2010 N/A N/A 450,000$ Theatre - Renovation Rehab 01/2010 N/A N/A 2,038,734$ Family & Consumer Science Addition New 8/2010 29,900 N/A 9,343,944$ Matthews Street Parking Garage New 8/2010 N/A 900+ 20,669,493$ RRHEC #2 - Nursing New 8/2010 77,750 N/A 35,959,755$ Demolition Comanche Hills Apts Demo 5/2011 N/A N/A 253,000$ Bobcat Stadium - Track Relocation New 8/2011 N/A N/A 4,349,095$ Multipurpose Education Facility & Infrastructure New 8/2011 N/A N/A 2,123,576$ Research Greenhouse New 2/2011 1,280 3,072 1,650,951$ ALKEK Library Elevators Rehab 03/2012 N/A N/A 936,222$ Mitte Clean Room Renovation Rehab 3/2012 3,440 N/A 1,098,601$
370,498,304$
Undergraduate Academic Center New 6/2012 132,596 N/A 45,700,000$ Tomas Rivera/Student Ctr. Drive ------ 08/2012 N/A N/A 8,371,938$ Aquatic Ecosystem Restoration at Aquarena Rehab 8/2012 N/A N/A 2,749,000$ Lampasas Renovation Rehab 8/2012 9,565 N/A 4,094,783$ Electrical Infrastructure Upgrades New 12/2012 N/A N/A 11,800,000$ Research and Commercialization Center New 10/2012 16,000 N/A 6,950,000$ Dept of Housing & Residential Life Office Bldg New 8/2012 40-45,000 40-45 12,166,000$ North Campus Housing New 8/2012 190,047 N/A 46,125,712$ Commons Hall Renovation New 12/2012 N/A N/A 7,210,000$ Academic Services Building North Renovation Rehab 12/2012 16,070 N/A 985,500$ South Chill Plant New 1/2013 4,500 tons N/A 15,552,558$ University Street Parking Garage New 12/2012 8,000 telecom 455 17,693,818$ Brogdon Hall Renovation New 08/2013 N/A N/A 7,000,000$ South Campus Electrical Utility Upgrade New 09/2013 N/A N/A 6,000,000$ Bobcat Trail Mall Redevelopment New 2013 --- N/A 5,488,888$ Old Main Roof Replacement New 2013 39,880 N/A 3,500,000$ Utility Upgrades Bobcat Trail New 2013 N/A N/A 3,500,000$ Alkek Learning Commons New 2013 313,581 N/A 2,500,000$ Student Recreation Sports Field New 2013 270,000 N/A 2,100,000$ PAC - Grounds and Streets New 1/2014 N/A N/A 7,078,464$ Recital Hall and Theatre Center New 1/2014 62,750 N/A 42,918,807$ Psychology Renovation Rehab/New 2014 39,142 N/A 13,850,000$ West Campus Residence Life Housing New 8/2014 600 beds N/A 60,468,000$ Bobcat Stadium - South End Zone Expansion New 2014 N/A N/A 24,000,000$ Alumni Center (Program) New 2014 10,000 N/A 4,990,825$ Engineering and Sciences (Program) New 2014 94,253 N/A 93,000,000$ Music Building (Program) New 2014 109,582 N/A 56,705,000$
CONSTRUCTION IN PROGRESS

26 Office of Institutional Research
Attachment VI (Cont.)Type of Gross Parking Construction
Project Construction Completion Sq Ft Spaces CostsRRHEC Health Professions #1 (Program) New 2014 100,000 N/A 48,820,000$ RRHEC Health Professions #2 (Program) New 2014 86,588 N/A 31,900,000$ Cogeneration Plant Gas Turbines New 2014 3,600 N/A 45,000,000$ Jones Dining Hall Replacement New TBD 50,000 N/A 23,671,000$ Residence Life Housing: Hilltop Complex New 2014 83,343 N/A 62,281,000$ Vivarium New 2014 2,000 N/A 4,000,000$ Education Rsrch & Visitor Center-Aquarena Center New TBD 20,000 N/A 7,000,000$ Alkek Library Repository New TBD 13,000 N/A 5,920,000$ Cogen Addition Rehab/New 2015 10,000 N/A 4,055,408$ Old Main Exterior Repairs New 2016 39,880 N/A 7,000,000$ Performing Arts Center - Perf. Hall & Dance Studio New 2016 64,697 N/A 35,000,000$ RRHEC Parking Garage New 2018 TBD N/A 29,850,000$ Campus Bike Path-Spring Lake New TBD N/A N/A 1,883,535$ Bobcat Stadium - North Side Complex Addition 08/2012 33,000,000$
851,880,236$
GRAND TOTAL CONSTRUCTION 1,222,378,540$ Source: TxState Office of Finance and Support Services 08/2012.