boom or bust - american pet products association
TRANSCRIPT

BOOM OR BUST:Will The COVID Pet Spike Last?
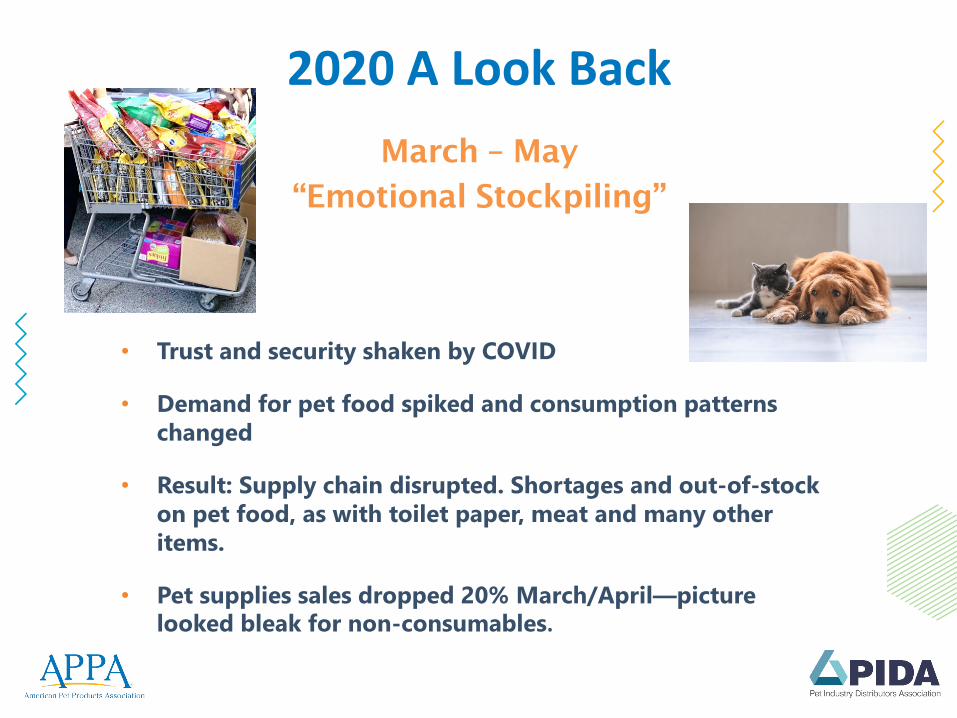
2020 A Look BackMarch – May
“Emotional Stockpiling”
• Trust and security shaken by COVID
• Demand for pet food spiked and consumption patterns changed
• Result: Supply chain disrupted. Shortages and out-of-stock on pet food, as with toilet paper, meat and many other items.
• Pet supplies sales dropped 20% March/April—picture looked bleak for non-consumables.
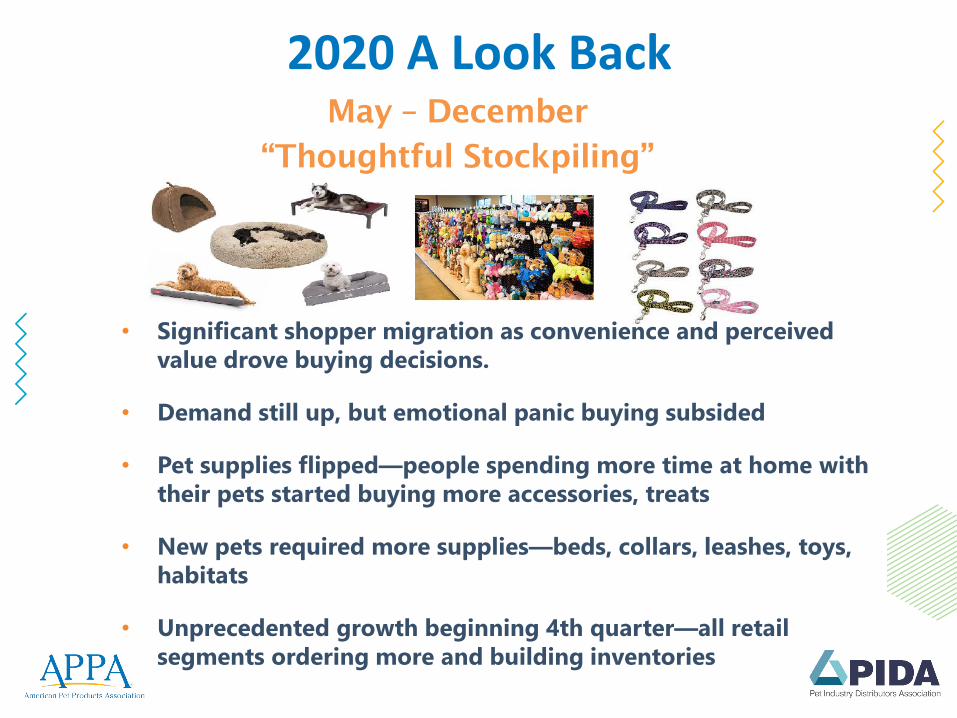
2020 A Look BackMay – December
“Thoughtful Stockpiling”
• Significant shopper migration as convenience and perceived value drove buying decisions.
• Demand still up, but emotional panic buying subsided
• Pet supplies flipped—people spending more time at home with their pets started buying more accessories, treats
• New pets required more supplies—beds, collars, leashes, toys, habitats
• Unprecedented growth beginning 4th quarter—all retail segments ordering more and building inventories
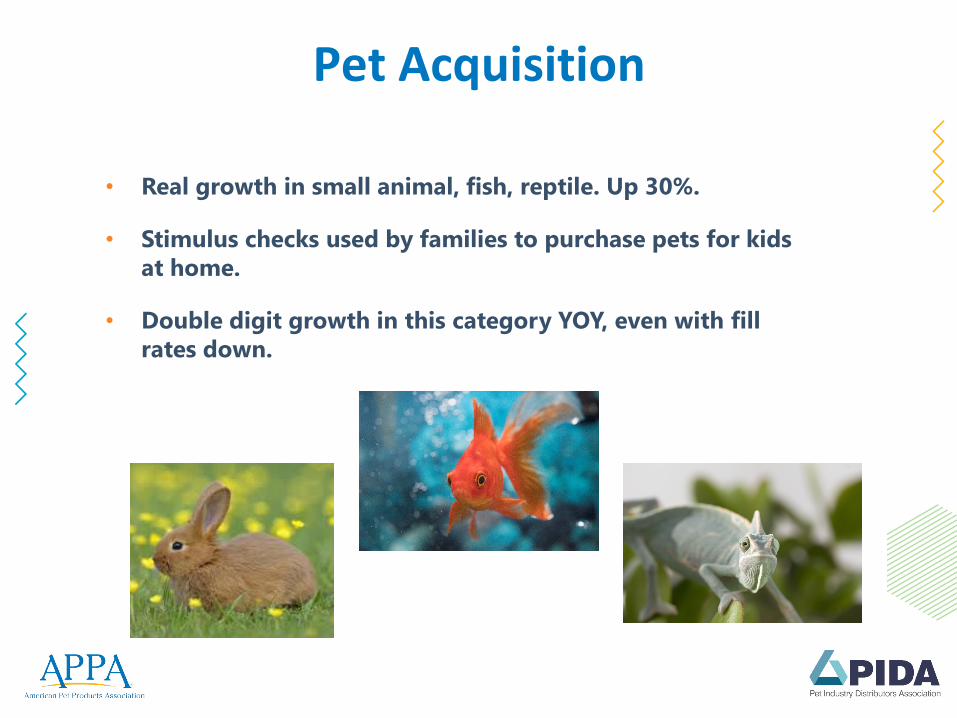
Pet Acquisition
• Real growth in small animal, fish, reptile. Up 30%.
• Stimulus checks used by families to purchase pets for kids at home.
• Double digit growth in this category YOY, even with fill rates down.
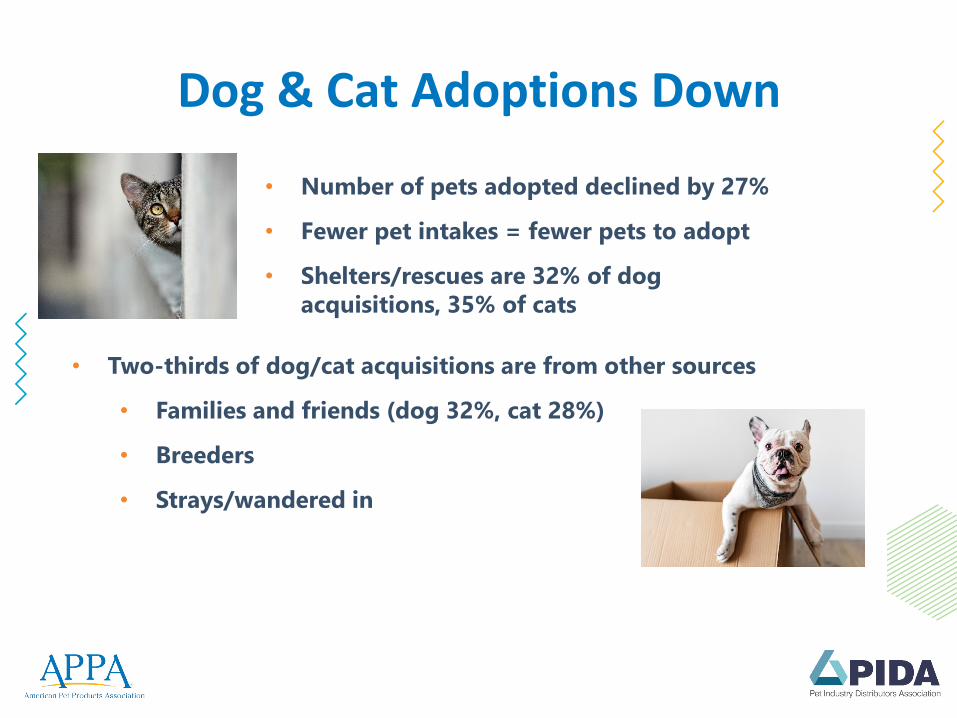
Dog & Cat Adoptions Down
• Number of pets adopted declined by 27%
• Fewer pet intakes = fewer pets to adopt
• Shelters/rescues are 32% of dog acquisitions, 35% of cats
• Two-thirds of dog/cat acquisitions are from other sources
• Families and friends (dog 32%, cat 28%)
• Breeders
• Strays/wandered in
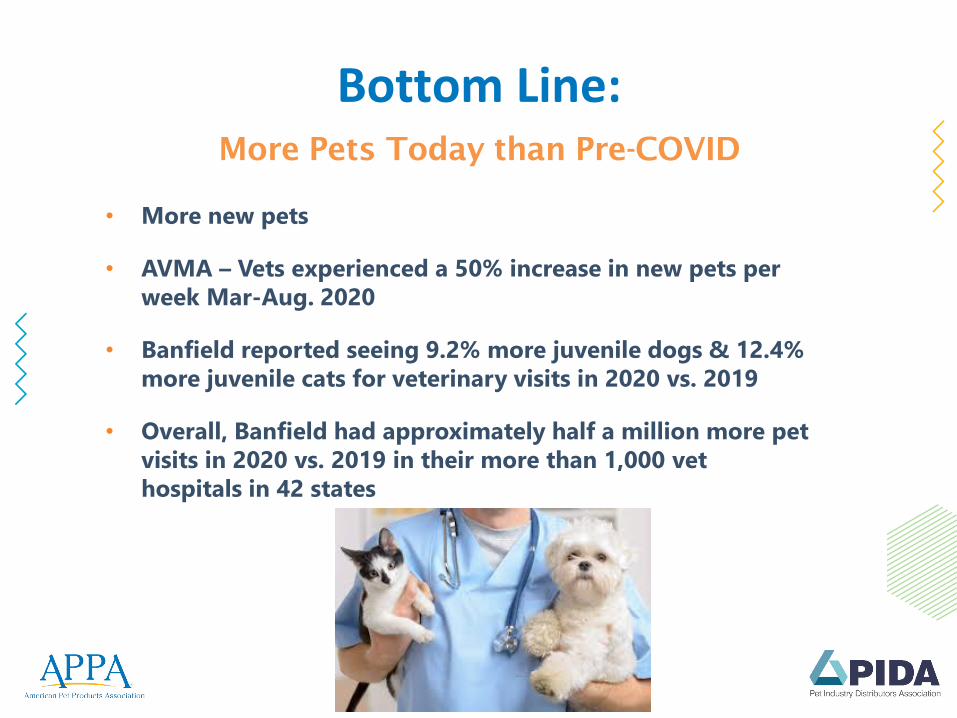
Bottom Line:
• More new pets
• AVMA – Vets experienced a 50% increase in new pets per week Mar-Aug. 2020
• Banfield reported seeing 9.2% more juvenile dogs & 12.4% more juvenile cats for veterinary visits in 2020 vs. 2019
• Overall, Banfield had approximately half a million more pet visits in 2020 vs. 2019 in their more than 1,000 vet hospitals in 42 states
More Pets Today than Pre-COVID
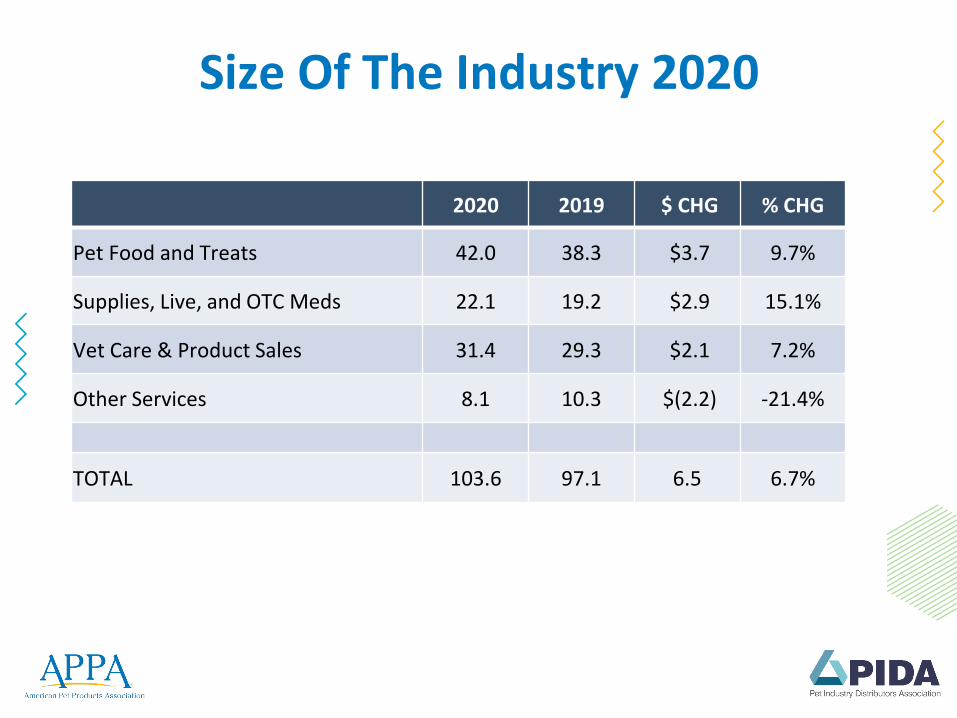
Size Of The Industry 2020
2020 2019 $ CHG % CHG
Pet Food and Treats 42.0 38.3 $3.7 9.7%
Supplies, Live, and OTC Meds 22.1 19.2 $2.9 15.1%
Vet Care & Product Sales 31.4 29.3 $2.1 7.2%
Other Services 8.1 10.3 $(2.2) -21.4%
TOTAL 103.6 97.1 6.5 6.7%
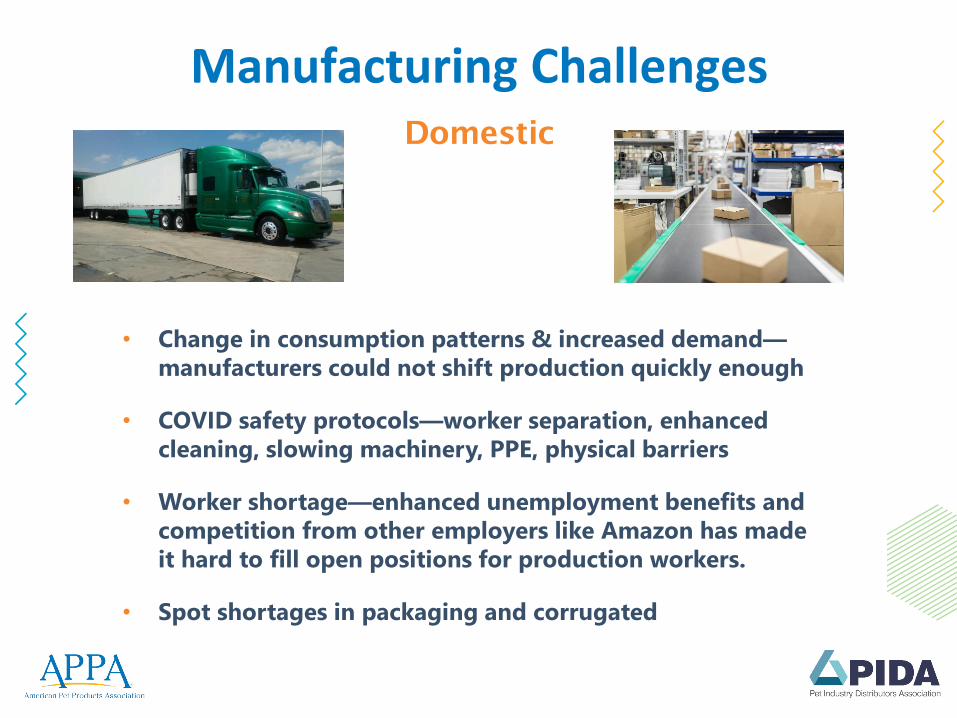
Manufacturing Challenges
• Change in consumption patterns & increased demand—manufacturers could not shift production quickly enough
• COVID safety protocols—worker separation, enhanced cleaning, slowing machinery, PPE, physical barriers
• Worker shortage—enhanced unemployment benefits and competition from other employers like Amazon has made it hard to fill open positions for production workers.
• Spot shortages in packaging and corrugated
Domestic
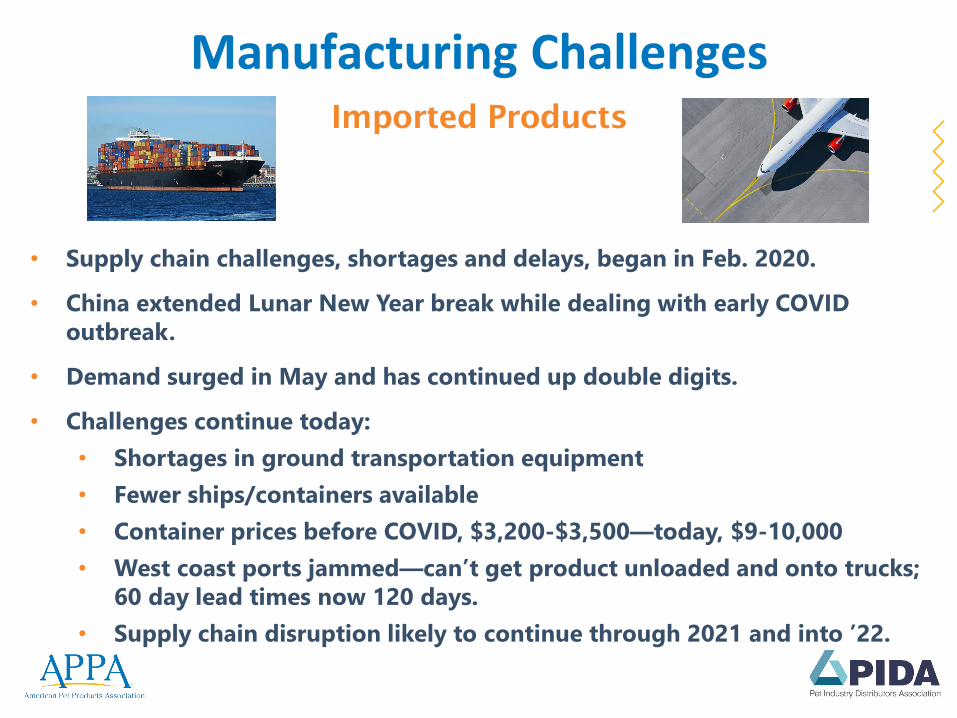
Manufacturing Challenges
• Supply chain challenges, shortages and delays, began in Feb. 2020.
• China extended Lunar New Year break while dealing with early COVID outbreak.
• Demand surged in May and has continued up double digits.
• Challenges continue today:• Shortages in ground transportation equipment• Fewer ships/containers available• Container prices before COVID, $3,200-$3,500—today, $9-10,000• West coast ports jammed—can’t get product unloaded and onto trucks;
60 day lead times now 120 days.• Supply chain disruption likely to continue through 2021 and into ’22.
Imported Products
Manufacturing Challenges
• Fill-rates dramatically impacted and not likely to improve in short term.
• Customer allocations likely to continue.
• Increased costs for shipping, raw materials will be passed along.
• Demand is real and not abating.
Bottom Line
Distributor Challenges• Increased stocking levels to buffer out-of-stocks,
transportation delays and longer lead times.
• Sales calls curtailed and shifted to Zoom and phone
• Harder to establish relationships with new accounts
• Gaining placement on new lines is more difficult. Retailers reluctant to add new lines and take inventory risk as customers spend less time shopping in store
Retail Support• Zoom training meetings with multiple stores and a single vendor.
• Evening “happy hours” with multiple stores sharing ideas and receiving training.
• Helping stores identify and carry products that are not found online or from manufacturers that focus on Brick & Mortar retailers.
• Increased online ordering for retailers.
• Focus on core fundamentals—strong fill rates, competitive prices, training, new lines.
• Overall, the positives are relationships did not change and Distributors’ business has been “strong and steady.”
Retail Channels
• Every channel is up.
• E-comm, Club, Farm/Fleet, FDM—skyrocketed
• 47% of pet owners report they increased the number of times they purchased pet products online in 2020
• Pet specialty and independent—good growth
• Total retail sales up 6.7% in 2020
• 30% of pet owners spent more on their pet/pet supplies in the past year; only 10% say they spent less
2021 Outlook
• Bullish outlook for this year & next.
• Growth projected at 5.8% for the year. Above historical averages.
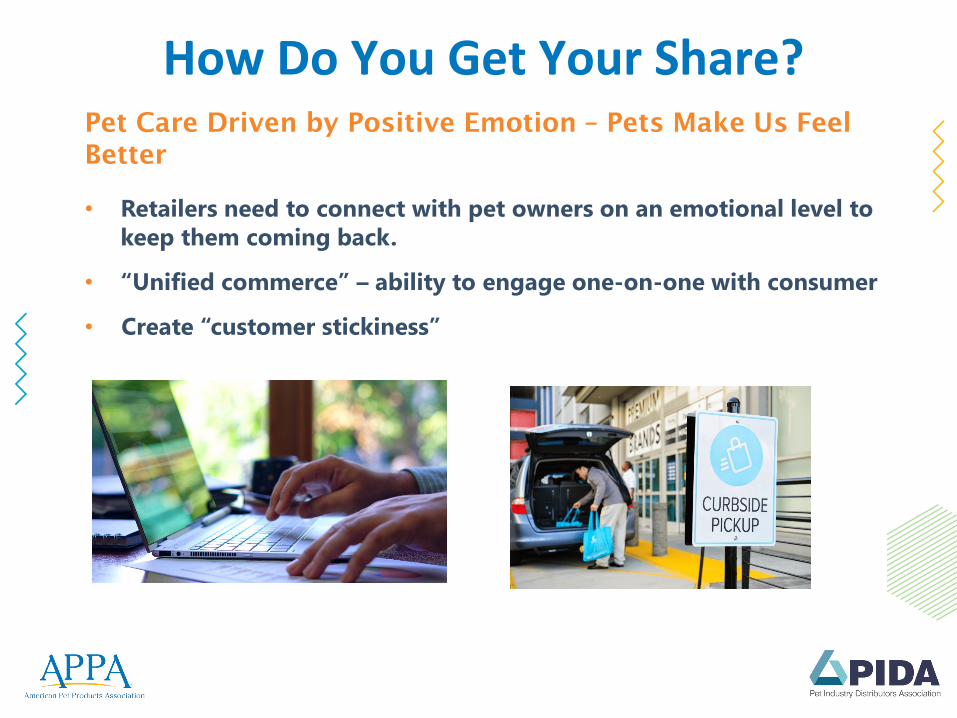
How Do You Get Your Share?Pet Care Driven by Positive Emotion – Pets Make Us Feel Better
• Retailers need to connect with pet owners on an emotional level to keep them coming back.
• “Unified commerce” – ability to engage one-on-one with consumer
• Create “customer stickiness”
Consumers Have Learned That They Don’t Need To Shop In A Store – It’s A Choice
• But if you give them a reason to, they will be loyal.
• Trends that are likely here to stay:• Buy online, pick-up in-store – same day beats most e-
comm sites• Across all categories, approximate 60%/40% split for
purchase item online, pickup up at store vs. delivered to home
• Loyalty benefits• Home delivery options
• Must have functional website to facilitate BOLPUS
Invest In Your Business Now!
• Be nimble – know what your customers need
• Convenience – “Puppy Pack” for new dog owners
• Don’t over-extend on inventory, but put big bets on what you need to serve your customers
• Services to drive traffic
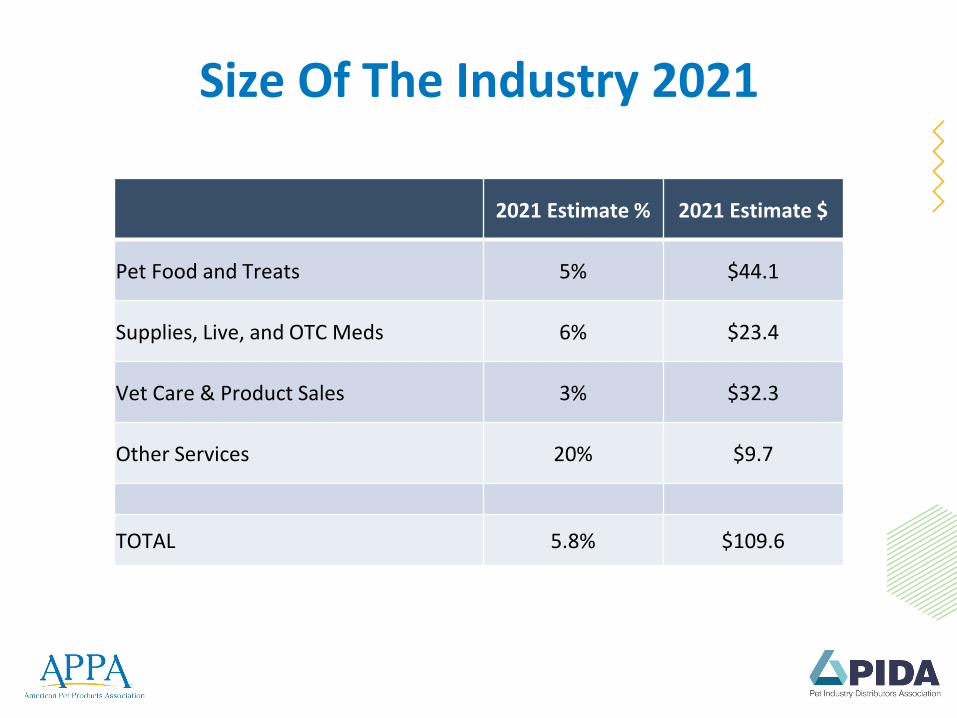
Size Of The Industry 2021
2021 Estimate % 2021 Estimate $
Pet Food and Treats 5% $44.1
Supplies, Live, and OTC Meds 6% $23.4
Vet Care & Product Sales 3% $32.3
Other Services 20% $9.7
TOTAL 5.8% $109.6