bonsucro outcome report 2017€¦ · bonsucro outcome report 2017 2 ... evidence collected through...
TRANSCRIPT

Bonsucro Outcome Report 2017 2
Bonsucro Outcome Report 2017 Version 1.0 June 2017
Bonsucro’s vision is a sugarcane sector with thriving, sustainable producer communities and resilient, assured supply chains.
Our mission is to ensure that responsible sugarcane production creates lasting value for the people, communities, businesses, economies and ecosystems in all cane-growing origins.
Bonsucro is a company registered in England and Wales, company number 06798568.
E&OE: information correct at time of publishing – June 2017
Authors: Nicolas Viart, Rafael Seixas, Nahuel Tunon
Photo credits: Cover page – Joe Woodruff/Bonsucro. Page 10 – Grupo Arcor. Page 12 – ED&F Man. Pages 29 & 30 - CAEI
© Bonsucro, 2017
Bonsucro Outcome Report 2017 3
Table of Contents
Executive summary...........................................................................................................4
In Numbers.......................................................................................................................5
Introduction .....................................................................................................................6
2020 Strategic Goals .........................................................................................................6
Organisational Performance Indicators .............................................................................7
Case Study: First Certified mill in Argentina ..................................................................... 10
Case Study: ED&F Man.................................................................................................... 12
Production and Market Uptake ....................................................................................... 13
Certification Data Findings .............................................................................................. 18
Case Study: the experience of CAEI’s Cristóbal Colón Mill ................................................ 29
Conclusions & Recommendations ................................................................................... 47
Relevant independent research (Annex 1) ....................................................................... 48
Methodology (Annex 2) .................................................................................................. 49
Key Monitoring & Evaluation Indicators (Annex 3) .......................................................... 51

Bonsucro Outcome Report 2017 4
EXECUTIVE SUMMARY 2016 was a remarkable year for Bonsucro and its members. Membership grew by 4.5%, and, the number of Bonsucro production certificates by 24%, with 12 new certified mills, including first certifications in Guatemala, Nicaragua, Dominican Republic and Thailand, more than doubling the countries which have Bonsucro certifications to a total of 9. Bonsucro also developed the Farmer Recognition Protocol, with 3 farms being recognised against the farm-only indicators. Although Bonsucro certified area has reduced from the previous study year, increases in yields of an average of 12% for non-irrigated systems and 1% for irrigated systems have led to an increase in the amount of certified output by 3.4%. Market results for certified products have also improved, as the uptake of certified products reached 15.5% of total certified production and key buyers have achieved important milestones towards meeting their sustainability commitments. On the production side, data shows that yields in certified mills have risen above the global FAO average, and so has mill efficiency. Water use has reduced by 40% in certified farms, and certified mills continue improving on water efficiency showing the lowest water use per ton of products to date. Agrochemical use remains a point of attention as it has roughly stayed at the same level, with a very slight increase in the use of herbicides. GHG savings were also positive: in 2015 certified mills have saved 285,000 tonnes of CO2 emissions. For the whole of the certification period since 2011, Bonsucro mills have saved the equivalent to the annual emissions of 611,732 passenger vehicles. The increase in certificates issued demonstrate the continue spread of good social performance as more operators are able to demonstrate compliance with core indicators in relation to labour rights, health & safety and compliance with local legislations. Where comparable data is available, for example in the accident frequency rate, and with qualitative evidence collected through the annual Bonsucro member survey, not only do we see strong improvements in social performance, but operators report that the Bonsucro Production Standard has helped in achieving these improvements. Finally, the report highlights the outcomes of Bonsucro’s work with the sugarcane sector. Through the collection and analyses of various production data, Bonsucro provides an insight into the performances of operators that have gone through an audit for certification. The information collected and reported here can then be leveraged by stakeholders of the sugarcane sector to inform their work and decisions. It also provides key information to other operators allowing them to access a database of verified performance and hence benchmark their own achievements. Internally, Bonsucro has successfully managed the beginning of its 2020 Strategy implementation. Key achievements in season 2015/16 were the publication of the Benchmarking Protocol (a milestone for the Benchmark & Endorsement Programme) and the partnership with Supply Shift to develop the new Bonsucro IT platform, Bonsucro Connect, which was recently launched.

Bonsucro Outcome Report 2017 5
IN NUMBERS

Bonsucro Outcome Report 2017 6
INTRODUCTION Every year, Bonsucro publishes its Outcome Report to provide stakeholders with a view on key improvements achieved by the sustainable sugarcane sector, made of operators which participate in the Bonsucro platform and/or achieve Bonsucro certification. It is based on analyses carried out by the Bonsucro secretariat using different sources of data. The report seeks to assess key monitoring & evaluation indicators (see Annex 3), to provide an evaluation of the performance of the organisation in delivering its mission and reaching its vision, and to identify the measurable outcomes directly achieved by operators. The scope of the Outcome Report considers 226 observations from 60 mills and 3 farmer associations in Australia, Brazil, Dominican Republic, Guatemala, Honduras, India, Nicaragua and Thailand, during the period between June 2011 and December 2016.
2020 STRATEGIC GOALS Bonsucro’s current strategy sets ambitious goals for the organisation in terms of scale and pace of the change it promotes for the sugarcane sector. It relies on the strong interactions of the work of global transformational programmes. By 2020, the organisation aims to achieve the three following objectives:
Assured Production
Assured Origins
Assured Supply Chains
50% land under cane globally
in an endorsed local improvement programme
(using FAO baseline - 2014)
Producers in 50% of cane
growing origins engaged in endorsed programmes
Definition: % of sugarcane producing countries with Bonsucro certifications,
Bonsucro Farm Recognitions, and Bonsucro endorsed improvement
programmes.
50%
internationally traded product with credible assurance
Current status:
4.06% 2.89%
from certifications and farm recognitions and 1.17% (estimated)
from benchmarked improvement programmes.
Current Status:
9.80% (10 countries of 102, based on FAO
baseline - 2014)
Current status:
0.9% - Sugar traded with credible
assurance
(estimated, considering Bonsucro certification only)
0.06% - Ethanol traded with credible
assurance (estimated, considering Bonsucro certification only)

Bonsucro Outcome Report 2017 7
ORGANISATIONAL PERFORMANCE INDICATORS
MEMBERSHIP
Membership is one of the key indicators for Bonsucro internally; it speaks to the convening power of Bonsucro as the global platform for sugarcane and the engagement of the sector in sustainability. Bonsucro evaluates that by the end of 2016 approximately 25% of the world’s sugarcane land was already engaged in the Bonsucro platform. Between 2015 and 2016 membership grew by 4.5% (+3.5% previous period).
Membership numbers have increased consistently since Bonsucro was set-up in 2008 and reached a record high, at 470 members in 42 countries in 2016.
An increase in membership took place in all membership classes, but not in a balanced way. The farmer membership class (introduced in 2012) is now by far the biggest membership class (69% of total membership), followed by industrial members (individual mills and mill groups, with 14% of total membership)
CERTIFICATIONS
In the same sense, certifications have also been increasing consistently, both for producers (certifications against the Bonsucro Production Standard) and for traders and end users (certifications against the Bonsucro Chain of Custody Standard).
17 22 3155
71
180
416454
470
0
50
100
150
200
250
300
350
400
450
500
2008 2009 2010 2011 2012 2013 2014 2015 2016
Bonsucro Membership
Members
Bonsucro Outcome Report 2017 8
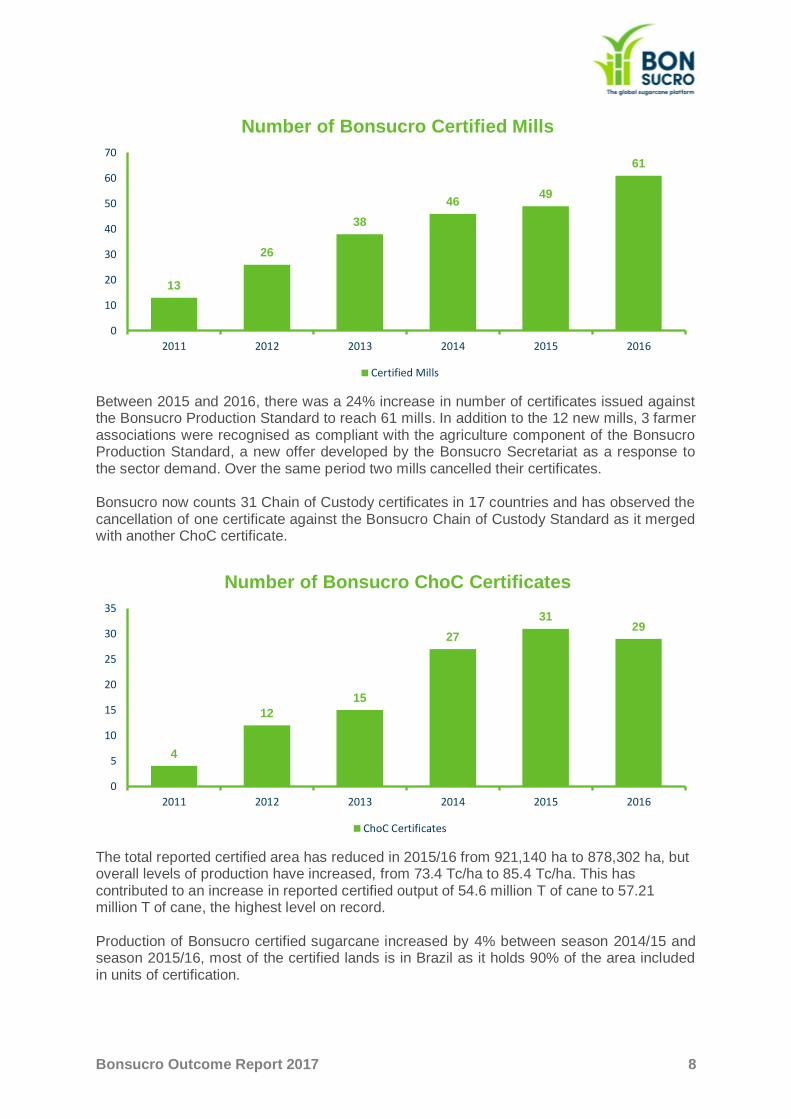
Between 2015 and 2016, there was a 24% increase in number of certificates issued against the Bonsucro Production Standard to reach 61 mills. In addition to the 12 new mills, 3 farmer associations were recognised as compliant with the agriculture component of the Bonsucro Production Standard, a new offer developed by the Bonsucro Secretariat as a response to the sector demand. Over the same period two mills cancelled their certificates. Bonsucro now counts 31 Chain of Custody certificates in 17 countries and has observed the cancellation of one certificate against the Bonsucro Chain of Custody Standard as it merged with another ChoC certificate.
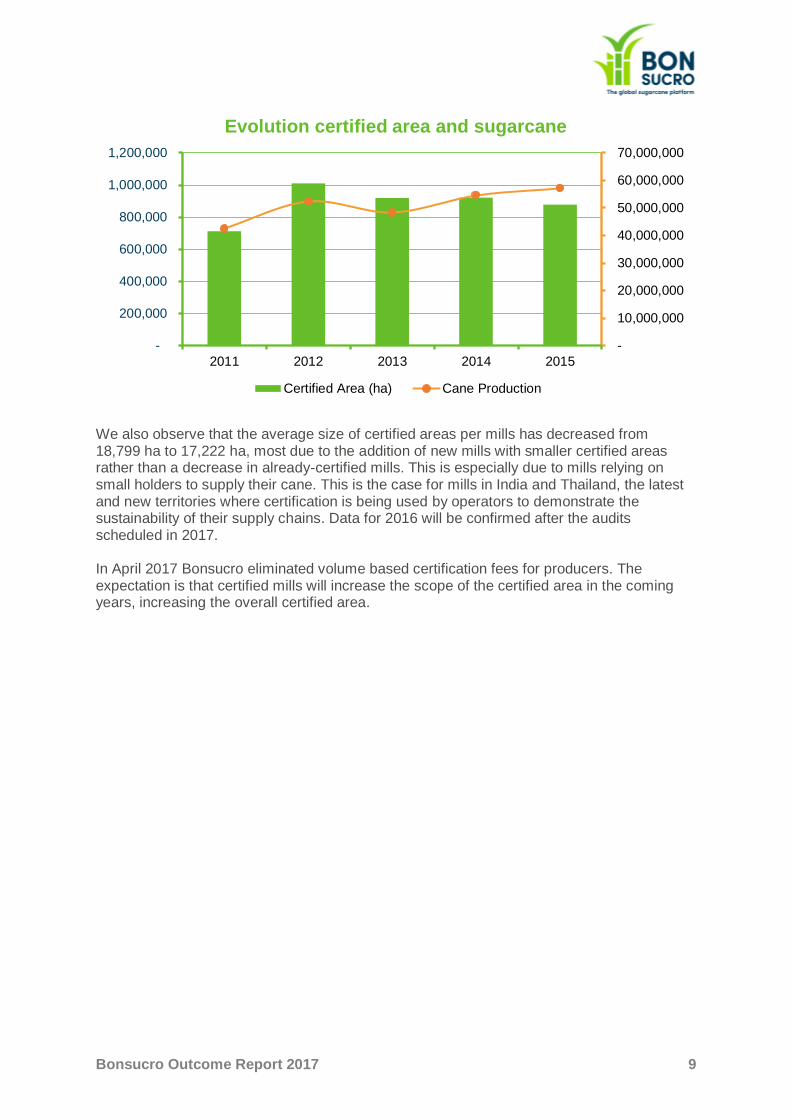
The total reported certified area has reduced in 2015/16 from 921,140 ha to 878,302 ha, but overall levels of production have increased, from 73.4 Tc/ha to 85.4 Tc/ha. This has contributed to an increase in reported certified output of 54.6 million T of cane to 57.21 million T of cane, the highest level on record. Production of Bonsucro certified sugarcane increased by 4% between season 2014/15 and season 2015/16, most of the certified lands is in Brazil as it holds 90% of the area included in units of certification.
13
26
38
4649
61
0
10
20
30
40
50
60
70
2011 2012 2013 2014 2015 2016
Number of Bonsucro Certified Mills
Certified Mills
4
12
15
27
3129
0
5
10
15
20
25
30
35
2011 2012 2013 2014 2015 2016
Number of Bonsucro ChoC Certificates
ChoC Certificates
Bonsucro Outcome Report 2017 9
We also observe that the average size of certified areas per mills has decreased from 18,799 ha to 17,222 ha, most due to the addition of new mills with smaller certified areas rather than a decrease in already-certified mills. This is especially due to mills relying on small holders to supply their cane. This is the case for mills in India and Thailand, the latest and new territories where certification is being used by operators to demonstrate the sustainability of their supply chains. Data for 2016 will be confirmed after the audits scheduled in 2017.
In April 2017 Bonsucro eliminated volume based certification fees for producers. The expectation is that certified mills will increase the scope of the certified area in the coming years, increasing the overall certified area.
-
10,000,000
20,000,000
30,000,000
40,000,000
50,000,000
60,000,000
70,000,000
-
200,000
400,000
600,000
800,000
1,000,000
1,200,000
2011 2012 2013 2014 2015
Evolution certified area and sugarcane
Certified Area (ha) Cane Production
Bonsucro Outcome Report 2017 10
CASE STUDY: FIRST CERTIFIED MILL IN ARGENTINA
GRUPO ARCOR’S INGENIO LA PROVIDENCIA
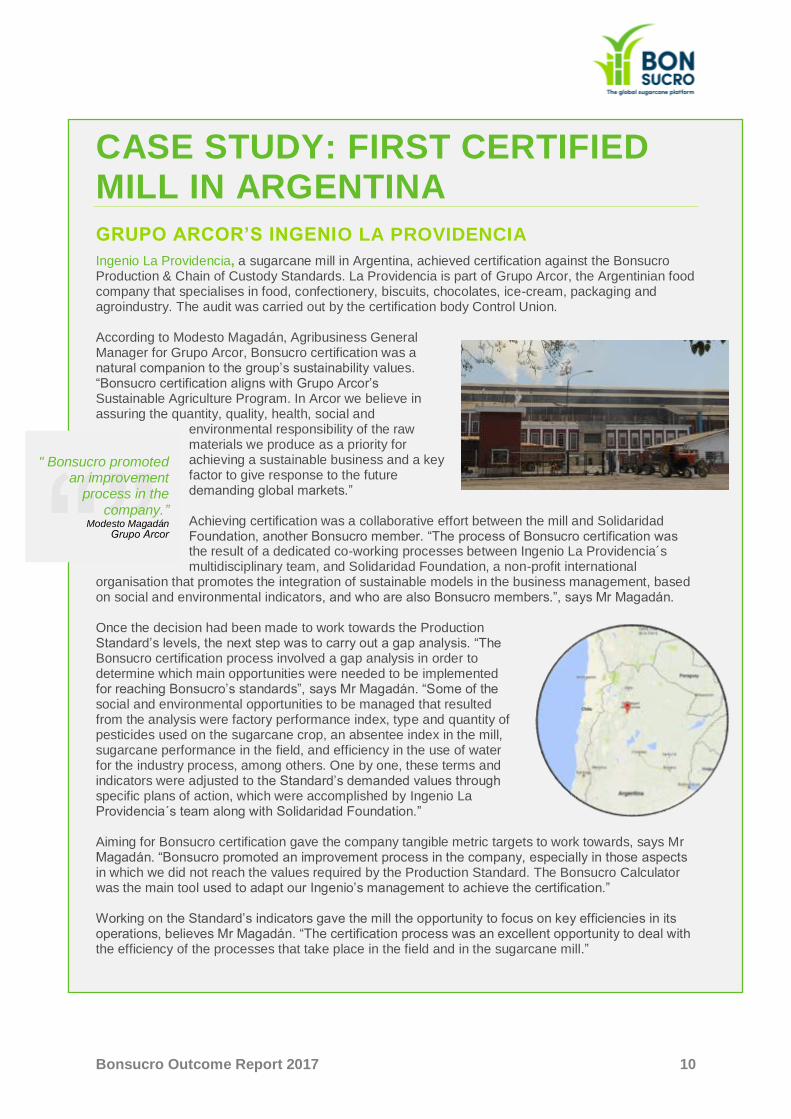
Ingenio La Providencia, a sugarcane mill in Argentina, achieved certification against the Bonsucro Production & Chain of Custody Standards. La Providencia is part of Grupo Arcor, the Argentinian food company that specialises in food, confectionery, biscuits, chocolates, ice-cream, packaging and agroindustry. The audit was carried out by the certification body Control Union.
According to Modesto Magadán, Agribusiness General Manager for Grupo Arcor, Bonsucro certification was a natural companion to the group’s sustainability values. “Bonsucro certification aligns with Grupo Arcor’s Sustainable Agriculture Program. In Arcor we believe in assuring the quantity, quality, health, social and
environmental responsibility of the raw materials we produce as a priority for achieving a sustainable business and a key factor to give response to the future demanding global markets.”
Achieving certification was a collaborative effort between the mill and Solidaridad Foundation, another Bonsucro member. “The process of Bonsucro certification was the result of a dedicated co-working processes between Ingenio La Providencia´s multidisciplinary team, and Solidaridad Foundation, a non-profit international
organisation that promotes the integration of sustainable models in the business management, based on social and environmental indicators, and who are also Bonsucro members.”, says Mr Magadán. Once the decision had been made to work towards the Production Standard’s levels, the next step was to carry out a gap analysis. “The Bonsucro certification process involved a gap analysis in order to determine which main opportunities were needed to be implemented for reaching Bonsucro’s standards”, says Mr Magadán. “Some of the social and environmental opportunities to be managed that resulted from the analysis were factory performance index, type and quantity of pesticides used on the sugarcane crop, an absentee index in the mill, sugarcane performance in the field, and efficiency in the use of water for the industry process, among others. One by one, these terms and indicators were adjusted to the Standard’s demanded values through specific plans of action, which were accomplished by Ingenio La Providencia´s team along with Solidaridad Foundation.”
Aiming for Bonsucro certification gave the company tangible metric targets to work towards, says Mr Magadán. “Bonsucro promoted an improvement process in the company, especially in those aspects in which we did not reach the values required by the Production Standard. The Bonsucro Calculator was the main tool used to adapt our Ingenio’s management to achieve the certification.”
Working on the Standard’s indicators gave the mill the opportunity to focus on key efficiencies in its operations, believes Mr Magadán. “The certification process was an excellent opportunity to deal with the efficiency of the processes that take place in the field and in the sugarcane mill.”
“”" Bonsucro promoted
an improvement process in the
company.” Modesto Magadán
Grupo Arcor

Bonsucro Outcome Report 2017 11
TRAININGS
Bonsucro’s training programme has been in effect since 2013, over this time more than 500 individuals have attended a Bonsucro training. Attending Bonsucro Expert / Auditor training (and passing the exam) is a pre-requisite to become a Bonsucro Licensed Auditor or Bonsucro Licensed Consultant. Many mills seeking certification also attend Bonsucro Expert / Auditor training to assist in the implementation of Bonsucro certification in their respective mills.
Currently there are 76 Bonsucro Licensed Auditors, present in 15 countries, in addition to 36 Auditors only licensed to carry out Chain of Custody Audits. In 2016, 27 new auditors have been trained along with 26 auditors to carry out Chain of Custody audits.
0
100
200
300
400
500
600
2013 2014 2015 2016
Number of participants trained by Bonsucro
Expert / Auditor Introduction Training ChoC Auditor
76
32
78
5
Training Participant By Category
Auditor
Consultant
Implementation Team
NGO/Civil Society
Bonsucro Outcome Report 2017 12
CASE STUDY: ED&F MAN Global trader ED&F Man has played a part in Bonsucro ever since it was founded. The 230-year-old company, headquartered in the UK, have renewed their commitment to Bonsucro and sustainable sugarcane production in a new member pledge, and last year they expanded their original Bonsucro Chain of Custody certificate to encompass more sites around the world. Their certificates, all issued by the licensed certification body Control Union, now cover trading, refining, blending and packing operations in Czech Republic, India, Israel, Singapore, the USA, Ukraine and the UK, as well as the international molasses trading operations in New Orleans and Amsterdam.
René Kleinjan, the company's Group HSEQ & CSR Manager, gives an insight into what's behind their longstanding commitment to Bonsucro and their recent sustainability work. According to René, one of the commodities at the heart of ED&F Man's business - sugarcane - must be sustainable, and Bonsucro certification is the way that this sector should be sustainable to secure its long-term future. “This is the culmination of what we’ve been doing for years to achieve high levels of sustainability across our products, and it was fantastic to have our hard work acknowledged by
such a respected independent body." One key driver of the company's sustainability work is the increasing demand from ED&F Man's clients for sustainably-sourced sugarcane products, explains René. "Our customers and industrial end users are also demanding sustainable sugar by 2020. So, getting a Bonsucro certification shows that we’re listening to their requirements, applying the highest standards to grow our sustainable supply chain, and we can meet their needs well into the future." ED&F Man's sustainability work has brought an array of benefits to the company, says René. "We’ve intensified our relationships with suppliers. Environmental, social and economic sustainability have always been priorities for us – across our commodities. This certification process has led to more regular dialogue with our suppliers to make sure we’re meeting these standards. We’re working even more closely and collaboratively with suppliers and producers in origin now to support a sustainable supply chain."
Playing an active role in Bonsucro since its foundation, ED&F Man has found working with the organisation to be invaluable to its CSR work, according to René. "Working with Bonsucro lets us contribute more to sustainable supply chain discussions, progress different priorities in our CSR policy, and meet our CSR objectives. We’ve built our reputation on operating responsibly, focusing on our clients and building trust; with
sustainable programmes, already in place for our coffee- and molasses-trading businesses, this certification is a clear sign of how importantly we take
this." "We’re aware of the importance of being a socially responsible company, and Bonsucro is a big part of that. As a founder member of Bonsucro, we’ve helped develop standards and promote the scheme to others. Our position as a Bonsucro board member, and now Members' Council representative, has helped us formulate our proactive approach to sustainability for years now, and this certification confirms the role we want to take in leading a sustainable future in commodity trading."
“” "We’re aware of the importance of being
a socially responsible company, and
Bonsucro is a big part of that.”
René Kleinjan
ED&F Man
“” "This is the culmination of what we’ve been doing for years to achieve high levels of sustainability across our products”
René Kleinjan
ED&F Man

Bonsucro Outcome Report 2017 13
PRODUCTION AND MARKET UPTAKE The increase in cane production resulted in increases in the production of certified sugar by 3.3% to 3.3 million tons and decrease of 8.3% of the production of certified ethanol, to 1.9 million m3.
1,241,315
1,755,026
2,616,658
3,206,900 3,317,575
-
500,000
1,000,000
1,500,000
2,000,000
2,500,000
3,000,000
3,500,000
2011 2012 2013 2014 2015
Certified Sugar
Volume (T)
720,266
1,105,372
1,950,416 2,074,499
1,902,261
-
500,000
1,000,000
1,500,000
2,000,000
2,500,000
2011 2012 2013 2014 2015
Certified Ethanol
Volume (m3)

Bonsucro Outcome Report 2017 14
Certified products can be sold following one of two possible processes – 1-) via physical sales covered by a valid Bonsucro Chain of Custody certification or 2-) via the trade of Bonsucro credits. Supply chains in sugarcane work in different ways when it comes to the number of intermediaries in the trading process:
• A) Mills -> end user (mills that sell directly to the final industrial customer)
• B) Mills -> traders -> end user (one or more intermediaries)
• C) Mills -> mill trading agent -> trader -> end user (Intermediaries + a mill trading agent, common in milling cooperatives). The mill trading agents are likely to purchase 100% of the mills’ production, irrespective of the market uptake further down the chain.
NOTE: It is important to mention that Bonsucro has now accounted for these three ways to report trades. This is a new way of reporting for Bonsucro, since before we didn’t use to discount reported “sales” to mill trading agents/cooperatives. Therefore, this year’s results cannot be compared to results presented in the Outcome Reports of previous years.
Market uptake is counted as reported sales (i.e. claimed volumes) of certified product in a given year; it refers to the certified product that was claimed to be sold as certified rather than sold as conventional product (discounting production used for automatic “sales” to trading agents and cooperatives, as described above). The total uptake of certified products reached 19.6% (from 14%) for sugar and 15.8% (from 10%) for ethanol. The results are positive as they confirm the increased demand for certified sugar, mostly driven by the commitment of major sugar buyers to their 2020 goals as published on the Bonsucro website.
1,241,315
1,755,026
2,616,658
3,206,900 3,317,575
6,659 34,763 157,422
451,806
652,764
-
500,000
1,000,000
1,500,000
2,000,000
2,500,000
3,000,000
3,500,000
2011 2012 2013 2014 2015
Certified Sugar Uptake
Production (T) Uptake (T)

Bonsucro Outcome Report 2017 15
The uptake of the ethanol market was more of a surprise as the difficult economic challenges and competition faced by the Brazilian ethanol versus the US corn ethanol predicted a less positive year for the operators. However, the demand has increased and the EU-recognised status of Bonsucro has supported this commercial achievement. It is important to recognise nonetheless, that the graphs above do not tell the whole story. One of the underlying issues preventing further market uptake is that the majority (90%) of production is in Brazil, whereas buyers of certified products are spread over several different countries, and trade regulations such as quotas, trade agreements, and other mechanisms, render not only availability but also location of certified products a crucial factor for uptake. In that sense, the level of uptake is explained not only by the level of demand, but also by trade limitations due to the origins of certified material. Bonsucro must work to enable availability of certified material in key origins, but also work with buyers in current certified countries to promote more local demand in those locations.
DYNAMICS OF TRADES
By monitoring the chain of custody certification and through the requirements to report volumes purchased and sold as certified, Bonsucro can evaluate the amount of sugar that is reported and claimed as sustainable and certified from the beginning of the chain (ex-mill) to the end (major end-users). Focusing on the sugar market, in 2014, the transparency of sugar trades (to the final user) was very limited, with only 5.48% of the certified sugar sold being claimed at the end of the chain. This has improved considerably in 2015 as 49% of certified volumes leaving mills were claimed by Bonsucro end-user members. This demonstrates an increased ability of end users to take hold of certified sugar through the set-up of completely certified supply chains, hence permitting the traceability of certified sugar volumes along the supply chain and an increased transparency of trades. On top of seeing an increase in the number of chain of custody certified companies, allowing certified products to flow across the supply chains, we also observed a more active participation of companies in trading certified products resulting in more certified products flowing along the chain from intermediaries to end users. In 2015, 865,501T of sugar were purchased by trading companies in the supply chain, of which 601,772 T were claimed by an
720,266
1,105,372
1,950,416 2,074,499
1,902,261
187,783
381,193 241,097 214,040
300,876
-
500,000
1,000,000
1,500,000
2,000,000
2,500,000
2011 2012 2013 2014 2015
Certified Ethanol Uptake
Production (m3) Uptake (m3)

Bonsucro Outcome Report 2017 16
end user. This represents transparency on 69% of trades (compared to 2.4% the previous year). The final 2016 data will only be known later in 2017. Bonsucro credits have continued to be purchased by supporters of sustainable production of sugarcane. In 2016, credits were purchased by two major Bonsucro members, Friesland Campina for the second time and by PT Labinta in Indonesia. In 2016, the level of purchases of sugar credits has decreased over 2015 to 36,753 T and no ethanol credits were purchased. This low result is a possible impact of the positive increase in demand for physical certified products. This is one of the expected outcomes of Bonsucro’s strategy to support physical trades by charging handling fees to credit trades (US$1.3/T). Whilst it was created to prevent the supply chain from meeting their sustainability sourcing policies solely by purchasing credits and therefore potentially only relying on large producers to supply them with sufficient credits and without focusing on engaging with their local outgrowers, the charges introduced by Bonsucro have created a general limitation in the overall trades of credits, resulting in a low level of uptake for credits. However, the fact that certification is now present in 9 countries and that many local mills (especially in Australia) have access to certification was a possible direct consequence on these strict restrictions on credit trades.
For the moment trades are not reported in real-time to Bonsucro, the volumes produced and traded are confirmed by auditors in the subsequent audit of a certified unit and reported back to Bonsucro. In other words, Bonsucro collects confirmed trade data up to one year after the trade took place1. This is expected to change in the coming year since Bonsucro is investing in the development of a new IT platform, Bonsucro Connect, which will support the monitoring of trades of certified products at a faster pace. This will inform millers, trading agents and end users of availability of certified products in a more proactive way allowing the market to adapt to demand. In any case, the data demonstrates that market indicators continue to improve year on year and that commitments from buyers of sugarcane based products to sustainable sourcing and to Bonsucro are playing an important role in driving market uptake for producers who invest in demonstrating their sustainability leadership by reaching the performance set in the
1 Compared to last year’s publication data may have been amended or corrected and numbers from previous years may have changed, it is also important to note that the pool of certified mills and data considered also changes each year.
3,262
252,992
76,278
162,000
36,753
1,353 -
50,000
100,000
150,000
200,000
250,000
300,000
2012 2013 2014 2015 2116
Sales of Credits
Sugar Credits (T) Ethanol Credits (T)

Bonsucro Outcome Report 2017 17
Bonsucro Production Standard. To continue supporting the demand, improvement and investment in the sector shall continue through the Bonsucro platform. Note that this report does not account for the trades of other sugarcane by-products such as molasses, as those are still marginal up to the end of 2016.
BONSUCRO EU RECOGNITION
The recognition of Bonsucro by the European Union has been a critical drive in the uptake of Bonsucro in Brazil and consequently by the sugarcane sector. At the end of season 2015/16, 35 of the 48 Brazilian certified mills produced 1,757,956 m3 of EU compliant ethanol. Around 20% of this ethanol was sold as certified to the supply chain. It is difficult to assess whether this ethanol made its way to Europe as, if it is the case, it is often purchased by companies covered by one of the other EU recognized certification schemes. Bonsucro then loses the ability to meaningfully collect traceability data. The lack of a European open registry of trades makes it even more complicated. However ePure reports that in 2015, 394,000 m3 of ethanol were imported into Europe (http://epure.org/media/1475/imports-duties.png) of which 49,000 m3 from Brazil (http://epure.org/media/1476/import-origins.png). It could be a reasonable assumption that most of these volumes could be Bonsucro EU certified.

Bonsucro Outcome Report 2017 18
CERTIFICATION DATA FINDINGS This section brings together the results and analyses from data received from certified farms and mills in the key areas of interest for monitoring & evaluation (see annexes for methodology and details). It highlights positive change and value creation in areas of important contribution to social, environmental and economic development of producers and communities in cane growing origins.
LAND RIGHTS
Securing a formal, legal system that determine who owns land, who can use the land, under what conditions and for how long is an instrumental part of promoting security, quality of life and livelihoods for the vast amount of people who rely on farming to survive. Major attention has been placed on these issues by a variety of publications and declarations, for example The Voluntary Guidelines on the Responsible Governance of Tenure (VGGT), the UN Sustainable Development Goals, The Universal Declaration of Human Rights and the UN Guiding Principles on Business and Human Rights all have addressed these. All certified mills and farms are required to provide evidence to demonstrate their lawful ownership or use of the land on which sugarcane is grown as well as disclose any ownership claims or open court cases from traditional or indigenous people contesting the use of land. All certified mills and farms have provided sufficient evidence regarding their lawful ownership or use of land and no claims on land within the scope of Bonsucro certification were recorded.
ENTERPRISE RESILIENCE
Enterprise resilience is central for continual economic development of producers and cane-growing communities. We measure enterprise resilience through metrics on the value created by sugarcane to mills and farmers as well as production efficiencies that enable increased production with fewer resources.
YIELDS
Yields are calculated as tonnes of sugarcane produced per hectare per year. During the season 2015/16 the average yields of Bonsucro certified producers have improved. They increased by 12% in dry (non-irrigated) systems and 1% in irrigated systems, both results being well above the latest global average yields reported by the Food and Agriculture Organisation of the United Nations (FAO) in 2014 (69.46 Tc/ha). The effects of weather are considered to be the most impactful as drought has reduced in Brazil allowing better achievements. Over 90% of certified mills have achieved yields above the individual targets set to them by the Bonsucro Standard, a great improvement from 2014/15, when already 79% of certified mills were able to achieve their yield targets.

Bonsucro Outcome Report 2017 19
In 2015, the main levers for the increase in average yields globally amongst certified mills were Australia and Brazil, where substantial productivity improvements were achieved.
Several factors may contribute to these achievements including better weather and soil conditions, diseases, age of cane, cane varieties and technological innovation. These are also very specific to each country and region. For the moment Bonsucro does not hold enough (representative) data from non-certified producers, it is therefore difficult to attribute changes to Bonsucro certification, nevertheless, in the latest Member Annual Survey of 2015, 50% of mills that reported productivity improvements in 2015 specifically pointed out that the Bonsucro Standard has contributed and/or accelerated those productivity improvements at the farms or mills. An analysis performed on Brazil’s Centre-South productivity has shown that certified mills in the region achieve on average 18% higher yields and show better resilience (i.e. higher
67.1 67.273 70.8
79.987
71
82.1 82.9
0
10
20
30
40
50
60
70
80
90
100
2011 2012 2013 214 2015
Yields (T cane/ha)
Yields (T cane/ha) Non Irrigated Yields (T cane/ha) Irrigated
Yields (T cane/ha) FAO (2014)
134.42
98.56 100.55
124.24
70.38 74.01 75.33 71.9584.99
0
20
40
60
80
100
120
140
160
2011 2012 2013 2014 2015 2011 2012 2013 2014 2015
Australia Brazil
Average Yield (Tc/ha)
Tc/h
a
Yields

Bonsucro Outcome Report 2017 20
gains and smaller losses) compared to the local average (study performed using Datagrodata, published by UNICA from a sample of 262 mills2).
Bonsucro has also strengthened the study of yield achievement by introducing in 2014 a sub categorisation of yields based on climatic zone. This has allowed determining an optimal yield for each of the 15 identified climatic zones around the globe using sound and published science3. The average yield achieved by operators has been compared to the average objective yields across the 15 climatic zones. The season 2015/16 saw the biggest yield gaps with operators producing on average an additional 37.5Tc/ha over their objectives (study carried out on rain-fed cane only). This equates to 19 million additional tonnes of cane produced on the same area of production.
2 Available at: http://www.unicadata.com.br/?idioma=2 3 Brauman, Kate A., and Nicolas Viart. "Development of a regionally sensitive water‐productivity indicator to identify sustainable practices for sugarcane growers." Integrated environmental assessment and management (2016).
22.1
-12.8
28.0 27.9
37.5
-20
-10
0
10
20
30
40
50
2011 2012 2013 2014 2015
Tc/h
a
Yield Gaps
2012 2013 2014 2015
Bonsucro yields 74.1 75.6 72.3 87.1
Centre-South (CS)
yields 65 69 61 67
Bonsucro vs
Centre-South (CS)
yields
+14% +9% +19% +30%
YoY Bonsucro
+2% -5% +17%
YoY CS
+7% -14% +9%
Bonsucro Outcome Report 2017 21
VALUE ADDED
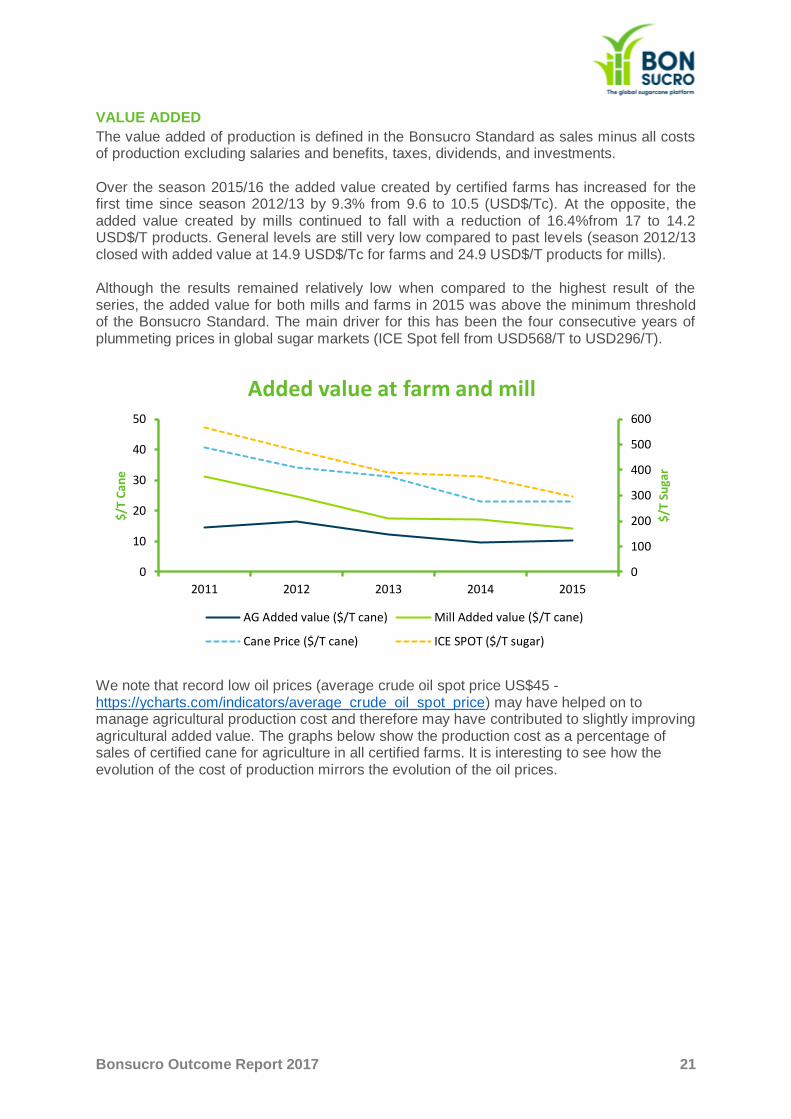
The value added of production is defined in the Bonsucro Standard as sales minus all costs of production excluding salaries and benefits, taxes, dividends, and investments. Over the season 2015/16 the added value created by certified farms has increased for the first time since season 2012/13 by 9.3% from 9.6 to 10.5 (USD$/Tc). At the opposite, the added value created by mills continued to fall with a reduction of 16.4%from 17 to 14.2 USD$/T products. General levels are still very low compared to past levels (season 2012/13 closed with added value at 14.9 USD$/Tc for farms and 24.9 USD$/T products for mills). Although the results remained relatively low when compared to the highest result of the series, the added value for both mills and farms in 2015 was above the minimum threshold of the Bonsucro Standard. The main driver for this has been the four consecutive years of plummeting prices in global sugar markets (ICE Spot fell from USD568/T to USD296/T).
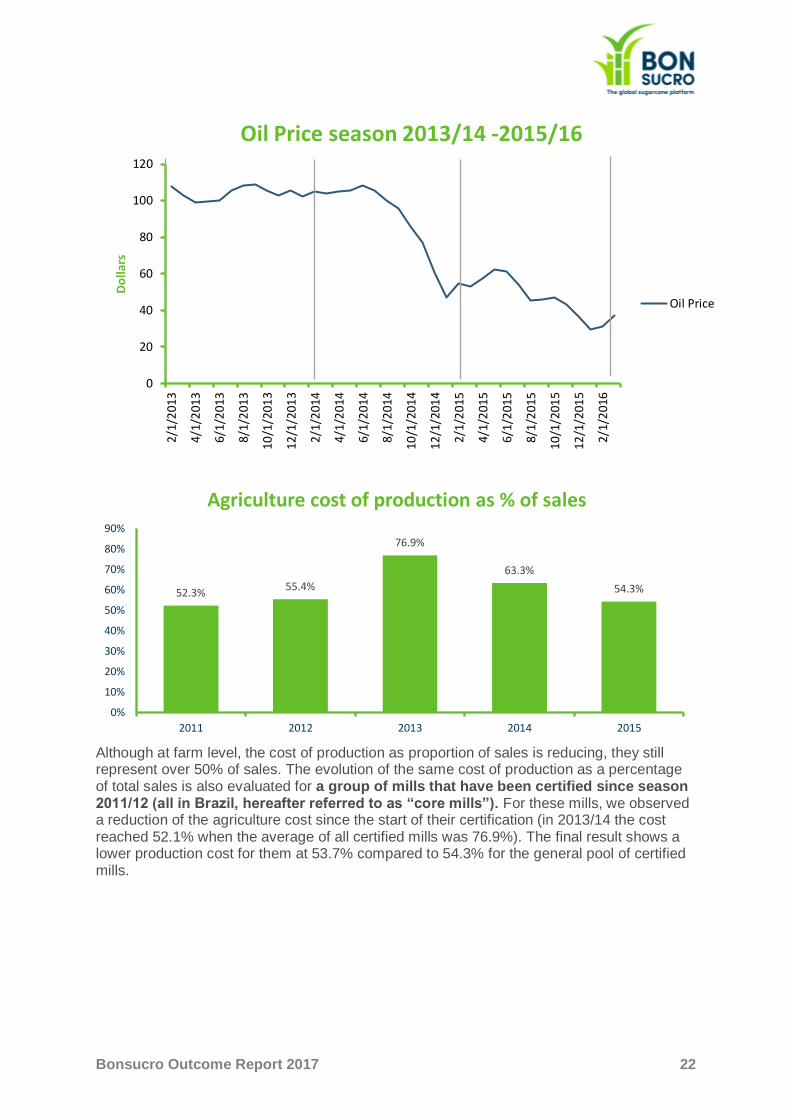
We note that record low oil prices (average crude oil spot price US$45 - https://ycharts.com/indicators/average_crude_oil_spot_price) may have helped on to manage agricultural production cost and therefore may have contributed to slightly improving agricultural added value. The graphs below show the production cost as a percentage of sales of certified cane for agriculture in all certified farms. It is interesting to see how the evolution of the cost of production mirrors the evolution of the oil prices.
0
100
200
300
400
500
600
0
10
20
30
40
50
2011 2012 2013 2014 2015
$/T
Suga
r
$/T
Can
e
Added value at farm and mill
AG Added value ($/T cane) Mill Added value ($/T cane)
Cane Price ($/T cane) ICE SPOT ($/T sugar)
Bonsucro Outcome Report 2017 22
Although at farm level, the cost of production as proportion of sales is reducing, they still represent over 50% of sales. The evolution of the same cost of production as a percentage of total sales is also evaluated for a group of mills that have been certified since season 2011/12 (all in Brazil, hereafter referred to as “core mills”). For these mills, we observed a reduction of the agriculture cost since the start of their certification (in 2013/14 the cost reached 52.1% when the average of all certified mills was 76.9%). The final result shows a lower production cost for them at 53.7% compared to 54.3% for the general pool of certified mills.
0
20
40
60
80
100
1202/
1/2
013
4/1/
201
3
6/1/
201
3
8/1/
201
3
10/1
/201
3
12/1
/201
3
2/1/
201
4
4/1/
201
4
6/1/
201
4
8/1/
201
4
10/1
/201
4
12/1
/201
4
2/1/
201
5
4/1/
201
5
6/1/
201
5
8/1/
201
5
10/1
/201
5
12/1
/201
5
2/1/
201
6
Do
llars
Oil Price season 2013/14 -2015/16
Oil Price
52.3%55.4%
76.9%
63.3%
54.3%
0%
10%
20%
30%
40%
50%
60%
70%
80%
90%
2011 2012 2013 2014 2015
Agriculture cost of production as % of sales

Bonsucro Outcome Report 2017 23
On the contrary, the cost of production at mill represents a fraction of the sales (including sugar, ethanol, bagasse, molasses and electricity): <10%. However, these costs have been continuously increasing for the last four seasons.
Whilst the cost has increased overtime for the Bonsucro certified mills, we observe that the mills that have been certified for the longer period of time (core Bonsucro certified mills) show the opposite trend demonstrating a better control over production costs, at least until 2015/16 where they increased again, but still remaining 1.6% lower than the average for other certified mills at 7.7%.
73.1%
57.8%52.1%
63.4%
53.7%
0%
10%
20%
30%
40%
50%
60%
70%
80%
90%
100%
2011 2012 2013 2014 2015
Agriculture cost of production as % of sales (core mills)
12.1%
6.9% 7.3% 7.6%
9.1%
0%
2%
4%
6%
8%
10%
12%
14%
2011 2012 2013 2014 2015
Mill % cost of production as total sales
Bonsucro Outcome Report 2017 24
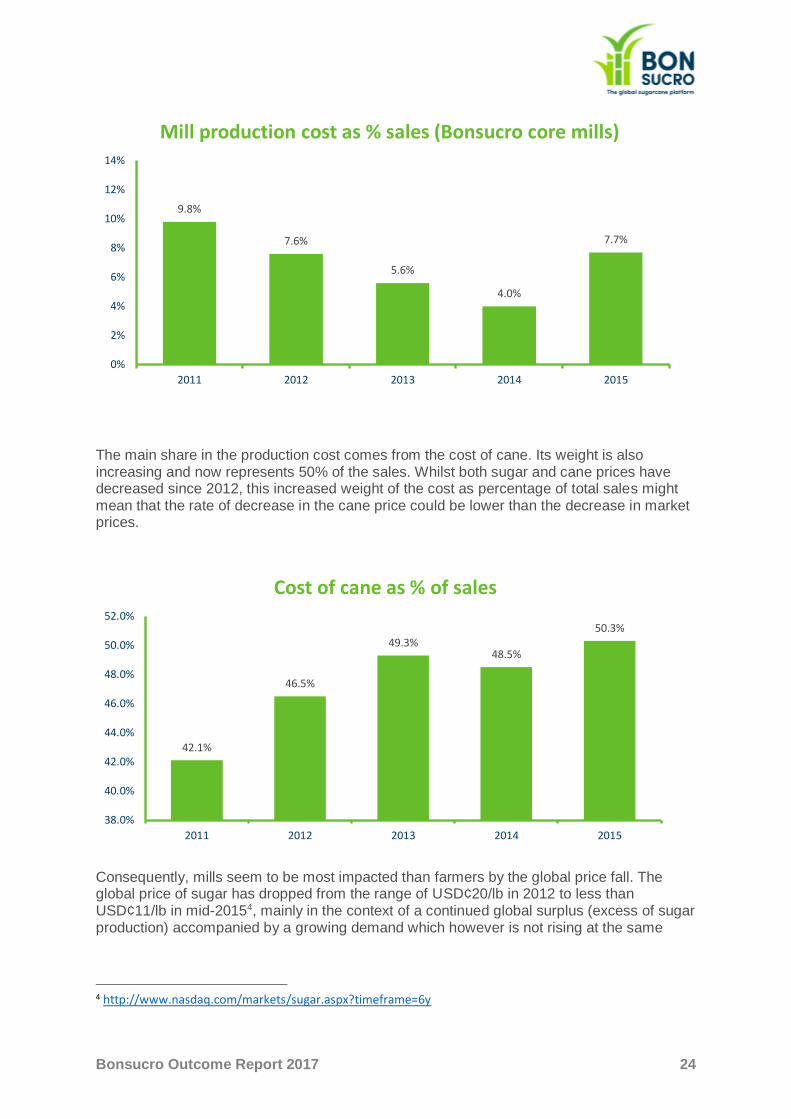
The main share in the production cost comes from the cost of cane. Its weight is also increasing and now represents 50% of the sales. Whilst both sugar and cane prices have decreased since 2012, this increased weight of the cost as percentage of total sales might mean that the rate of decrease in the cane price could be lower than the decrease in market prices.
Consequently, mills seem to be most impacted than farmers by the global price fall. The global price of sugar has dropped from the range of USD¢20/lb in 2012 to less than USD¢11/lb in mid-20154, mainly in the context of a continued global surplus (excess of sugar production) accompanied by a growing demand which however is not rising at the same
4 http://www.nasdaq.com/markets/sugar.aspx?timeframe=6y
9.8%
7.6%
5.6%
4.0%
7.7%
0%
2%
4%
6%
8%
10%
12%
14%
2011 2012 2013 2014 2015
Mill production cost as % sales (Bonsucro core mills)
42.1%
46.5%
49.3%48.5%
50.3%
38.0%
40.0%
42.0%
44.0%
46.0%
48.0%
50.0%
52.0%
2011 2012 2013 2014 2015
Cost of cane as % of sales

Bonsucro Outcome Report 2017 25
pace as the surplus5. Whilst cane price is also dropping, the fall is less intense partially due to the fact that governmental price control and/or support are common practices in countries where sugarcane is grown. With these governmental subsidies, trade tariffs /quotas, and other protections, production of sugarcane is, generally speaking, less exposed to global sugar price changes than other commodities sold on world markets. When comparing the two components to the volumes of sales, the production cost including cost of cane has increased from 53.4% to 59.4% since season 2012/13. Global forecast predict that the international price of sugar is to remain low due to the combined effect of overproduction and surplus (at the end of 2015-16 global sugar stocks were equivalent to over 40% of global annual demand6). With a continued support by government to sugarcane prices, mills will have to increase diversification of production and research of high value product production to increase their competitiveness. Some mills view accessing certification as a way to increase value for their production as well as a tool to improve their performance. The granularity of the data collected does not allow performing a very detailed analysis of the agricultural and milling costs of production. Further research is also required to analyse the impact of pricing and price support policies on added value to operators. Finally, more studies would allow evaluating how mills should adapt to cane prices and world sugar prices. Bonsucro should also strengthen the definition and the methodology to collect information related to costs of production. There is a risk of inconsistency of data collected bringing the data evaluated to be challenged. However, Bonsucro relies on a small number of bodies licensed to evaluate conformity against the standard (process which also involves evaluating the data collected). This increases the chance of consistency of practices amongst their clients. Consistency across the certification bodies is the next step in improving data collection.
MILL OVERALL TIME EFFICIENCY
Overall Time Efficiency is calculated as the percentage of total time (as in during the crushing season) in which the mill was effectively crushing cane; the closer to 1 (100%) the result is, the better. The Bonsucro Production Standard requires a minimum of 0.75 for overall time efficiency (i.e. it requires mills to operate at least 75% of the time during the crushing season). The analysis has been done by splitting the results per country (for countries with more than a single certified operator). We can see that results have improved considerably in 2015/16 in Brazil (to the highest level in the second series on record). At the contrary, Australian mills have slightly decreased their level to reach 88.3%. Australian mills have slightly higher result indicating higher level of utilisation of their assets, reduced down time. A deeper analysis of practices would allow identifying the best performers.
5 https://www.agra-net.com/agra/world-ethanol-and-biofuels-report/filedownloads/article467765.ece/BINARY/SO+2015+LR.pdf 6 http://www.agrimoney.com/feature/sugar-futures---will-2015-bring-an-end-to-their-losing-streak--349.html

Bonsucro Outcome Report 2017 26
When plotting the 2015 results per mills we observe that Australian mills (red dots) have a fairly consistent performance when compared to Brazilian mills, which have more varied performance from <75% to near 100%. There seems to be some level of correlation between the length of crushing season and the overall time efficiency level, whilst statistical analysis would be required to confirm this hypothesis. Observing the result can also help to identify best performers and by targeting a study it would possible to extract knowledge and series of recommendations on how performance can be achieved. A hypothesis to verify would be that longer seasons mean possible increase in machinery worn-out. Consequently, it might be possible to determine a preventive maintenance effort adapted to the length of the season.
84.0%79.2% 76.8%
83.5%
70.1%
81.5%
89.1% 88.5% 88.3%
0%
10%
20%
30%
40%
50%
60%
70%
80%
90%
100%
2011 2012 2013 2014 2015 2012 2013 2014 2015
Brazil Australia
Overall time efficiency
0.60
0.65
0.70
0.75
0.80
0.85
0.90
0.95
1.00
1.05
50.00 100.00 150.00 200.00 250.00 300.00 350.00
Number of Days
Time efficiency (%) vs length crushing season

Bonsucro Outcome Report 2017 27
As much as long crushing season can affect machines, there is also a possibility that it affects the workforce. The analysis of data allows us to also assess how the length of the crushing season is impacting the lost time due to unjustified absence (in % of hours lost) and accident rate (in number per million hours worked).
We also observe a possible correlation between the length of the crushing season and the impact on the work force. Whilst the length of the season cannot be reduced due to production imperatives, these results inform operators that preventive measures should be implemented to mitigate the effects of long seasons.
LABOUR RIGHTS
Labour rights form part of the Bonsucro’s Standard Core Criteria. Producers must comply with labour laws and observe the International Labour Organisation’s regulations on child labour, forced labour, absence of discrimination, freedom of association, minimum wage adherence, and worker safety. Child labour is a serious concern in some parts of the sector, as are health and safety hazards to workers, which include injuries from equipment or plants, repetitive action, overexposure to chemicals, sunlight or smoke, heat and long working hours.
0%
1%
2%
3%
4%
5%
6%
7%
8%
9%
50.00 100.00 150.00 200.00 250.00 300.00 350.00
Number of Days
Hours Lost (%) vs length of crushing season
-
2.00
4.00
6.00
8.00
10.00
12.00
50.00 100.00 150.00 200.00 250.00 300.00 350.00
Number of Days
Accident frequency per million hours vs crushing season

Bonsucro Outcome Report 2017 28
All certified mills demonstrated compliance with the requirements of the Bonsucro Production Standard with regards to minimum age of workers. Mills must not employ workers younger than 15 years old for non-hazardous work and must not employ workers younger than 18 years old for hazardous work. All of the 60 sugarcane mills certified against the Bonsucro Production Standard (considered in this report) have demonstrated through evidence, checked by independent auditors, the absence of any form of child and forced labour in their operations. Currently, Bonsucro certified mills and farms provide employment to 159,224 workers, being 91% men,9% women, and 80% of total workers working in farm operations. The estimated average household size in the countries where the mills operate is approximately 3.77 persons per household. If we consider that 1 person per family works in a Bonsucro certified operation, Bonsucro certified operators may have an important role in supporting up to 589,128 people, thousands of families and communities across cities where they operate. These mills are therefore a central engine for enabling social development in rural areas. Nearly all the mills have developed CSR programmes to support such local community development (investment in health services, education, sports…), however this specific criterion is not captured in the certification process. Other critical areas monitored by Bonsucro in the area of Labour Rights are: accidents’ frequency and workers’ wages in comparison with national minimum wage.
7 Calculated from latest available data per country (varies) from https://unstats.un.org/unsd/demographic/products/dyb/dyb_Household/4.pdf

Bonsucro Outcome Report 2017 29
CASE STUDY: THE EXPERIENCE OF CAEI’S CRISTÓBAL COLÓN MILL
REGULARISATION OF MIGRATION STATUS OF HAITIAN WORKERS IN THE DOMINICAN REPUBLIC
500 thousand unauthorized foreigners lived in the Dominican Republic (DR) in 2014 and as much as 375 thousand of those were working in the country. Prior to the 1990s the majority of Haitian immigrants were hired by the agricultural sector, including among others coffee, cocoa, bananas, cotton, tomatoes and the sugar industry, which back then had two private producers and 12 state-owned sugar mills In the 1990s the Dominican Government decided to privatize its sugar holdings and in 1999 the government completed the privatization and shutdown of government-owned sugar operations. In the DR there are now three main private groups that continue to produce sugar for domestic consumption and export. These mills employ approximately 16,000 Haitian workers in their harvesting and cultivation operations. In 2001, the government enacted a law creating the new Dominican Social Security System, which requires a national identification card for registration. In 2011 the implementation procedure for the Immigration law of 2004 was put into effect, changing the legal requirements by which the Dominican Immigration Directorate emitted work permits, including those provided to sugarcane workers. In 2011 the Immigration Directorate put into effect the new regulation for implementation of the Law of 2004, but the extensive requirements and high costs proved difficult for the workers to obtain a valid immigration status. “The legalization process proved to be difficult due to the identity papers required, costs involved, official procedure and a needed
understanding of the process.”8In 2013, the government took steps to remediate the
situation impacting foreign citizens without a legal migratory status. It instituted the National Plan for the Regularization of Foreign Nationals (PNRE, abbreviation in Spanish) and subsequently, in 2014, the government passed a law to establish a special regime that allowed undeclared children of foreign nationals to register in the civil registry and normalize their status, through the Naturalization Plan. “Relatively few employers actively helped their unauthorized workers to apply for PNRE regularization. CAEI was an exception, explaining to its employees the documents employees needed to regularize, provided
8 Aidenvironment. Case study on Consorcio Azucarero de Empresas Industriales (CAEI). Forthcoming (2017)

Bonsucro Outcome Report 2017 30
notaries to authenticate them, and had staff accompany employees to file their
applications.”9
CAEI arranged for workers to obtain identity documents required to apply to the PNRE, through the Haitian government’s Program of Identification and Documentation of Haitian Immigrants (PIDIH). Close to 750 CAEI workers requested their Haitian documentation package consisting of Haitian birth certificate, national identification card and passport. The company also facilitated workers to apply to the PNRE and obtain the regularisation documents that allow registration of Haitian citizens in the Dominican Social Security System and their children in the Dominican civil registry. The costs of the documentation, PNRE and Naturalization processes were all paid for by CAEI. According to CAEI’s Victoria Canto, Director of Sugarcane Communities: “We are very proud of the work carried out for regularization of our workers and their family members. This will enable a brighter future because they will have wider access to health care facilities, educational structures and pension benefits.”
9 Martin, Philip. CAEI and the Regularization of Haitians in the DR. UC-Davis. May, 2016:12.

Bonsucro Outcome Report 2017 31
WORKERS’ SAFETY
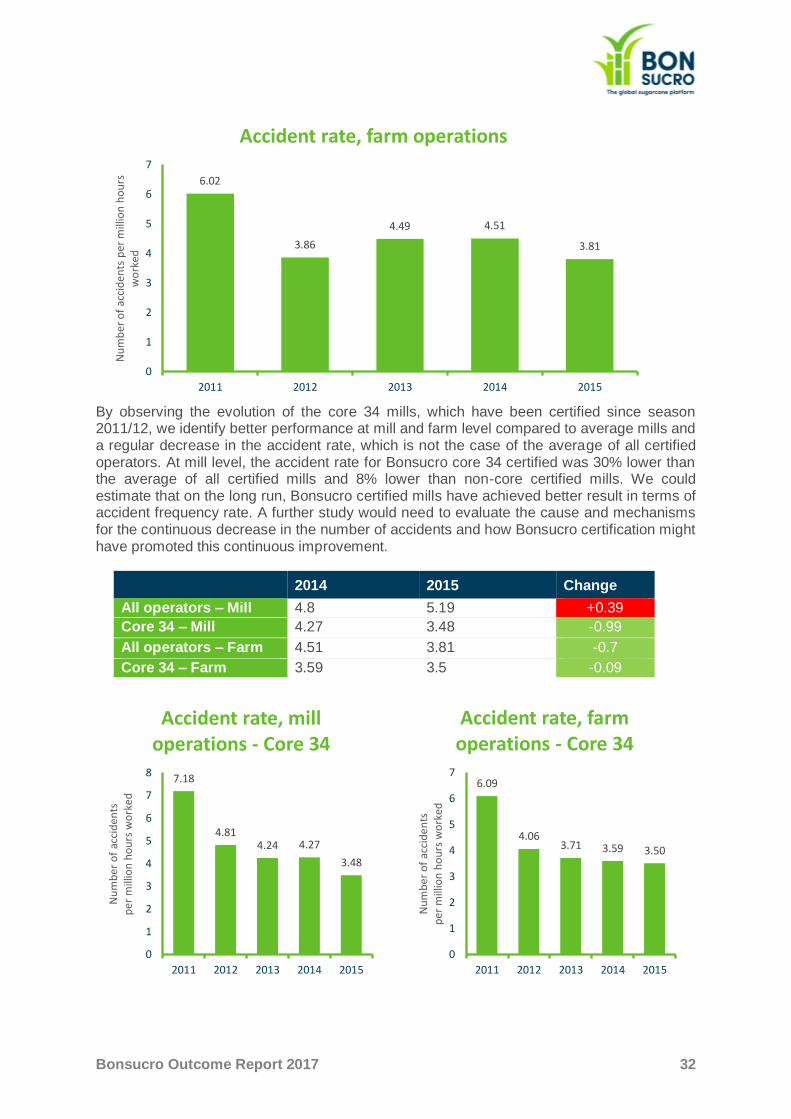
Working in sugarcane production may expose workers to fire hazards, toxic substances, repetitive action and overexposure to sunlight and heat stress for example. The ability of workers to perform their job safely and in a professional environment is an important pillar of social sustainability and economic sustainability for the employers. In the sugarcane sector, safe environment means having free access to training and to free, reliable and effective safety equipment as well as information on key risks and emergency procedures and protocols and, specifically for cane cutters, regular breaks and rests and access to potable water. Certified operators are assessed by independent auditors to ensure that the above items are well addressed in a Health & Safety Management Plan, and that workers receive the training needed at least once every 5 years, besides having free access to Personal Protective Equipment such as goggles, helmets, protection boots, ear plugs, and other necessary equipment to perform their functions. There are several indicators in the Bonsucro Production Standard that relate to workers’ safety, but for the purposes of public reporting Bonsucro focuses on accident rate at farms and mills. This is calculated as number of accidents per million hours worked. The Bonsucro Standard requires that certified producers do not exceed 15 accidents per million hours worked in the mill and 45 in the field (defined as injuries with subsequent worker absence). Although the standard was defined with higher levels of accident for farm operations, we note that results show a considerably lower accident rate for farm activities (3.81) than for mill activities (4.51).
6.98
7.62 7.74
4.85.19
0
1
2
3
4
5
6
7
8
9
2011 2012 2013 2014 2015
Nu
mb
er o
f ac
cid
ents
per
mill
ion
ho
urs
wo
rked
Accident rate, mill operations
Bonsucro Outcome Report 2017 32
By observing the evolution of the core 34 mills, which have been certified since season 2011/12, we identify better performance at mill and farm level compared to average mills and a regular decrease in the accident rate, which is not the case of the average of all certified operators. At mill level, the accident rate for Bonsucro core 34 certified was 30% lower than the average of all certified mills and 8% lower than non-core certified mills. We could estimate that on the long run, Bonsucro certified mills have achieved better result in terms of accident frequency rate. A further study would need to evaluate the cause and mechanisms for the continuous decrease in the number of accidents and how Bonsucro certification might have promoted this continuous improvement.
2014 2015 Change
All operators – Mill 4.8 5.19 +0.39
Core 34 – Mill 4.27 3.48 -0.99
All operators – Farm 4.51 3.81 -0.7
Core 34 – Farm 3.59 3.5 -0.09
6.02
3.86
4.49 4.51
3.81
0
1
2
3
4
5
6
7
2011 2012 2013 2014 2015
Nu
mb
er
of
acci
de
nts
pe
r m
illio
n h
ou
rs
wo
rked
Accident rate, farm operations
7.18
4.814.24 4.27
3.48
0
1
2
3
4
5
6
7
8
2011 2012 2013 2014 2015
Nu
mb
er
of
acci
de
nts
p
er
mill
ion
ho
urs
wo
rked
Accident rate, mill operations - Core 34
6.09
4.063.71 3.59 3.50
0
1
2
3
4
5
6
7
2011 2012 2013 2014 2015
Nu
mb
er
of
acci
de
nts
p
er
mill
ion
ho
urs
wo
rked
Accident rate, farm operations - Core 34

Bonsucro Outcome Report 2017 33
In the 2016 Members’ Annual Report, 56% of the mills that reported health and safety improvements said that the Bonsucro Production Standard either contributed or accelerated that improvement. This is confirmed by the data from certification. We note that 93.5% of certified industrial operations have complied with the requirements of the Standard (the few mils that did not achieve the target are required to carry out time-bound corrective action plans to address them for the subsequent audit-period), whereas in the agricultural side of operations, 100% of certified farms have complied with the requirements. These numbers may demonstrate the level of professionalization and attention to Health & Safety plans and procedures in certified sugarcane operators.
MINIMUM WAGE
The Bonsucro Production Standard requires that certified operators must as a minimum follow the local or national minimum wage for all workers. This core condition applies to direct employees but also to any subcontracted workers who work on the premises of the certified operations. Certified mills report their lowest wage rate in relation to the national minimum wage, which is then checked by independent auditors through evidence of payslips and other records. In 2015, wages paid both at agricultural and industrial operations of certified mills remained above the minimum wage threshold (at 19% above the minimum wage); nonetheless, they have reached their lowest levels since the Bonsucro data collection begun.
In agriculture, the average lowest salary ratio to minimum wagehas decreased from itshighest level in 2013 (at 28% higher than the local minimum wage) and have reached their lowest level in 2015 (at 19% higher than the local minimum wage). Likewise, salaries at mills have also faced average ratio decrease. Lowest salaries at mills have a decreased ratio to minimum wage from their highest levels in 2013 (at 33% higher than the local minimum wage) to their lowest level in 2015 (at 24% higher than the minimum wage). When comparing the evolution of a representative sample of certified mills certified since 2012 across the period, we observe a similar trend of increase and decrease. However, we
1.24
1.27 1.271.26
1.231.23
1.26
1.28
1.21.21
1.16
1.18
1.2
1.22
1.24
1.26
1.28
1.3
2011 2012 2013 2014 2015Rat
io o
f lo
wes
t w
age
to m
inim
um
wag
e
Ratio wage (All Farms vs Core 34)
Ratio wage (%) - Farm core 34 Ratio wage (%) - Farm all

Bonsucro Outcome Report 2017 34
observe that the representative sample of core mills (certified for the whole of the period) is generally achieving higher ratios to minimum wage than mills certified for less time. The trend is also observed at farm level (+1.6% in 2015 for farm workers - +1.5% at mill level). This denotes a higher attractiveness to workers of these mills compared to the average certified mill but also the overall long-term commitment to better share the added value created with the workers.
The overall decline in the lowest wage ratio may be a result of difficult market conditions (price retraction globally) as well as more country-specific issues (for example financial and political crises in Brazil). However, the same trend was observed in two countries where certification has occurred, for example in the cases of Brazil and Australia. The indicator provides an answer on how operators are comparing in terms of paying legal minimum wage and how supportive they are of their country legislation. The comparison across country shall not let think that Australian wages are at the same level than Brazilian wages, as the indicator evaluates a ratio compared to legal minimum wage. As Australian mills pay a wages closest to the legal minimum wage, this might mean that the legal minimum wage in Australia is sufficient to attract workers and support their livelihood and/or that the level of minimum legal wage constitutes a barrier to further increase. Bonsucro indicators do not help assessing whether wages are in line with living wages. Further investigation and study by Bonsucro would be required to evaluate if the indicator has a positive impact on communities in which farms and mills are located.
1.27
1.3
1.4
1.35
1.32
1.26
1.29
1.33
1.27
1.3
1.15
1.2
1.25
1.3
1.35
1.4
1.45
2011 2012 2013 2014 2015Rat
io o
f lo
wes
t w
age
to m
inim
um
wag
e
Ratio of lowest wage to minimum wage (all mills vs core 34)
Ratio wage (%) - Core 34 Ratio wage (%) - Mill all

Bonsucro Outcome Report 2017 35
Wages are still an area to be explored by Bonsucro in terms of understanding impacts. Due to its intrinsic relationship with household welfare and purchasing power it is one of the key indicators related to human development within the Bonsucro context. Bonsucro should look to benchmark results of certified mills with non-certified mills and also cross-sector to see whether there are differences in terms of economic resilience and sugarcane operators’ ability to offer attractive wages to workers under changing economic circumstances. This is particularly important in a growing number of regions which regularly report shortage of staff, especially in agricultural operations. The power of benchmarking salaries could be used by operators to identify their own attractiveness against peers and adapt their strategy to recruit and retain talents.
ENVIRONMENTAL SUSTAINABILITY
CLIMATE CHANGE10
By 2050 the world’s population will reach 9 billion, urbanisation will continue to rise at an accelerated pace, and income levels will be many multiples of what they are now. In order to feed this larger, more urban and richer population, farmers must produce more food per unit of land, water, and agrochemicals. To do so, however, they simply cannot continue producing in the same way. They will have to do this while facing climate change, volatility, shifting nutrition needs, and the increasing scarcity of most of the physical factors of production. Climate change itself is one of the biggest threats to agriculture due to the consequences of rising temperatures combined with an increase of extreme events that have an impact on soil, water and other central components of agricultural production. In the same way that climate change affects farming, farmers can affect climate change, by helping to combat it. According to the EPA, in 2010, agriculture and land use change accounted for 24% of total global carbon equivalent emissions. Farming has enormous impacts on the world’s most critical resources and accordingly, farmers will have to produce while also ensuring the provision of various vital ecosystem services. If they do not, we will not only degrade those resources but also exhaust the ability to produce enough food. Rather than simply “more” production, we must also consider what would be “better” production and better food systems.
10 Study realised with 70 mills, certified over the period 2010/11 to 2015/16, with the exclusion of 6 mills showing outliers across the years M2, M17, M18, M26, M40 and M50
1.26
1.3
1.36
1.31.29
1.2
1.22
1.24
1.26
1.28
1.3
1.32
1.34
1.36
1.38
2011 2012 2013 2014 2015
Rat
io o
f lo
wes
t w
age
to m
inim
um
wag
e
Brazilian Mills
Brazilian Mills
1
1.18
1.1
1.13
0.9
0.95
1
1.05
1.1
1.15
1.2
2011 2012 2013 2014 2015
Rat
io o
f lo
wes
t w
age
to m
inim
um
wag
e
Australian Mills
Australian Mills
Bonsucro Outcome Report 2017 36
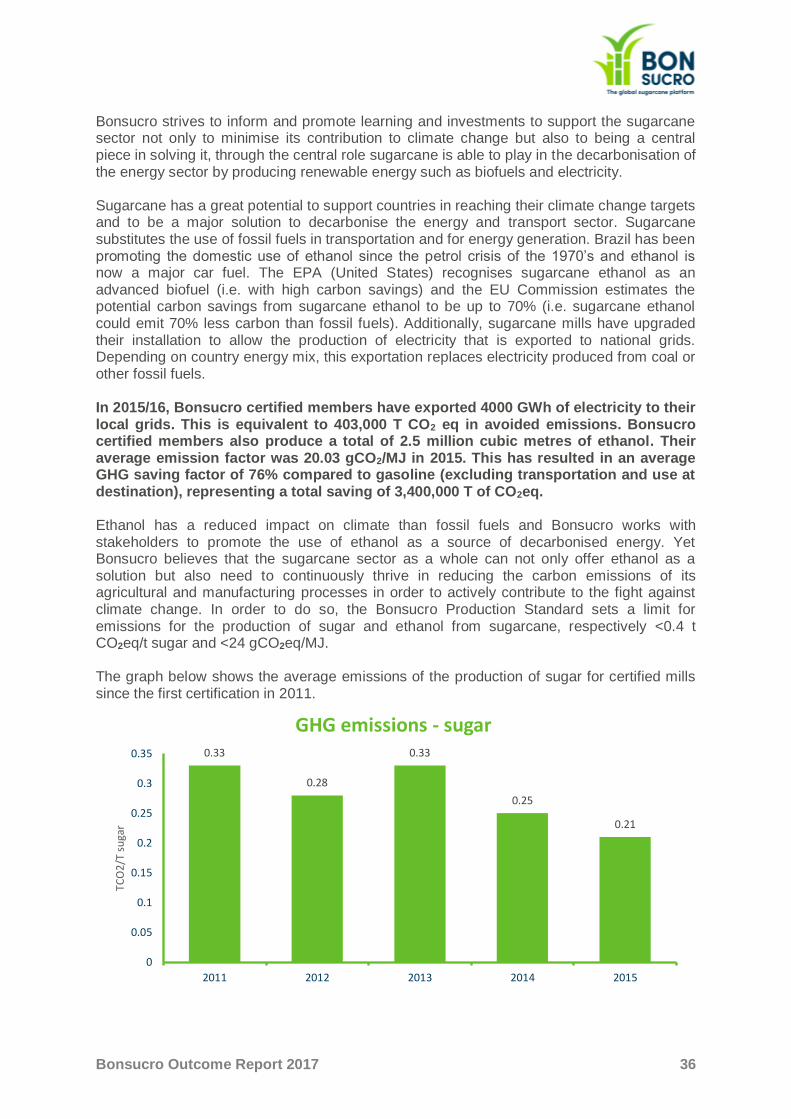
Bonsucro strives to inform and promote learning and investments to support the sugarcane sector not only to minimise its contribution to climate change but also to being a central piece in solving it, through the central role sugarcane is able to play in the decarbonisation of the energy sector by producing renewable energy such as biofuels and electricity. Sugarcane has a great potential to support countries in reaching their climate change targets and to be a major solution to decarbonise the energy and transport sector. Sugarcane substitutes the use of fossil fuels in transportation and for energy generation. Brazil has been promoting the domestic use of ethanol since the petrol crisis of the 1970’s and ethanol is now a major car fuel. The EPA (United States) recognises sugarcane ethanol as an advanced biofuel (i.e. with high carbon savings) and the EU Commission estimates the potential carbon savings from sugarcane ethanol to be up to 70% (i.e. sugarcane ethanol could emit 70% less carbon than fossil fuels). Additionally, sugarcane mills have upgraded their installation to allow the production of electricity that is exported to national grids. Depending on country energy mix, this exportation replaces electricity produced from coal or other fossil fuels. In 2015/16, Bonsucro certified members have exported 4000 GWh of electricity to their local grids. This is equivalent to 403,000 T CO2 eq in avoided emissions. Bonsucro certified members also produce a total of 2.5 million cubic metres of ethanol. Their average emission factor was 20.03 gCO2/MJ in 2015. This has resulted in an average GHG saving factor of 76% compared to gasoline (excluding transportation and use at destination), representing a total saving of 3,400,000 T of CO2eq. Ethanol has a reduced impact on climate than fossil fuels and Bonsucro works with stakeholders to promote the use of ethanol as a source of decarbonised energy. Yet Bonsucro believes that the sugarcane sector as a whole can not only offer ethanol as a solution but also need to continuously thrive in reducing the carbon emissions of its agricultural and manufacturing processes in order to actively contribute to the fight against climate change. In order to do so, the Bonsucro Production Standard sets a limit for emissions for the production of sugar and ethanol from sugarcane, respectively <0.4 t CO2eq/t sugar and <24 gCO2eq/MJ. The graph below shows the average emissions of the production of sugar for certified mills since the first certification in 2011.
0.33
0.28
0.33
0.25
0.21
0
0.05
0.1
0.15
0.2
0.25
0.3
0.35
2011 2012 2013 2014 2015
TCO
2/T
su
gar
GHG emissions - sugar

Bonsucro Outcome Report 2017 37
In 2015/16 there was a continuous reduction of the emissions from sugar production, with a drop of 16% compared to 2014/15 levels. Compared to the target set in the Bonsucro Production Standard, Bonsucro certified sugar emits 47.5% less CO2. It is difficult to assess what may have contributed to this reduction. From one side, use of diesel for cane transportation, agricultural activities, and the use of fertilizers and agrochemicals are likely areas where operators may have improved, on the other hand an increase in the export of energy that provide GHG emission credits due to the displacement factor could also be a reason. Whilst further studies would be required to determine the causality related to these reductions, the emissions can also be evaluated using the lenses of land use change emissions.
We observe that the emissions from operators that have cultivated land that has been converted into sugarcane are decreasing over the last season when the level of GHG emissions for sugarcane produced without land use change has also decreased. There is still a gap in the emission levels but reducing (from 0.33 TCO2 sugar to 0.29 T CO2/T sugar). The general drop in emissions is primarily caused by the drop of emissions of mills not having converted land to sugarcane after 1 January 2008 (cut-off date set by the Bonsucro Production Standard). We could reflect on the impact of land use change on emissions factors and determine that it is a likely factor to influence environmental credential of production. Should the market increase its demand for low emissions products, there is a possibility that operators would be required to exclude the most emitting land from the mix of production. It might impact their expansion strategy and help reducing the impact of land expansions on emissions. Whilst sugar emissions are reducing, we observe that the opposite is happening with emissions from the production of cane. Over the last three seasons, the emissions have increased constantly to reach 25.05 kg CO2/Tc (without LUC) and 44.33 kg CO2/Tc (with LUC). The negative impact of these increases has been mitigated by the improvement of the performance at mill level and sugar production (general reduction of the emission factor).
0.48
0.310.26
0.110.06
0.36
0.21
0.37
0.44
0.35
0
0.1
0.2
0.3
0.4
0.5
0.6
2011 2012 2013 2014 2015
TCO
2/T
su
gar
GHG emissions - sugar
Without LUC With LUC
Bonsucro Outcome Report 2017 38
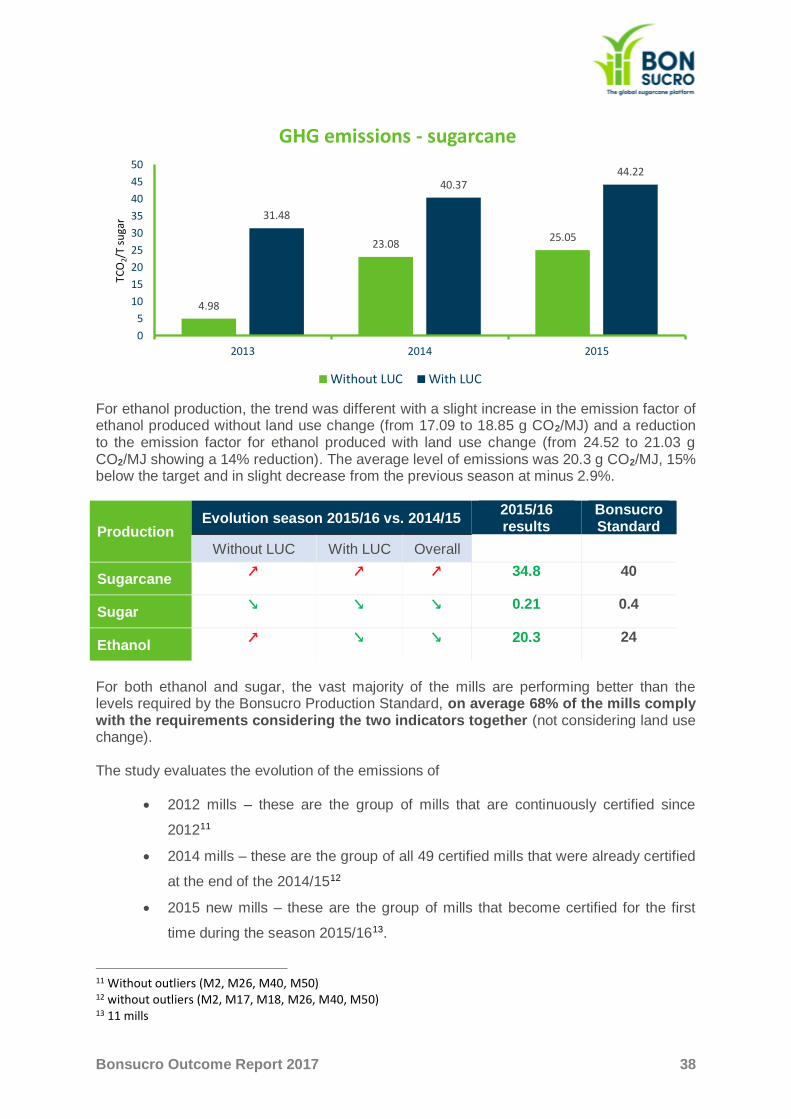
For ethanol production, the trend was different with a slight increase in the emission factor of ethanol produced without land use change (from 17.09 to 18.85 g CO2/MJ) and a reduction to the emission factor for ethanol produced with land use change (from 24.52 to 21.03 g CO2/MJ showing a 14% reduction). The average level of emissions was 20.3 g CO2/MJ, 15% below the target and in slight decrease from the previous season at minus 2.9%.
Production Evolution season 2015/16 vs. 2014/15
2015/16 results
Bonsucro Standard
Without LUC With LUC Overall
Sugarcane ↗ ↗ ↗ 34.8 40
Sugar ↘ ↘ ↘ 0.21 0.4
Ethanol ↗ ↘ ↘ 20.3 24
For both ethanol and sugar, the vast majority of the mills are performing better than the levels required by the Bonsucro Production Standard, on average 68% of the mills comply with the requirements considering the two indicators together (not considering land use change). The study evaluates the evolution of the emissions of
• 2012 mills – these are the group of mills that are continuously certified since
201211
• 2014 mills – these are the group of all 49 certified mills that were already certified
at the end of the 2014/1512
• 2015 new mills – these are the group of mills that become certified for the first
time during the season 2015/1613.
11 Without outliers (M2, M26, M40, M50) 12 without outliers (M2, M17, M18, M26, M40, M50) 13 11 mills
4.98
23.0825.05
31.48
40.3744.22
0
5
10
15
20
25
30
35
40
45
50
2013 2014 2015
TCO
2/T
su
gar
GHG emissions - sugarcane
Without LUC With LUC

Bonsucro Outcome Report 2017 39
Season Sugarcane (40 kg
CO2/Tc) Sugar (0.4 T CO2/ T
sugar) Ethanol (24g CO2/MJ)
2012 mills
2014 mills
2015 new mills
2012 mills
2014 mills
2015 new mills
2012 mills
2014 mills
2015 new mills
2014/15 30.5 38 0.38 0.51 22.3 57.3
2015/16 25.2 21.1 45.95 0.35 0.25 0.12 20.9 46 18.28 2012 mills and 2014 mills are both showing improvement of their emission factors for the three products. However, whilst the 2014 mills had a higher emission in 2014/15 than the 2012 mills across the range of products, they have further reduced their emissions for the production of sugarcane and sugar, but not for the production of ethanol. We observe that newly certified mills have better sugar and ethanol emission factors but a worst emission factor for sugarcane. During the season 2015/16 most of the new certification happened in new territories. By facts we know that Bonsucro is often adopted by the best performing mills of new territories. These operators are therefore likely to already have attained high level of environmental performance at mill level, but not necessarily at farm level. Whilst Bonsucro seems to have some impact on the reduction of GHG emissions at mill level (all mills decreased their GHG emissions), we observe that the impact might be greater at farm level. Following the performance of newly certified mills across the years would allow Bonsucro to confirm this observation. The overall picture of GHG emissions in certified mills is positive as shown in the table above. Considering that over the period 2011/12 and 2015/16 235.5 million tonnes of sugarcane have been produced, the performance of certified operators has allowed the avoidance of 2,896,000 T of CO2 eq. since these mills were certified. This is equivalent to the carbon sequestered by 220,000 Ha of forest over 5 years 14. 285,000 tonnes of CO2 equivalent emissions were avoided in 2015 alone through the sustainable production of sugarcane.
CONSIDERATIONS ON LAND USE CHANGE
As we’ve seen, Land Use Change drastically affects the emission factors of productions. In 2015, 50% of certified mills have harvested cane grown on land that had been converted to sugarcane after 1st January 2008. Although calculations for land use change emissions specific to sugarcane do not exist, the Bonsucro Calculator relies on an interpretation of the PAS2050 standard. The methodologies used are imperfect as very generic. The default emission factors only consider two cases: conversion from pasture and conversion from forest. In case of conversion from perennial to sugarcane, operators are requested to choose the conversion factor of a forest conversion. This overestimates the final emissions from land use change. Whilst there are clear opportunities for sugarcane in relation to climate change, the inaccuracy of the LCA methodology provided in the calculator renders any mitigation (reducing emissions) and an adaptation (as a resilient and reliable source of renewable energy and biomaterials) opportunities harder to identify and therefore implement. A review of the LCA is currently underway in collaboration with the University of São Paulo, Brazil.
14 Calculated with EPA GHG calculator: https://www.epa.gov/energy/greenhouse-gas-equivalencies-calculator

Bonsucro Outcome Report 2017 40
WATER
Water use is another critical indicator in terms of environmental sustainability. Sugarcane is an irrigated crop in several countries and it is known for being a water-intensive product when compared to other agricultural products. Sugarcane requires between 1400 and 2500 mm of water during the crop season from planting/previous harvest to harvest. Furthermore, the milling process also involves a considerable amount of water use for washing cane, milling, and centrifugation as well as for the production of vapour, an essential element in the various stages of the processing of sugarcane, which requires high temperatures (concentration, crystallisation). Some mills are discharging waste water into the environment after a phase of treatment. The Bonsucro Production Standard sets maximum levels of water consumption per tonne of cane produced (agriculture) and per tonne of cane crushed at the mill (industrial). In agriculture, the maximum use of water is 130kg of water per kg of sugarcane produced. In the industrial side, the calculations consider a maximum of 20 kg of water per kg of sugar, and 30 kg of water per kg of ethanol (results presented below are combined averages), the same observation is true for industrial water use: the limits of the Bonsucro Standard are high when compared to the levels achieved by certified mills. Water use in agriculture has improved in 2015/16 with a 48% reduction from 2014/15 levels in Australia and 34% in India, where irrigated cane is mostly present. Several factors contribute to the level of water usage, including weather conditions, or use of better irrigation techniques like drip irrigation.
The data shows that farms are over performing compared to the objective set in the Bonsucro Production Standard. The lack of operators growing fully irrigated cane reduce the ability to contextualise these data and check the evolution of farms that have run under the Bonsucro objectives for a longer time compared to the newly certified entities. The second graph below represents the level of water efficiency achieved by Bonsucro certified farms over the past years. It shows a continuous improvement in performance levels expressed by the larger quantity of sugarcane produced by each mm of water added. It is likely due to new technologies and practices that support increase of output for each amount of irrigation water added to the cane. Irrigation efficiency has improved by 70% over the 2014-2015 period, for all farms.
26.41
88.77
60.91
105.27
121.6
79.86
0
20
40
60
80
100
120
140
2013 2014 2015
m3 /
Tc
Water consumption in agriculture
Australia India

Bonsucro Outcome Report 2017 41
The results are even better on the industrial side. Mills have consistently reduced their water usage since Bonsucro certification started and reached their lowest water consumption level in 2015 at an average 0.5 kg of water per kg of sugar or ethanol produced. Mills have improved their results in 25% from 2014 levels, in the whole period analyse the results are impressive with a total 88% reduction since 2011.
The country analysis reveals important information on the environmental impact and shows that Brazil and Australia are the countries responsible for the overall trend of lower consumption. We observe that Australian mills are net exporters of water whereas the Brazilian mills are net importers, impacting differently the water resources of their water sheds (the first having to implement contamination prevention measures and the second one adapting their intake to water replenishment). It is nonetheless encouraging to see both countries’ certified operators reducing their pressure on water resources, with a reduction of 80% of their water consumption over their certification period.
94.99
236.72
400.99
0
50
100
150
200
250
300
350
400
450
2013 2014 2015
kg c
ane
/mm
/ha
Water use efficiency
9.4
8.5
5
2
0.5
0
1
2
3
4
5
6
7
8
9
10
2011 2012 2013 2014 2015
m3 /
T
Water usage at mills
Water usage at mills

Bonsucro Outcome Report 2017 42
We observe that new mills are starting to consume more water that then average of certified mills. The mills that have achieved certification more recently have however a lower level of water usage than mills that have been certified for longer. 2014 mills (49
mills) 2012 mills (34 mills) Newly certified mills
Year Water consumption
m3/T products
Water consumption m3/T products
Water consumption m3/T products
2011 9.4 9.6 n/a
2012 8.7 9.5 n/a
2013 4.8 8.2 n/a
2014 2.0 3.4 n/a
2015 0.0 2.2 2.75
HERBICIDES & PESTICIDES
Agrochemicals are another important indicator of the Bonsucro Production Standard, while they are used more sparsely in sugarcane; they have the potential to negatively affect the environment and communities living in the surroundings of plantations. In extreme cases in the past, agrochemicals were the source of considerable air and water pollution, causing public health threats.
9.5
8.05
3.38 1.91
-5.37
-12.2
-8.99
-9.86
-15
-10
-5
0
5
10
15
2012 2013 2014 2015m3/
T
Mill water usage
Brazil Australia
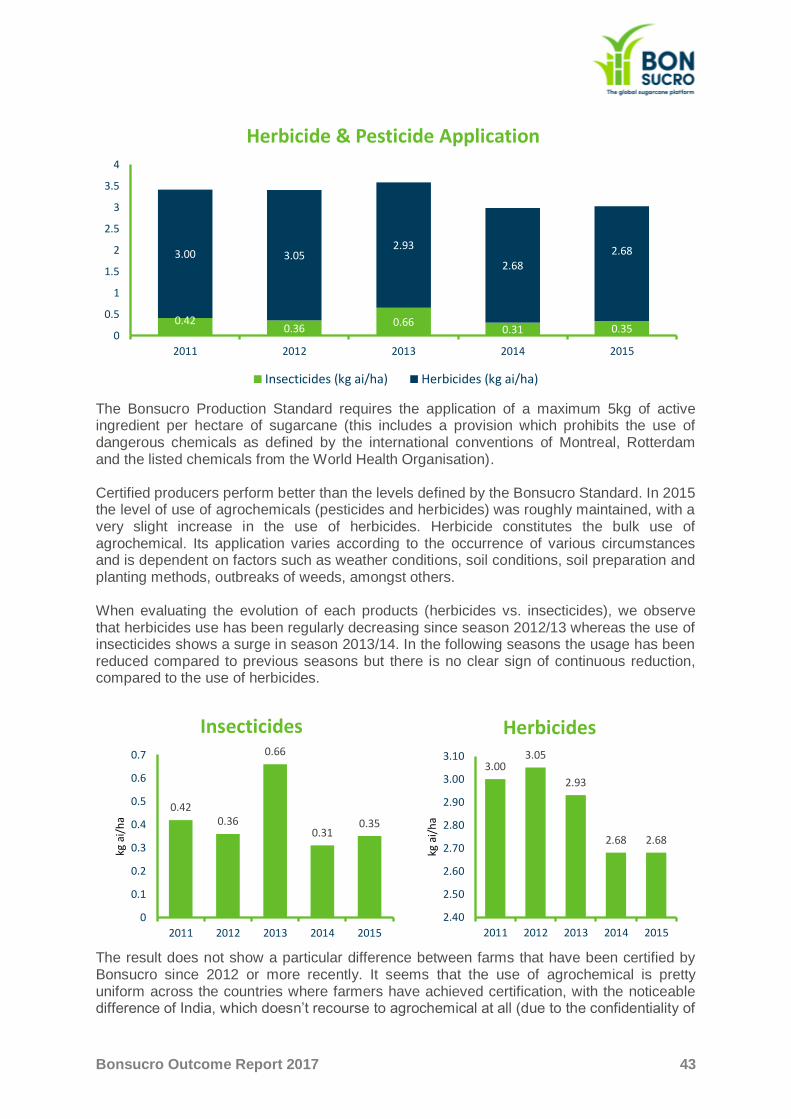
Bonsucro Outcome Report 2017 43
The Bonsucro Production Standard requires the application of a maximum 5kg of active ingredient per hectare of sugarcane (this includes a provision which prohibits the use of dangerous chemicals as defined by the international conventions of Montreal, Rotterdam and the listed chemicals from the World Health Organisation). Certified producers perform better than the levels defined by the Bonsucro Standard. In 2015 the level of use of agrochemicals (pesticides and herbicides) was roughly maintained, with a very slight increase in the use of herbicides. Herbicide constitutes the bulk use of agrochemical. Its application varies according to the occurrence of various circumstances and is dependent on factors such as weather conditions, soil conditions, soil preparation and planting methods, outbreaks of weeds, amongst others. When evaluating the evolution of each products (herbicides vs. insecticides), we observe that herbicides use has been regularly decreasing since season 2012/13 whereas the use of insecticides shows a surge in season 2013/14. In the following seasons the usage has been reduced compared to previous seasons but there is no clear sign of continuous reduction, compared to the use of herbicides.
The result does not show a particular difference between farms that have been certified by Bonsucro since 2012 or more recently. It seems that the use of agrochemical is pretty uniform across the countries where farmers have achieved certification, with the noticeable difference of India, which doesn’t recourse to agrochemical at all (due to the confidentiality of
0.420.36
0.660.31 0.35
3.00 3.052.93
2.682.68
0
0.5
1
1.5
2
2.5
3
3.5
4
2011 2012 2013 2014 2015
Herbicide & Pesticide Application
Insecticides (kg ai/ha) Herbicides (kg ai/ha)
0.420.36
0.66
0.310.35
0
0.1
0.2
0.3
0.4
0.5
0.6
0.7
2011 2012 2013 2014 2015
kg a
i/h
a
Insecticides
3.003.05
2.93
2.68 2.68
2.40
2.50
2.60
2.70
2.80
2.90
3.00
3.10
2011 2012 2013 2014 2015
kg a
i/h
a
Herbicides

Bonsucro Outcome Report 2017 44
data the report can’t allow the identification of operators and in some countries, there is only one certified operator, this is why countries are not named in the graph below).
Note that these indicators do not provide an assessment of the toxicity of the agrochemical used, except that the most toxic molecules have been removed from the systems as required by the International Conventions. The performance levels of certified mills reassure Bonsucro on their commitment to sustainability and to minimising negative impacts of agrochemical applications. A valuable exercise for Bonsucro, as with many other indicators, would be to understand certified mills’ performance in relation to non-certified producers.
FERTILISER APPLICATION
Fertilisers are critical to ensure optimal level of production of sugarcane, but do pose risks to the environmental sustainability if used without adequate management of soil quality and disposal, which can potentially lead to problems such as runoff and pollution of water streams and to the financial sustainability if used outside of the recommended levels of application.
0.00 0.59 0.34 0.26 0.000.35 0.13
4.86
2.792.70 2.67
0.01
4.46
2.47
0.00
1.00
2.00
3.00
4.00
5.00
6.00
A B C F E F G
Agrochemical use in different countries
Insecticides (kg ai/ha) Herbicides (kg ai/ha)

Bonsucro Outcome Report 2017 45
Average fertiliser application has reduced 15% in 2015/16 compared to 2014/15 (the highest application rate in the series at 303.14 kg Phosphate equivalent per hectare). Generally, fertiliser applications are still below the recommended individual application issued by a local expert or derived from locally recognised best practices. In 2015/16 fertilization application was 17.5% below the recommended levels. When comparing the ratio of mills certified since 2012 to the average of all mills, we observe that these mills have maintained a higher ratio toward the recommended levels (83.8% in 2015/16 compared to 82.5%). However, the ratio is also continuously decreasing over the years15.
The revised Bonsucro Production Standard (v.4.2) stipulates that a mill can apply up to 5% more fertilisers in relation to its recommended application rate. Most mills (82.5%) apply less fertilisers than what is recommended, and therefore, are compliant to the Standard’s
15 Data on ratio against recommended levels is unavailable for 2011 and 2012; it started being collected only in 2013 onwards.
184172
191
303
257
0
50
100
150
200
250
300
350
2011 2012 2013 2014 2015
kg P
eq/h
a
Fertiliser application
94%
91%
83%
76%
78%
80%
82%
84%
86%
88%
90%
92%
94%
96%
2013 2014 2015
Rat
io -
app
lied
/rec
om
men
de
d
Ratio of fertilisation (all mills)
99%
91%
84%
75%
80%
85%
90%
95%
100%
105%
2013 2014 2015
Rat
io -
app
lied
/rec
om
men
de
d
Ratio of fertilisation (2012 mills)

Bonsucro Outcome Report 2017 46
requirement. Nonetheless, although this is potentially positive in terms of environmental impacts and biodiversity protection, more data and analyses would be necessary to assess whether this “under fertilisation” is sustainable in the longer-term from a productivity and economic perspective.
BIODIVERSITY & HIGH CONSERVATION VALUE AREAS
The value of ecosystem services to agriculture is enormous, and often underappreciated. Poor management can damage ecosystems and cause habitat loss, nutrient runoff, and poisoning of non-target species with agrochemicals. Management practices should aim to both avoid value destruction, while promoting and strengthening the resilience and quality of beneficial ecosystem services. In the Bonsucro Production Standard, biodiversity is managed through an Environmental Management Plan and through an Environmental and Social Impact Assessment (ESIA) in the case of new sugarcane fields or mill expansions. Certified growers and mills must then demonstrate through evidence that areas with High Conversation Value (HCV) are being protected and have not been used to grow sugarcane or been affected by expansion of operations.

Bonsucro Outcome Report 2017 47
CONCLUSIONS & RECOMMENDATIONS Bonsucro strives to continuously improve its M&E system, reporting on outcomes and increasing understanding of its impacts. This outcome report brought an array of new types of analyses which have provided a clearer picture regarding the performance of certified operators. Firstly, in the absence of more reliable non-certified mills’ data, the focus on considering years’ in the certification programme and comparing performance levels of mills that have been certified for longer helps to understand how Bonsucro certification may contribute to more resilient mills and farms, and how it may trigger continuous improvement processes for those that have been involved with the Standard for a longer time, this has been demonstrated by some of the analysis in this report. Secondly, although analyses continue to improve as Bonsucro accesses more and more data, there is still a lack of contextual information to help understand specific changes in performance terms. Although this is a challenge, since Bonsucro is a global organisation working in several very different producing countries, more in-depth stories could be built around the experience of mills in implementing the Standard in order to share learning and to facilitate understanding of performance within a specific context. The ability to identify best performers also needs to be explored both for analysis and for promoting learning amongst farmers and mills. In this sense, the implementation of Bonsucro Connect, which will allow real-time data collection, may enable Bonsucro to better identify best performers and provide operators with useful benchmarking to map gaps and opportunities for improvement. This will strengthen Bonsucro’s role as the global platform for the continuous improvement of the sugarcane sector.

Bonsucro Benchmarking Protocol Version 1.0 48
RELEVANT INDEPENDENT RESEARCH (ANNEX 1) Every year Bonsucro also shares a list of independent academic research carried out in the previous year. Those are articles or studies that either mention Bonsucro or have relevance to Bonsucro’s work. For 2016 the following publications were recorded:
Author Title Reference Summary
International Trade Center (ITC)
Social and Environmental Standards – Contributing to more Sustainable Value Chains
Geneva: ITC/EUI, 2016. xii, 39 pages. Doc. No. OCE-16-20.E
Seeks to assess at a macro level how accessible and user-friendly standards are for producers. Findings include positive effects of ISEAL membership on transparency and disclosure of information to stakeholders.
Elizabeth A. Benneth
Who Governs Socially-Oriented Voluntary Sustainability Standards? Not the Producers of Certified Products
World Development Vol. 91, pp. 53–69, 2017
Analyses the governance of sustainability standard in particular regarding their inclusion of producers and marginalised stakeholders
Ana Maria P.F. Oliveira et all
Certification in the sugarcane industry: indicators’ analysis and inclusion of ISO 9001 and Bonsucro (In Portuguese)
Revista iPecege 2(2): 103-112, 2016
Compares indicators of productivity and price between mills certified by Bonsucro and/or ISO9001
Klaus Dingwerth
Field Recognition and the State Prerogative: Why Democratic Legitimation Recedes in Private Transnational Sustainability Regulation
Forthcoming - Politics and Governance Vol. 5 (2017)
Discusses the role of democratic legitimation in international standards and its diminishing effect over time.
Philip Schleifer
Private regulation and global economic change: The drivers of sustainable agriculture in Brazil
Governance 2016; 1-18
Analysing historical evolution of Bonsucro and RTRS, the article argues that transnational market and nonmarket pressures are decisive in determining the success of sustainability certification in developing countries
Stefan Mann Governing complementary responsibility goods through hybrid systems in a globalizing world
Journal of Socio-Economics in Agriculture, 2016, Volume 9
Assesses the role of “hybridity”, bringing together concepts and strategies of private and public sectors into multi-stakeholder initiatives, to drive credibility of sustainable goods
Bonsucro Benchmarking Protocol Version 1.0 49
METHODOLOGY (ANNEX 2) Data collection, storage, and use are under the responsibility of different staff members:
• Business Effectiveness Manager: Responsible for monitoring, gathering, and assessing independent research about Bonsucro; Responsible for designing the member annual report and analysing data; Responsible for analysing certification data and writing M&E and outcome reports;
• Head of Standards and Innovations: Responsible for supervising the M&E system; Responsible for supervision of data collection and organisation; Responsible for the data collection tool (Bonsucro Calculator); Responsible for supervision of data analysis and M&E and outcome reports;
• Standards Manager: Support on data analyses;
• Insights Analyst: Support on data analyses.
1. ORGANISATIONAL PERFORMANCE DATA
Bonsucro’s performance data is captured by multiple management systems used by the organisation. The responsibility for these data is spread across departments but used as reference by the Senior Management Team (composed of the CEO and heads of departments). Those indicators are reviewed regularly to support adaptive management and quick response to emerging trends and a subset of those are used in Bonsucro’s publications such as this Outcome Report.
2. INDEPENDENT RESEARCH
Independent research, reports, and benchmark studies offer important data to Bonsucro; together with Bonsucro events, they may contribute towards monitoring influencing factors and unintended effects as well as towards understanding broader implications of adoption of the Bonsucro Standards (e.g. community level impacts). We strive to take into consideration studies from respected organisations, researchers, and authors specialised in the sugarcane sector. Data from these sources is collected directly by the secretariat and by Bonsucro members. They are shared internally to relevant team members for their consideration and further actions.
3. MEMBER ANNUAL REPORT
The Annual Report against the Code of Conduct is a requirement for Bonsucro membership. Members respond to questions designed by the Secretariat regarding their experiences with Bonsucro, their market, their plans, and their activities to support Bonsucro’s goals. It is also an opportunity for members to let Bonsucro know about their concerns, challenges, and opportunities in the sugarcane sector. The reports offer rich qualitative information about adoption of the Standards, market of certified products, amongst others. Data is collated and studied by the secretariat to design global, regional, and local action plans and feature in the annual publication of the Bonsucro Progress Report.
Bonsucro Benchmarking Protocol Version 1.0 50
4. CERTIFICATION DATA
Finally, and most importantly, with regards to mills’ certification data, to monitor progress regarding the Priority Indicators for M&E presented above, Bonsucro has implemented a data collection protocol (captured in the Production Standard, the Guidance for Implementation, and the Certification Protocol), which guides what and how data should be collected for each of the Standard’s indicators. For a mill and cane supply area to become certified, the producer is required to complete the Bonsucro Calculator, which is used to evaluate conformity of an operator with each metric indicator of the Bonsucro Production Standard. The Bonsucro calculator is therefore designed to collect and manage data, and is used to perform data analysis, both cross-sectional (comparing certified units’ results) and longitudinal (understanding individual evolution over time). Data verification is put under the responsibility of the licensed certification bodies which have the mission to collect sufficient evidence to justify data entered in the tool. The guiding documents (above) clarify how indicators should be interpreted and what is expected from operators gathering data and auditors collecting and verifying them. Every lead auditor assessing data is trained on the Bonsucro Calculator by Bonsucro’s Standards and Innovation Team, and has the necessary technical knowledge to understand and verify information collected from farms and mills. Bonsucro’s Certification Protocol entails different methods to verify data, including: interviews, sampling, document inspection, among others. As licensed certification bodies are the entities with full on-the-ground access to the data and the knowledge necessary to perform audits, ensuring they are skilled, trained and competent increases the reliability of the data. Audit results and Bonsucro calculators are sent to Bonsucro after validation by the certification body. This way, Bonsucro obtains data of each certified mill through the certification body. Confidentiality is safeguarded by the confidentiality agreement existing between certification bodies and mills. Bonsucro then uses the data in an aggregated way and considers it anonymously for purposes of evaluation and communications. Through its role of accreditation body, Bonsucro monitors the activity and the compliance of certification bodies with the Certification Protocol and verifies the quality of the auditors as data verifiers. This helps Bonsucro have an increased confidence in the data received. Following receipt of data from certification bodies, Bonsucro verifies the data sent and cleans it: for the purpose of M&E, outliers (data points that do not make technical sense, potentially from error in units reported) are removed. The data set is then exported to Qlik Sense, a software for data processing, visualisation and analyses (see data process for collection, analysis and reporting below.

Bonsucro Benchmarking Protocol Version 1.0 51
DATA HANDLING PROCESS
KEY MONITORING & EVALUATION INDICATORS (ANNEX 3)
Area Short to medium-
term change Issue
Indicator of Production Standard Version
4.1.1
Indicator
Short to medium-term indicator
(as per Bonsucro Production Standard)
Compliance outcome
Land Rights
All sugarcane is grown in
legally-owned land, local
communities are consulted and respected
Land Ownership
1.2.1
The right to use the land
can be demonstrated
Yes
Land where sugarcane is grown is legally-owned and
not contested by local communities
Enterprise Resilience
Producers add value to their
work
Yields 3.1.2 Yield (tc/ha
harvested/y) Against target defined based on climatic zone
Yields are improved
Value Added
5.9.1 USD $/t cane Mill > 4; Agric >2
Sustainable sugarcane adds value to farmers and
mills
Mills are technically
efficient
Mill Efficiency
3.1.3
Mill overall time efficiency
(processing time as percent of total
time)
>75 Mills are efficient economic
operators
Labour Rights
Workers work in a safe
environment
Workers Safety
2.3.1
Lost time accident frequency (number
per million hours
worked)
Mill <15; Agric < 45
Workers engage safely in a professional activity in
the sugarcane sector
ILO Standards apply to all
workers of the sugarcane
sector
Wages* 2.4.1
Ratio of lowest entry level wage
including benefits to
minimum wage and benefits
required by law ($/$)
≥1 National minimum wage is
ensured
Data Collection
• Farmers and Mills fill in the Bonsucro Calculator
• Auditors verify the data and send the final calculator to Bonsucro
Analysis
• Bonsucro analyses the calculator providing feedback to producers and auditors as well as confirming outliers or missing data
• Data set is cleaned and prepared for reporting
Reporting
• Data is exported to Qilk Sense for data visualisation to support analysis
• Results are aggregated/ anonymised and reported in Bonsucro’s Outcome Report

Bonsucro Benchmarking Protocol Version 1.0 52
Minimum Age of
Workers* 2.1.1 Years (Minimum)
18 for hazardous work 15 for non-hazardous
work
Child labour is eradicated in the sugarcane sector
Workers’ Rights*
(regarding forced or
compulsory labour,
discrimination, and
freedom of association
)
2.1.1 To comply with ILO's Labour Conventions
Yes ILO standards apply to all workers of the sugarcane
sector
Climate Change
GHG emissions are contained
GHG Emissions
3.2.1 Net GHG
emissions for sugar <0.4 t CO2eq/t
sugar
Sugarcane industry does not contribute to climate
change.
GHG Emissions
3.2.2 Net GHG
emissions for ethanol
<24 gCO2eq/MJ Sugarcane industry does not contribute to climate
change.
Biodiversity &
Natural Resource
s
Areas of High Conservation
Value are preserved and mills mitigate their impacts
on the environment
Water 5.2.1
Net water consumed per unit
mass of product (kg/kg of product)
Mill, <20 kg/kg sugar; or <30
kg/kg of ethanol. Agric <130 kg/kg cane
Efficient use of water in agriculture and milling.
Environmental burden of sugar milling is contained
Environmental
Impacts* 4.1.5
Agro-chemicals applied per hectare
per year
<5 kg active ingredient/ha/y
Environmental impacts of sugarcane growing are
managed
Environmental
Impacts* 4.1.6
Banned agro-chemicals applied per hectare per year
0 kg active ingredient/ha/y
Environmental impacts of sugarcane growing are
managed
Environmental
Impacts* 4.1.4
Ratio of fertiliser N and P applied
(expressed in eq. phosphate) to
fertilizer N and P recommended by
soil or leaf analysis (expressed in eq.
phosphate
<1,05
Impact on biodiversity of sugarcane growing is
managed; Run-offs from fertiliser are reduced
Biodiversity*
4.1.2
Percentage of areas defined
internationally or nationally as legally
protected or classified as of
High Conservation Value planted to
sugarcane after the cut-off date of 1 January 2008
0 Areas with high
conservation values are protected

Bonsucro Benchmarking Protocol Version 1.0 53
Bonsucro Ltd.
The Wenlock, 50-52 Wharf Road, London N1 7EU, UK
t +44 (0)20 3735 8515 e [email protected] w bonsucro.com
Company Number: 06798568