bone marrow mesenchymal stem cells increase survival after ionizing irradiation combined with wound...
TRANSCRIPT
Bone marrow mesenchymal stem cells increase survival after ionizing irradiation
combined with wound trauma
Juliann G. Kiang, Ph.D.Principal Investigator, AFRRI
Professor, USU
October 27, 2014
Disclaimer
The views, opinions, and findings contained in this presentation do
not reflect official policy or positions of the US Department of
Defense, NIH, or the US Government.
Outline
• Background
• Rationale
• Hypothesis
• MSC isolation and identification
• Animal model of radiation followed by wound trauma
• Survival, body weight, wound healing, and H2O intake
• MSC challenged by bacteria
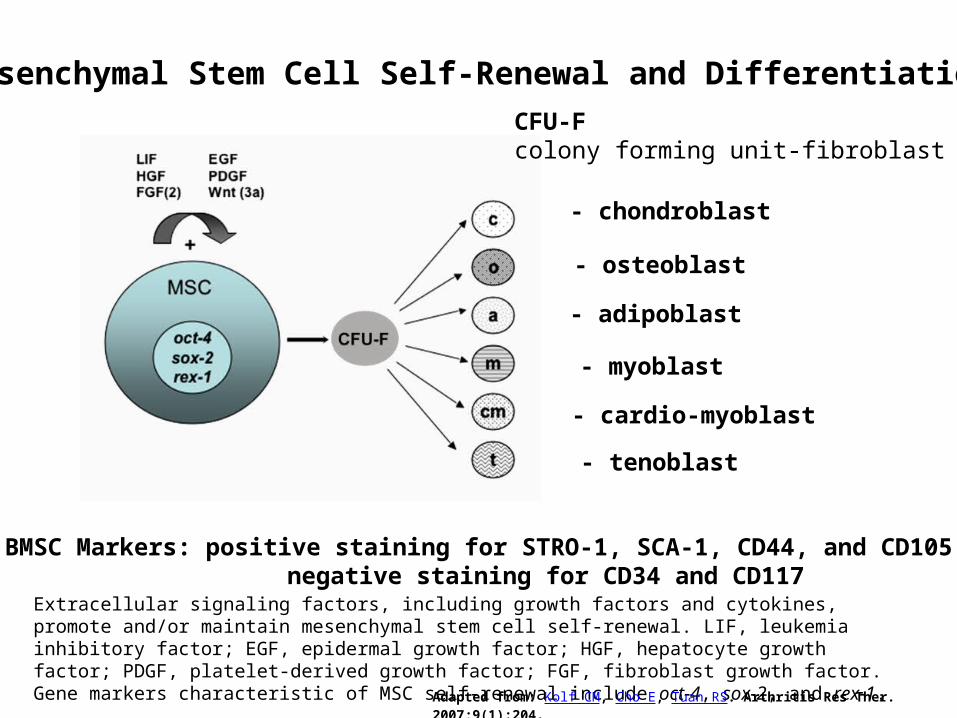
Mesenchymal Stem Cell Self-Renewal and Differentiation
Extracellular signaling factors, including growth factors and cytokines, promote and/or maintain mesenchymal stem cell self-renewal. LIF, leukemia inhibitory factor; EGF, epidermal growth factor; HGF, hepatocyte growth factor; PDGF, platelet-derived growth factor; FGF, fibroblast growth factor. Gene markers characteristic of MSC self-renewal include oct-4, sox-2, and rex-1.
Adapted from: Kolf CM, Cho E, Tuan RS. Arthritis Res Ther. 2007;9(1):204.
CFU-F colony forming unit-fibroblast
- chondroblast
- osteoblast
- adipoblast
- myoblast
- cardio-myoblast
- tenoblast
BMSC Markers: positive staining for STRO-1, SCA-1, CD44, and CD105 negative staining for CD34 and CD117
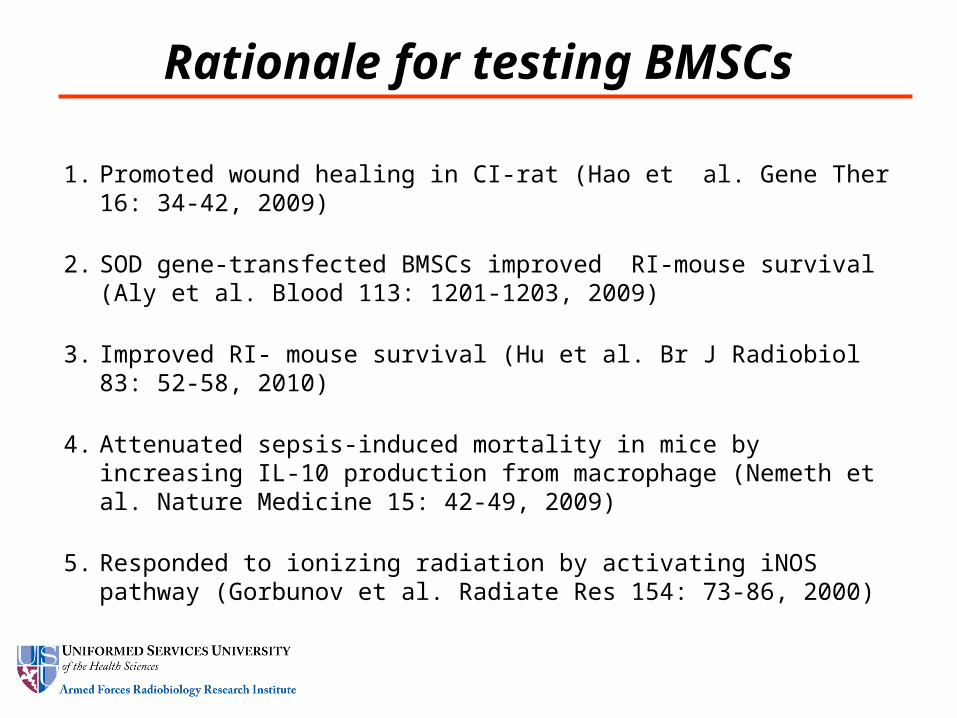
Rationale for testing BMSCs
1. Promoted wound healing in CI-rat (Hao et al. Gene Ther 16: 34-42, 2009)
2. SOD gene-transfected BMSCs improved RI-mouse survival (Aly et al. Blood 113: 1201-1203, 2009)
3. Improved RI- mouse survival (Hu et al. Br J Radiobiol 83: 52-58, 2010)
4. Attenuated sepsis-induced mortality in mice by increasing IL-10 production from macrophage (Nemeth et al. Nature Medicine 15: 42-49, 2009)
5. Responded to ionizing radiation by activating iNOS pathway (Gorbunov et al. Radiate Res 154: 73-86, 2000)
Hypothesis
BMSC administration will improve survival after irradiation combined with wound
trauma.
100 101 102 103 104
Pacific Blue-A: CD44 Pacific Blue-A
0
20
40
60
80
100
% o
f Ma
x
83.916.1
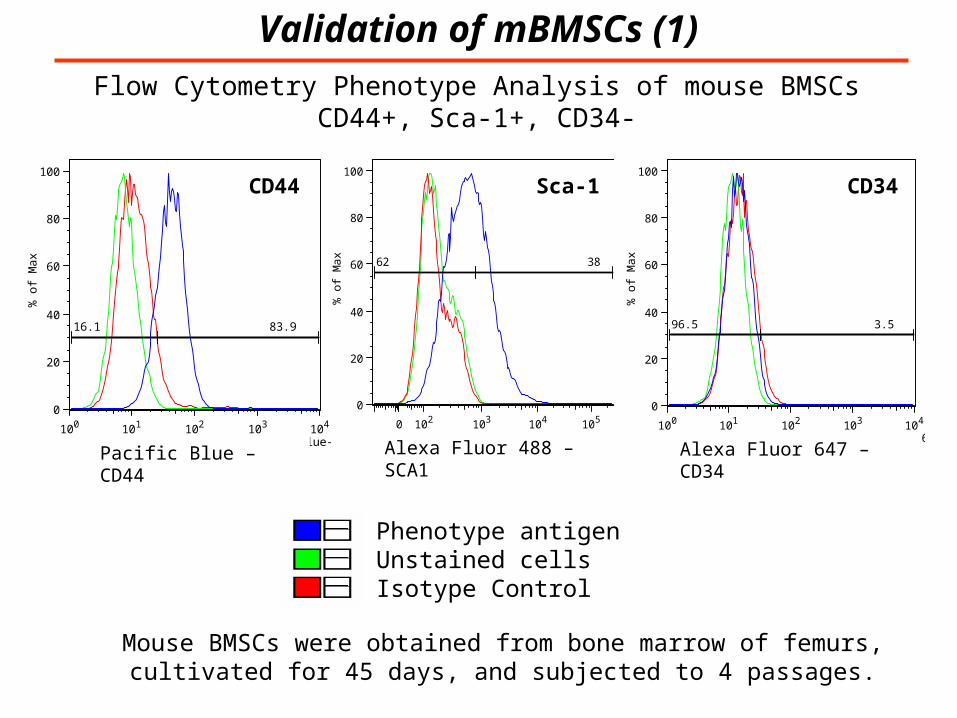
Flow Cytometry Phenotype Analysis of mouse BMSCsCD44+, Sca-1+, CD34-
100 101 102 103 104
Alexa Flour 647-A: CD34 Alexa Flour 647-A
0
20
40
60
80
100
% o
f Ma
x
3.596.5
0 102 103 104 105
<Alexa Fluor 488-A>
0
20
40
60
80
100
% o
f Ma
x 3862
CD44 Sca-1 CD34
Pacific Blue – CD44 Alexa Fluor 488 – SCA1 Alexa Fluor 647 – CD34
- Phenotype antigen- Unstained cells- Isotype Control
Mouse BMSCs were obtained from bone marrow of femurs, cultivated for 45 days, and subjected to 4 passages.
Validation of mBMSCs (1)
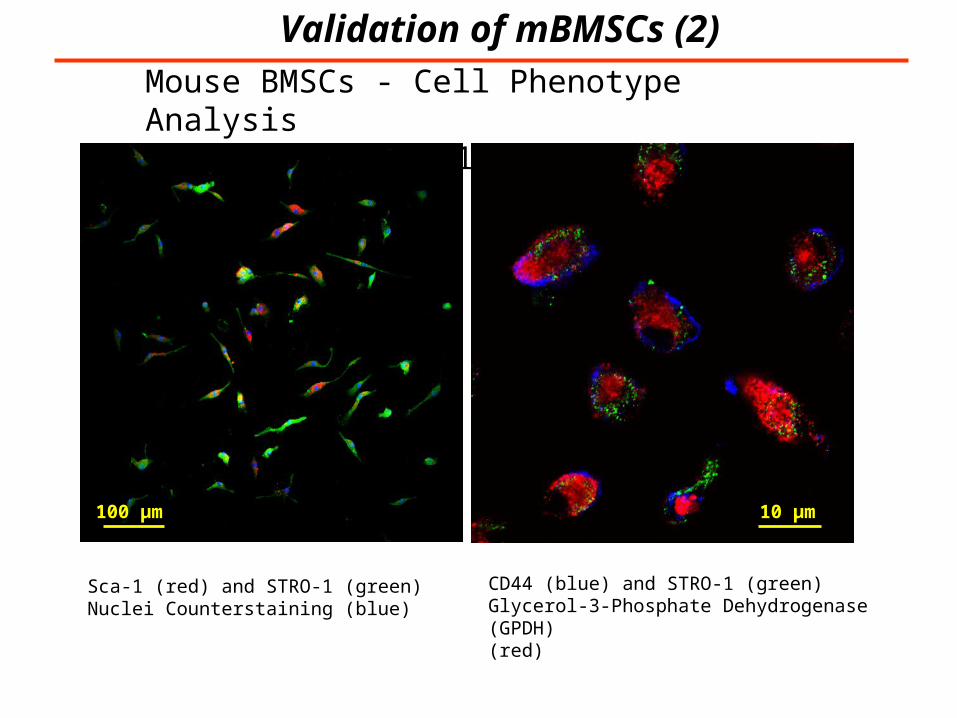
Sca-1 (red) and STRO-1 (green)Nuclei Counterstaining (blue)
Mouse BMSCs - Cell Phenotype AnalysisSca-1+, STRO-1+, and CD44+
100 µm 10 µm
CD44 (blue) and STRO-1 (green)Glycerol-3-Phosphate Dehydrogenase (GPDH) (red)
Validation of mBMSCs (2)
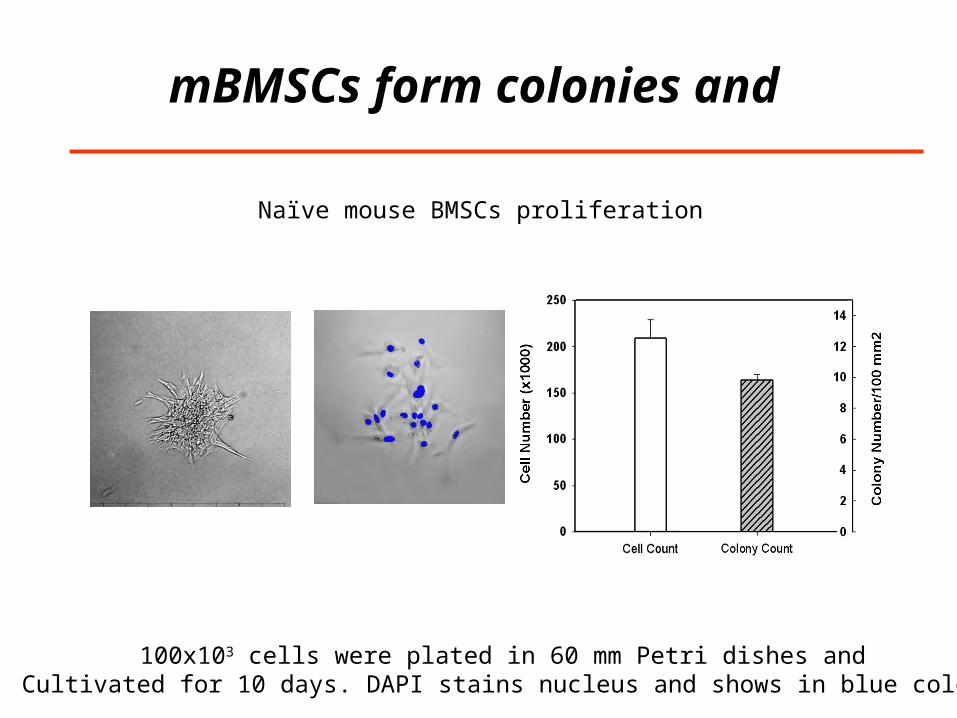
Naïve mouse BMSCs proliferation
100x103 cells were plated in 60 mm Petri dishes andCultivated for 10 days. DAPI stains nucleus and shows in blue color
mBMSCs form colonies and
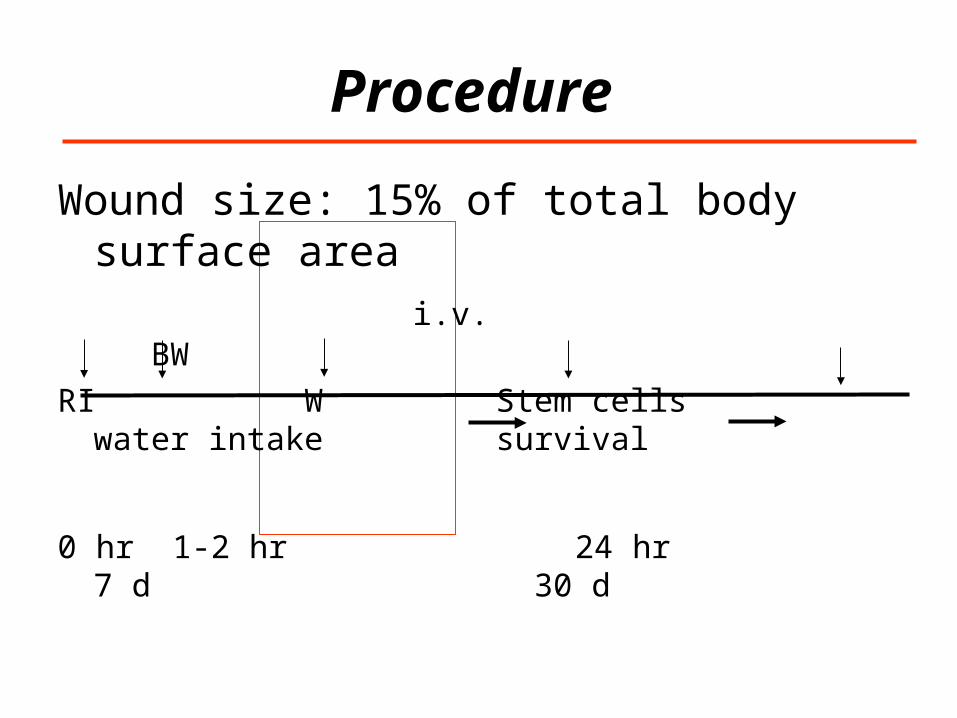
Procedure
Wound size: 15% of total body surface area i.v. BW
RI W Stem cells water intake survival
0 hr 1-2 hr 24 hr 7 d 30 d
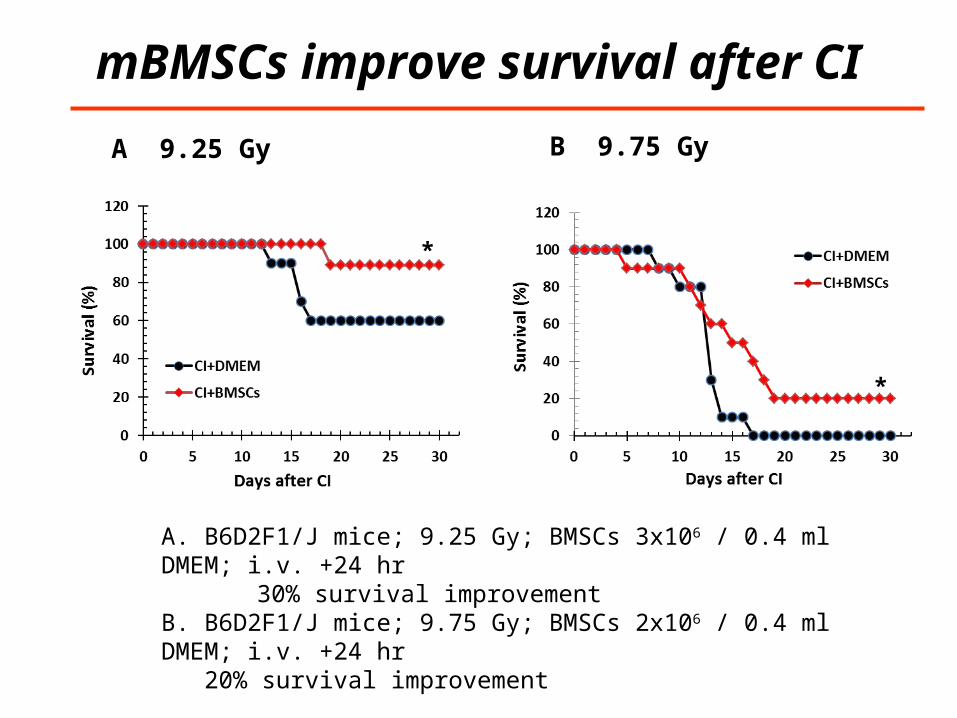
mBMSCs improve survival after CI
A. B6D2F1/J mice; 9.25 Gy; BMSCs 3x10⁶ / 0.4 ml DMEM; i.v. +24 hr 30% survival improvement
B. B6D2F1/J mice; 9.75 Gy; BMSCs 2x10⁶ / 0.4 ml DMEM; i.v. +24 hr 20% survival improvement
A 9.25 Gy B 9.75 Gy
*
*
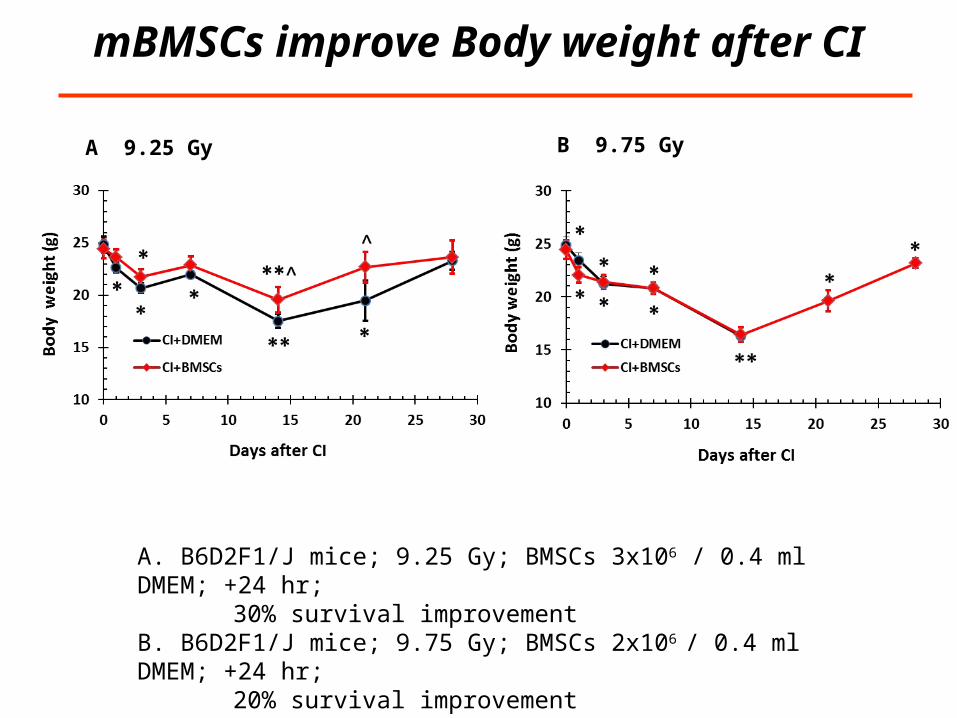
mBMSCs improve Body weight after CI
A. B6D2F1/J mice; 9.25 Gy; BMSCs 3x10⁶ / 0.4 ml DMEM; +24 hr;30% survival improvement
B. B6D2F1/J mice; 9.75 Gy; BMSCs 2x10⁶ / 0.4 ml DMEM; +24 hr; 20% survival improvement
A 9.25 Gy B 9.75 Gy
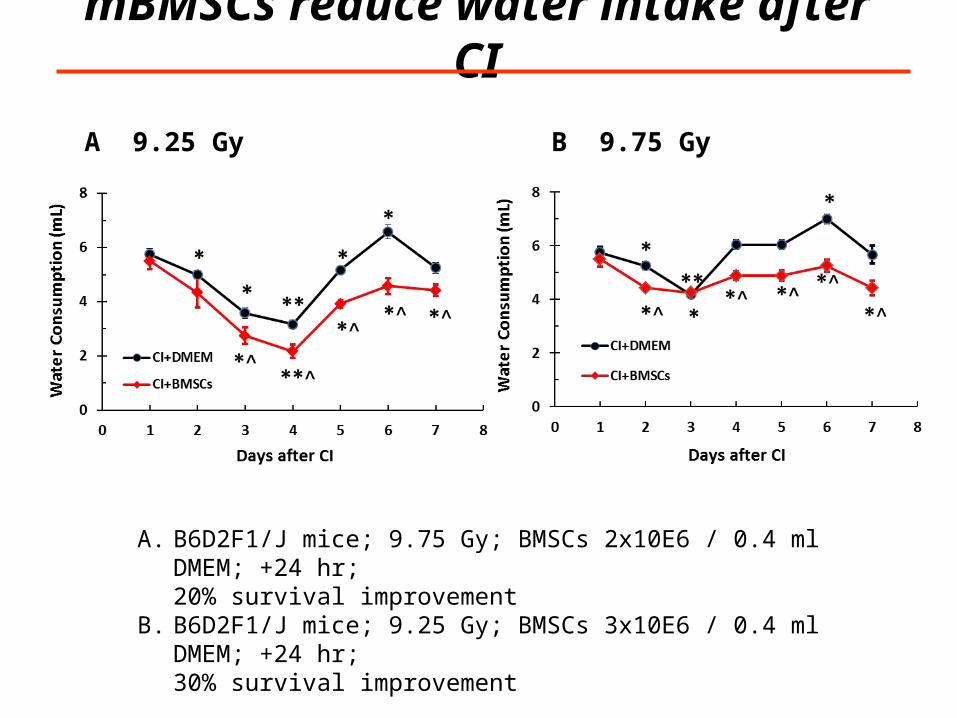
mBMSCs reduce water intake after CI
A. B6D2F1/J mice; 9.75 Gy; BMSCs 2x10E6 / 0.4 ml DMEM; +24 hr; 20% survival improvement
B. B6D2F1/J mice; 9.25 Gy; BMSCs 3x10E6 / 0.4 ml DMEM; +24 hr;30% survival improvement
A 9.25 Gy B 9.75 Gy
A 9.25 Gy B 9.75 Gy
*
***
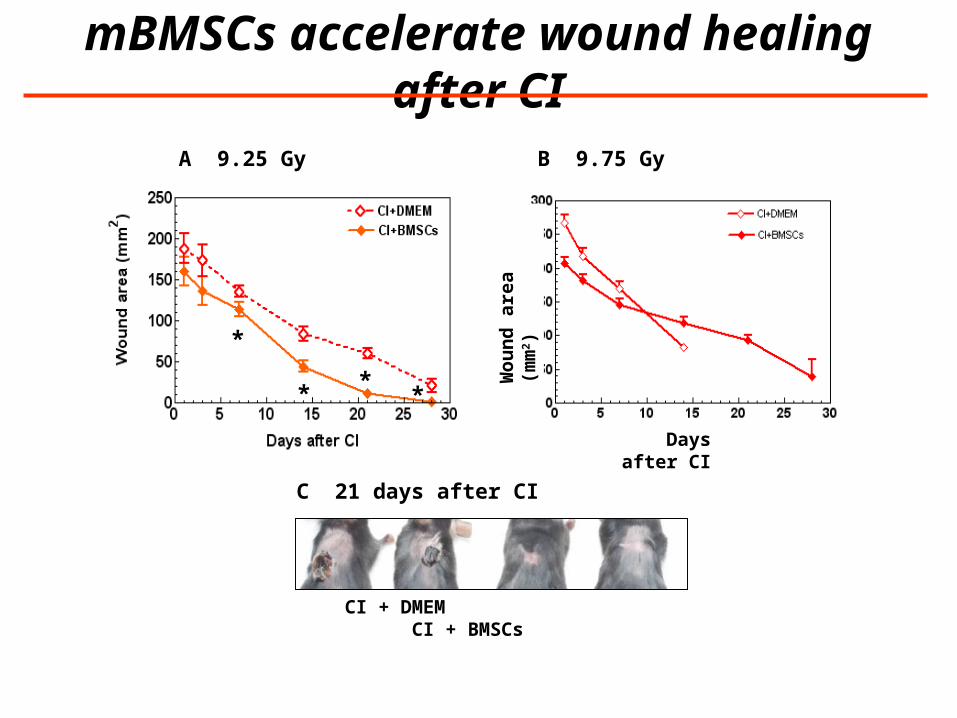
C 21 days after CI
CI + DMEM CI + BMSCs
Days after CI
Wou
nd a
rea
(mm
2 )
mBMSCs accelerate wound healing after CI
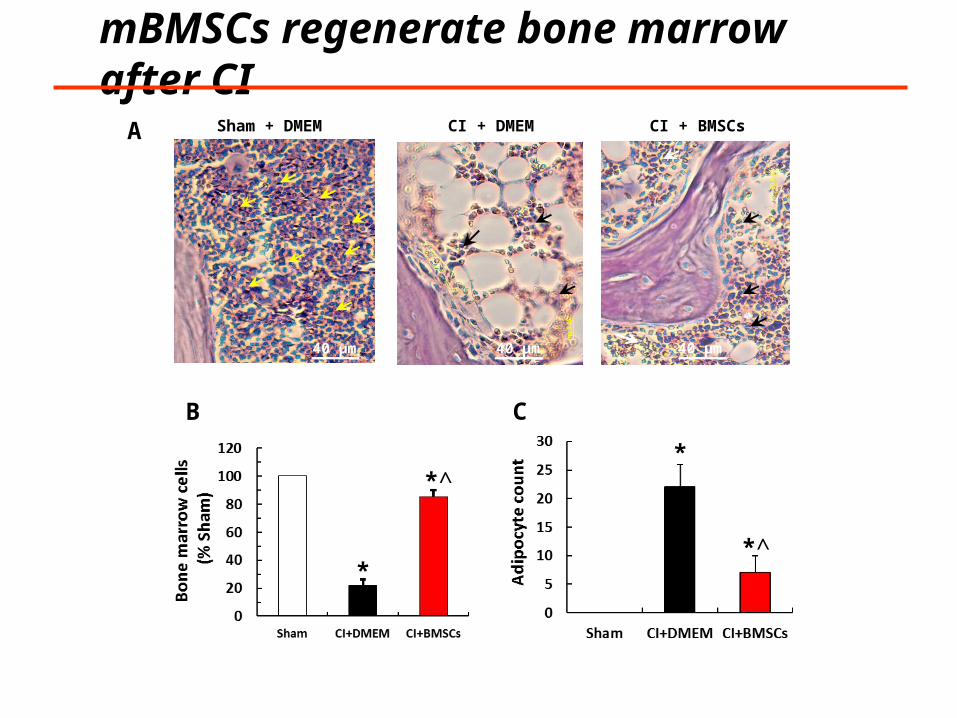
mBMSCs regenerate bone marrow after CI
A
40 μm 40 μm 40 μm 40 μm
Sham + DMEM CI + DMEM CI + BMSCs
B C
*
*^
*^
*
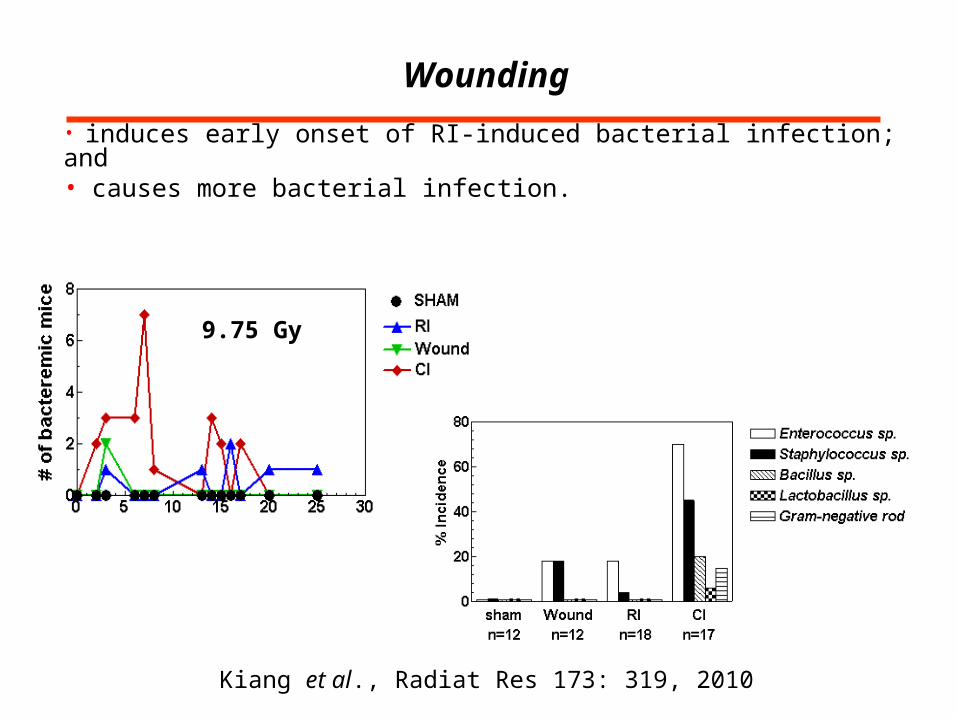
Wounding
• induces early onset of RI-induced bacterial infection; and• causes more bacterial infection.
Kiang et al., Radiat Res 173: 319, 2010
9.75 Gy
9.75 Gy
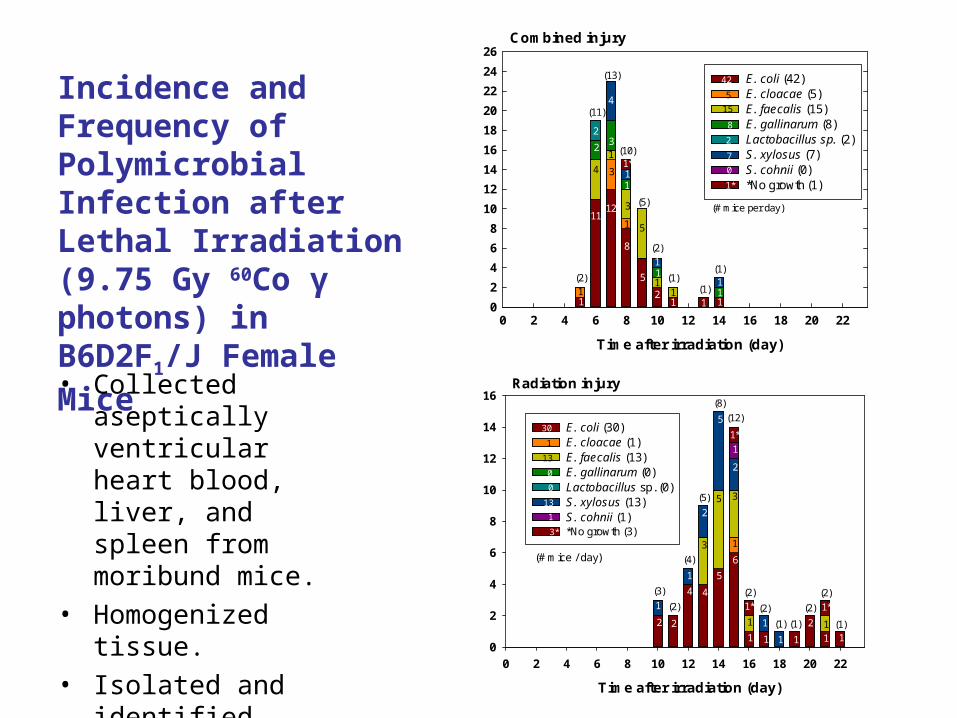
Incidence and Frequency of Polymicrobial Infection after Lethal Irradiation (9.75 Gy 60Co γ photons) in B6D2F1/J Female Mice
• Collected aseptically ventricular heart blood, liver, and spleen from moribund mice.
• Homogenized tissue. • Isolated and identified
bacteria.
Combined injury
Time after irradiation (day)
0 2 4 6 8 10 12 14 16 18 20 22Nu
mb
er o
f mic
e / is
ola
ted
ba
cte
rial s
pe
cie
s
0
2
4
6
8
10
12
14
16
18
20
22
24
26
E. coli (42)E. cloacae (5)E. faecalis (15)E. gallinarum (8)Lactobacillus sp. (2)S. xylosus (7)S. cohnii (0)*No growth (1)
1
1
11
1*11
11
11
1
2
2
4
11
3
3
4
12
8
3
5
5
2
42
5
15
8
2
7
0
1*
(# mice per day)
(2)
(11)
(13)
(10)
(5)
(2)
(1)(1)
(1)
1
11
1
Time after irradiation (day)
0 2 4 6 8 10 12 14 16 18 20 22Nu
mb
er o
f mic
e / is
ola
ted
ba
cte
rial s
pe
cie
s
0
2
4
6
8
10
12
14
16
E. coli (30)E. cloacae (1)E. faecalis (13)E. gallinarum (0)Lactobacillus sp. (0)S. xylosus (13)S. cohnii (1)*No growth (3)
1* 1*
2
1
2
1
4 4
3
2
5
5
5
6
1
3
2
1
1
1 1
1
1 1
2
11
1
(3)
(2)
(4)
(5)
(8)
(12)
(2)
(2)
(1) (1)
(2)
(2)
(1)
(# mice / day)
30
1
13
0
0
13
1
3*
Radiation injury
1*
0
10
20
30
40
50
IL1 IL1 IL6 IL8 iNOS S100A8
Series1
Series2
Fol
d G
ene
Exp
ress
ion
LPS
Control
*
**
α β
***
*** p<0.001
****
**º p<0.001
ºº p<0.02
* p<0.001** p<0.001
**** p<0.002
1 µg/ml
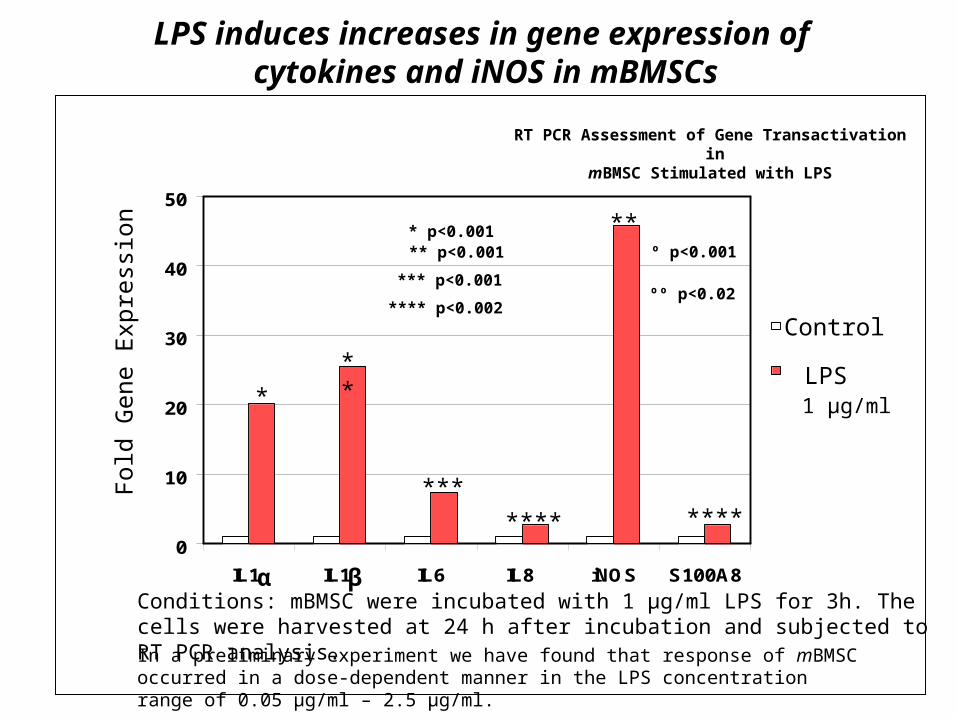
In a preliminary experiment we have found that response of mBMSC occurred in a dose-dependent manner in the LPS concentration range of 0.05 µg/ml – 2.5 µg/ml.
Conditions: mBMSC were incubated with 1 µg/ml LPS for 3h. The cells were harvested at 24 h after incubation and subjected to RT PCR analysis.
RT PCR Assessment of Gene Transactivation inmBMSC Stimulated with LPS
LPS induces increases in gene expression of cytokines and iNOS in mBMSCs
****
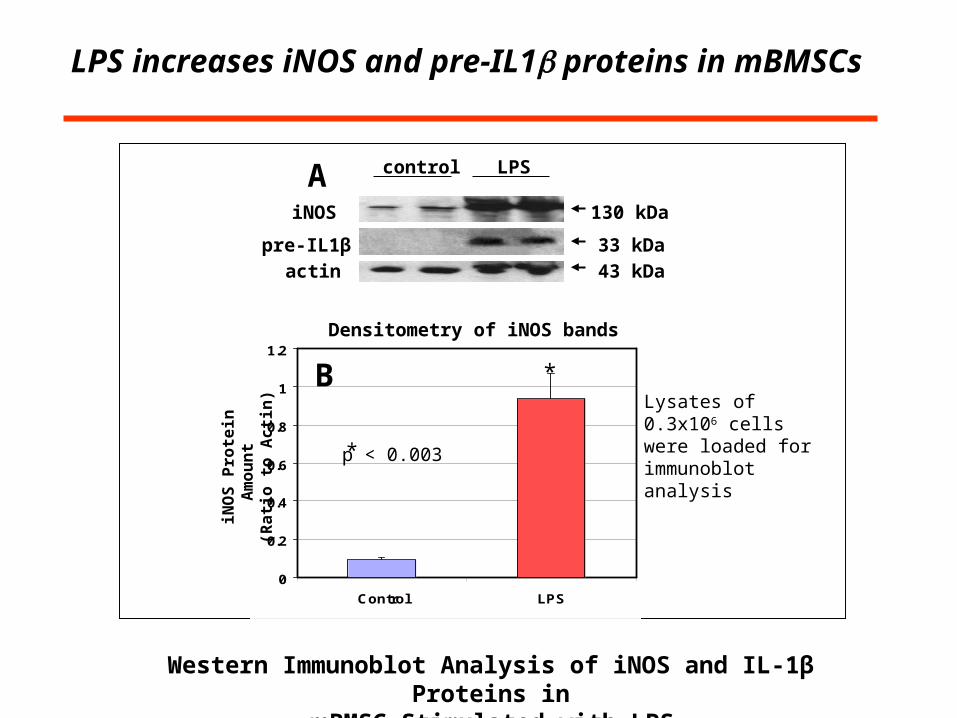
Western Immunoblot Analysis of iNOS and IL-1β Proteins inmBMSC Stimulated with LPS
control LPS
130 kDa
33 kDa
iNOS
pre-IL1β
actin 43 kDa
Lysates of 0.3x10⁶ cells were loaded for immunoblot analysis
A
0
0.2
0.4
0.6
0.8
1
1.2
Control LPS
B
p < 0.003
iNO
S P
rote
in A
mo
un
t (R
ati
o t
o A
cti
n)
Densitometry of iNOS bands
*
*
LPS increases iNOS and pre-IL1 proteins in mBMSCs
20 µm
LPS
iNOS
control
iNOS
iNOS+DIC
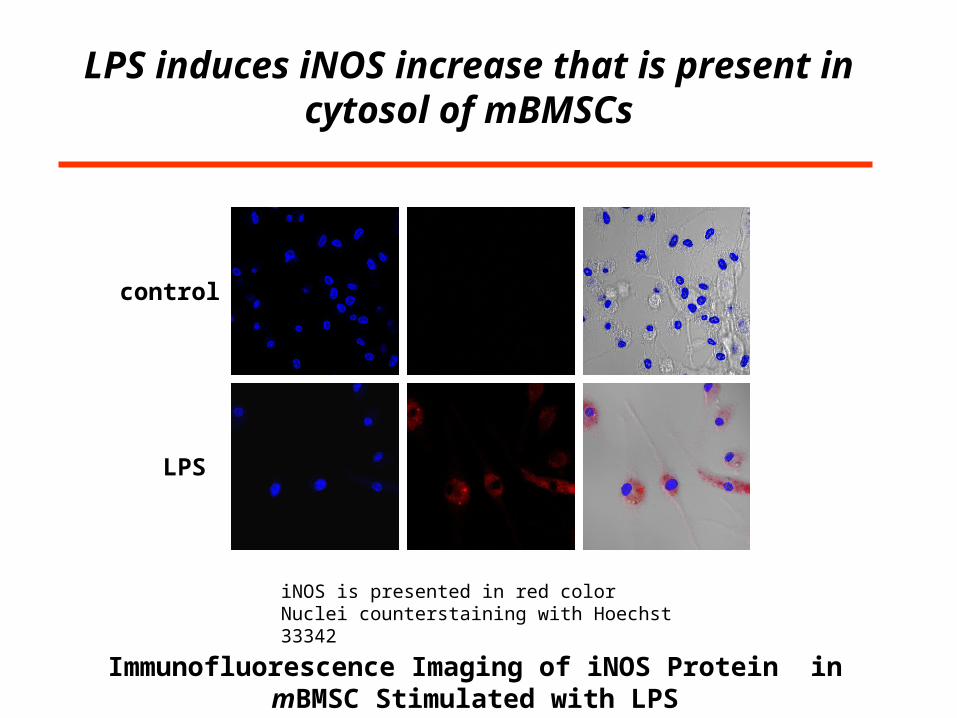
Immunofluorescence Imaging of iNOS Protein inmBMSC Stimulated with LPS
iNOS is presented in red colorNuclei counterstaining with Hoechst 33342
iNOS+DIC
LPS induces iNOS increase that is present in cytosol of mBMSCs
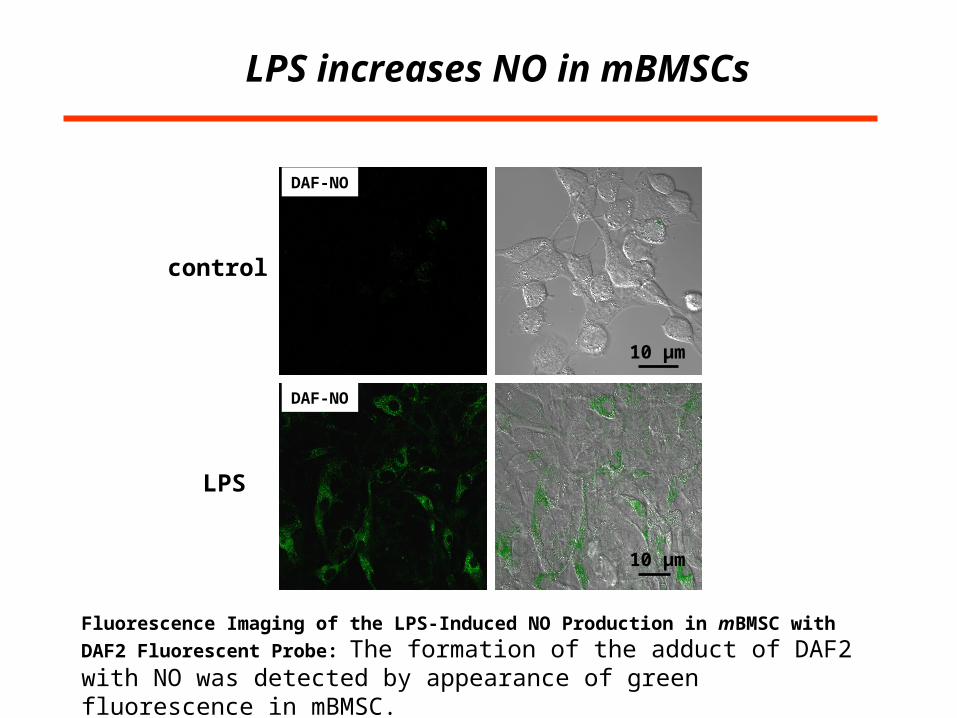
Fluorescence Imaging of the LPS-Induced NO Production in mBMSC with DAF2
Fluorescent Probe: The formation of the adduct of DAF2 with NO was detected by appearance of green fluorescence in mBMSC.
control
LPS
DAF-NO
DAF-NO
10 µm
10 µm
LPS increases NO in mBMSCs
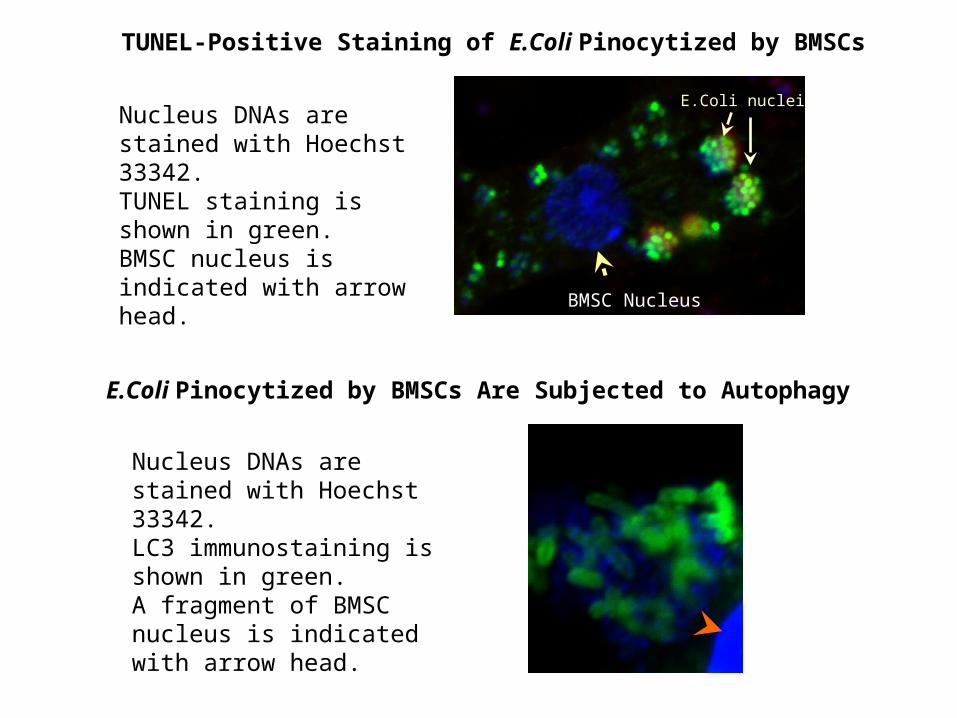
TUNEL-Positive Staining of E.Coli Pinocytized by BMSCs
Nucleus DNAs are stained with Hoechst 33342.TUNEL staining is shown in green.BMSC nucleus is indicated with arrow head.
BMSC Nucleus
E.Coli nuclei
Nucleus DNAs are stained with Hoechst 33342.LC3 immunostaining is shown in green.A fragment of BMSC nucleus is indicated with arrow head.
E.Coli Pinocytized by BMSCs Are Subjected to Autophagy
Summary: Therapy
mBMSCs
1.Significantly improved survival.2.Reduced body weight loss.3.Accelerated wound healing.4.Were anti-bacterial.
Conclusion
NIH/NIAID YI-AI-5045-04NIH/NIAID R21/33 AI080553
Bone barrow mesencymal stem cells are effective as therapy for radiation injury combined with
wound trauma.
AcknowledgmentsSenior Investigators • Dr. Juliann G. Kiang • Dr. G. David Ledney*• Dr. Thomas B. Elliott*Investigator• Dr. David BolducScientists• Dr. Nikolai Gorbunov• Dr. Risaku Fukumoto
Technical Staff• Dr. Min Zhai• True Burns• Bradley Garrison• Dr. Dilber Nurmemet• Penny Liao• Joan Smith • HM1 Marsha Anderson
AFRRI Management
Col Andy HuffCAPT David LesserDr. Mark WhitnallLTC Michele WoodberryLTC MCDR Dan HoeyLCDR Mathew WeinerLTC Mark Chappell et al.Dr. Vitaly Nagy et al.Dr. Gregory King et al.
CollaborationUSUHS•Dr. Radha Maheshwari•Dr. Paridhi Gupta •Dr. N. Balakathiresan (Sethu)