bonding and debt service - montana legislature€¦ · service paid by dollars that would flow into...
TRANSCRIPT
Bonding and Debt Service
Prepared for the 66th Legislature
Provided by the Legislative Fiscal Division

2
Contents Acronyms/Abbreviations in this brochure .............. 2 Definitions of Terms as used in this brochure ........ 2 Introduction ........................................................... 3 Montana Debt Ratings .......................................... 3 State Debt Requirements and Authority ................ 4 Total State Bonded Debt ....................................... 5 Debt Service ......................................................... 6 Total State Debt Service ....................................... 7 General Obligation (GO) Debt Service .................. 8 General Fund Supported GO Debt Service ........... 9 Long-Range Building Program Debt Service ....... 10 Conclusion .......................................................... 11
Acronyms/Abbreviations in this brochure
CPF – Capital project funds DS – Debt service GF – General fund GO – General obligation bonds IDGF – Indirect general fund LRBP – Long-Range Building Program REV – Special revenue bonds SSR – State Special Revenues
Definitions of Terms as used in this brochure • Debt service – The annual payments of principal
and interest on state bond issues • State Debt – Bond issues used for purposes
authorized by the legislature, does not include long-term notes, bonded debt issued by MUS, or pension obligations
• Indirect General Fund – debt payments using dollars that would flow into the general fund if not paying debt service

3
Introduction This primer provides a comprehensive overview of the long-term bonded debt position of the Montana state government, including an analysis of the current outstanding debt and the associated debt service. The state has used debt financing sparingly over the past decade. The authorization of new bonded debt has been low in recent biennia, and most new bond issues sold by the state have been for the purpose of refunding/replacing existing issues with lower interest rate issues. Montana Debt Ratings Montana continues to maintain a favorable debt rating1 from the bond rating agencies on general obligation bond issues (GO). The rating agencies have historically cited the following as strengths in the rating:
• Conservative fiscal management • Low debt levels • A growing and diversifying economy
The state does not have the highest rating of AAA, and some of the reasons for this include:
• Continued dependence on natural resources, agriculture, and tourism in the tax base
• High pension liabilities and low funded ratios Montana ranks well when compared to the country as a whole as provided in a report by Moody’s Investor Services. In a comparison with all the states, with lower debt states having a higher rank, Montana ranks as follows:
• 47th in net tax supported debt (thousands); $216,082 • 47th in tax supported debt per-capita; $207 • 47th in net tax supported debt as a percent of personal
income; 0.5%
1 AA1 from Moody’s Investors Service, Medians-Total State Debt Remains Essentially Flat in 2017, 3 May 2017.

4
In summary, Montana’s GO bonds are ranked highly, while not as high as possible. The state debt rankings show the state to be among those with the lowest amount of debt, especially when considering that two states do not issue GO bonds. The state debt ratings could improve with diversification of the tax base and further improvements to the state’s pension system and could deteriorate with substantial declines to the state’s economic outlook and/or the general fund reserves.
State Debt Requirements and Authority The Constitution, as excerpted below, guides Montana state government in the issuance of bonded debt. “Article VIII. Section 8. State debt. No state debt shall be created unless authorized by a two-thirds vote of the members of each house of the legislature or a majority of the electors voting thereon. No state debt shall be created to cover deficits incurred because appropriations exceeded anticipated revenue.” Article 8 includes two requirements that the legislature must abide by when authorizing and using debt financing, explained as:
• New debt must be approved by two-thirds of each house of the legislature
o The state citizens, through voter initiative, may approve debt with a majority vote
• The second sentence has historically been interpreted to mean that bond proceeds cannot be used for the ongoing costs of state government operations
o Debt financing may be used for the purposes of capital construction and land acquisition
o Debt financing may be used for non-continuing costs or unusual state government costs, such as the state’s costs of tribal water compacts
The Constitution does not include any limitations on the amount of debt that may be issued. However, statutory limitations exist for certain reoccurring bond issue types. A full list of the debt limitations is available upon request.

5
In recent history, bond issues have only been authorized by the legislature, and except for coal severance tax bonds (authorized in the Renewable Resources Loan program each biennium, except for the 2019 biennium), recent legislatures have only authorized the issuance of GO bonds in a few cases, which include:
• 2005 Legislature, HB 540 – Authorized a total of $68 million for state building projects, the state share of a tribal compact, and a water infrastructure project (partially issued to date)
• 2011 Legislature, HB 49 – Authorized $16.0 million for the state share of a tribal compact (not issued to date)
Total State Bonded Debt From pre-audit information that will be provided in Montana’s FY 2018 Comprehensive Annual Financial Report (CAFR), the total state bonded debt, including general obligation bonds (GO) and special revenue bonds (Rev), is $151.1 million (GO-$94.6m, Rev-$56.4m). This debt financed activities such as:
• Costs of state land purchases, building construction and improvements, and state building energy upgrades
• Highway construction • State share of environmental (superfund site) cleanup • Loans to local governments for infrastructure improvements
Highway, $38.6
State Hospital, $6.8Local Loans (Rev), …
Local Loans (GO), $29.3
Environmental, $1.9
Energy Upgrades, $1.3 State Buildings,
$36.9
Trust Lands, $15.2
GO and REV Outstanding Balances by Use - FYE 2018($ millions)
6
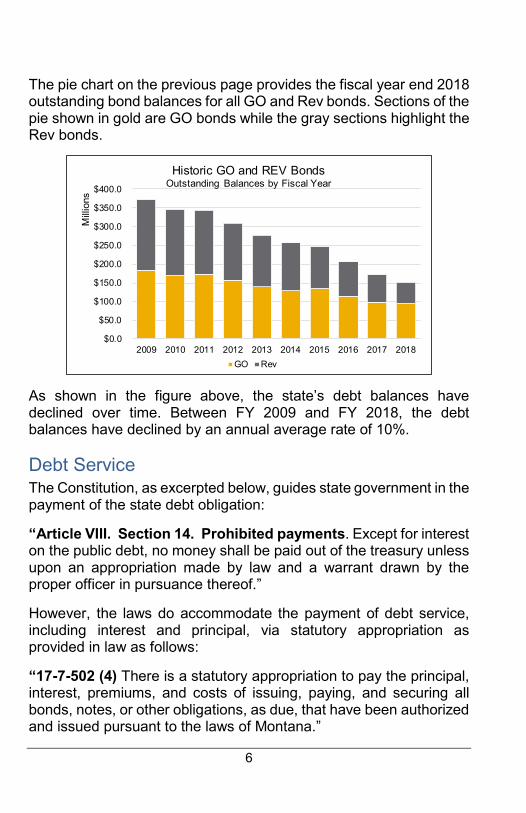
The pie chart on the previous page provides the fiscal year end 2018 outstanding bond balances for all GO and Rev bonds. Sections of the pie shown in gold are GO bonds while the gray sections highlight the Rev bonds.
As shown in the figure above, the state’s debt balances have declined over time. Between FY 2009 and FY 2018, the debt balances have declined by an annual average rate of 10%.
Debt Service
The Constitution, as excerpted below, guides state government in the payment of the state debt obligation: “Article VIII. Section 14. Prohibited payments. Except for interest on the public debt, no money shall be paid out of the treasury unless upon an appropriation made by law and a warrant drawn by the proper officer in pursuance thereof.” However, the laws do accommodate the payment of debt service, including interest and principal, via statutory appropriation as provided in law as follows: “17-7-502 (4) There is a statutory appropriation to pay the principal, interest, premiums, and costs of issuing, paying, and securing all bonds, notes, or other obligations, as due, that have been authorized and issued pursuant to the laws of Montana.”
$0.0
$50.0
$100.0
$150.0
$200.0
$250.0
$300.0
$350.0
$400.0
2009 2010 2011 2012 2013 2014 2015 2016 2017 2018
Mill
ions
Historic GO and REV Bonds Outstanding Balances by Fiscal Year
GO Rev

7
Total State Debt Service The figure below provides the total debt service related to the state’s bond issues by fund type over a 25-year period. The observations
through FY 2018 are actual payments while the remaining observations through 2034 are projections based on the amortization schedules of the various issues. In the 2021 biennium, the total debt service on bond issues is expected to average $25.3 million per year. The debt service associated with all bond issues is obligated to various fund types including:
• General fund (GF) - Gold • Indirect general fund (IDGF), which are dollars that would flow
into the general fund if not paying debt service – Gold Hatched
• Capital project funds (CPF) - Blue • Federal special revenue funds (FS) – Dark Gray • State special revenue funds (SS) – Light Gray
This chart includes debt that the state has issued to make loans to local governments for infrastructure improvement projects. The proceeds of the bonds are primarily used for drinking water, wastewater, and irrigation system projects. The debt service
$0.0
$10.0
$20.0
$30.0
$40.0
$50.0
$60.0
2009
2010
2011
2012
2013
2014
2015
2016
2017
2018
2019
2020
2021
2022
2023
2024
2025
2026
2027
2028
2029
2030
2031
2032
2033
2034
Total State Debt Service by Fund Type($ millions)
GF IDGF CP FS SS

8
associated with these bond issues, while paid from state special revenue funds (SS), consists of loan payments made to the state on the debt. In the 2021 biennium, an annual average of $6.2 million or 24.5% of the total debt service, is made through loan repayments. General Obligation (GO) Debt Service GO bonds are bonds that are guaranteed with the full faith, credit, and taxing power of state government. GO bonds are used for most of the same purposes as discussed in the total state debt section. While pledged with the full faith and taxing power of the state, the debt service on the bonds is not always paid by the state general fund. The following figure shows the mix of funding used to pay the debt service on the current $94.6 million of outstanding GO debt. The mix has changed over time. In the 2021 biennium, total GO debt service will average $12.8 million/year.
Of that amount, the general fund will directly pay for 58.6% of the debt service costs on GO bonds (61.3% when including the IDGF) and 35.8% of the total will be paid through loan repayments.
$0.0
$5.0
$10.0
$15.0
$20.0
$25.0
$30.0
2009
2010
2011
2012
2013
2014
2015
2016
2017
2018
2019
2020
2021
2022
2023
2024
2025
2026
2027
2028
2029
2030
2031
2032
2033
2034
GO Debt Service by Fund Type($ millions)
GF IDGF CP SS

9
General Fund Supported GO Debt Service
Gold Bars: The general fund is projected to be obligated to the payment of an average of $7.5 million/year of GO bonded debt in the 2021 biennium, as shown in the gold bars as GF in the chart above, when considering only the currently issued debt. Currently issued general fund debt service is projected to be fully paid by FY 2032. Gold Hatched Bars: The figure includes indirect general fund shown as IDGF in the gold hatched bars. As mentioned earlier, this is debt service paid by dollars that would flow into the general fund if not paying debt service and the data includes some special revenue bond debt service. In the 2021 biennium, this category of debt service adds an average of $1.5 million/year to the general fund debt service, bringing total general fund supported debt service to an annual average of $9.1 million. The final payment of this debt is expected to occur in FY 2022. Grey Bars: In addition to the current issued debt, the legislature has provided the authority to issue $42.2 in GO bonds, which if issued would be an obligation of the general fund. The associated projected debt service, shown as GFA in the grey bars, includes:
• The St. Mary’s Diversion System, $10.0 million, 2005 Legislature HB 540: must be a match to federal appropriations for the project
$0.0
$5.0
$10.0
$15.0
$20.0
$25.0
2010
2011
2012
2013
2014
2015
2016
2017
2018
2019
2020
2021
2022
2023
2024
2025
2026
2027
2028
2029
2030
General Fund Debt Service($ millions)
GF IDGF GFA (no BB Museum) HB 14-LEG HB 14 Ex Dif

10
• Ft. Belknap Tribal Water Compact, $9.5 million, 2005 Legislature HB 540: as the state share to be issued with Congressional and Tribal approval of the compact
• Blackfeet Tribal Water Compact, $16.0 million, 2011 Legislature HB 49: as the state share to be issued with Congressional and Tribal approval of the compact-Note: Congress approval occurred in December 2016, but there continues to be uncertainty related to when the bonds will be issued.
• Not included in the grey bars: The Montana Heritage Center, $6.715 million, 2005 Legislature HB 540, which would be issued if additional project funding becomes available (added to the HB 14 debt service projection in the blue bars)
Blue Bars: For the 2021 biennium, the executive has requested the authorization of $160.0 million in the Infrastructure in Montana proposal of HB 14. The blue bars illustrate the debt service costs of the proposal using the assumptions of the LFD. This projection includes $160.0 million of GO bonds requested in the executive budget proposal along with the previously authorized but unissued authority for the Betty Babcock Museum ($6.7 million). The bonds would be issued over three years with debt service costs beginning in the second-half of FY 2020 ($8.4 million in the 2021 biennium). Blue Hatched Bars: The blue hatched bars illustrate the debt service costs of the HB 14 as shown on the executive balance sheet. Like the LFD projections, the executive projection includes the remaining bond authority for the Betty Babcock Museum. The blue hatched line demonstrates the difference between the LFD and executive (Ex) assumptions. The executive projection includes bond issuance over the same three-year period, however the executive projection uses higher interest rates (total $13.4 million in the 2021 biennium).
Long-Range Building Program Debt Service In the mid to late 1990’s, when debt financing for capital construction and maintenance was more commonly used, the legislature chose to pay GO debt service with the revenues of two Long-Range Building Program (LRBP) capital project funds. In FY 2019, the LRBP capital project funds will no longer be obligated for the debt.

11
The following figure provides the “net LRBP” debt service expenditures. The data is shown as net, due to a 1997 Legislative decision that required the general fund to offset the LRBP debt service payments on three specific bond issues at an amount of $665,000 per year. Since that time, the specific bonds have been refunded, or replaced with lower interest rate issues, but that offset has continued on the refunding issues, and in FY 2019, the debt service would be fully paid by the offset.
For 20 years, the debt service paid from the LRBP funds has reduced available revenues that might have otherwise been used for state building construction and maintenance projects. These funds will now be available for either capital projects or new debt service.
Conclusion While the legislature has not provided authority for new debt financing recently, the use of debt financing has historically been an important capital improvement financing tool for the state. With debt financing, the state has been able to fund the costly endeavors of maintaining and constructing buildings, providing the state share of tribal compacts, affording assistance to local governments for infrastructure needs, and remediating damage to state lands. The overall decline of debt service costs will make state funds available for other state needs or to support new debt financing in future years.
$0.0
$0.5
$1.0
$1.5
$2.0
$2.5
$3.0
2010 2011 2012 2013 2014 2015 2016 2017 2018 2019 2020 2021
LRBP Debt Service($ millions)
Net LRBP Capital Land Grant