bond strength of reinforcing bars with …iri/publications/slr08_1.pdf · bond strength of...
TRANSCRIPT

BOND STRENGTH OF
REINFORCING BARS WITH DEFORMATION SPACINGS THAT EXCEED MAXIMUM SPECIFIED IN ASTM A615
By
David Darwin JoAnn Browning Matthew O’Reilly
Lihua Xing
A Report on Research Sponsored by
NUCOR Corporation
Structural Engineering and Materials Laboratory SL Report 08-1
March 2008
THE UNIVERSITY OF KANSAS CENTER FOR RESEARCH, INC. 2385 Irving Hill Road, Lawrence, Kansas 66045-7563
BOND STRENGTH OF REINFORCING BARS WITH DEFORMATION SPACINGS THAT EXCEED
MAXIMUM SPECIFIED IN ASTM A615
By
David Darwin JoAnn Browning Matthew O’Reilly
Lihua Xing
A Report on Research Sponsored by the
NUCOR Corporation
Structural Engineering and Engineering Materials
SL Report 08-1
THE UNIVERSITY OF KANSAS CENTER FOR RESEARCH, INC.
LAWRENCE, KANSAS
March 2008

ABSTRACT
No. 5 and No. 10 bars are tested for bond strength in accordance with ASTM A944. For
each bar size, the bond strength of bars with deformations that exceed the maximum spacing
requirements in ASTM A615 is compared with the bond strength of bars that meet the spacing
requirements. All bars exceed the requirements for minimum deformation height. Research
related to the effect of deformation properties on bond strength, including the research used to
establish the requirements for deformations in ASTM A615, is also reviewed. The test results
match earlier research and demonstrate that (1) bond strength is not governed by the specific
value of deformation height or spacing, but by the combination of the two as represented by the
relative rib area of the bars, (2) the bond strength of the bars with deformation spacings that
exceed those specified in ASTM A615 is similar to the bond strength of the bars that meet the
specification, and (3) the differences in bond strength observed in the tests are not statistically
significant. The bars tested in this study with deformation spacings that exceed those specified in
ASTM A615 have relative rib areas that exceed the minimum values that result from the
provisions of ASTM A615. They will provide satisfactory bond performance and can be used in
all concrete construction.
Keywords: bond (concrete to reinforcement); deformed reinforcement; relative rib area;
structural engineering.

ACKNOWLEDGEMENTS
Funding and material support for this research was provided by Nucor Corporation.

INTRODUCTION
The Birmingham Mill of Nucor Corporation rolled reinforcing bars in various sizes with
deformation spacings that exceed the maximum allowable value permitted by the govern
specification, ASTM A615. The principal question is whether the wide deformation spacings
compromise the bond strength of the bars.
This report describes research, including the research used to establish the requirements
for deformations in ASTM A615 and bond tests performed in accordance with ASTM A944, that
demonstrates that the reinforcing bars in question will provide satisfactory performance in bond
and can be used in all reinforced concrete construction.
BACKGROUND
The requirements for deformation height and spacing in ASTM A615 and other ASTM
reinforcing bar standards are based on research performed by Arthur P. Clark (1946, 1949) at the
National Bureau of Standards (now the National Institute of Standards and Technology). Clark’s
research demonstrated that the bond capacity of a reinforcing bar increases as the ratio of the rib
bearing area (projected rib area normal to the bar axis) to the shearing area (bars perimeter times
distance between ribs) increases. The ratio is referred to as the “relative rib area.” The relative rib
area Rr can be expressed as
projected deformation area normal to bar axisnominal bar perimeter center-to-center deformation spacing
=×rR (1)
In the case of conventional reinforcing bars that have longitudinal ribs, Rr may be
calculated as (ACI Committee 408 2001)
⎟⎟⎠
⎞⎜⎜⎝
⎛−= ∑
pgaps
shR
r
rr 1 (2)
where
hr = average height of deformations, in. or mm
sr = average spacing of deformations, in. or mm
1
∑gaps = sum of the gaps between ends of deformations, plus the width of any
continuous longitudinal lines used to represent the grade of the bar,
multiplied by the ratio of the height of the line to hr, in. or mm
P = nominal perimeter of the bar, in.
Clark and other researchers (Soretz and Holzenbein 1979, Kimura and Jirsa 1992, Darwin
and Graham 1993, Darwin et al. 1996a, 1996b, Zuo and Darwin 2000) have demonstrated that
Rr, not the minimum rib height or maximum deformation spacing, controls the bond strength
between reinforcing steel and concrete.
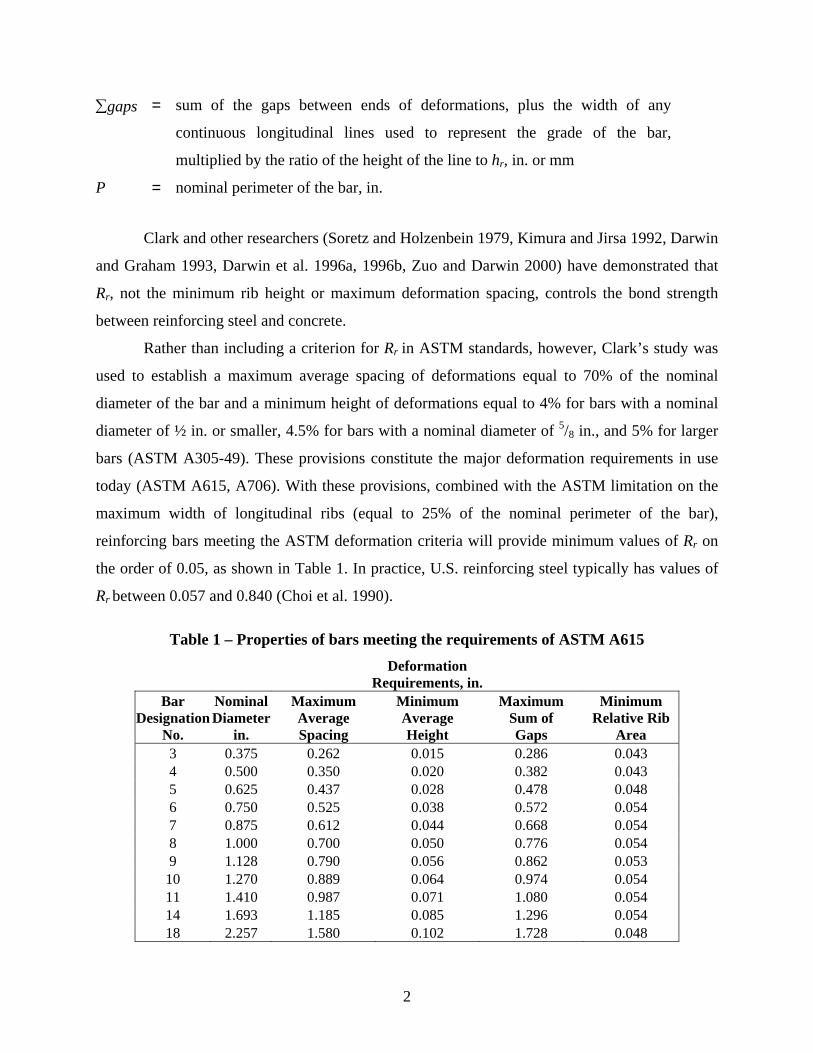
Rather than including a criterion for Rr in ASTM standards, however, Clark’s study was
used to establish a maximum average spacing of deformations equal to 70% of the nominal
diameter of the bar and a minimum height of deformations equal to 4% for bars with a nominal
diameter of ½ in. or smaller, 4.5% for bars with a nominal diameter of 5/8 in., and 5% for larger
bars (ASTM A305-49). These provisions constitute the major deformation requirements in use
today (ASTM A615, A706). With these provisions, combined with the ASTM limitation on the
maximum width of longitudinal ribs (equal to 25% of the nominal perimeter of the bar),
reinforcing bars meeting the ASTM deformation criteria will provide minimum values of Rr on
the order of 0.05, as shown in Table 1. In practice, U.S. reinforcing steel typically has values of
Rr between 0.057 and 0.840 (Choi et al. 1990).
Table 1 – Properties of bars meeting the requirements of ASTM A615
Deformation
Requirements, in. Bar
Designation No.
Nominal Diameter
in.
Maximum Average Spacing
Minimum Average Height
Maximum Sum of Gaps
Minimum Relative Rib
Area 3 0.375 0.262 0.015 0.286 0.043 4 0.500 0.350 0.020 0.382 0.043 5 0.625 0.437 0.028 0.478 0.048 6 0.750 0.525 0.038 0.572 0.054 7 0.875 0.612 0.044 0.668 0.054 8 1.000 0.700 0.050 0.776 0.054 9 1.128 0.790 0.056 0.862 0.053
10 1.270 0.889 0.064 0.974 0.054 11 1.410 0.987 0.071 1.080 0.054 14 1.693 1.185 0.085 1.296 0.054 18 2.257 1.580 0.102 1.728 0.048
2

Using specially machined 1-in. diameter bars with relative rib areas ranging from 0.05 to
0.20 (within and above the typical range of Rr), Darwin and Graham(1993) demonstrated that the
relative rib area plays no role in the bond strength for bars not confined by transverse
reinforcement but does play a role for bars confined by transverse reinforcement. The results
obtained by Darwin and Graham (1993) are summarized in Figure 1. It shows that the bond
strength of bars confined by transverse reinforcement is principally controlled by the relative rib
area, which is governed by the combination of deformation height and spacing, not by the
minimum height or the maximum spacing alone. One item worth noting (Figure 1) is that the
bars with deformation height h = 0.10 had a deformation spacing of 1 in., equal to one bar
diameter and, thus, greater than the value of 70% of the bar diameter allowed by ASTM A615,
but performed as well as bars with closer deformation spacings. These observations have been
shown to be true for conventional reinforcement with a wide range of relative rib areas (Darwin
et al. 1996a, 1996b, Zuo and Darwin 2000). The role of the relative rib area is now well
understood and widely accepted (ACI Committee 408 2001, 2003).
Figure 1 Relationship between bond strength and relative rib area for machined bars with heights of deformation equal to 0.05, 0.075, and 0.100 in. (Darwin and Graham 1993)
The bond test used by Darwin and Graham (1993) has been standardized as ASTM A944
“Standard Test Method for Comparing Bond Strength of Steel Reinforcing Bars to Concrete
Using Beam-End Specimens.” One application of the test procedure is to qualify epoxy-coated
reinforcement specified in ASTM A775 and A934.
3
In the current study, No. 5 and No. 10 bars are tested for bond strength in accordance
with ASTM A944. For each bar size, the bond strength of bars with deformations that exceed the
maximum spacing requirements is compared with the bond strength of bars that meet the spacing
requirements. The results match those of earlier tests and demonstrate that the bars will provide
satisfactory bond performance and can be used in all reinforced concrete construction.
EXPERIMENTAL WORK
Bar Properties
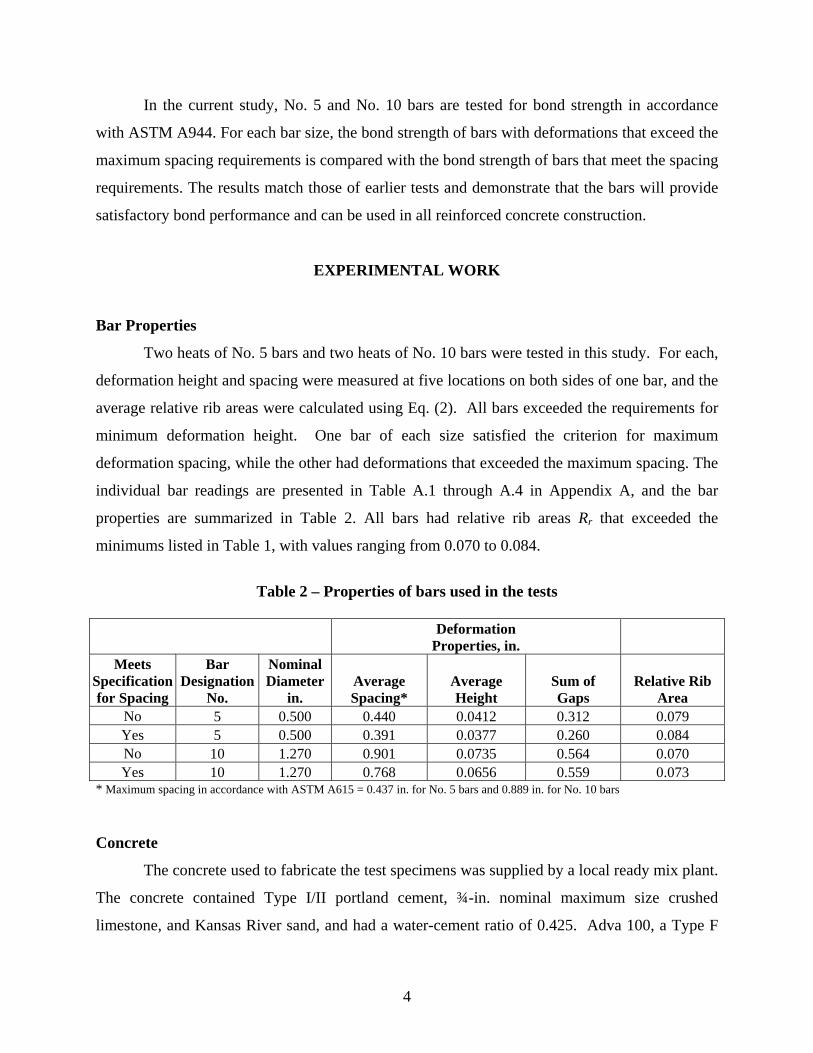
Two heats of No. 5 bars and two heats of No. 10 bars were tested in this study. For each,
deformation height and spacing were measured at five locations on both sides of one bar, and the
average relative rib areas were calculated using Eq. (2). All bars exceeded the requirements for
minimum deformation height. One bar of each size satisfied the criterion for maximum
deformation spacing, while the other had deformations that exceeded the maximum spacing. The
individual bar readings are presented in Table A.1 through A.4 in Appendix A, and the bar
properties are summarized in Table 2. All bars had relative rib areas Rr that exceeded the
minimums listed in Table 1, with values ranging from 0.070 to 0.084.
Table 2 – Properties of bars used in the tests
Deformation
Properties, in. Meets
Specification for Spacing
Bar Designation
No.
Nominal Diameter
in. Average Spacing*
Average Height
Sum of Gaps
Relative Rib Area
No 5 0.500 0.440 0.0412 0.312 0.079 Yes 5 0.500 0.391 0.0377 0.260 0.084 No 10 1.270 0.901 0.0735 0.564 0.070 Yes 10 1.270 0.768 0.0656 0.559 0.073
* Maximum spacing in accordance with ASTM A615 = 0.437 in. for No. 5 bars and 0.889 in. for No. 10 bars
Concrete
The concrete used to fabricate the test specimens was supplied by a local ready mix plant.
The concrete contained Type I/II portland cement, ¾-in. nominal maximum size crushed
limestone, and Kansas River sand, and had a water-cement ratio of 0.425. Adva 100, a Type F
4
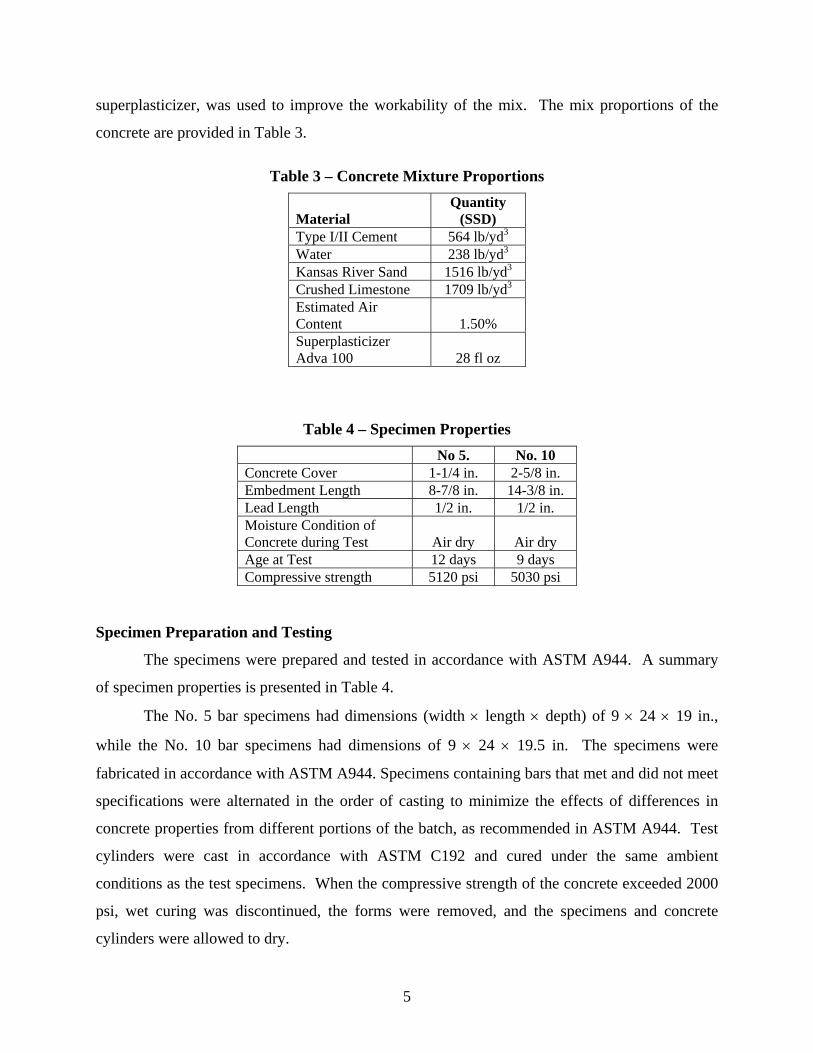
superplasticizer, was used to improve the workability of the mix. The mix proportions of the
concrete are provided in Table 3.
Table 3 – Concrete Mixture Proportions
Material Quantity
(SSD) Type I/II Cement 564 lb/yd3
Water 238 lb/yd3
Kansas River Sand 1516 lb/yd3
Crushed Limestone 1709 lb/yd3
Estimated Air Content 1.50% Superplasticizer Adva 100 28 fl oz
Table 4 – Specimen Properties No 5. No. 10 Concrete Cover 1-1/4 in. 2-5/8 in. Embedment Length 8-7/8 in. 14-3/8 in. Lead Length 1/2 in. 1/2 in. Moisture Condition of Concrete during Test
Air dry
Air dry
Age at Test 12 days 9 days Compressive strength 5120 psi 5030 psi
Specimen Preparation and Testing
The specimens were prepared and tested in accordance with ASTM A944. A summary
of specimen properties is presented in Table 4.
The No. 5 bar specimens had dimensions (width × length × depth) of 9 × 24 × 19 in.,
while the No. 10 bar specimens had dimensions of 9 × 24 × 19.5 in. The specimens were
fabricated in accordance with ASTM A944. Specimens containing bars that met and did not meet
specifications were alternated in the order of casting to minimize the effects of differences in
concrete properties from different portions of the batch, as recommended in ASTM A944. Test
cylinders were cast in accordance with ASTM C192 and cured under the same ambient
conditions as the test specimens. When the compressive strength of the concrete exceeded 2000
psi, wet curing was discontinued, the forms were removed, and the specimens and concrete
cylinders were allowed to dry.
5

Fourteen beam-end specimens were cast and 13 were tested for each bar size; seven
specimens contained bars that did not meet the deformation spacing requirements of ASTM
A615 and six specimens contained bars that met all of requirements of ASTM A615. For the
No. 5 and 10 bar tests, respectively, Specimens 1 and 13, containing bars that met the
specification, were used to verify the functionality of the testing equipment and do not appear in
this report.
During the tests, displacements at the loaded and unloaded ends of the bars were
measured using linear variable differential transformers (LVDTs), while loads were measured
using calibrated load cells that served as loading rods for the test. The loading rates for the
specimens satisfied the requirements in ASTM A944 and are given in Table 4.
RESULTS
No. 5 bar specimens – The specimens containing the No. 5 bars were tested over a five-
hour period. The average concrete compressive strength was 5120 psi (individual cylinder
strengths of 5070, 5140 and 5160 psi). Electronic interference impaired the accuracy of the
LVDTs used to measure bar slip. Therefore, the loaded and unloaded end displacements for
specimens with No. 5 reinforcement have been omitted from this report.
Table 4 – Loading rates
No. 5 bar specimens No. 10 bar specimens
Specimen Load Rate(kips/min)
Specimen Load Rate(kips/min)
2 3.41 1 6.30 3 4.60 2 6.06 4 2.40 3 6.24 5 3.24 4 8.60 6 2.21 5 6.93 7 3.07 6 11.04 8 4.45 7 9.62 9 4.02 8 11.00
10 1.95 9 10.50 11 3.96 10 9.68 12 5.52 11 10.05 13 2.98 12 10.14 14 3.58 14 12.44
6
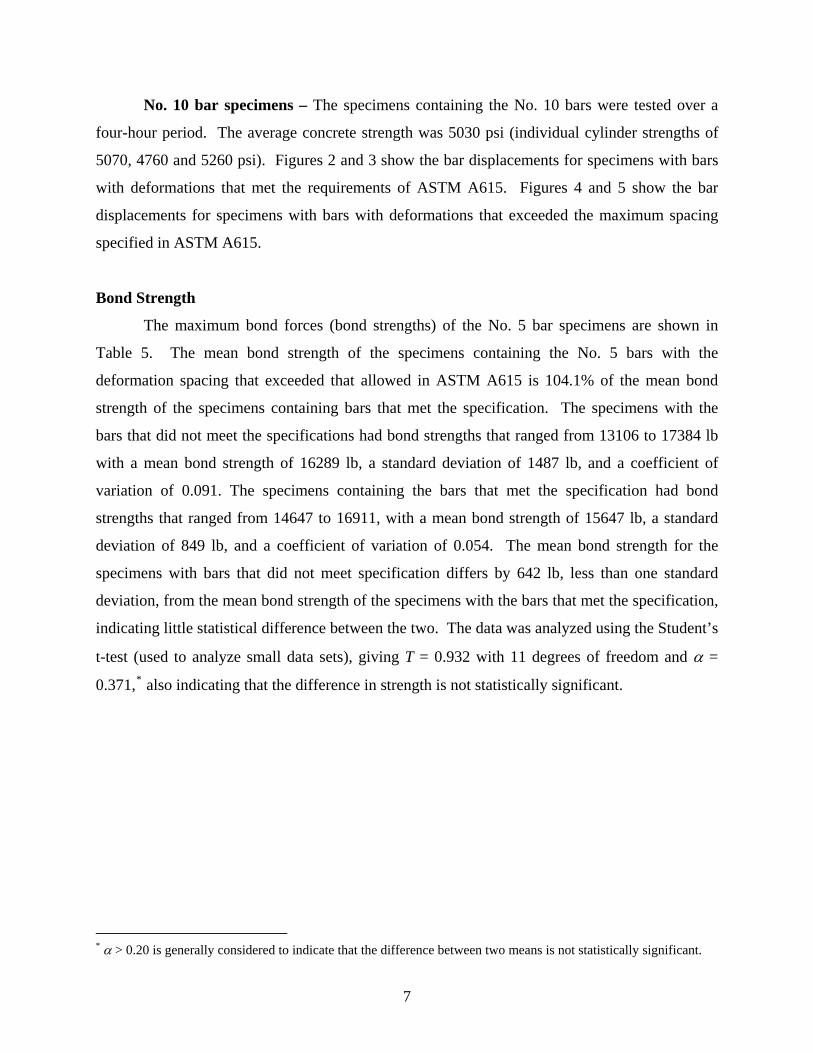
No. 10 bar specimens – The specimens containing the No. 10 bars were tested over a
four-hour period. The average concrete strength was 5030 psi (individual cylinder strengths of
5070, 4760 and 5260 psi). Figures 2 and 3 show the bar displacements for specimens with bars
with deformations that met the requirements of ASTM A615. Figures 4 and 5 show the bar
displacements for specimens with bars with deformations that exceeded the maximum spacing
specified in ASTM A615.
Bond Strength
The maximum bond forces (bond strengths) of the No. 5 bar specimens are shown in
Table 5. The mean bond strength of the specimens containing the No. 5 bars with the
deformation spacing that exceeded that allowed in ASTM A615 is 104.1% of the mean bond
strength of the specimens containing bars that met the specification. The specimens with the
bars that did not meet the specifications had bond strengths that ranged from 13106 to 17384 lb
with a mean bond strength of 16289 lb, a standard deviation of 1487 lb, and a coefficient of
variation of 0.091. The specimens containing the bars that met the specification had bond
strengths that ranged from 14647 to 16911, with a mean bond strength of 15647 lb, a standard
deviation of 849 lb, and a coefficient of variation of 0.054. The mean bond strength for the
specimens with bars that did not meet specification differs by 642 lb, less than one standard
deviation, from the mean bond strength of the specimens with the bars that met the specification,
indicating little statistical difference between the two. The data was analyzed using the Student’s
t-test (used to analyze small data sets), giving T = 0.932 with 11 degrees of freedom and α =
0.371,* also indicating that the difference in strength is not statistically significant.
* α > 0.20 is generally considered to indicate that the difference between two means is not statistically significant.
7

0
5000
10000
15000
20000
25000
30000
35000
40000
45000
0 0.04 0.08 0.12 0.16 0.2 0.24 0.28 0.32 0.36 0.4
Displacement, in.
Load
, lb.
Specimen 1 Specimen 3 Specimen 5 Specimen 7Specimen 9 Specimen 11
Figure 2 – Loaded-end slip versus load for specimens with reinforcement meeting the
deformation spacing requirements in ASTM A615.
0
5000
10000
15000
20000
25000
30000
35000
40000
45000
0 0.02 0.04 0.06 0.08 0.1 0.12 0.14 0.16 0.18 0.2 0.22 0.24 0.26 0.28 0.3
Displacement, in.
Load
, lb.
Specimen 1 Specimen 3 Specimen 5 Specimen 7Specimen 9 Specimen 11
Figure 3 – Unloaded-end slip versus load for specimens with reinforcement meeting the
deformation spacing requirements in ASTM A615.
8

0
5000
10000
15000
20000
25000
30000
35000
40000
45000
0 0.04 0.08 0.12 0.16 0.2 0.24 0.28 0.32 0.36 0.4
Displacement, in.
Load
, lb.
Specimen 2 Specimen 4 Specimen 6 Specimen 8Specimen 10 Specimen 12 Specimen 14
Figure 4 – Loaded-end slip versus load for specimens with reinforcement that exceeded the maximum deformation spacing requirements in ASTM A615.
0
5000
10000
15000
20000
25000
30000
35000
40000
45000
0 0.04 0.08 0.12 0.16 0.2 0.24 0.28 0.32 0.36 0.4
Displacement, in.
Load
, lb.
Specimen 2 Specimen 4 Specimen 6 Specimen 8Specimen 10 Specimen 12 Specimen 14
Figure 5 – Unloaded-end slip versus load for specimens with reinforcement that exceeded the
maximum deformation spacing requirements in ASTM A615.
9
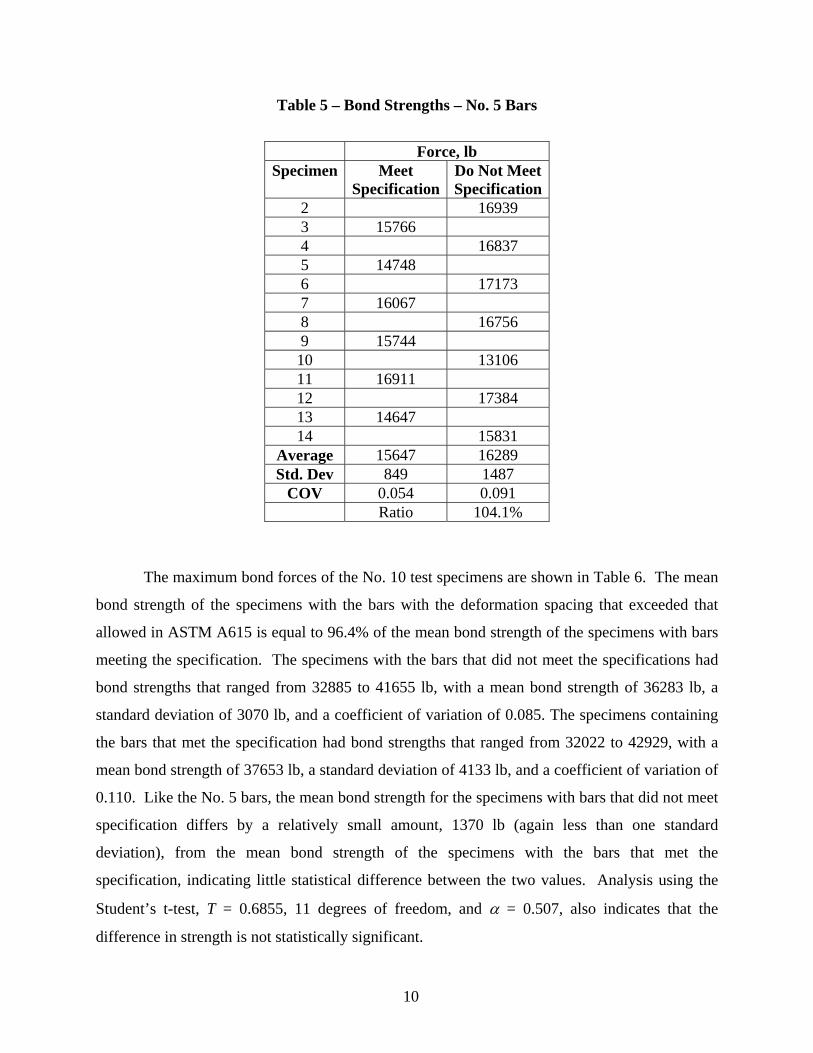
Table 5 – Bond Strengths – No. 5 Bars
Force, lb
Specimen Meet Specification
Do Not MeetSpecification
2 16939 3 15766 4 16837 5 14748 6 17173 7 16067 8 16756 9 15744 10 13106 11 16911 12 17384 13 14647 14 15831
Average 15647 16289 Std. Dev 849 1487
COV 0.054 0.091 Ratio 104.1%
The maximum bond forces of the No. 10 test specimens are shown in Table 6. The mean
bond strength of the specimens with the bars with the deformation spacing that exceeded that
allowed in ASTM A615 is equal to 96.4% of the mean bond strength of the specimens with bars
meeting the specification. The specimens with the bars that did not meet the specifications had
bond strengths that ranged from 32885 to 41655 lb, with a mean bond strength of 36283 lb, a
standard deviation of 3070 lb, and a coefficient of variation of 0.085. The specimens containing
the bars that met the specification had bond strengths that ranged from 32022 to 42929, with a
mean bond strength of 37653 lb, a standard deviation of 4133 lb, and a coefficient of variation of
0.110. Like the No. 5 bars, the mean bond strength for the specimens with bars that did not meet
specification differs by a relatively small amount, 1370 lb (again less than one standard
deviation), from the mean bond strength of the specimens with the bars that met the
specification, indicating little statistical difference between the two values. Analysis using the
Student’s t-test, T = 0.6855, 11 degrees of freedom, and α = 0.507, also indicates that the
difference in strength is not statistically significant.
10
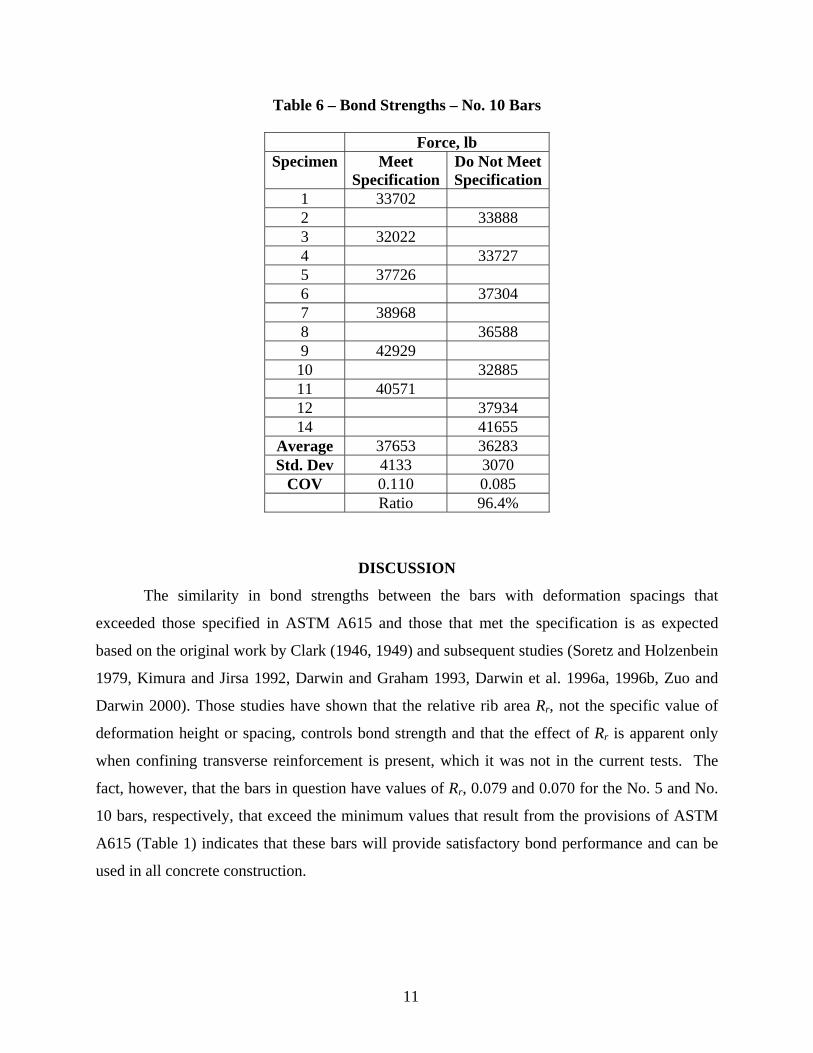
Table 6 – Bond Strengths – No. 10 Bars
Force, lb Specimen Meet
SpecificationDo Not MeetSpecification
1 33702 2 33888 3 32022 4 33727 5 37726 6 37304 7 38968 8 36588 9 42929 10 32885 11 40571 12 37934 14 41655
Average 37653 36283 Std. Dev 4133 3070
COV 0.110 0.085 Ratio 96.4%
DISCUSSION
The similarity in bond strengths between the bars with deformation spacings that
exceeded those specified in ASTM A615 and those that met the specification is as expected
based on the original work by Clark (1946, 1949) and subsequent studies (Soretz and Holzenbein
1979, Kimura and Jirsa 1992, Darwin and Graham 1993, Darwin et al. 1996a, 1996b, Zuo and
Darwin 2000). Those studies have shown that the relative rib area Rr, not the specific value of
deformation height or spacing, controls bond strength and that the effect of Rr is apparent only
when confining transverse reinforcement is present, which it was not in the current tests. The
fact, however, that the bars in question have values of Rr, 0.079 and 0.070 for the No. 5 and No.
10 bars, respectively, that exceed the minimum values that result from the provisions of ASTM
A615 (Table 1) indicates that these bars will provide satisfactory bond performance and can be
used in all concrete construction.
11

CONCLUSIONS
The following conclusions are based on the results of the tests and analysis presented in
this report.
1. The tests match earlier research and demonstrate that bond strength is not governed by
the specific value of deformation height or spacing, but by the combination of the two, as
represented by the relative rib area of the bars.
2. The bond strengths of the bars with deformation spacings that exceed those specified
in ASTM A615 are similar to those that meet the specification. The differences in bond
strength are not statistically significant.
3. The bars tested in this study with deformation spacings that exceed those specified in
ASTM A615 have relative rib areas that exceed the minimum values that result from the
provisions of ASTM A615. They will provide satisfactory bond performance and can be
used in all concrete construction.
REFERENCES
ACI Committee 408. 2001. Splice and Development Length of High Relative Rib Area Reinforcing Bars in Tension (ACI 408.3-01), American Concrete Institute, Farmington Hills, MI. ACI Committee 408. 2003. Bond and Development of Straight Reinforcing Bars in Tension (ACI 408R-03), American Concrete Institute, Farmington Hills, Michigan, 49 pp. ASTM A305. 1949. “Specification for Minimum Requirements for the Deformations of Deformed Steel Bars for Concrete Reinforcement,” (ASTM A305-49), American Society for Testing and Materials, Philadelphia, 1949. ASTM A615. 2007. “Standard Specification for Deformed and Plain Carbon-Steel Bars for Concrete Reinforcement,” (ASTM A615/615M-07), ASTM International, West Conshohocken PA. ASTM A706. 2006. “Standard Specification for Low-Alloy Steel Deformed and Plain Bars for Concrete Reinforcement,” (ASTM A706/A706M-06a), ASTM International, West Conshohocken PA. ASTM A775. 2007. “Standard Specification for Epoxy-Coated Steel Reinforcing Bars,” (ASTM A775/A775M-07b), ASTM International, West Conshohocken PA.
12
ASTM A934. 2007. “Standard Specification for Epoxy-Coated Prefabricated Steel Reinforcing Bars,” (ASTM A934/A934M-07), ASTM International, West Conshohocken PA. ASTM A944. 2005. “Standard Test Method for Comparing Bond Strength of Steel Reinforcing Bars to Concrete Using Beam-End Specimens,” (ASTM A944-05), ASTM International, West Conshohocken PA, 4 pp. ASTM C192. 2007. “Standard Practice for Making and Curing Concrete Test Specimens in the Laboratory ,” (ASTM C192/C192M-07), ASTM International, West Conshohocken PA. Choi, Oan Chul; Hadje-Ghaffari. Hossain; Darwin, David; and McCabe, Steven L., 1990. "Bond of Epoxy-Coated Reinforcement to Concrete: Bar Parameters," SL Report 90-1, University of Kansas Center for Research, Lawrence, Jan., 43 pp. Choi, Oan Chul; Hadje-Ghaffari, Hossain; Darwin, David; and McCabe, Steven L., 1991. "Bond of Epoxy-Coated Reinforcement: Bar Parameters," ACI Materials Journal, Vol. 88, No. 2, Mar.-Apr., pp. 207-217. Clark, A. P. 1946. "Comparative Bond Efficiency of Deformed Concrete Reinforcing Bars," ACI Journal, Proceedings Vol. 43, No. 4, Dec., pp. 381-400. Clark, A. P. 1949. "Bond of Concrete Reinforcing Bars," ACI Journal, Proceedings Vol. 46, No. 3, Nov., pp. 161-184. Darwin, D. and Graham, E. K. 1993. “Effect of Deformation Height and Spacing on Bond Strength of Reinforcing Bars,” ACI Structural Journal, Vol. 90, No. 6, Nov.-Dec., pp. 646-657. Darwin, D., Tholen, M. L., Idun, E. K., and Zuo, J. 1996a. “Splice Strength of High Relative Rib Area Reinforcing Bars,” ACI Structural Journal, Vol. 93, No. 1, Jan.-Feb., pp. 95-107. Darwin, D., Zuo, J., Tholen, M. L., and Idun, E. K. 1996b. “Development Length Criteria for Conventional and High Relative Rib Area Reinforcing Bars,” ACI Structural Journal, Vol. 93, No. 3, May-June, pp. 347-359. Zuo, J. and Darwin, D. 2000. “Bond Slip of High Relative Rib Area Bars under Cyclic Loading,” ACI Structural Journal, Vol. 97, No. 2, Mar. - Apr, pp. 331-334.
13

Appendix A
Table A.1 – Deformation readings for No. 5 bars, deformation spacing exceeds requirements of ASTM A615
No.5 Rib Height h r , mm Out of specification10 sets 1 2 3 4 5 6 7 8 9end 0.79 0.92 0.93 0.78 0.79 0.95 1.09 0.89 0.93 0.791/4 0.84 0.99 1.2 1.04 1.06 1.01 1.27 1.12 1.02 1.041/2 1.18 1.09 1.12 1.08 1.3 1.25 1.15 1.05 1 1.181/4 1 0.95 1.11 1.24 1.12 1.11 1.04 1.04 1.18 1.14end 0.79 0.7 0.99 0.9 0.88 0.96 0.85 0.87 0.99 1.11End average 0.79 0.81 0.96 0.84 0.835 0.955 0.97 0.88 0.96 0.95Set average 0.95 0.96 1.10 1.05 1.08 1.08 1.11 1.02 1.04 1.08Overall average (mm) 1.05Overall average (inch) 0.0412
Rib Spacing s r , mm10 sets 1 2 3 4 5 6 7 8 9length 134 99.1 122.9 123.1 133.9 145.8 146.1 134.9 133.4 100.4# of spacings 12 9 11 11 12 13 13 12 12 9set average 11.17 11.01 11.17 11.19 11.16 11.22 11.24 11.24 11.12 11.16Overall average (mm) 11.17Overall average (inch) 0.440
Height of the continous line, mm10 sets 1 2 3 4 5 6 7 8 9Line height 0.4 0.36 0.41 0.36 0.4 0.39 0.39 0.38 0.37 0.36Average line height 0.38
Width of Gaps and continuous line, mm10 sets 1 2 3 4 5 6 7 8 9rib gap 3.44 3.61 3.72 3.65 3.89 3.59 3.69 3.78 3.82 3.62rib gap 3.47 3.54 3.62 3.74 3.61 3.52 3.65 3.7 3.89 3.68continuous lines 1.65 1.72 1.75 1.63 1.65 1.62 1.64 1.61 1.64 1.61Sum of gap 7.51 7.78 7.98 7.98 8.10 7.70 7.94 8.07 8.31 7.89Average of sum (mm) 7.93Average of sum (inch) 0.312
Relative rib area0.079
10
10
10
10
14
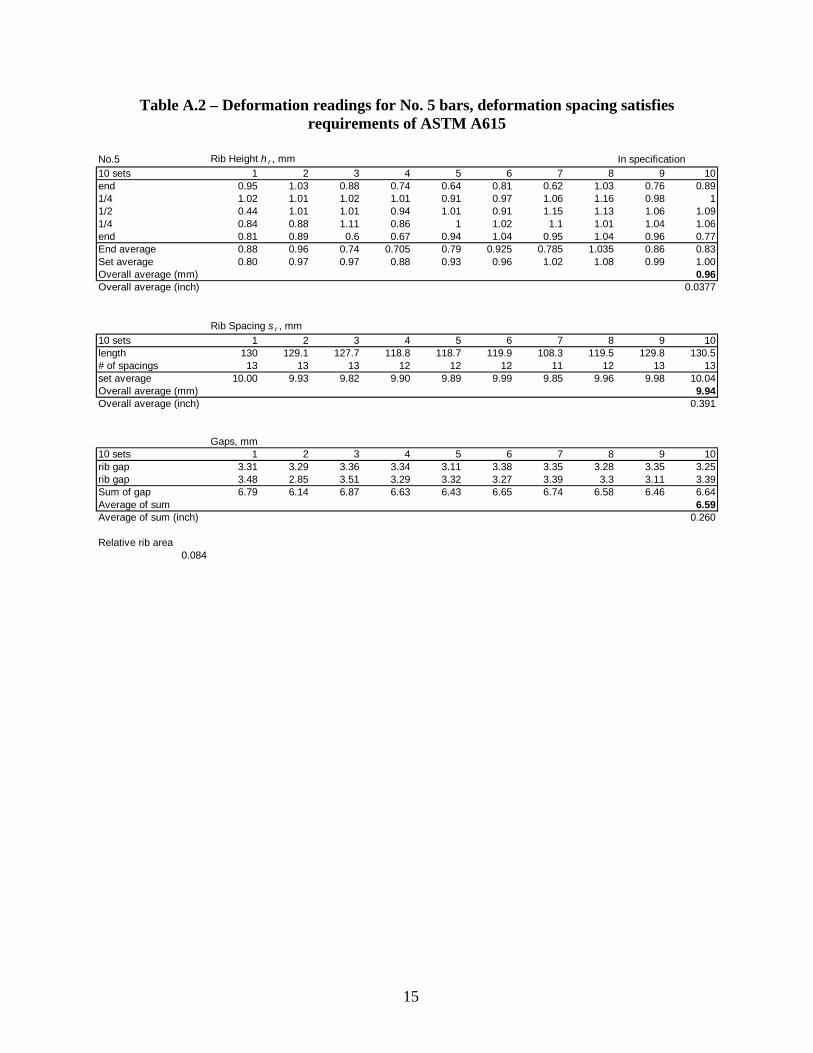
Table A.2 – Deformation readings for No. 5 bars, deformation spacing satisfies requirements of ASTM A615
No.5 Rib Height h r , mm In specification10 sets 1 2 3 4 5 6 7 8 9end 0.95 1.03 0.88 0.74 0.64 0.81 0.62 1.03 0.76 0.891/4 1.02 1.01 1.02 1.01 0.91 0.97 1.06 1.16 0.98 11/2 0.44 1.01 1.01 0.94 1.01 0.91 1.15 1.13 1.06 1.091/4 0.84 0.88 1.11 0.86 1 1.02 1.1 1.01 1.04 1.06end 0.81 0.89 0.6 0.67 0.94 1.04 0.95 1.04 0.96 0.77End average 0.88 0.96 0.74 0.705 0.79 0.925 0.785 1.035 0.86 0.83Set average 0.80 0.97 0.97 0.88 0.93 0.96 1.02 1.08 0.99 1.00Overall average (mm) 0.96Overall average (inch) 0.0377
Rib Spacing s r , mm10 sets 1 2 3 4 5 6 7 8 9length 130 129.1 127.7 118.8 118.7 119.9 108.3 119.5 129.8 130.5# of spacings 13 13 13 12 12 12 11 12 13 13set average 10.00 9.93 9.82 9.90 9.89 9.99 9.85 9.96 9.98 10.04Overall average (mm) 9.94Overall average (inch) 0.391
Gaps, mm10 sets 1 2 3 4 5 6 7 8 9rib gap 3.31 3.29 3.36 3.34 3.11 3.38 3.35 3.28 3.35 3.25rib gap 3.48 2.85 3.51 3.29 3.32 3.27 3.39 3.3 3.11 3.39Sum of gap 6.79 6.14 6.87 6.63 6.43 6.65 6.74 6.58 6.46 6.64Average of sum 6.59Average of sum (inch) 0.260
Relative rib area0.084
10
10
10
15

Table A.3 – Deformation readings for No. 10 bars, deformation spacing exceeds requirements of ASTM A615
No.10 Rib Height h r , mm Out specification10 sets 1 2 3 4 5 6 7 8 9end 1.91 1.98 2.03 1.82 1.99 1.99 1.97 2.08 1.93 2.141/4 2.07 2.13 1.98 1.76 1.78 1.86 1.97 1.79 1.96 1.81/2 1.97 1.69 1.97 1.56 1.7 1.67 1.96 1.6 2.14 1.741/4 1.82 1.78 1.79 1.95 1.77 1.87 2.12 2.09 2.05 1.6end 1.75 1.74 1.53 1.91 1.86 1.8 1.65 1.82 1.99 1.59End average 1.83 1.86 1.78 1.865 1.925 1.895 1.81 1.95 1.96 1.865Set average 1.92 1.87 1.88 1.78 1.79 1.82 1.97 1.86 2.03 1.75Overall average (mm) 1.87Overall average (inch) 0.0735
Rib Spacing s r , mm10 sets 1 2 3 4 5 6 7 8 9length 136.8 138.5 137.5 138.4 137.6 137.5 113.1 114.1 137.6 113.8# of spacings 6 6 6 6 6 6 5 5 6 5set average 22.80 23.08 22.92 23.07 22.93 22.92 22.62 22.82 22.93 22.76Overall average (mm) 22.89Overall average (inch) 0.901
Height of the continous line, mm10 sets 1 2 3 4 5 6 7 8 9Line height 0.35 0.34 0.26 0.23 0.31 0.33 0.27 0.27 0.29 0.28Average line height 0.293
Width of Gaps and continuous line, mm10 sets 1 2 3 4 5 6 7 8 9rib gap 6.8 7.2 7.2 6.8 7.0 6.9 7.3 7.2 7.0 6.9rib gap 7.0 6.9 7.0 6.9 7.0 7.1 7.0 7.0 7.1 7.0continuous lines 1.96 1.95 1.96 1.91 1.87 1.94 1.93 1.95 1.96 1.98Sum of gap 14.11 14.41 14.51 14.00 14.29 14.30 14.60 14.51 14.41 14.21Average of sum 14.33Average of sum (inch) 0.564
Relative rib area0.070
10
10
10
10
16
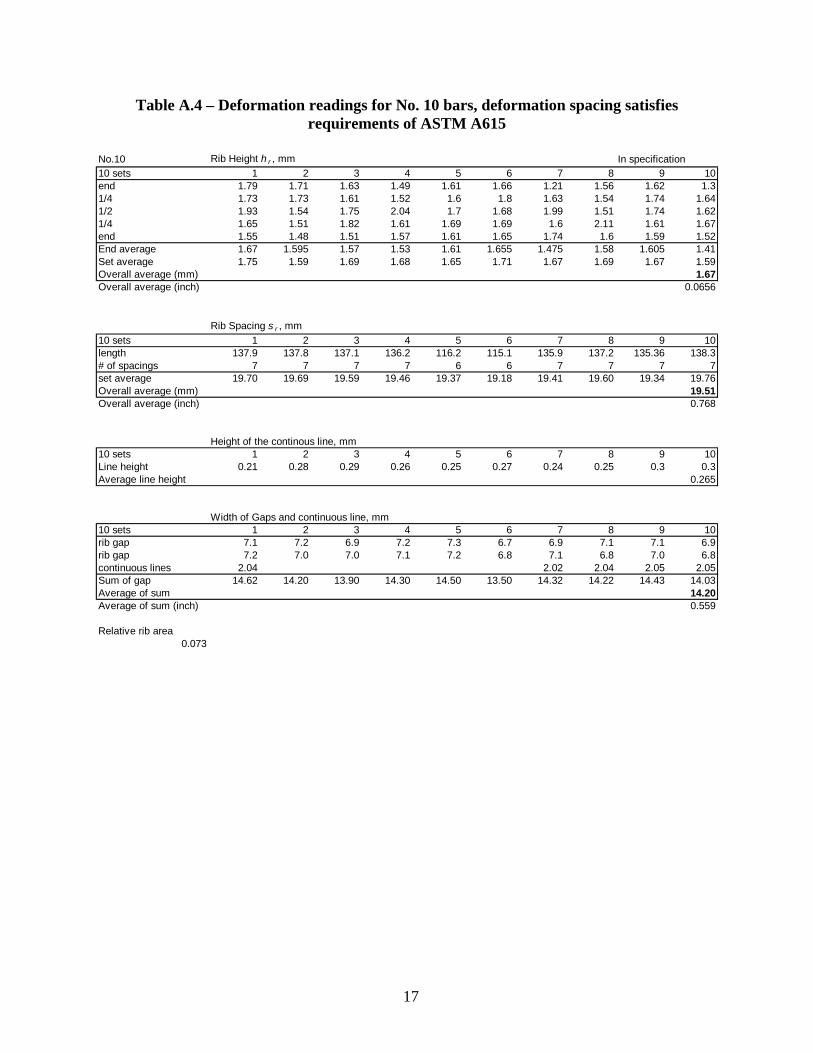
Table A.4 – Deformation readings for No. 10 bars, deformation spacing satisfies requirements of ASTM A615
No.10 Rib Height h r , mm In specification10 sets 1 2 3 4 5 6 7 8 9end 1.79 1.71 1.63 1.49 1.61 1.66 1.21 1.56 1.62 1.31/4 1.73 1.73 1.61 1.52 1.6 1.8 1.63 1.54 1.74 1.641/2 1.93 1.54 1.75 2.04 1.7 1.68 1.99 1.51 1.74 1.621/4 1.65 1.51 1.82 1.61 1.69 1.69 1.6 2.11 1.61 1.67end 1.55 1.48 1.51 1.57 1.61 1.65 1.74 1.6 1.59 1.52End average 1.67 1.595 1.57 1.53 1.61 1.655 1.475 1.58 1.605 1.41Set average 1.75 1.59 1.69 1.68 1.65 1.71 1.67 1.69 1.67 1.59Overall average (mm) 1.67Overall average (inch) 0.0656
Rib Spacing s r , mm10 sets 1 2 3 4 5 6 7 8 9length 137.9 137.8 137.1 136.2 116.2 115.1 135.9 137.2 135.36 138.3# of spacings 7 7 7 7 6 6 7 7 7 7set average 19.70 19.69 19.59 19.46 19.37 19.18 19.41 19.60 19.34 19.76Overall average (mm) 19.51Overall average (inch) 0.768
Height of the continous line, mm10 sets 1 2 3 4 5 6 7 8 9Line height 0.21 0.28 0.29 0.26 0.25 0.27 0.24 0.25 0.3 0.3Average line height 0.265
Width of Gaps and continuous line, mm10 sets 1 2 3 4 5 6 7 8 9rib gap 7.1 7.2 6.9 7.2 7.3 6.7 6.9 7.1 7.1 6.9rib gap 7.2 7.0 7.0 7.1 7.2 6.8 7.1 6.8 7.0 6.8continuous lines 2.04 2.02 2.04 2.05 2.05Sum of gap 14.62 14.20 13.90 14.30 14.50 13.50 14.32 14.22 14.43 14.03Average of sum 14.20Average of sum (inch) 0.559
Relative rib area0.073
10
10
10
10
17
