bond funds
DESCRIPTION
Nice paperTRANSCRIPT

Investor Flows and Fragility in Corporate Bond Funds
Itay Goldstein The Wharton School
Hao Jiang
Michigan State University
David T. Ng Cornell University
April 2015
Preliminary
We are grateful for helpful comments and suggestions from Byoung-Hyoun Hwang, Pamela Moulton, Stefan Nagel, Yongxiang Wang and seminar participants at Cornell University brownbag workshop. Goldstein is at the Wharton School of Business (phone: (215)746-0499; email: [email protected]); Jiang is at the Eli Broad School of Business at Michigan State University (phone: (517)353-2920; email: [email protected]); and Ng is at the Dyson School of Applied Economics and Management at Cornell University (phone: (607)255-0145; email: [email protected]).

1
Investor Flows and Fragility in Corporate Bond Funds
Abstract
Investment in bond mutual funds has grown rapidly in recent years. With it, there is a growing
concern that they are a new source of potential fragility. While there is a vast literature on flows
in equity mutual funds, relatively little research has been done on bond mutual funds. In this
paper, we explore flow patterns in corporate-bond mutual funds. We show that their flows
behave very differently than those of equity mutual funds. While we confirm the well-known
convex shape for equity funds’ flow-to-performance over the period of our study (1992-2014),
we show that during the same time, corporate bond funds exhibit a very clear concave shape:
their outflows are sensitive to bad performance much more than their inflows are sensitive to
good performance. Funds have more concave flow-performance relationships when they have
more illiquid assets and when the overall market illiquidity is high. Overall, our empirical results
suggest that corporate bond funds are prone to fragility. The illiquidity of their assets seems to
create strategic complementarities that amplify the response of investors to bad performance or
other bad news.

2
I. Introduction
The landscape of the financial industry is constantly changing, as new financial innovation and
regulation shift activities across different financial institutions and vehicles. One of the dominant
trends of recent years is the growth of assets under management by fixed income mutual funds,
i.e., mutual funds investing in corporate or government bonds. Data reported by Feroli, Kashyap,
Schoenholtz, and Shin (2014) show that from January 2008 to April 2013, fixed income funds
have attracted multiple times more inflows compared to equity, money market, allocation and
other funds combined. Data reported by the Investment Company Institute (ICI 2014) show
bond-fund assets roughly doubling over this period.1
Observing this trend, several commentators have argued that bond funds pose a new
threat to financial stability. What will happen when the current trend of loose monetary policy
changes? Will massive flows out of bond funds and massive sales of assets by these funds
destabilize debt markets with potential adverse consequences for the real economy? Feroli,
Kashyap, Schoenholtz, and Shin (2014) use evidence from the dynamics of bond funds to show
that flows into and out of funds seem to aggravate and be aggravated by changes in bond prices.
They conclude that this suggests the potential for instability to come out of this industry. They
analyze the market “tantrum” around the announcement of the possible tightening of monetary
policy in 2013, and suggest that events like this can put the bond market under stress due to
amplification coming from bond mutual funds.
In order to get a better understanding of the potential threats to stability posed by bond
mutual funds, we need more research on the flows into and out of these funds. By now, there is a
vast literature on flows in equity mutual funds – see recent review by Christoffersen, Musto, and
Wermers (2014) – but surprisingly very little research has been done on bond mutual funds. In
this paper, we try to fill the gap and provide a first step in the analysis of the flows in bond funds.
We focus on active corporate bond funds in the period between January 1992 and December
2014. Our analysis shows that flows in corporate bond funds exhibit very different patterns than
what has been the common observation in the vast literature on equity-fund flows.
1 See Section II.A for details on the developments in the bond fund industry.

3
A pervasive result in the empirical literature on equity mutual funds is that the flow-to-
performance relation tends to have a convex shape, that is, inflows to equity funds tend to be
very sensitive to good past performance, but outflows are overall not that sensitive to bad past
performance. Papers documenting this pattern, discussing its origins and consequences include:
Ippolito (1992), Brown, Harlow, and Starks (1996), Chevalier and Ellison (1997), Sirri and
Tufano (1998), Lynch and Musto (2003), Huang, Wei and Yan (2007), among others.
Considering the context of fragility, a convex flow-to-performance curve suggests that fragility
is not a pressing concern. If investors do not rush to take their money out of funds following
negative developments, then one should not worry so much about outflows depressing prices and
leading to negative consequences for the real economy.
Our evidence, however, shows that corporate bond funds exhibit a very different pattern
from equity funds when it comes to the sensitivity of flow to performance. While we confirm a
convex shape for equity funds’ flow-to-performance over the period of our study (1992-2014),
we show that during the same time, corporate bond funds exhibit a very clear concave shape:
Their outflows are sensitive to bad performance much more than their inflows are sensitive to
good performance. Moreover, the sensitivity of flows in corporate bond funds in the negative
(positive) region is greater (smaller) than that in equity funds.
One way to explain this result is related to Chen, Goldstein, and Jiang (2010) who
compare the sensitivity of outflows to bad performance between equity funds that hold illiquid
assets and equity funds that hold liquid assets. They show that outflows are much more sensitive
to bad performance in illiquid funds and relate the result to strategic complementarities and
financial fragility. In illiquid funds, outflows impose greater liquidation costs on the fund when
readjusting the portfolio. Since portfolio readjustments typically happen in the days after the
actual redemption and investors get the net asset value as of the day of redemption, withdrawing
money out of the fund leads to negative externalities on other investors who keep their money in
the fund. This causes strategic complementarities, similar to a classic run phenomenon (e.g.,
4
Diamond and Dybvig (1983)), amplifying the flows out of illiquid funds following bad
performance.2
Indeed, corporate bond funds are in many cases illiquid. Unlike equity, which typically
trades many times throughout the day, corporate bonds may not trade for weeks and trading costs
in them can be very large. Despite the illiquidity of their holdings, corporate bond funds quote
their net asset values and prices to investors on a daily basis. As a result, there is a mismatch
between the illiquidity of the fund’s holdings and the liquidity that investors holding the fund get:
they are able to redeem their shares at any moment and get the quoted net asset value. This
implies that investors’ outflows may lead to costly liquidation by the funds, where the costs
would be borne by remaining investors. This creates a ‘run’ dynamic which amplifies the
reaction of outflows to bad performance, suggesting that the potential for fragility indeed exists
in bond funds.
We find additional evidence in support of the idea that asset illiquidity creates strategic
complementarities among bond-fund investors in their redemption decisions. First, we show that
among corporate bond funds, those with lower asset liquidity tend to experience greater
sensitivity of outflows to bad performance, i.e., their flow-performance relationship is more
concave. In order to measure liquidity at the fund level, we use the level of cash holdings, since
funds with more cash suffer lower liquidation costs in case of massive outflows, and so expose
their investors to weaker strategic complementarities.
Second, the liquidation costs imposed on funds due to massive outflows are expected to
be more severe during periods of higher illiquidity, when bonds trade even less and more costly,
and there is more uncertainty about their valuation. We use several measures to proxy for
aggregate uncertainty and illiquidity. These include the VIX index, measuring implied volatility,
the TED spread, measuring the difference between the interest rates on interbank loans and on
treasury bills, and the Federal Funds rates, measuring the rates at which banks trade federal funds
with each other. Consistent with our hypothesis, we find that flow-performance relationships for
bond funds are more concave during periods when these measures are high.
2 Chen, Goldstein, and Jiang (2010) develop a model of runs in the tradition of the global-games literature – e.g., Morris and Shin (1998) and Goldstein and Pauzner (2005) – and show how complementarities will generate this amplification of outflows following bad performance.

5
Third, following the model and empirical results in Chen, Goldstein, and Jiang (2010),
we expect that strategic complementarities will be less important in determining fund outflows if
the fund ownership is mostly composed of institutional investors. This is because institutional
investors are large and so are more likely to internalize the negative externalities generated by
their outflows. Indeed, consistent with this hypothesis, we find that the effect of illiquidity on the
sensitivity of outflow to bad performance diminishes when the fund is held mostly by
institutional investors.
As a case study, we examine the outflows from PIMCO’s Total Return funds in October
2014, shortly after the announcement of Bill Gross’ departure on September 26, 2014. Dubbed as
the “Bond King” by Fortune magazine in 2002, Bill Gross clearly had an enormous effect on
these funds, being the manager and the one that many investors identified these funds with.
Hence, one would expect significant outflows out of these funds following his resignation.
Moreover, following the main theme of our paper, one would expect outflows to be amplified by
illiquidity of the funds’ assets. An interesting case study is offered by the fact that three of the
funds – Total Return Fund, Total Return Fund II, and Total Return Fund III – were very different
in nature than the fourth one – Total Return Fund IV. This last one had significantly higher
amounts of cash and other liquid assets. Indeed, consistent with our hypothesis, it is the only one
out of the four funds that did not see sharp withdrawals following Gross’ resignation, despite the
fact that up until then it had returns that were very highly correlated with those of the other three
funds.
Overall, our empirical results suggest that corporate bond funds are prone to fragility.
The illiquidity of their assets seems to create strategic complementarities that amplify the
response of investors to bad performance or other bad news. These ‘run’ dynamics are very
familiar from the banking context, and recently were on display in the run on money market
mutual funds following the collapse of Lehmann Brothers.3 Attempts to prevent such runs are at
the core of long-standing government intervention and regulation in the banking sector and now
also in the money-market funds industry. It is likely that the surge in activity in corporate bond
funds is a response to the restrictions in these sectors, and so the run problem can shift into the
corporate bond funds arena. Hence, regulators should be on the alert and consider steps to
3 For an empirical study of the run on money market funds, see Schmidt, Timmerman, and Wermers (2014).

6
achieve the value from intermediation by corporate bond funds while minimizing the damage
from fragility.
One thing that distinguishes banks and money market funds from other mutual funds
(including bond funds) is that the latter have a floating net asset value, such that investors are not
guaranteed to get a fixed amount when they withdraw. Indeed, this feature is often thought to
prevent the emergence of strategic complementarities and run dynamics in mutual funds.
However, as we show here, this argument is incomplete. Even with a floating net asset value, the
structure of funds gives rise to complementarities and fragility, since investors can take their
money out at any given day based on the most recently updated net asset value, and the
consequences of their redemptions will only be reflected in future net asset values. Hence,
investors impose a negative externality on others when they redeem their shares, creating the
complementarities that lead to run-like behavior. Indeed, many argue that imposing a floating net
asset value is not a perfect fix to the problems in money market funds, but other solutions such as
holding a capital buffer or putting restrictions on redemptions are likely more appropriate.4
Of course, for the complementarities and runs in corporate bond funds to be a major
concern from a systemic point of view, we need to know whether they have a major effect on
market prices and potentially on real economic activity. The current evidence presented in the
paper does not establish this link, but we plan to extend the research in this direction. Presumably,
massive outflows from corporate bond funds force the funds to sell large amounts of bonds,
putting downward pressure on corporate bond prices. Even though these bonds are traded in
secondary markets, one would expect that lower bond prices will make it more difficult for firms
to raise new debt and so the real effect on their operations and investments will follow. There are
existing evidence on the price pressure imposed by mutual-fund outflows (e.g., Coval and
Stafford (2007), Manconi, Massa, and Yasuda (2012), and Ellul, Jotikasthira, and Lundblad
(2012)) and on the real effect of these outflows (e.g., Edmans, Goldstein, and Jiang (2012) and
Hau and Lai (2013)) which make it likely that one would find such effects in the context of flows
from bond funds.
4 See, for example, Hanson, Scharfstein, and Sunderam (2014).

7
The remainder of the paper is organized as follows. Section II presents the institutional
background and hypothesis development. Section III presents the data and methodology. Section
IV shows the empirical results. Section V describes the case study based on Bill Gross’ departure
from PIMCO funds. Section VI concludes.
II. Institutional Background and Hypothesis Development
A. Institutional Background: Valuations, Redemptions and Liquidity Management
Our paper focuses on actively managed corporate bond mutual funds. Compared with the
voluminous research on the equity counterparts, relatively little academic research has been
conducted on corporate bonds funds. This deficiency has to be addressed because of the large
size of the corporate bond market as well as the increasingly important presence of mutual funds
in this market segment. At the end of 2013, the amount of corporate bonds outstanding was
$7.46 trillion, almost half the size of the equity market. The corporate bond market is particularly
important as a funding vehicle for U.S. companies. According to the Securities Industry and
Financial Markets Association (SIFMA), corporate bond issuances in the U.S. reached $1.4
trillion dollars in 2014. In the same year, the initial public offerings of equity in the U.S. raised
only $92 billion dollars.5
Traditional players in the corporate bond market include long-horizon investors such as
insurance companies, pension funds, and trusts.6 In the recent decade, mutual funds have become
increasingly important in corporate bond markets. According to ICI, the geometric average
annual growth rate of assets under management by corporate bond funds is 14% from 2000 to
2013, which leads the aggregate size of corporate bond funds to more than quintuple. Combining
data from ICI ($1.72 trillion holdings of corporate bonds by bond funds) and SIFMA ($7.46
5 This is an estimate from Ernst and Young. See: http://www.ey.com/Publication/vwLUAssets/ey-q4-14-global-ipo-trends-report/$FILE/ey-q4-14-global-ipo-trends-report.pdf. 6 As Bessembinder and Maxwell (2006) explain, most bond issues are often absorbed into stable “buy-and-hold” portfolios of insurance companies and pension funds soon after issuance. The reason is that corporate bonds are a favored investment for insurance companies and pension funds, since their long-horizon obligations can be matched reasonably well to the relatively predictable, long-term stream of coupon interest payments from bonds.

8
trillion corporate bonds outstanding), we estimate that corporate bond funds owned about 23% of
corporate bonds outstanding in 2013. As Moneta (2015) documents, the average turnover rate of
corporate bond funds is much higher than that of equity funds. For instance, from 1996 to 2007
the average turnover rate of general corporate bond funds is approximately twice as large as that
of equity funds, which suggests more active trading and relatively shorter investment horizons of
corporate bond funds. Considering the relatively low liquidity in corporate bond markets, the
high trading activities of corporate bond funds are likely to generate substantial market impact.
It should be noted that fixed income funds in general have expanded substantially during
this period. For instance, the average annual growth rates for Treasury bond funds and Municipal
bond funds from 2000 to 2013 are approximately 5%. Their growth, however, is dwarfed by that
of corporate bond funds. As shown in Figure 1, the share of corporate bond fund assets in the
universe of fixed income funds has trended up steadily. With a total net asset value reaching
$1.86 trillion in 2013, corporate bond funds comprise 57% of entire bond fund assets. Due to
their dominant position in bond funds, we choose to focus on corporate bond funds in our study.
To make our analysis of flow-performance relation comparable with the literature on equity
funds, we exclude passively managed corporate bond funds.
There are four features that make corporate bond funds prone to strategic
complementarities and run risk: infrequent corporate bond trading; uncertain pricing of corporate
bonds; high costs associated with investor outflows; and negative externality arising from costly
outflows. We elaborate on these features below.
First, in contrast to equities which trade frequently on the exchange, corporate bonds
trade in the over-the-counter dealer market relatively infrequently. Prior to 2002, the corporate
bond market was particularly opaque, without readily available information on transaction prices.
The introduction of the Transaction Reporting and Compliance Engine (TRACE) in July 2002
required bond dealers to report all trades in publicly issued corporate bonds to the National
Association of Security Dealers (NASD) which in turn released these transaction data to the
public. Using these data, Edwards, Harris, and Piwowar (2007) find that individual bond issues
do not trade on 48 percent of days in their sample. They find that the average number of daily
trades in an issue, conditional on trading, is only 2.4. Bessembinder and Maxwell (2008) note

9
that corporate bonds trade infrequently even compared with other bonds. In their sample,
corporate bonds comprise about 20 percent of outstanding U.S. bonds but account for only about
2.5 to 3.0 percent of trading activities in U.S. bonds. In contrast, U.S. Treasury securities
comprise 16 percent of U.S. bonds outstanding, but account for 59 percent of total bond trading
volume in 2006. Their results suggest that despite the improved ex-post transparency in the
corporate bond market, it remains relatively illiquid.
Second, partially due to the fact that corporate bonds trade infrequently, accurate price
information of corporate bonds may not be readily available, which leads to ambiguity in the
pricing of corporate bonds. According to the Investment Company Act of 1940, bonds not traded
should be priced at “fair value” made “in good faith.” Cici, Gibson and Merrick (2009) find that
in practice, bond fund managers usually comply with this mandate by marking their bond
positions at the prices provided by one or more pricing service companies and/or securities
dealers. However, different pricing services can mark the prices differently, and managers of
bond funds have the discretion to override the third-party pricing using their own judgements.
This creates room for large dispersions and uncertainty of bond valuations.
Indeed, Cici, Gibson and Merrick (2011) document substantial dispersions of month-end
valuations placed on identical corporate bonds by different mutual funds. Their tests reveal that
such dispersion of valuations is consistent with returns smoothing behavior by managers, which
involves marking positions such that the net asset value is set above or below the true value of
fund shares, resulting in wealth transfers across existing, new, and redeeming fund investors.
They find that the returns smoothing is particularly serious for corporate bond funds with hard-
to-mark assets and not as much for Treasury bond funds; furthermore, when a fund’s return is
low, the fund is more likely to mark the bond positions higher than the true value. Under this
situation, existing shareholders would have particularly high incentives to withdraw their money
while the mark is good.
Third, the trading cost associated with outflows can be high for corporate bond funds.
Although substantial disagreement exists in the literature, the estimates of trading costs in
corporate bonds indicate that they are generally large. For instance, Bessembinder, Maxwell, and
Venkataraman (2006) estimate round-trip (purchase and sale) trading costs during the first half

10
of 2002 to be approximately 25 basis points, or $6,750 on an average-sized transaction. After the
introduction of TRACE in 2002, this figure decreased to about half. Edwards, Harris and
Piwowar (2007) estimate that the round-trip transaction costs in corporate bonds range from
approximately 150 basis points for the smallest trade size to about three bps for the largest trade
size. Bao, Pan and Wang (2011) use the covariance in corporate bond returns to estimate the
trading costs and find that the median implied bid-ask spread is 1.50%. These results support the
view that it is costly to trade corporate bonds. In times of distress or low liquidity, or for assets
which trade particularly infrequently and are thus hard to price, we expect trading costs of
corporate bonds to be much larger.
Finally, the structure of corporate bond funds that hold illiquid assets but provide
withdrawal rights to their investors on a daily basis would give rise to payoff complementarities.
Like other open-end mutual funds, the costs imposed by investors’ liquidation in corporate bond
funds are not fully reflected in the price these investors get when they redeem the shares, but are
shared by investors who keep their money in the fund. The NAV at which investors can buy and
sell their shares in the funds is calculated using the same-day market close prices of the
underlying securities but the trades made by the funds in response to redemptions are most likely
to happen after the day of the redemptions. Given the three preceding features of the corporate
bond fund market – infrequent corporate bond trading, uncertain pricing of corporate bonds, and
high costs associated with investor outflows – the negative externality of redeeming investors on
remaining shareholders can be particularly high for corporate bond funds, which could intensify
the run risk as highlighted by Diamond and Dybvig (1983).
Given the high potential and large costs of financial fragility in corporate bond funds, we
would expect mutual fund managers to take measures to mitigate this risk. For instance, under
the Investment Company Act, a fund may impose fees on redemptions of fund shares held for a
short period, i.e., redemption fees. On March 3, 2005, the Securities and Exchange Commission
voted to adopt a rule concerning voluntary redemption fees, which allows a mutual fund to adopt
a redemption fee of no more than 2 percent of the amount of the shares redeemed to discourage
short-term trading. In practice, however, redemption fees do not appear to be popular among
mutual funds. For example, our reading of fund prospectuses indicates that despite a wide range
of fixed income mutual funds offered, PIMCO charges a 1% redemption fee only for investors in
11
shares of the PIMCO Senior Floating Rate Fund (invested mainly in floating-rate high yield bank
loans) on redemptions and exchanges made by the investor within 30 calendar days after the
shares’ acquisition. Clearly, even for this fund, the redemption fee is far from being adequate in
eliminating the strategic complementarities that we stress in our paper. Such reluctance of open-
end mutual fund managers to impose tighter redemption fees on shareholders, however, is
consistent with the excessive open ending among funds competing aggressively to attract
investors’ money (Stein, 2005).7
B. Hypothesis Development
Our hypotheses are based on the idea that strategic complementarities exist among investors in
bond mutual funds. When they redeem their shares, they get the net asset value as of the day of
redemption. The fund then has to conduct costly liquidation that hurts the value of the shares for
investors who keep their money in the fund. Hence, strategic complementarities emerge, such
that the expected redemption by some investors increases the incentives of others to redeem.
Chen, Goldstein, and Jiang (2010) provide a model, based on the global-games literature, which
clarifies this point formally regarding the difference between illiquid and liquid equity funds. A
similar model should apply for bond funds and for the comparison between bond funds and
equity funds. The idea is that bond funds are less liquid than equity funds, due to the features of
the corporate bond markets as mentioned earlier, and so the strategic complementarities they
create for investors are greater than those in equity funds. This leads to the first hypothesis.
Hypothesis 1: Outflows of corporate bond funds are more sensitive to bad performance than are
inflows to good performance.
Following up directly on the above ideas, corporate bond funds with more illiquid assets
impose greater complementarities on their investors and so would have greater amplification
leading to more outflows during low past performance. The reason is that funds with more
7 In a different context – hedge funds – Getmansky (2012) finds that despite much more common lock-up periods and redemption fees, the sensitivity of flow to performance appears concave. This is likely because of restrictions on inflows, which prevent investors from chasing after top performers.

12
liquid assets will not have to liquidate their positions in short notice to meet redemption requests.
This leads to the second hypothesis.
Hypothesis 2: Corporate bond funds with more illiquid assets have more outflows following low
past performance.
The same logic should extend also to changes in liquidity over time. Dick-Nielsen,
Feldhutter and Lando (2012) document that corporate bond illiquidity varies over time and
contributes substantially to bond yield spread during the financial crisis. As Cici, Gibson and
Merrick (2011) note, returns smoothing is particularly serious for corporate bond funds with
hard-to-mark assets. During periods of high illiquidity, bonds trade less and are harder to mark.
As a result, corporate bond fund managers have more latitude to mark their positions, resulting in
more uncertainty in the true NAV of the funds. Hence, strategic complementarities are stronger
in such periods and corporate bond fund outflows are expected to be stronger if they
underperform in such periods. This leads to the third hypothesis.
Hypothesis 3: During periods of higher illiquidity, corporate bond funds have more outflows
following low past performance.
Finally, we expect strategic complementarities to be weaker in funds that are held mostly
by institutional investors. These investors are large and hold a large proportion of the funds’
assets; their holdings are not as affected by other investors’ actions. By holding on to their own
shares rather than selling them, they guarantee that their holdings do not suffer from the price
decline arising from their own selling. In other words, these investors internalize the
externalities they impose and are less prone to strategic complementarities. Other investors,
knowing that the institutional investors provide strategic stability, are also less inclined to
withdraw. This point is made formally in the model of Chen, Goldstein, and Jiang (2010). This
leads to the last hypothesis.
Hypothesis 4: The effect of illiquidity on the sensitivity of outflows to bad performance is
weaker in funds that are held mostly by institutional investors.

13
III. Sample Construction and Empirical Measurements
A. Sample Construction
Data on corporate bond funds come from the Center for Research in Security Prices (CRSP). Our
sample period is January 1992 to December 2014. Prior to 1991, there are few corporate bond
funds in the CRSP database. Since we use one year of data to estimate the alpha of individual
bond funds, our flow-performance tests start from January 1992. A bond fund typically issues
several share classes with different bundles of expense ratios, management fees, front-end and/or
back-end sales charges (loads), minimum investment requirements, and restrictions on investor
types to attract investors with different wealth level, investment horizons, and investment
mandates. Since these fund share-level characteristics can influence the investment and
redemption decisions of mutual fund investors, we use individual fund share class as our unit of
observations. We supplement fund data with time-series data of VIX from the Chicago Board
Options Exchange (CBOE), the TED spread (difference between the three-month London
Interbank Offered Rate (LIBOR) and the three-month Treasury-bill interest rate) and the Federal
Fund Rate from the Federal Reserve Economic Data available through the St. Louis Fed.
We select corporate bond funds based on the objective codes provided by the CRSP.
Specifically, to be classified as a corporate bond fund, a mutual fund must have a (1) Lipper
objective code in the set (‘A’,‘BBB’,‘HY’,‘SII’,‘SID’,‘IID’), or (2) Strategic Insight objective
code in the set (‘CGN’,‘CHQ’,‘CHY’,‘CIM’,‘CMQ’,CPR’,’CSM’), or (3) Wiesenberger
objective code in the set (‘CBD’,‘CHY’), or (4) ‘IC” as the first two characters of the CRSP
objective code. We require at least one year of fund history before a fund is included in our
sample and exclude index corporate bond funds, exchange traded funds, and exchange traded
notes from the CRSP mutual fund database. Our final sample includes 4,679 unique fund share
classes and 1,660 unique corporate bond funds. To compare the behavior of investors in
corporate bond funds and equity funds, we follow Jiang and Zheng (2014) to select the sample of
equity funds.
B. Empirical Measurements
The key variables in our empirical analyses are mutual fund flows, performance, and proxies for
the liquidity of fund assets. As a standard practice, we impute net fund flows from the total net

14
assets of each fund share class between consecutive points in time and the interim net fund
return.8 Specifically, flow for fund k in month t is defined as:
where Rk,t is the return of fund k during month t, and TNAk,t is the total net asset value at the end
of month t. To mitigate the influence of outliers (a standard practice in the literature), fund flows
are winsorized at the 1% and 99% percentiles.
To measure performance of corporate bond funds, we estimate a bond fund’s average
alpha in the past year by performing rolling-window time-series regression for each fund using
past 12 months of data.9 One issue that merits special discussion is the benchmark relative to
which performance is measured. Given the scarcity of studies on the investment and redemption
decisions of corporate bond funds, we resort to both theory and prior empirical studies on flows
of equity funds for guidance. Our primary performance measure is fund Alpha, which is the
intercept from a regression of excess corporate bond fund returns on excess aggregate bond
market and aggregate stock market returns. We use the Vanguard total bond market index fund
return and CRSP value-weighted market return to proxy for aggregate bond and stock market
returns.
Several reasons prompt the choice of this simple measure of fund Alpha. First, a positive
(negative) Alpha of a given mutual fund from this regression indicates that investors with money
in both stock and bond markets would have improved their investment performance by tilting
their portfolios towards (away from) the fund. Therefore, the measured Alpha can, a priori, be an
8 O’Neal (2004) uses gross inflows and outflows to examine the purchase and redemption decisions of mutual fund managers. Since our analysis is motivated by potential adverse consequences of mutual fund trading forced by net redemptions, we use net fund flows, which also makes our results comparable with the vast literature on flow-performance relation in equity funds. 9 We also consider an alternative estimation approach where we use the past three years of return history to estimate individual funds’ exposures to stock and bond markets and predicting the fund’s alpha in the subsequent month. We use monthly alpha computed in this fashion to calculate the average monthly alpha in the past year. This estimation strategy has the potential advantage of a more precise estimate of fund betas, but the disadvantages of requiring a longer fund history (that restricts the sample toward older funds with at least four years of history) and potential survival biases. Empirically, we get qualitatively similar results using this alternatively estimated measure of fund alpha.
,, , 1 ,
,

15
important determinant of the investment and redemption decisions of bond fund investors if they
expect future alphas to be persistent. Second, a growing number of studies find that alpha from
the Capital Asset Pricing Model (CAPM) drives flows into and out of equity mutual funds, and
the explanatory power of CAPM alpha for fund flows is higher than alternative, multifactor
models (see Berk and Van Binsbergen, 2014; Barber, Huang, and Odean, 2014). Although for
equity funds, it may be reasonable to approximate the wealth portfolio using the aggregate stock
market return following the spirit of CAPM, for corporate bond funds, it seems natural to include
both bond and stock markets to approximate fluctuations in the wealth portfolio.10 Third, from an
asset pricing perspective, a growing literature establishes common risk factors driving both stock
and bond returns (e.g., Fama and French, 1993; Koijen, Lustig, Van Nieuwerburg, 2014).
Therefore, it is reasonable to adjust for the exposures to bond and stock market risks when
computing corporate bond fund alpha. For robustness check, we also compute an alternative
measure of fund alpha using performance evaluation model based on bond market index alone
and find qualitatively similar results in Table 6.
To test our hypotheses, we need both fund-level and aggregate measures of liquidity. The
SEC regulates that a mutual fund restricts the holding of illiquid assets to be below 15% of fund
assets. Since liquidity does not have a very concrete definition and is often volatile, this binary
classification of liquid and illiquid assets has clear limitations. As a first approximation, we use
the most elementary but powerful proxy for the liquidity of a fund’s assets, namely cash holdings,
i.e., the fraction of fund assets held in cash. To accommodate redemption requests from clients,
fund managers may have multiple means, e.g., disposal of undesired holdings, selling liquid
assets, using the proceeds from new clients (inflows), and loans from financial markets or other
institutions such as the fund family. When faced with large, abrupt net redemptions, however,
cash provides fund managers with the most reliable source of liquidity. Moreover, while adverse
market events (e.g., the failure of Lehman Brothers) can render the liquidity of previously liquid
financial assets (e.g., shares of money market funds) suddenly illiquid, the liquidity of cash is
largely insulated from these movements. These considerations prompt us to use the pre-
10 Earlier tests of CAPM approximate returns on the wealth portfolio using the value-weighted returns to stock and bond markets (e.g., Friend, Westerfield, and Granito, 1978). Since our objective is not to literally test if the aggregate wealth portfolio is mean-variance efficient, and for the benefit of mitigating measurement errors in the relative value of stocks and bonds, we adopt a more flexible approach of including both stock and bond market returns in the regression. Another advantage of our approach is that it allows individual funds to have different exposures to stock and bond markets.

16
determined level of cash holdings to proxy for the liquidity of a fund’s assets, which, according
to our hypothesis, will influence the redemption decisions of fund investors.
Of course, the level of cash holdings can reflect fund managers’ anticipation of the fund’s
foreseeable liquidity needs, and therefore could be endogenous, which may reverse the direction
of causality. This concern of endogeneity, however, implies that conditional on poor past
performance, funds with higher cash holdings should experience large subsequent redemptions,
due to fund managers’ anticipation effect. This predicted direction is opposite to that of our
hypothesis and, if relevant, could potentially bias us away from finding evidence that supports
our hypothesis.
In addition to fund-level liquidity, we also look at variation in the liquidity of aggregate
corporate bond markets. Bao, Pan, and Wang (2011) find that movements in the aggregate stock
market volatility, as proxied by the VIX index, strongly impact the liquidity of corporate bonds.
Hence, we use the VIX index as one measure of aggregate liquidity. Brunnermeier and Pedersen
(2009) show that asset market liquidity co-moves with the funding liquidity of financial
institutions that supply liquidity to asset markets. We use the TED spread and the Federal fund
rate to capture funding liquidity to financial institutions, which in turn determines the liquidity of
corporate bond markets. According to Nagel (2014), the Federal fund rate is also an important
determinant of aggregate liquidity premiums that reflect the scarcity of liquidity, due to the fact
that when the Federal fund rate increases, the opportunity cost of holding cash rises. Finally, we
use the index of aggregate corporate bond market illiquidity proposed by Dick-Nielsen,
Feldhutter and Lando (DFL 2012). Since the DFL index is estimated using the TRACE data, it
has a shorter history, starting from July 2002 to June 2013. It shares a 86% correlation
coefficient with VIX. We use movements in these aggregate liquidity measures to capture the
periods when bond fund managers find it more difficult to trade corporate bonds in the secondary
market and/or more costly to raise money from other institutions. As a result, the liquidity
conditions of fund assets deteriorate, which renders the concern of fund investors for the
negative externality arising from other investors’ redemption decisions more acute.

17
C. Summary Statistics
Figure 2 shows the total net assets and dollar flows of actively managed corporate bond funds in
the U.S. The total net assets in this segment have been trending up in our sample period,
particularly since the onset of the recent financial crisis. As of 2008, there was $649 billion under
management. From 2008 to 2014, this figure has almost tripled to more than $1.8 trillion. Such a
steady increase in corporate bond fund assets, however, masks increasingly volatile fund flows.
For instance, corporate bond funds attracted net inflows of approximately $190 billion in 2009
but experienced net redemptions of approximately $60 billion in 2013. Such massive flows into
corporate bond funds naturally raise the concern of potential instability, if corporate bond fund
performance is to reverse in the future.
Table 1 presents the summary statistics for the funds in our sample from January 1992 to
December 2014. Over this sample period, active corporate funds record returns of 0.42% and an
inflow of 0.82% per month on average. The median fund share-class size is $59 million, with a
median age of 6.88 years. On average these funds have annual expense of 1.04% and
approximately 29% of them charge back-end loads. The funds hold 3.5% of their assets in cash
on average, but the cash holding practices vary a lot across funds with a standard deviation of
10%. The top one percent of funds holds as much as 46.7% of their assets in cash, while the
bottom one percent has negative cash holding (i.e. leverage) of 36.72%. Fewer than 20% of the
funds have negative cash holdings. On average, 23% of the fund share-classes are institutional.
IV. Results
A. Concave Flow-Performance Relation in Corporate Bond Funds
To test if the sensitivity of fund flows to past performance is larger following low past
performance as in Hypothesis 1, we perform the following regression:
Flowi ,t
1Alpha
i ,t12t1
2Alpha
i ,t12t1 I (Alpha
i ,t12t1 0) Controls
i ,t
i ,t, (1)

18
where Flowi,t is fund i’s net flow in month t, Alphai,t-12→t-1 is fund i’s alpha in the past one year,
and I(Alphai,t-12→t-1<0) is an indicator variable equal to one if the fund achieves a negative alpha
in the past year and zero otherwise. Controlsi,t includes a battery of fund characteristics: Lagged
Flow (the fund’s net flow in month t-1), Log(TNA) (the natural log of fund assets), Log(Age)
(the natural log of fund age in years), Expense (the fund’s expense ratio), and Rear Load (an
indicator variable equals to one if the fund charges back-end loads and zero otherwise). To
control for the aggregate flows into and out of the corporate bond fund sector, we include the
month fixed effect. To allow for temporal dependence of regression residuals at the level of fund
share class, we cluster standard errors by fund share class. To compare our results with the
literature on equity funds, we also estimate the same regression for stock funds in the same
period.11
Panel A of Table 2 shows the results. We find a concave flow-performance relation for
corporate bond funds: the sensitivity of flows out of corporate bond funds to bad performance is
much higher than that of flows into those funds to good performance. The slope coefficient for
Alpha is 0.621, while the slope coefficient for Alpha interacted with the negative alpha dummy
is 0.507 and is statistically significant. In other words, the sensitivity of outflows to negative
alpha is 1.128 (= 0.621+0.507), which is 82% higher than that of the inflows to positive alpha
(0.621).
Such a concave flow-performance relation for bond funds is markedly different from the
convex flow-performance relation documented in the stock fund literature. In the second column,
we confirm the existence of such a convex flow-performance relation for stock funds during our
sample period. For stock funds with positive alpha, a one percent increase in alpha is associated
with 1.462 percent increase in fund flows. But for stock funds with negative alpha, a one percent
decrease in alpha is associated with a 0.836% (=1.462-0.626) decrease in fund flows. The
sensitivity of outflows to negative alpha is therefore 32% lower than that of inflows to positive
alpha, which implies a convex flow-performance relation for stock funds as consistent with prior
literature.
11 Following the literature on equity fund flows, we include only stock market returns in estimating fund alpha. Our results are robust, however, if we include both stock market and bond market returns to estimate equity fund alpha.

19
In the context of fragility, the effect of outflows is particularly important. Comparing the
results of the bond funds to the stock funds, we find that the sensitivity of flows in bond funds in
the negative region is greater than that in equity funds. A one percent decrease in alpha leads to
about a third higher outflows in bond funds (1.128%) compared to the outflows this would create
in stock funds (0.836%).
To have a detailed description of the shape of the flow-performance relation, we also use
a flexible piece-wise linear regression specified as follows:
5
, , , , 12 1 , ,1
,i t j i j t i t t i t i tj
Flow Q Alpha Controls
(2)
where Qi,j,t is an indicator variable that represents the quintile membership of fund i based on its
past one year performance Alphai,t-12→t-1. For instance, if the fund falls in the bottom 20% of all
corporate bond funds in our sample based on its past year performance, then Qi,1,t =1 (Bottom)
and Qi,j,t =0 for j in the set (2,3,4,5) for month t. In this way, we allow the slope of flow-
performance relation to differ across different quintiles of fund alpha. The choice of quintile
membership reflects the tradeoff between parsimony and flexibility.
Panel B of Table 2 reports the results, which confirm a concave flow-performance
relation for corporate bond funds: the sensitivity of flows out of corporate bond funds to bad
performance is much higher than that of flows into those funds to good performance. The effect
is acute at the tail end of the returns. Specifically, the slope coefficient for Alpha interacted with
the Bottom quintile indicator variable is 1.117, whereas that for Alpha interacted with the Top
quintile indicator variable is merely 0.708. In other words, among the lowest performance
quintile of funds, a one percent decrease in alpha is associated with 1.117 percent fund outflows,
whereas a one percent increase in alpha is associated with only a 0.708 percent increase in fund
inflows among the highest performance quintile of funds.
In the second column, we report results for stock funds. For stock funds in the top
performance quintile, a one percent increase in alpha is associated with 1.40 percent increase in
fund flows. For stock funds in the bottom performance quintile, a one percent decrease in alpha
is associated with a 0.83 percent decrease in fund flows. Comparing the results of the bond funds

20
to the stock funds, we find that the sensitivity of flows in bond funds in the negative (positive)
region is greater (smaller) than that in equity funds.
These results provide strong initial support for the existence of strategic
complementarities and potential for financial fragility in bond fund investors’ redemption
decisions. While a typical equity fund has a convex flow-performance relationship and exhibits
weak sensitivity of outflow to negative performance, the opposite is true for bond funds,
indicating that the latter may exhibit stronger complementarities and stronger potential for
fragility due to their greater asset illiquidity.
B. Illiquidity and Sensitivity of Redemptions to Poor Performance
Why do bond funds experience much higher outflows during negative performance compared to
stock funds? Our leading explanation is the presence of strategic complementarities. Corporate
bond funds invest in more illiquid assets. Investors’ outflows may lead to costly liquidation by
bond funds, where the costs would be borne by the remaining investors. This creates a ‘run’
dynamic which amplifies the reaction of outflows to bad performance. Under this explanation,
outflows should be much more sensitive to bad performance among bond funds that are more
illiquid.
We test this hypothesis (corresponding to Hypothesis 2) by exploring the impact of asset
liquidity on the flow-performance relation for corporate bond funds. To measure liquidity at the
fund level, we use the fund’s most recent level of cash holdings prior to month t to ensure that
the level of cash holdings is not simply the outcome of flows in month t and the information is
available to fund investors. To control for the possibility that the level of cash holdings may be
systematically different for corporate bond funds with different investment styles and mitigate
the influence of potential outliers, we create a Low Cash indicator variable that equals one if the
fund has cash holdings below the average fund in the same style and zero otherwise. We also
create a Negative Cash indicator variable that equals one if the fund has negative holdings and
zero otherwise.

21
Since we are primarily interested in how asset liquidity influences investors’ redemption
decisions, we use two regression specifications to test for this impact:
, 1 , 12 1 2 , 12 1 , 12 1
3 , 12 1 , 12 1 , , ,
( 0)
( 0) ,i t i t t i t t i t t
i t t i t t i t i t i t
Flow Alpha Alpha I Alpha
Alpha I Alpha Illiquidity Controls
(3)
, 1 , 12 1 2 , 12 1 , , ,
, 12 1
,
0.i t i t t i t t i t i t i t
i t t
Flow Alpha Alpha Illiquidity Controls
Alpha
(4)
In regression (3), we use full-sample information, but restrict the coefficients for the
control variables to be the same across funds with negative and positive alpha, whereas in
regression (4), we use the subsample of funds with negative alpha without imposing such
restrictions on the control variables.
Table 3 shows the results. Column (1) replicates the results for bond funds in Table 2 as
an initial starting point where we run regression of fund flows on previous year’s performance
and performance for funds with negative alphas. As seen before, flow-performance sensitivity is
much higher for funds with negative alphas than for funds with positive alphas. In Column (2),
we add the interaction term between low cash and the performance variables. For funds with
high cash, a 1% decrease in alphas result in 0.964% (=0.937+0.0274) increase in outflows. In
contrast, for funds with low cash, a 1% decrease in alphas result in 1.661% (=0.937+
0.0274−0.534 + 1.231) more outflows. Hence, among funds with low cash, negative fund alpha
results in significantly higher flow-performance sensitivity.
Using the entire sample of funds in the regressions requires the control variables to have
the same coefficients during over- and under-performance of funds. To relax this constraint, we
limit the data sample to the funds with negative alphas in the regression, which allows us to
focus on the underperforming funds. Column (3) shows that the results are similar in that
specification as well. Funds with low cash again have higher flow-performance sensitivity.

22
Consistent with hypothesis 2, we find that low cash funds have significantly higher sensitivity of
outflows to bad performance than high cash funds.
In Columns (4) and (5), we use negative cash instead of low cash to proxy for fund
illiquidity. Only about 20% of the funds have negative cash, which might limit the power of our
test, but the results turn out to be similar. In Column (5) where we limit the sample to the
negative alpha funds, funds with negative cash have higher flow-performance sensitivity than
funds with positive cash. Among funds with negative cash, a 1% decrease in alpha leads to
1.691% more outflows, while among funds with positive cash, a 1% decrease in alpha leads to
0.838% more outflows. Column (4) gives qualitatively similar result although the result is not
statistically significant.
So far, we show that among corporate bond funds, those with lower asset liquidity tend to
experience greater sensitivity of outflows to bad performance, i.e., their flow-performance
relationship is more concave. The evidence supports the idea that asset illiquidity creates
strategic complementarities among bond-fund investors in their redemption decisions. This
provides support to Hypothesis 2.
This finding has important policy implications as well. In the context of fragility, funds
with higher cash holdings may be subject to less outflows after poor performance. Our paper
focuses on corporate bond funds. But this finding would lend some indirect support to the current
regulatory proposal in the form of holding a capital buffer in the context of money market funds.
(See Hanson, Scharfstein and Sunderam (2014))
We now move to test Hypothesis 3. One would expect that liquidation costs imposed on
funds due to massive outflows will be more severe during periods of higher illiquidity, when
bonds trade even less and there is more uncertainty about their valuation. Hence, strategic
complementarities in withdrawals should be stronger in times of greater aggregate illiquidity. As
a result, flow-performance relationships for bond funds are expected to be more concave during
periods of high illiquidity. To test this hypothesis based on time-series variation, we perform the
following regressions:

23
, 1 , 12 1 2 , 12 1 , ,
, 12 1
,
0,i t i t t i t t t i t i t
i t t
Flow Alpha Alpha Illiquidity Controls
Alpha
(5)
where Illiquidityt is an indicator variable equal to one if the particular illiquidity proxy is above
the sample mean. The four proxies we use for illiquidity are VIX, TED spread, Federal fund rate,
and DFL Illiquidity index.
Table 4 shows that the high sensitivity of investor redemptions to poor fund performance
is driven mostly by periods when corporate bond markets are illiquid based on these four proxies.
The aggregate stock market volatility as proxied by the VIX index is associated with lower
corporate bond market liquidity (Bao, Pan, and Wang (2011)). We find that during liquid periods
with low VIX, alpha’s association with flow is basically flat. During illiquid periods with high
VIX, 1% lower alpha is associated with 0.622% (= -0.131+0.753) more outflow.
Asset market illiquidity can arise from funding illiquidity from institutions as
demonstrated in Brunnermeier and Pedersen (2009). TED spread measures the difference
between the interest rates on interbank loans and on Treasury bills, while Federal fund rates
measure the rates at which banks trade federal funds with each other. Both measure funding
liquidity to financial institutions. We use these two measures of funding liquidity to proxy for
asset market illiquidity.
We find that during illiquid periods with high TED spread and Fed funds rate, 1% lower
alpha is associated with 0.628% and 0.693% more outflows respectively.12 During liquid period,
alpha’s association with flow is basically flat or slightly positive. The difference between high
and low liquidity periods is significant in both cases.
Finally, we use a direct measure of the index of aggregate corporate bond market
illiquidity estimated using the TRACE data by Dick-Nielsen, Feldhutter and Lando (DFL 2012).
Despite a relatively short data sample period starting from July 2002 to June 2013, we find a
similar result. During highly illiquid period with high DFL index, 1% lower alpha is associated
with 0.666% (= - 0.746 +1.412) more outflows. The outflows arising from negative alphas are
12 0.628% = -0.121+0.749; 0.693% =0.272+0.421)

24
completely due to highly illiquid period, and the difference between high and low liquidity
periods is significant.
Overall, we find that the corporate bond market has larger outflow-to-poor-performance
sensitivity during highly illiquid periods. The volatile and tight periods with high VIX, high TED
spread and Fed funds rate are exactly the periods when the systemic risks are the highest. We
find that during such periods, corporate bond funds are particularly fragile and prone to outflows.
This is bad news from a systemic risk point of view.
C. The Effect of Large Investors
Turning to Hypothesis 4, strategic complementarity should be less important in determining fund
outflows if the fund ownership is mostly composed of institutional investors. The reason is that
large institutional investors hold larger positions in the funds and so they are more likely to
internalize the negative externalities generated by their outflows. Hence, they serve as a
constraining force in reducing coordination problems that lead to runs on funds. For funds with
large investors, we expect the effect of illiquidity on flow-performance to be less significant.
In Table 5, we examine the effect of bond fund run in the case of institutional investors.
Following Chen, Goldstein, and Jiang (2010), we classify bond funds into institutional-oriented
funds and retail-oriented funds. A fund is classified as an institutional-oriented (retail-oriented)
fund if more than 80% (less than 20%) of fund assets are owned by institutional investors
through institutional share class.
Overall, table 5 shows that the effect of asset liquidity on the outflow to bad performance
sensitivity is not significant among institutional-oriented funds but only significant among retail-
oriented funds. The first two specifications show the results for institutional-oriented funds. The
coefficient that we are interested in is the interaction term between alpha and low cash. Strategic
complementarity implies that low-cash, illiquid fund would have higher fund flows sensitivity,
hence a higher coefficient in the interaction term. The presence of institutional investors would
serve as a constraining force however and reduce such effect. Indeed, as we expect, among
institutional-oriented funds, fund flows sensitivity is not any higher for illiquid (low cash) funds.

25
The coefficient on the interaction term between alpha and low cash is insignificant in both
specifications (1) and (2) with different control variables.
When we turn to the last two specifications (3) and (4) which show the results for retail-
oriented funds, the effect is very different from that of the institutional-oriented funds. As
expected, in such cases, fund flows sensitivity is significantly larger for illiquid funds. The
coefficient for alpha*low cash is positive and statistically significant for both specifications.
Hence, consistent with hypothesis 4, we find that the effect of illiquidity on the sensitivity of
outflow to bad performance diminishes when the fund is held mostly by institutional investors.
The effect is coming only from the retail-oriented funds, where coordination failures are
expected to be a problem.
From a policy perspective, it is good news that institutional-oriented funds face less run-
like behavior at low performance times. Such funds tend to be larger; and weaker run tendency
implies more stability during low performance periods. The retail-oriented funds can still create
big problems, as retail investors engage in run-like behavior.
D. Robustness Check
So far, in our main tests, we measure fund alpha as the intercept from a regression of
excess corporate bond fund returns on excess Vanguard total bond market returns and excess
CRSP value-weighted stock market returns. As explained before, this measure makes sense as
investors are likely to hold both stock and bond assets. Nevertheless, as a robustness check, in
Table 6, we examine an alternative measure of fund performance where we measure alpha with
respect to only the aggregate Vanguard bond market returns. Table 6 repeats the analysis in
Table 3 based on this new performance metric.
Table 6 shows that fund flows are still more sensitive to alphas for funds with low
performance, i.e. flow-performance relationship is concave, under this measure. The coefficient
for Alpha x Alpha < 0 is positive and statistically significant. Also, just as we find before, among
funds with low cash, negative fund alpha results in significantly higher flow-performance
sensitivity. The results are also similar in columns (4) and (5) when fund illiquidity is proxied by
26
negative cash instead of low cash. This shows that illiquid funds are much more likely to face
higher outflows during negative performance period. Overall, the results are consistent for the
alternative definition of performance based only on bond fund market factor.
V. Departure of the “Bond King” and Investor Redemptions
In this section, we study the effect of the departure of Bill Gross on the funds he managed. Bill
Gross, known on Wall Street as the Bond King, is the founder of PIMCO, a large fund
management company, and one of the most celebrated bond fund managers.13 On September 26,
2014, Bill Gross abruptly quit PIMCO and joined Janus, a much smaller firm. By all accounts,
his departure came as a big surprise to the market and to PIMCO senior management. 14
In PIMCO, Bill Gross managed the Total Return Fund, a giant bond fund with assets
under management of $221 billion as of June 2014. In October, the first full month after his
surprise departure, clients pulled $27.5 billion. “Half of those redemptions from the Pimco Total
Return Fund occurred in the first five trading days of October and they then slowed sharply”,
according to a statement from PIMCO.15
The Total Return Fund consists of four different funds: Total Return Fund I, Total Return
Funds II, Total Return Fund III, and Total Return Fund IV.16 In 2011, Gross founded Total
13 He was named by Morningstar as the Fixed Income Manager of the Year for 1998, 2000, and 2007, the first person to receive this award more than once, and was recognized for his "excellent investment skill, the courage to differ from consensus, and the commitment to shareholders necessary to deliver outstanding long-term performance.” Wall Street Journal, http://topics.wsj.com/person/G/bill-gross/52 14 According to New York Times, the surprising exit “came after Mr. Gross learned in recent weeks that top executives at Pimco and Allianz, the German insurer that owns it, had grown tired of his leadership and were weighing a change.” Despite these, “the timing of the departure of Mr. Gross even seemed to catch Pimco and Allianz off guard, despite the behind-the-scenes planning to remove him. By late afternoon Friday, photographs of Mr. Gross, his biography and well-read monthly investment letters still appeared prominently displayed on the Pimco website.” See http://dealbook.nytimes.com/2014/09/26/william-gross-leaves-pimco-to-join-janus/?_r=0 15 http://www.bloomberg.com/news/articles/2014-11-04/pimco-total-return-lost-27-5-billion-after-gross-s-exit 16 The original Total Return Fund I was founded in 1987. Subsequently, in 1991, to accommodate clients’ needs, Gross founded Total Return Fund II, which is barred from investing in high yield bonds, and Total Return Fund III, which is barred from investing in gaming, tobacco and spirits industries.

27
Return Fund IV, which relies less on derivative and leverage, and forgoes “high-yield debt,
borrowing to create leverage, and investing in options.”17
As a result of its mandate, Total Return Fund IV has much higher cash holdings than the
first three funds. As of June 2014, Total Return Fund IV holds cash that equals 2.5% of the total
asset under management, while Total Return Fund, Total Return Fund II, and Total Return Fund
III hold cash below 0.5% of the total asset under management (see figure 3). In addition to the
typical cash holdings, PIMCO has been holding a substantial amount of assets in the form of
commingled cash vehicles, which serves the purpose of liquidity management. At the end of
September 2014, Total Return Fund IV holds the highest fraction of assets in commingled cash
vehicle (29.3%), which is substantially higher than the rest of the three funds: TRF (16.2%), TRF
II (25.5%), and TRF III (20.9%).
As discussed, three of the funds were very different in nature than the fourth one – Total
Return Fund IV, which had significantly higher amounts of cash and other liquid assets. If the
main theme of our paper is correct, we would expect outflows to be amplified by illiquidity of
the funds’ assets. Hence, we would expect Total Return Fund IV to have lower outflows than
the other three funds.
Figure 3 shows the patterns of investment outflows of the four Total Return Funds in
October 2014, the first full month after Gross’ departure. There are outflows in Total Return
Funds I, II, and III that amount to 15%, 22% and 30% of the funds’ assets, respectively. In
contrast, Total Return Fund IV benefits from a modest inflow.
Consistent with our hypothesis, as a result of its liquid holdings, Total Return Fund IV is
the only one out of the four funds that did not see sharp withdrawals following Gross’
resignation. This is particularly interesting because up until then Total Return Fund IV had flows
that were very highly correlated with those of the other three funds. The pairwise correlations of
flows from the four Total Return Funds were above 99%.
17 http://www.bloomberg.com/news/articles/2011-03-11/gross-starts-derivative-lite-version-of-pimco-total-return-as-rally-ends

28
VI. Conclusion
Corporate bond funds have grown tremendously in recent years. They hold a large fraction of
corporate bonds outstanding in the US which have an important role in the financing of firms’
investments and operations. Despite their importance in the marketplace, there is very little
research to date studying their flows patterns. We provide such a study in this paper and show
that the familiar convex relationship between flows and performance in equity funds does not
hold in bond funds. In fact, the relationship in bond funds is clearly concave, indicating a much
stronger sensitivity of outflow to poor performance.
We also show that the sensitivity of outflows to bad performance in corporate bond funds
is much stronger in times of aggregate illiquidity and among funds that hold more illiquid assets.
Moreover, the effect of illiquidity on the sensitivity of outflows to bad performance is driven
mostly by retail-oriented funds and not by institutional-oriented funds.
These findings are all consistent with the presence of payoff complementarities among
bond-fund investors driven by the illiquidity of their assets. Investors know that the redemption
by others will impose liquidation costs on the fund that will reduce the return for those staying in
the fund, and so there is a tendency to redeem with others, which acts to amplify the effect of
negative performance on outflows.
This suggests that bond funds are prone to fragility. Bad events may lead to amplified
outflows and these may have adverse consequences for bond prices and ultimately for firms’
financing and real activities. These issues have to be taken into account in the broad scheme of
regulation of the financial sector. While it is well understood that banks, and now money-market
funds, are prone to such run dynamics, these usually are not associated with bond funds, but our
empirical results show that similar forces operate for them as well.

29
References
Bao, J., Pan, J. and Wang, J. (2011). The Illiquidity of Corporate Bonds, The Journal of Finance 66 (3), 911–946.
Barber, B. M., Huang, X., and Odean, T. (2014). Which risk factors matter to investors? Evidence from mutual fund flows, working paper, University of California at Berkeley.
Berk, J. B., and Van Binsbergen, J. H. (2014). Assessing Asset Pricing Models Using Revealed Preference. National Bureau of Economic Research working paper no. 20435.
Bessembinder, H., and Maxwell, W. (2008). Markets: Transparency and the corporate bond market. The Journal of Economic Perspectives, 217-234.
Bessembinder, H., Maxwell, W., and Venkataraman, K. (2006). Market transparency, liquidity externalities, and institutional trading costs in corporate bonds. Journal of Financial Economics, 82(2), 251-288.
Brown, K. C., Harlow, W. V., and Starks, L. T. (1996). Of tournaments and temptations: An analysis of managerial incentives in the mutual fund industry. The Journal of Finance, 51(1), 85-110.
Brunnermeier, M., and Pedersen, L. (2009) Market Liquidity and Funding Liquidity, Review of Financial Studies. 22 (6), 2201-2238.
Chen, Q., Goldstein, I., and Jiang, W. (2010). Payoff complementarities and financial fragility: Evidence from mutual fund outflows. Journal of Financial Economics, 97(2), 239-262.
Chevalier, J., and Ellison, G. (1997). Risk Taking by Mutual Funds as a Response to Incentives. Journal of Political Economy, 105(6), 1167-1200.
Christoffersen, S. E., Musto, D. K., and Wermers, R. (2014). Investor Flows to Asset Managers: Causes and Consequences. Annual Review of Financial Economics, 6(1), 289-310.
Cici, G., Gibson, S., and Merrick, J. J. (2011). Missing the marks? Dispersion in corporate bond valuations across mutual funds. Journal of Financial Economics, 101(1), 206-226.
Coval, J., and Stafford, E. (2007). Asset fire sales (and purchases) in equity markets. Journal of Financial Economics, 86(2), 479-512.
Diamond, D. W., and Dybvig, P. H. (1983). Bank runs, deposit insurance, and liquidity. The journal of political economy, 401-419.
Dick-Nielsen, J., Feldhütter, P., and Lando, D. (2012). Corporate bond liquidity before and after the onset of the subprime crisis. Journal of Financial Economics, 103(3), 471-492.

30
Edmans, A., Goldstein, I., and Jiang, W. (2012). The real effects of financial markets: The impact of prices on takeovers. The Journal of Finance, 67(3), 933-971.
Edwards, A. K., Harris, L. E., and Piwowar, M. S. (2007). Corporate bond market transaction costs and transparency. The Journal of Finance, 62(3), 1421-1451.
Ellul, A., Jotikasthira, C., and Lundblad, C. (2011). Regulatory pressure and fire sales in the corporate bond market. Journal of Financial Economics, 101(3), 596-620.
Fama, E. F., and French, K. R. (1993). Common risk factors in the returns on stocks and bonds. Journal of financial economics, 33(1), 3-56.
Feroli, M., Kashyap, A. K., Schoenholtz, K. L., and Shin, H. S. (2014). Market tantrums and monetary policy. Chicago Booth Research Paper, (14-09).
Friend, I., Westerfield, R., and Granito, M. (1978). New evidence on the capital asset pricing model. The Journal of Finance, 33(3), 903-917.
Getmansky, M. (2012). The life cycle of hedge funds: Fund flows, size, competition, and performance. The Quarterly Journal of Finance, 2(01).
Goldstein, I., and Pauzner, A. (2005). Demand–deposit contracts and the probability of bank runs. The Journal of Finance, 60(3), 1293-1327.
Goldstein, M., Hotchkiss, E., and Sirri, E. (2007). Transparency and liquidity: A controlled experiment on corporate bonds. The Review of Financial Studies, 20(2), 235-273.
Hanson, S. G., Scharfstein, D. S., and Sunderam, A. (2013). An evaluation of money market fund reform proposals. Working paper Harvard Business School.
Hau, H., and Lai, S. (2013). Real effects of stock underpricing. Journal of Financial Economics, 108(2), 392-408.
Huang, J., Wei, K. D., and Yan, H. (2007). Participation costs and the sensitivity of fund flows to past performance. The Journal of Finance, 62(3), 1273-1311.
Ippolito, R. A. (1992). Consumer reaction to measures of poor quality: Evidence from the mutual fund industry. Journal of law and Economics, 45-70.
Jiang, H., and Zheng, L. (2014). Decluttering mutual fund performance: Focusing on active performance when fundamental information arrives. Unpublished manuscript, Michigan State University and UC Irvine.
Koijen, R. S., Lustig, H. N., and Van Nieuwerburgh, S. (2013). The cross-section and time-series of stock and bond returns. NYU working paper

31
Lynch, A. W., and Musto, D. K. (2003). How investors interpret past fund returns.The Journal of Finance, 58(5), 2033-2058.
Manconi, A., Massa, M., and Yasuda, A. (2012). The role of institutional investors in propagating the crisis of 2007–2008. Journal of Financial Economics, 104(3), 491-518.
Moneta, F. (2015). Measuring bond mutual fund performance with portfolio characteristics. Forthcoming, Journal of Empirical Finance.
Morris, S., and Shin, H. S. (1998). Unique equilibrium in a model of self-fulfilling currency attacks. American Economic Review, 587-597.
Nagel, S. (2014). The Liquidity Premium of Near-Money Assets. University of Michigan working paper.
O’Neal, E. S. (2004). Purchase and redemption patterns of U.S. equity mutual funds. Financial Management, 33, 63-90.
Schmidt, L., Timmerman, A., and Wermers, R. (2014). Runs on Money Market Mutual Funds. University of Maryland working paper.
Sirri, E. R., and Tufano, P. (1998). Costly search and mutual fund flows. The journal of finance, 53(5), 1589-1622.

32
Figure 1 Distribution of Bond Fund Assets across Investment Objectives
This figure plots the share in net fund assets for fixed income mutual funds grouped by their investment objectives over the period 2000 to 2013. The source of data is the 2014 Investment Company Institute Fact book.
0%
10%
20%
30%
40%
50%
60%
70%
80%
90%
100%
2000 2001 2002 2003 2004 2005 2006 2007 2008 2009 2010 2011 2012 2013
Corporate World Government Multisector State muni National muni

33
Figure 2 Total Net Assets and Dollar Flows of Active Corporate Bond Funds
This figure shows total net assets (TNA) and dollar flows of actively managed corporate bond funds from 1991 to 2014. We exclude index corporate bond funds, exchange traded funds, and exchange traded notes from the CRSP mutual fund database.
-100
-50
0
50
100
150
200
250
0
200
400
600
800
1,000
1,200
1,400
1,600
1,800
2,000
1991
1992
1993
1994
1995
1996
1997
1998
1999
2000
2001
2002
2003
2004
2005
2006
2007
2008
2009
2010
2011
2012
2013
2014
$Bill
ion
$Bill
ion
TNA Flows

34
Figure 3 Exiting Total Return Funds following the Departure of Bill Gross
This figure shows the fraction of fund assets withdrawn in October 2014 from PIMCO’s Total Return Fund, Total Return Fund II, Total Return Fund III, and Total Return Fund IV following the resignation of the funds’ manager, Bill Gross, announced on 26 September 2014. The vertical axis on the left shows proportional fund flows in October 2014 and the vertical axis on the right shows the percentage of fund assets held in cash for these four funds in June 2014.
0.00
0.50
1.00
1.50
2.00
2.50
3.00
-0.35
-0.30
-0.25
-0.20
-0.15
-0.10
-0.05
0.00
0.05
TRF TRF II TRF III TRF IV
Fu
nd
Cas
h H
old
ings
(%
)
Pro
por
tion
al F
un
d F
low
s
Cash Holdings % in June 2014 Flows of Funds in Oct 2014

35
Table 1 Summary Statistics
This table shows the summary statistics for characteristics of active corporate bond funds in our sample from January 1992 to December 2014. Flow (%) is the percentage fund flow in a given month, Fund return (%) is the monthly net fund return in per cent, Log(TNA) is the natural log of total net assets (TNA), Log(Age) is the natural log of fund age in years since its inception in the CRSP database, Expense (%) is fund expense ratio in per cent, Rear load is an indicator variable that equals one if the fund share charges rear loads and zero otherwise, Cash Holdings is the proportion of fund assets held in cash in per cent, Institutional is an indicator variable that equals one if it is an institutional share class, and zero otherwise. The unit of observations is share class-month. The sample includes 4,679 unique fund share classes and 1,660 unique funds. We exclude index corporate bond funds, exchange traded funds, and exchange traded notes from the CRSP mutual fund database.
Mean Std Dev P1 P5 P10 P20 P30 P40 P50 P60 P70 P80 P90 P95 P99 N
Flow (%) 0.82 8.79 -23.83 -7.27 -4.26 -2.27 -1.33 -0.72 -0.20 0.34 1.15 2.54 5.87 11.13 44.09 326035
Fund Return (%) 0.42 1.86 -4.90 -1.93 -1.03 -0.38 0.00 0.25 0.47 0.72 0.99 1.34 1.91 2.54 5.17 326036
Log(TNA) 3.88 2.38 -2.30 -0.51 0.64 1.97 2.84 3.51 4.08 4.64 5.22 5.89 6.72 7.39 8.79 326076
Log(Age) 1.90 0.76 0.22 0.61 0.85 1.20 1.49 1.72 1.93 2.14 2.35 2.58 2.85 3.08 3.56 326871
Expense (%) 1.04 0.48 0.14 0.40 0.50 0.63 0.74 0.82 0.93 1.05 1.26 1.57 1.77 1.90 2.13 326035
Rear Load 0.29 0.46 0 0 0 0 0 0 0 0 0 1 1 1 1 326871
Cash Holdings (%) 3.50 10.04 -36.72 -10.52 -2.54 0.00 1.08 1.97 2.81 3.81 5.00 6.90 11.40 18.31 46.69 326035
Institutional 0.23 0.42 0 0 0 0 0 0 0 0 0 1 1 1 1 326871

36
Table 2 Flow-Performance Relations: Corporate Bond Funds versus Stock Funds
This table shows flow-performance relations for active corporate bond funds and stock funds from January 1992 to December 2014. Panel A shows the asymmetry in investor responses to outperformance and underperformance (positive versus negative alpha). Panel B shows the piece-wise linear regression. Flow is the proportional fund flow in a given month, Alpha is the average monthly alpha for a given fund in the past year, Bottom to Top represents the rank of a fund in a given month based on its past alpha with Bottom representing the lowest 20th percent and Top representing the highest 20th percent, Log(TNA) is the natural log of total net assets, Log(Age) is the natural log of fund age in years since its inception in the CRSP database, Expense is fund expense ratio, Rear load is an indicator variable that equals one if the fund share charges rear loads and zero otherwise. For bond fund, alpha is the intercept from a regression of excess fund returns on excess aggregate bond market and aggregate stock market returns. For stock fund, the alpha is the intercept from a regression of excess fund returns on excess aggregate stock market returns. We use the Vanguard total bond market index fund return and CRSP value-weighted market return to proxy for aggregate bond and stock market returns. The unit of observations is share class-month. We include month fixed effects and cluster standard errors by fund share class. We exclude index funds, exchange traded funds, and exchange traded notes from the CRSP mutual fund database.
Panel A: Asymmetry between Winners and Losers
(1) (2)
Corporate Bond Funds Stock Funds
Alpha 0.621*** 1.462***
(6.95) (47.41)
Alpha× (Alpha<0) 0.507*** -0.626***
(2.77) (-14.18)
Lagged Flow 0.154*** 0.117***
(21.63) (29.67)
Log(TNA) 0.000893*** 0.000421***
(7.06) (4.95)
Log(Age) -0.0157*** -0.0184***
(-31.96) (-71.37)
Expense -0.284*** -0.0232
(-3.66) (-0.34)
Rear Load -0.00245*** -0.152***
(-3.21) (-6.22)
Observations 307,242 1,578,506
Adj. R2 0.0627 0.0591

37
Panel B: Piece-wise Linear Regression
Corporate Bond Funds Stock Funds
Alpha×Bottom 1.117*** 0.827***
(8.22) (30.72)
Alpha×Q2 1.686*** 1.681***
(7.61) (35.55)
Alpha×Q3 1.577*** 2.376***
(6.54) (27.79)
Alpha×Q4 0.526*** 1.637***
(4.44) (31.23)
Alpha×Top 0.708*** 1.402***
(8.13) (46.32)
Lagged Flow 0.154*** 0.116***
(21.62) (29.58)
Log(TNA) 0.000887*** 0.000413***
(7.03) (4.88)
Log(Age) -0.0157*** -0.0184***
(-31.92) (-71.51)
Expense -0.271*** -0.0235
(-3.50) (-0.34)
Rear Load -0.00245*** -0.152***
(-3.22) (-6.24)
Observations 307,242 1,578,506
Adj. R2 0.0629 0.0599

38
Table 3 Runs on Underperforming Corporate Bond Funds with Lower Asset Liquidity
This table shows flow-performance relations for active corporate bond funds from January 1992 to December 2014. Flow is the proportional fund flow in a given month, Alpha is the intercept from a regression of excess corporate bond fund returns on excess aggregate bond market and aggregate stock market returns, Low Cash is an indicator variable equal to one if the fund has cash holdings below the average fund in the same style and zero otherwise, Neg Cash is an indicator variable equal to one if the fund has negative cash holdings and zero otherwise, Log(TNA) is the natural log of total net assets (TNA), Log(Age) is the natural log of fund age in years since its inception in the CRSP database, Expense is fund expense ratio, Rear load is an indicator variable that equals one if the fund share charges rear loads and zero otherwise. We use the Vanguard total bond market index fund return and CRSP value-weighted market return to proxy for aggregate bond and stock market returns. The unit of observations is share class-month. We include month fixed effects and cluster standard errors by fund share class. We exclude index funds, exchange traded funds, and exchange traded notes from the CRSP mutual fund database.
(1) (2) (3) (4) (5)
Full Sample Full Sample Alpha< 0 Full Sample Alpha< 0
Alpha 0.621*** 0.937*** 0.727*** 0.588*** 0.838***
(6.95) (7.19) (6.87) (6.58) (7.47)
Alpha×(Alpha<0) 0.507*** 0.0274 0.509***
(2.77) (0.13) (2.80)
Alpha*LowCash -0.534*** 0.653***
(-4.66) (4.08)
Alpha*(Alpha<0)*LowCash 1.231***
(5.32)
Alpha*NegCash 0.233 0.853*
(1.15) (1.85)
Alpha*(Alpha<0)*NegCash 0.662
(1.16)
Low Cash -0.00138*** -0.000322
(-2.58) (-0.50)
Neg Cash -0.00193** -0.000264
(-2.17) (-0.23)
Lagged Flow 0.154*** 0.153*** 0.111*** 0.154*** 0.111***
(21.63) (21.54) (14.17) (21.61) (14.20)
Log(TNA) 0.000893*** 0.000902*** 0.000548*** 0.000896*** 0.000523***
(7.06) (7.14) (3.60) (7.09) (3.42)
Log(Age) -0.0157*** -0.0156*** -0.0143*** -0.0157*** -0.0144***
(-31.96) (-31.71) (-25.84) (-32.04) (-26.11)
Expense -0.284*** -0.261*** -0.144 -0.286*** -0.169*
(-3.66) (-3.41) (-1.60) (-3.69) (-1.88)
Rear Load -0.00245*** -0.00244*** -0.00228** -0.00247*** -0.00228**
(-3.21) (-3.21) (-2.54) (-3.25) (-2.54)
Observations 307,242 307,242 171,006 307,242 171,006
Adj. R2 0.0627 0.0632 0.0478 0.0629 0.0476
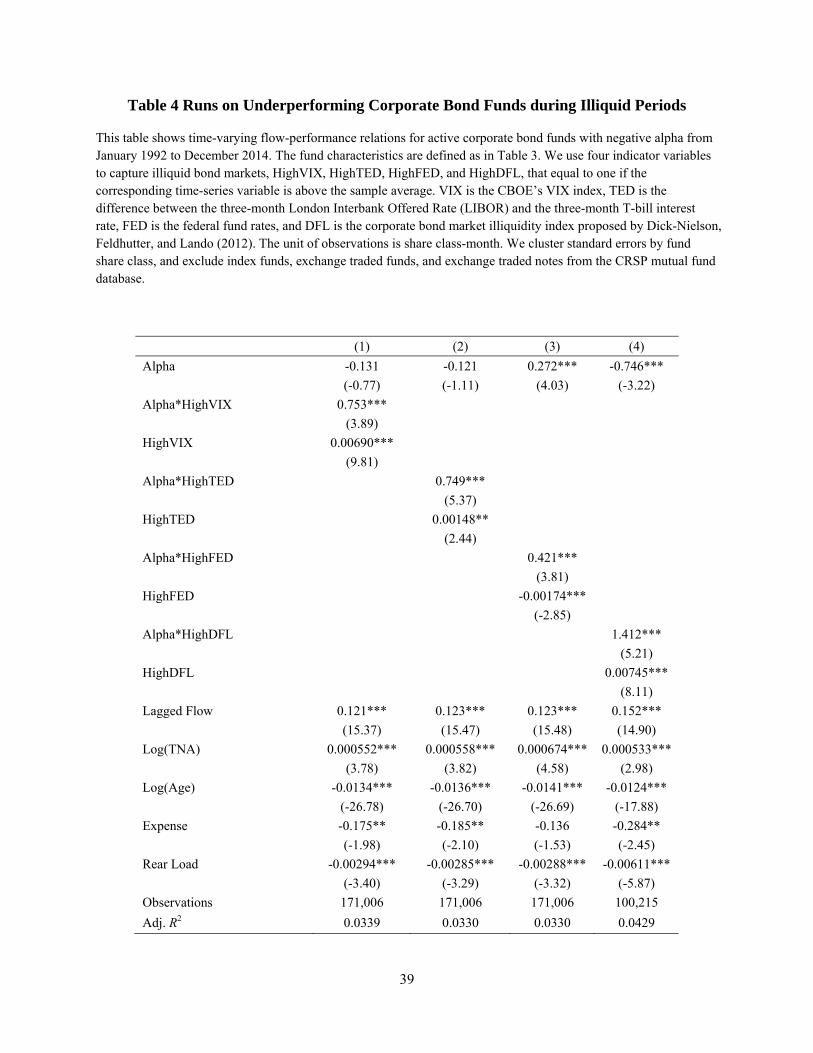
39
Table 4 Runs on Underperforming Corporate Bond Funds during Illiquid Periods
This table shows time-varying flow-performance relations for active corporate bond funds with negative alpha from January 1992 to December 2014. The fund characteristics are defined as in Table 3. We use four indicator variables to capture illiquid bond markets, HighVIX, HighTED, HighFED, and HighDFL, that equal to one if the corresponding time-series variable is above the sample average. VIX is the CBOE’s VIX index, TED is the difference between the three-month London Interbank Offered Rate (LIBOR) and the three-month T-bill interest rate, FED is the federal fund rates, and DFL is the corporate bond market illiquidity index proposed by Dick-Nielson, Feldhutter, and Lando (2012). The unit of observations is share class-month. We cluster standard errors by fund share class, and exclude index funds, exchange traded funds, and exchange traded notes from the CRSP mutual fund database.
(1) (2) (3) (4)
Alpha -0.131 -0.121 0.272*** -0.746***
(-0.77) (-1.11) (4.03) (-3.22)
Alpha*HighVIX 0.753***
(3.89)
HighVIX 0.00690***
(9.81)
Alpha*HighTED 0.749***
(5.37)
HighTED 0.00148**
(2.44)
Alpha*HighFED 0.421***
(3.81)
HighFED -0.00174***
(-2.85)
Alpha*HighDFL 1.412***
(5.21)
HighDFL 0.00745***
(8.11)
Lagged Flow 0.121*** 0.123*** 0.123*** 0.152***
(15.37) (15.47) (15.48) (14.90)
Log(TNA) 0.000552*** 0.000558*** 0.000674*** 0.000533***
(3.78) (3.82) (4.58) (2.98)
Log(Age) -0.0134*** -0.0136*** -0.0141*** -0.0124***
(-26.78) (-26.70) (-26.69) (-17.88)
Expense -0.175** -0.185** -0.136 -0.284**
(-1.98) (-2.10) (-1.53) (-2.45)
Rear Load -0.00294*** -0.00285*** -0.00288*** -0.00611***
(-3.40) (-3.29) (-3.32) (-5.87)
Observations 171,006 171,006 171,006 100,215
Adj. R2 0.0339 0.0330 0.0330 0.0429

40
Table 5 Constraining Runs on Underperforming Corporate Bond Funds
with Lower Asset Liquidity: Large Institutional Investors
This table shows how the flow-performance relations for active corporate bond funds with negative alpha are influenced by large institutional investors. A fund is classified as an institutional-oriented (retail-oriented) fund is more than 80% (less than 20%) of fund assets are owned by institutional investors through institutional share class. Flow is the proportional fund flow in a given month, Alpha is the intercept from a regression of excess corporate bond fund returns on excess aggregate bond market and aggregate stock market returns, Low Cash is an indicator variable equal to one if the fund has cash holdings below the average fund in the same style and zero otherwise, Inst is an indicator variable equal to one if the fund class is an institutional share class and zero otherwise, Log(TNA) is the natural log of total net assets (TNA), Log(Age) is the natural log of fund age in years since its inception in the CRSP database, Expense is fund expense ratio, Rear load is an indicator variable that equals one if the fund share charges rear loads and zero otherwise. We use the Vanguard total bond market index fund return and CRSP value-weighted market return to proxy for aggregate bond and stock market returns. The unit of observations is share class-month. We include month fixed effects and cluster standard errors by fund share class. We exclude index funds, exchange traded funds, and exchange traded notes from the CRSP mutual fund database.
Institutional-Oriented Funds
(Alpha<0) Retail-Oriented Funds
(Alpha<0) (1) (2) (3) (4)
Alpha 1.827*** 1.821*** 0.916** 0.955**
(3.29) (3.26) (2.12) (2.21) Alpha*LowCash -0.499 -0.496 1.231*** 1.207***
(-0.63) (-0.63) (2.76) (2.72) Low Cash -0.00248 -0.00247 -0.000678 -0.000893
(-1.23) (-1.22) (-0.51) (-0.68) Lagged Flow 0.105*** 0.105*** 0.106*** 0.106***
(5.22) (5.22) (5.14) (5.12) Log(TNA) 0.000208 0.000229 0.000397 0.000601*
(0.57) (0.61) (1.14) (1.67) Log(Age) -0.0161*** -0.0161*** -0.0133*** -0.0129***
(-9.50) (-9.37) (-10.60) (-10.31) Expense 0.0261 0.00277 -0.527*** -0.368**
(0.08) (0.01) (-2.95) (-2.03) Rear Load -0.00392 -0.00397 -0.00621*** -0.00595***
(-1.40) (-1.42) (-4.03) (-3.85) Inst -0.000441 0.00463*** (-0.18) (3.47) Observations 19,545 19,545 40,521 40,521 Adj. R2 0.0377 0.0376 0.0489 0.0494

41
Table 6 Alternative Measure of Fund Alpha
This table shows flow-performance relations for active corporate bond funds from January 1992 to December 2014 using alternative measures of fund alpha. Alpha is the intercept from a regression of excess corporate bond fund returns on excess aggregate bond market returns in the past year. Other variables are defined as in Table 3. The unit of observations is share class-month. We include month fixed effects and cluster standard errors by fund share class. We exclude index funds, exchange traded funds, and exchange traded notes from the CRSP mutual fund database.
(1) (2) (3) (4) (5)
Full Sample Full Sample Alpha< 0 Full Sample Alpha< 0
Alpha 0.448*** 0.643*** 0.553*** 0.430*** 0.566***
(6.83) (6.78) (8.60) (6.46) (9.07)
Alpha×(Alpha<0) 0.369*** 0.105 0.357***
(3.48) (0.83) (3.41)
Alpha*LowCash -0.294*** 0.163
(-3.23) (1.62)
Alpha*(Alpha<0)*LowCash 0.515***
(3.48)
Alpha*NegCash 0.0285 0.802**
(0.19) (2.49)
Alpha*(Alpha<0)*NegCash 0.711*
(1.83)
Low Cash -0.00208*** -0.00154**
(-3.97) (-2.30)
Neg Cash -0.00136 0.00143
(-1.61) (1.09)
Lagged Flow 0.154*** 0.154*** 0.141*** 0.154*** 0.141***
(21.64) (21.56) (15.85) (21.63) (15.87)
Log(TNA) 0.000878*** 0.000878*** 0.000444*** 0.000882*** 0.000427**
(6.96) (6.97) (2.67) (6.99) (2.57)
Log(Age) -0.0157*** -0.0156*** -0.0141*** -0.0157*** -0.0143***
(-31.96) (-31.74) (-22.95) (-32.03) (-23.23)
Expense -0.322*** -0.313*** 0.0286 -0.324*** 0.0133
(-4.25) (-4.15) (0.29) (-4.28) (0.14)
Rear Load -0.00240*** -0.00239*** -0.00212** -0.00242*** -0.00207**
(-3.17) (-3.17) (-2.10) (-3.19) (-2.06)
Observations 307,242 307,242 137,313 307,242 137,313
Adj. R2 0.0623 0.0627 0.0574 0.0625 0.0574