bolsa bay, california, proposed ocean entrance system … · outer bolsa bay under the lake 3...
TRANSCRIPT

BLS MISCELLANEOUS PAPER CERC-89-17
BOLSA BAY, CALIFORNIA, PROPOSED OCEANENTRANCE SYSTEM STUDY
Report 3
TIDAL CIRCULATION AND TRANSPORT COMPUTERSIMULATION AND WATER QUALITY ASSESSMENT
_ -- SECTION 2: SIGNAL LANDMARK'S PROPOSEDSECONDARY ALTERNATIVE
"THE LAKE PLAN"
by
Lyndell Z. Hales, Sandra L. Bird, Bruce A. EbersolerVj -" Coastal Engineering Research Center
DEPARTMENT OF THE ARMY
Waterways Experiment Station, Corps of Engineers3909 Halls Ferry Road, Vicksburg, Mississippi 39180-6199
and
Raymond Walton
Camp Dresser & McKee International, Inc.One Cambridge Center
Cambridge, Massachusetts 02142
March 1990
Report 3 of a Series
Approved For Public Release; Distribution Unlimited
Prepared for State of CaliforniaState Lands Commission
S1807 13th Street, Sacramento, California 95814
90 06 25 177

Destroy this report when no longer needed. Do not returnit to the originator.
The findings in this report are not to be construed as an officialDepartment of the Army position unless so designated
by othnr authorized documents.
The contents of this report are not to be used foradvertising, publication, or promotional purposes.Citation of trade names does not constitute anofficial endorsement or approval of the use of
such commercial products.

UnclassifiedSECURITY CLASSiFICAT;ON OF "'S PAGE
Form ApprovedREPORT DOCUMENTATION PAGE OMB No. 0704-0188
la REPORT SECURITY CLASSIF CATION lb RESTRICTVE MARKANGS
Unclassified2a. SECURITY CLASSIFICATION AUTHORIT'r 3 DISTRIBUTION, AVAILABILITY OF REPORT
Approved for public release; distribution2b. DECLASSIFICATION I DOWNGRADING SCHEDULE unlimited.
4 PERFORMING ORGANIZATION REPORT NUMBER(S) S MONITORING ORGANIZATION REPORT NUMBER(S)
Miscellaneous Paper CERC-89-17
6a. NAME OF PERFORMING ORGANIZATION 6b. OFFICE SYMBOL 7a. NAME OF MONITORING ORGANIZATION(If applicable)See reverse.
6c. ADDRESS (City, State, and ZIP Code) 7b. ADDRESS (City, State, and ZIP Code)
See reverse.
8a. NAME OF FUNDING SPONSORING 8b OFFICE SYMBOL 9 PROCUREMENT INSTRUMENT IDENTIFICATION NUMBERORGANIZATION (if applicable)
State of California a
8c. ADDRESS (City, State, and ZIPCode) 10 SOURCE OF FUNDING NUMBERSState Lands Commission "ROGRAM PROJECT TASK TWORK UNIT1807 13th Street L' ZMENT NO NO. NO. ACCESSION NO
Sacramento, CA 95814 I 1 111. TITLE (include Security Classfcaion) Bolsa Bay, California, Proposed Ocean Entrance System Study:Report 3, Tidal Circulition and Transport Computer Simulation and Water Quality Assessment;Section 2: Signal Landmark's Proposed Secondary Alternative, "The Lake Plan"
12. PERSONAL AUTHOR(S)Hales, Lyndel Z.; Bird, Sandra L.; Ebersole, Bruce A.; Walton, Raymond
13a. TYPE OF REPORT 13o TIME rOVERED 14. DATE OF REPORT (Year, Month, Day) 15. PAGE COUNTReport 3 of a series FROM TO _ March 1990
16. SUPPLEMENTARY NOTATIONAvailable from National Technical Information Service, 5285 Port Royal Road, Springfi9ld,VA 22161.
17. COSATI CODES ,IVSUBJECT TERMS" tienW're ort-revense f necessery-en ideryy by block hnber)"
FIELD GROUP SUB-GROUP Entrance channels., Prototype data - Water quality.
Marinas, Tidal circulation. Water surface.Numerical simulation, Tidal velocities Wetlands ,
19. ABSTRACT (Continue on reverse if necessary and identify by block number)
"The State of California, State Lands Commission (SLC), is reviewing a plan for a newocean entrance system as part of a multi-use project. This project involves both Stateand private property in the proposed development by the SLC, Signal Landmark, and others.The project, located in the Bolsa Chica area of the County of Orange, California, includesnavigational, commercial, recreational, and residential uses, along with major wetlandsrestoration. The County of Orange has approved a Land Use Plan (LUP), in 1985, as part ofthe Local Coastal Program for Bolsa Chica in accordance with the California Coastal Act of1976. This same LUP was certified by the California Coastal Commission (CCC) withconditions in 1986. Part of the LUP certification requirement to satisfy those conditionsincludes confirmation review of modeling studies of a navigable and a non-navigable oceanentrance at Bolsa Chica. To satisfy the CCC requirements for confirmation of the LUP, theSLC requested the US Army Engineer Waterways Experiment Station (WES), through a
(Continued)
20. DISTRIBUTION /AVAILABILITY OF ABSTRACT 21. ABSTRACT SECURITY CLASSIFICATIONMUNCLASSIFIE DUNLIMITED C3 SAME AS RPT. [ DTIC USERS Unclassified
22a. NAME OF RESPONSIBLE INDIVIDUAL 22b TELEPHONE (Include Area Code) T22c. OFFICE SYMBOL
DD Form 1473, JUN 86 Previous editions are obsolete. SECURITY CLASSIFICATION OF THIS PAGEUnciassit
ed

Unclassified
SECUO'T
Y -SSiiC;.TION OF THIS PAGE
6a & c. NAMES AND ADDRESSES OF PERFORMING ORGANIZATIONS (Continued).
USAEWES, Coastal Engineering Research Center3909 Halls Ferry RoadVicksburg, MS 39180-6199
Camp Dresser & McKee International, Inc.One Cambridge CenterCambridge, MA 02142
19. ABSTRACT (Continued).
Memorandum of Agreement executed 2 July 1987 to conduct engineering studies on thetechnical and environmental assessment of a navigable and a non-navigable ocean entrancesystem, as conditionally approved in the LUP. These services were provided to SLC by WESunder authority of Title III of the Intergovernmental Cooperation Act of 1968. As such,resultant study products are based on specific technical expertise only and should not beinferred to indicate support or nonsupport by the US Army Corps of Engineers for eitherproject involving a navigable or non-navigable ocean entrance or for t1. civiroiumentai oreconomic aspects of these or any other subsequent project.
The Lake Plan concept was developed and introduced for analysis by Signal Landmarkas a third alternative to the two alternatives in the LUP of the Local Coastal Program forBolsa Chica. The Lake Plan is a modification that incorporates features of both thenavigable ocean entrance concept with full marina complex (termed the PreferredAlternative by the County of Orange and the CCC) and the non-navigable ocean entranceconcept with reduced marina complex (termed the Secondary Alternative by the County ofOrange and the CCC). The Lake Plan provides for a non-navigable entrance channel at thesame location as the Preferred and Secondary Alternative, but with a marina reduced insize from that of the Preferred Alternative. The design of the wetlands enhancement willremain the same as for the Preferred Alternative.
Design details of the Lake Plan include a total water surface area of approximately112 acres encompassing the main channel, marina basins, lower reach of the East GardenGrove-Wintersburg Flood Control Channel, interior waterways adjacent to residential uses,and other secondary channels connecting the wetlands and ocean entrance. The design depthof the proposed entrance channel that connects the marina to the Pacific Ocean is -6 ftmean sea level (msl), while the depth of the proposed marina is -20 ft msl. The Lake Planalternative design contemplates an ocean entrance channel whose width should be only greatenough to support a 1,100-acre marsh area from a hydraulic standpoint. Optimization ofthe entrance channel design has not been performed, although two entrance channel widthshave been evaluated. These two entrance channel widths are designated Lake I (350-ft-wideentrance channel) and Lake 2 (200-ft-wide entrance channel). Additionally, thepossibility exists that the entrance channel may close by littoral material transport inthe surf zone. Hence, it is necessary to evaluate the effects of a closed entrance onhydrodynamics and water quality aspects. The Lake Plan alternative when the oceanentrance channel is closed has been designated Lake 3.
The development of either Lake 1 or Lake 2 new non-navigable entrance channel systemto Bolsa Chica, with associated marinas, full tidal, and muted tidal wetlands enhancement,is feasible from engineering, hydrodynamic, and water quality standpoints investigated bythis study. Any potential for scour resulting from high velocities near bridges or inOuter Bolsa Bay under the Lake 3 concept (where the proposed Lake 1 or Lake 2 entrancechannel at Bolsa Chica has closed) could be prevented by channel stabilization measuresinstalled as part of project construction. Since the entrance channel could be reopenedimmediately following closure by a storm, other related environmental elements such aswater age may not be adversely impacted. The Bolsa Bay complex will provide for multiplepublic and private uses with an emphasis on wildlife habitat enhancement, publicrecreation, coastal access, and water dependent residential development.
Unclassified
SECURITY CLASSIFICATION OF THIS PAGE

PREFACE
Authority to carry out this investigation was granted the Coastal
Engineering Research Center (CERC), US Army Engineer Waterways Experiment
Station (WES), by a Memorandum of Agreement executed 2 July 1987 between the
California State Lands Commission (SLC) and the Department of the Army under
authority of Title III of the Intergovernmental Cooperation Act of 1968. As
such, resultant study products are based on specific technic 1 expertise only
and should not be inferred to indicate support or nonsupport by the Corps of
Engineers for the environmental or economic aspects of any subsequent project.
The study reported herein was conducted during the period February t-
through June 1989 by Dr. Lyndell Z. Hales, Research Hydraulic Engineer,
Coastal Processes Branch (CPB), Research Division (RD), CERC; Ms. Sandra L.
Bird, Civil Engineer, American Scientific International (formerly Research
Civil Engineer, Water Quality Modeling Croup (WQMG), Ecosystem Research and
Simulation Division (ERSD), Environmental Laboratory (EL), WES); Mr. Bruce A.
Ebersole, Chief, CPB; and Dr. Raymond Walton, Senior Scientist, Camp Dresser &
McKee International, Inc.
This investigation was performed under the general supervision of
Dr. James R. Houston, Chief, CERC; Mr. Charles C. Calhoun, Jr., Assistant
Chief, CERC; Mr. H. Lee Butler, Chief, RD, CERC; Dr. Stephen A. Hughes, former
Chief, CPB, RD, CERC; Dr. John Harrison, Chief, EL; Dr. John W. Keeley,
Assistant Chief, EL; and Mr. Mark S. Dortch, Chief, WQMG, ERSD, EL. This
report was prepared by Dr. Hales, Ms. Bird, Mr. Ebersole, and Dr. Walton.
Project Managers during the conduct of this investigation and the
publication of this report were Mr. Daniel Gorfain for SLC and Dr. Hughes for
WES.
Commander and Director of WES during the publication of this report was
COL Larry B. Fulton, EN. Technical Director of WES was Dr. Robert W. Whalin.

CONTENTS
ftge
PREFACE ................. ................................ 1
CONVERSION FACTORS, NON-SI TO SI (METRIC)UNITS OF MEASUREMENT ............. ........................ 3
PART I: INTRODUCTION ............. ........................ 4
Elements of the Lake Plan ........... .................... 4Purposes of the Study ........ ...................... 12
PART II: COMPARISON OF LAKE PLAN ALTERNATIVE HYDRODYNAMICS ..... 13
Water Surface Elevations ....... .................... 13Average Channel Velocities ...... ................... . 26Effect of Interior Wetlands Connection at Bolsa Chica ...... .. 47
PART III: EAST GARDEN GROVE-WINTERSBURG FLOOD CONTROL CHANNEL(EGG-WFCC) 100-YEAR FLOOD FLOW .... .............. .. 55
Water Surface Elevations ....... .................... 55Average Channel Velocities ...... ................... . 64
PART IV: EVALUATION OF TRANSPORT CHARACTERISTICS .. .......... . 77
Tidal Boundary Dciver ........ ...................... 77System Water Age ......... ........................ 78East Garden Grove-Wintersburg
Flood Control Channel (EGG-WFCC) Runoff ... ............ . 86Assessment of Transport Characteristics .... ............. .. 92
PART V: SUMMARY AND CONCLUSIONS ...... .................. 94
Summary ............ ............................. 94Conclusions ........... ........................... . 95Summary Conclusions ......... ....................... . 101
REFERENCES ............ .............................. 102
APPENDIX A: EXISTING CONDITION WATER SURFACE ELEVATIONS ... ....... Al
APPENDIX B: EXISTING CONDITION AVERAGE CHANNEL VELOCITIES ... ...... B1
APPENDIX C: LAKE 1, 350-FT NON-NAVIGABLE ENTRANCE CHANNELWATER SURFACE ELEVATIONS ........ ................. Cl
APPENDIX D: LAKE 1, 350-FT NON-NAVIGABLE ENTRANCE CHANNELAVERAGE CHANNEL VELOCITIES ........ ................ D1
APPENDIX E: LAKE 2, 200-FT NON-NAVIGABLE ENTRANCE CHANNELWATER SURFACE ELEVATIONS ......... ................. El
APPENDIX F: LAKE 2, 200-FT NON-NAVIGABLE ENTRANCE CHANNELAVERAGE CHANNEL VELOCITIES ........ ................ Fl
APPENDIX G: LAKE 3, NON-NAVIGABLE ENTRANCE CHANNEL CLOSEDWATER SURFACE ELEVATIONS ..... .................. Gl
APPENDIX H: LAKE 3, NON-NAVIGABLE ENTRANCE CHANNEL CLOSEDAVERAGE CHANNEL VELOCITIES ........ ................ H1
2

CONVERSION FACTORS, NON-SI TO SI (METRIC)UNITS OF MEASUREMENT
Non-SI units of measurement used in this report can be converted to SI
(metric) units as follows:
Multiply By To Obtain
acres 0.40469446 hectares
cubic feet per second 0.028317 cubic metres per second
feet 0.3048 metres
feet per second 0.3048 metres per second
Ar NTT
3

BOLSA BAY, CALIFORNIA, PROPOSED OCEANENTRANCE SYSTEM STUDY
I'AL CIRCULATION AND TRANSPORT COMPUTER SIMULATIONAND WATER QUALITY ASSESSMENT
Section 2: Signal Landmark's Proposed Secondary Alternative
"The Lake Plan"
PART I: INTRODUCTION
Elements of the Lake Plan
1. The Lake Plan concept was developed and introduced for analysis by
Signal Landmark as a third alternative to the two alternatives in the Land Use
Plan (LUP) of the Local Coastal Program for Bolsa Chica approved by the County
of Orange (Orange County Environmental Management Agency 1985). The Lake Plan
is a modification which incorporates features of both the navigable ocean
entrance concept with full marina complex (termed the Preferred Alternative by
the County of Orange and the California Coastal Commission), and the non-
navigable ocean entrance concept with reduced marina complex (termed the
Secondary Alternative by the County of Orange and the California Coastal
Commission). The Lake Plan provides for a non-navigable entrance channel at
the same location as the Preferred and Secondary Alternatives, but with a
marina reduced in size from that of the Preferred Alternative. The design of
the proposed wetland enhancement will remain the same as for the Preferred
Alternative.
Lake Plan alternative design details
2. Design details of the Lake Plan include a total water surface area
of approximately 112 acres* encompassing the main channel, marina basins,
A table of factors for converting non-SI units of measurements to SI(metric) units is presented on page 3.
4

lower reach of the East Garden Grove-Wintersburg Flood Control Channel
(EGG-WFCC), interior waterways adjacent to residential uses, and other
secondary channels connecting the wetlands and ocean entrance. The design
depth of the proposed entrance channel which connects the marina to the
Pacific Ocean is -6 ft mean sea level (msl), while the depth of the proposed
marina is -20 ft msl. Design details of the Lake Plan link-node system are
shown in Figure I for Lake I (350-ft wide entrance channel), and Lake 2
(200-ft wide entrance channel) alternative concepts. Details of the Lake Plan
link-node system are presented in Figure 2 for Lake 3 (entrance channel closed
by littoral material in the surf zone) alternative concept.
3. The Lake Plan alternative design contemplates an ocean entrance
channel whose width should only be great enough to support an 1,100 acre marsh
area from a hydraulic standpoint. The wetland enhancement design of the
Preferred Alternative is not proposed to be altered by the Lake Plan marina
and ocean entrance modifications. Consequently, it is desired to optimize a
hydraulic connection to the ocean sufficient in size to serve only 930 acres
of wetlands (including 142 acres of existing full and muted tidal wetlands,
116 acres of proposed additional full tidal wetlands, and 193 acres of
proposed additional muted tidal wetlands), as generally described under the
Preferred Alternative. The design for the EGG-WFCC will remain unchanged. No
navigable channel connection to Huntington Harbour is included. Tidal flow
control itrucLZes to the proposed anh.,nced wetlands also will remain the same
as described for the Preferred Alternative.
Lake Plan alternatives simulated by DYNTRAN
4. The calibrated and verified numerical simulation model DYNTRAN
(Moore and Walton 1984), previously utilized to evaluat-e both the Preferred
and Secondary Alternatives, was used to determine the hydrodynamics and water
quality aspects of the Bolsa Bay complex resulting from the proposed Lake Plan
alternatives. The existing conditions as previously evaluated are considered
to be the base conditions for comparison of Lake Plan effects. Optimization
of the entrance channel design has not been performed, although two entrance
channel widths have been evaluated. These two entrance channel widths are
designated Lake 1 and Lake 2 (Lake I - 350-ft wide entrance channel;
Lake 2 - 200-ft wide entrance channel). Additionally, the possibility exists
that the entrance channel may close by littoral material transport in the surf
5

C4 A
E 0.
X a n JoCw
0> V
$W- -4
0 C.
on -
4, C6

t--
x C:
41~~~~.c us;.u I
C144
41'
7j Ai-

zone. Hence, it is necessary to evaluate the effects of a closed entrance on
hydrodynamics and water quality aspects. The Lake Plan alternative when the
ocean entrance channel is closed has been designated Lake 3. The locations of
the nodes for the displayed numerical model simulation results from Anaheim
Bay, Huntington Harbour, and the Bolsa Bay complex are shown in Figure 3. The
locations of the links for displayed results from the system are presented in
Figure 4.
Wetland design
5. Based on the requirements of converting non-wetlands into wetland
status according to LUP policies, the California Department of Fish and Game
(DFG) (Radovich 1987) determined the minimum acreage requirements per wetland
type as:
a. High pickleweed dominated saltmarsh (rarely, if ever,completely inundated), 200 acres,
b. Periodically inundated saltflats, 150 acres,
p. Fresh to slightly brackish (less than 5 ppt salts)permanently inundated pond, 50 acres,
d. Muted tidal wetland (similar to that contained withinInner Bolsa Bay) with an 18-in. daily average tidal waterlevel variance, 300 acres,
e. Full tidal wetland (similar to that contained withinOuter Bolsa Bay), 215 acres, and
f. Total wetland acreage, 915 acres.
6. Accordingly, Moffatt & Nichol, Engineers, in 1988, analyzed the
geometry of the study area based on these criteria. The tidal wetlands
evaluated consisted of 142 acres of existing full and muted tidal wetlands,
116 acres of proposed additional full tidal wetlands, and 193 acres of
proposed additional muted tidal wetlands. Their storage curves are as
follows:
8

C4 ~
C144 p
9O

040,9
co
0

Existing Full and Muted Tidal Wetlands
Elevation (ft, msl) -3.5 -2.3 -0.3 1.8 4.5
Area (acres) 1.7 6.3 44.4 122.6 142.0
Proposed Additional Full Tidal Wetlands
Elevation (ft, msl) -5.0 0.0 1.0 2.0 4.5
Area (acres) 58.2 96.5 100.6 105.3 116.0
Proposed Additional Muted Tidal Wetlands
Elevation (ft, msl) -3.5 -2.3 -0.3 1.8 4.5
Area (acres) 2.3 8.6 60.5 167.0 193.4
These data also were developed contingent upon the requirement that a minimal
amount of earth moving take place in the wetland enhancement area. The above
elevation-area relationships were installed in the numerical simulation model
for all proposed full and muted wetland regions of the Lake Plan concept.
Culvert system design
7. Preliminary evaluations have resulted in specific culvert designs
which are being utilized, in conjunction with marina and wetland enhancement
alternatives. These simulations assessed the effectiveness of the culverts in
providing an assured level of wetland inundation and flushing ability.
8. The Lake Plan concept provides for connecting the proposed marinas
with a full tidal wetland region by two box culvert systems. Each of the
culvert systems will have two box culverts, each 5-ft high by 10-ft wide, with
invert elevations of -5 ft msl. The full tidal wetland region is then
connected to a muted tidal wetland region by a 4-ft-diam culvert system
(4 pipes in, 6 pipes out), with invert elevations of -5.1 ft msl. The
proposed muted tidal wetland region may or may not be connected to the
existing muted tidal wetlands (Inner Bolsa Bay) by a breach in the dike system
at Link 162 (connecting Node 50 with Node 134). The full tidal wetland region
is not connected to Inner Bolsa Bay. Inner Bolsa Bay is connected directly to
the Lake Plan marina entrance channel (enhancing existing muted tidal wetland
water quality characteristics) by a 4-ft-diam culvert system (2 pipes in,
3 pipes out), with invert elevations of -5.1 ft msl.
11

Purposes of the Study
Tidal circulation modeling
9. The purposes of this additional tidal circulation computer simula-
tion modeling were to ascertain the hydrodynamic effects relating to the
development of the Lake Plan at the Bolsa Bay complex, with associated marinas
and wetland enhancement. The enhanced wetland design is the same as that
developed for the Preferred Alternative. Additionally, the hydrodynamic
effects resulting from the closure of the Lake Plan alternative by littoral
material transport in the surf zone were determined.
Transport and water quality assessment
10. The purposes of the transport computer simulation and water quality
assessment included the determination of potential changes to transport and
dispersion of conservative tracers from existing conditions by the Lake Plan
concept. An evaluation of the quality of the present water supply provided by
existing conditions in the existing ecological reserve with the quality of
water to be provided with the Lake Plan alternative and wetland enhancement
concepts, both in terms of water quality parameters and water parcel residence
times, was performed. The effects of proposed enhancements on water quality
in the Anaheim Bay complex, Huntington Harbour, existing wetlands, and
flushing capability of proposed wetland modifications, were ascertained.
Critical elements evaluated
11. Major concerns being addressed by the hydrodynamic and water quality
analyses include:
A. Velocities under Pacific Coast Highway bridge at Anaheim Bay,
b. Excessive velocities pertaining to swimmer safety inHuntington Harbour,
Q. Potential for scour and erosion in Outer Bolsa Bay, withaccompanying shoaling in Huntington Harbour,
4. Changes in water surface elevations, and ability to controlsuch water surface elevations, in both the existing mutedtidal wetlands (Inner Bolsa Bay and the DFG cell) and theproposed enhanced full tidal and muted tidal wetlands,
. Water quality aspects throughout Huntington Harbour and theBolsa Bay complex, and
f. Effects of 100-year flood flow from the East Garden Grove-Wintersburg Flood Control Channel on hydrodynamics and waterquality.
12

PART II: COMPARISON OF LAKE PLAN ALTERNATIVE HYDRODYNAMICS
Water Surface Elevations
12. Tidal simulations throughout the Bolsa Bay complex are presented
for existing conditions, Lake I, Lake 2, and Lake 3 in Appendix A, Appendix C,
Appendix E, and Appendix G, respectively. Maximum spring high tide eleva-
tions, maximum spring low tide elevations, and tidal ranges are shown in
Table I for specific locations throughout the Huntington Harbour and Bolsa Bay
complex. Comparisons of the effects of these plans with existing conditions
for typically representative water surface time-histories are presented in
Figures 5 and 6 for Huntington Harbour (Nodes 5 and 25), Figures 7 through 10
for Outer Bolsa Bay (Nodes 29, 30, 31, and 32), Figure 11 for the entrance
channel to the proposed marina (Node 33), Figures 12 and 13 for Inner Bolsa
Bay (Nodes 45 and 50), and Figure 14 for the DFG muted tidal cell (Node 54),
respectively. The proposed marina and the proposed enhanced tidal wetlands do
not exist under present conditions; hence, effects of various plan alterna-
tives can only be compared with each other. Comparisons of the effects of
Lake 1, Lake 2, and Lake 3 for typically representative water surface time-
histories are presented in Figures 15 and 16 for the proposed marina (Nodes 77
and 90), Figures 17 through 19 for the proposed full tidal wetlands (Nodes 97,
112, and 113), and Figures 20 through 23 for the proposed muted tidal wetlands
(Nodes 117, 123, 129, and 132), respectively.
Huntington Harbour
13. Primary interest with regard to water surface elevations is direct-
ed toward the ability of the Lake Plan non-navigable entrance channel concept
to fully support the proposed wetland enhancement plan. It has previously
been determined that the Huntington Harbour tidal prism fills and empties
through Anaheim Bay; hence, Lake Plan effects will not impact water surface
elevations in the harbor. It can be observed by Figures 5 and 6 (Nodes 5 and
25, lcated at the ends of the main harbor channel) that the water surface
throughout Huntington Harbour responds identically as existing conditions for
all Lake Plan concepts.
13

Table 1
Comparison of Existin2 Conditionswith
Alternative Lake Plan Concepts
Water Surface Elevations in Existing and Proposed Wetlands
Wetlands Not Connected
Location Node POSTBOL Lake i Lake 2 Lake 3
Spring High Tide. feet (msl)
Huntington Harbour 10 4.10 4.10 4.10 4.10
Outer Bolsa Bay 31 4.10 4.10 4.10 4.09
Inner Bolsa Bay 37 1.04 1.18 1.16 1.15
DFG muted tidal wetlands 54 0.98 1.12 1.10 1.08
Proposed full tidal wetlands 93 ---- 3.45 3.44 3.29
Proposed muted tidal wetlands 123 ---- 1.50 1.51 1.46
Spring Low Tide. feet (msl)
Huntington Harbour 10 -4.10 -4.10 -4.09 -4.03
Outer Bolsa Bay 31 -2.77 -3.82 -3.53 -1.54
Inner Bolsa Bay 37 -0.40 -0.61 -0.60 -0.33
DFG muted tidal wetlands 54 -0.09 -0.16 -0.14 -0.08
Proposed full tidal wetlands 93 ---- -1.41 -1.42 -1.14
Proposed muted tidal wetlands 123 ---- -0.55 -0.55 -0.47
Spring Tidal Range. feet
Huntington Harbour 10 8.2 8.2 8.2 8.1
Outer Bolsa Bay 31 6.8 7.9 7.6 5.6
Inner Bolsa Bay 37 1.5 1.8 1.8 1.5
DFG muted tidal wetlands 54 1.1 1.3 1.2 1.2
Proposed full tidal wetlands 93 --- 4.9 4.9 4.4
Proposed muted tidal wetlands 123 --- 2.1 2.1 1.9
POSTBOL - existing conditionsLake I - 350-ft wide entrance channel
Lake 2 - 200-ft wide entrance channelLake 3 - entrance channel closed
14

ELEVATION COMPARISON5.0 _ STA. 5 rRWi POSTOMM Ii
--- ST. 5 rR011 LIKED1STA. 5 FrROf LAKEI2
-. STA. S rR0H LAKEH3i.0
3.0--a
-2.0-
L..
L.jL-J 0 . 0
V
-20
19 -3.0-
-4.0-
-5.0 I
0.0 2g.0 50.0 A.0 100.0 1A.0 150.0 175.0 2 0.0 2M.0 250.0 2A.0TIME (HRS]
Figure 5. Tidal elevation comparisons in Huntington Harbour,POSTBOLH1 - existing condition, LAKEHI - 350-ft entrance channel,LAKEH2 -200-ft entrance channel, LIAKEH3 - entrance channel closed
ELEVATION COMPARISON5.0- - S". 25 9rR0I POSTUUI
SSM. 2s RwflLtCD1-SM. 25 FMM UWtDI
4.0 - STA. 25 rMOI LIW(O1
3.0-
-2.0-
.-
-j
L)
S-2.0-WiI-
0.0 25.0 50.0 A5.0 I 00.0 123.0 150.0 175.0 200.0 2.0 250.0 275.0
TIMC (HRS)Figure 6. Tidal elevation comparisons in Huntington Harbour,
POSTBOLH1 - existing condition, LAK.EH1 - 350-ft entrance channel,LA.KEH2 - 200-ft entrance channel, LAKEH3 - entrance channel closed
15

ELEVATION COMPARISONS.0- STr. 29 ro POSTUOLMI
STR. 29 rM LWmD41STR. 29 FROM L02
i.0 - STA. 29 ROM LAKED3
3.0
U
- 2.0"I-
.1
L.-1 0.0 "-.0
L)
Ln
w -2.0-Li
-3.0
-4.0 -
-50.0 2.0 5 0. A.o 0 100.0 1.0 45.0 17A.0 2C.0 23.0 30.0 275.0TIME (HRS)
Figure 7. Tidal elevation comparisons in Outer Bolsa Bay,
POSTBOLH1 - existing condition, LAKEHI - 350-ft entrance channel,
LAKEH2 - 200-ft entrance channel, LAKEH3 - entrance channel closed
ELEVATION COMPAR I SON5.0- - SMR. 30 RFl POSTLiII
---STA. 30 VnWI LRC01....... STA. 30 F" .UKa i
4.0- SMR. 30 RORLA(01
-. 3.0-
- .0-
Li
-A AAA A-3.0-
- 4
U')
o -2.0Lii
-4.0
0.0 25.0 !50.0 7A.0 106.0 125.0 45.0 1;5.0 XO.O 225.0 250.0 2A.0TIME HRS)
Figure 8. Tidal elevation comparisons in Outer Bolsa Bay,
POSTBOLH1 - existing condition, LAKEH1 - 350-ft entrance channel,
LAK.EH2 - 200-ft entrance channel, LAKEH3 - entrance channel closed
16

ELEVATION COMPAR I SONS.0- - TA. 31 MO0M P OoIl
STA~. 31 rROM UWEoIiSTA. 31 rROM LAKD42
_. STR. 31 R LAK'l 34.0
2.0-
1.0
Li
L. 0..0 - lcr_
w -2.0-
-4.0-
-5.0 o . o
0.0 2i.0 50.0 7i.0 106.0 125.0 150.0 1A.0 2 .0 Z.O 250.0 275.0TIME (HRS)
Figure 9. Tidal elevation comparisons in Outer Bolsa Bay,POSTBOLHI - existing condition, LAKEHl - 350-ft entrance channel,
LAKEH2 - 200-ft entrance channel, LAKEH3 - entrance channel closed
ELEVATION COMPARISON5.0 - -_ 5T . 32 roR POSTM -OI4
. S"T. 32 F1roM Lfl01I. S-TF. 32 rR0 I1LfD2
4.0- ST1. 32 FRM LODC
- 3.0-
S 2.0-,
-J
U,
-1 0.0- - A.
1.0.Li
-2.0-
S-2.0'
-5.0.0.0 25.0 50.0 7A.0 100.0 1A.0 15.0 1A.0 O).O 25.0 250.0 2iS.0
TIME (M1S)
Figure 10. Tidal elevation comparisons in Outer Bolsa Bay,POSTBOLH1 - existing condition, LAKEH1 - 350-ft entrance channel,
IAKEH2 - 200-ft entrance channel, LAKEIH3 - entrance channel closed
17

ELEVATION COMPARISON5.0 _ STA. 3 rR POSTUOLMI
-.. STM. 33 FROM LAISTA. IS rRGM U9KO12
4.0 STIR. 33 FROM LIFID43
3.0-
2.0-
1.0-L.
-j
LjC.:
Ln /I-
c -3.0
-5" .
0. -.. 0- 1A.0 200.0 2A.0 25.0 .0
Figure 11. Tidal elevation comparisons in entrance channel to marina,POSTBOLH existing condition, LAKEH I 350-ft entrance channel,
LAKEH2 -200-ft entrance channel, LAKEH3 -entrance channel closed
ELEVATION COMPAR ISON
5--.o- - m.J rmkoio~
SMT. 4S FROM LftCDOII5S . 4S FROM LAC I"
1. - STA. 4S MOMh LAKEM2
3.0-
- .0 , ,
STIME (HS]
Figure 2. Tidal elevation comparisons in nnrner hnnl Bo arinaPOSTBOLHI - existing condition, LAKEH1 - 350-ft entrance channel,
AKEH2 - 200-ft entrance channel, LAKEH3 - entrance channel closed
18R
..... .2 4 Rm .AD
:CI- ..
a..
0. . 5..,0.0.... 5. 150 30. . 0. 7.
TIM (RSFiue"2 idleevto copaisnsi Ine oaBy
PO,"BOLo1 - existn codtin LAKEv 350-ft enrac chanelLAE2-20f nrnc hneL.E3-enrnecanlcoe
o18

ELEVATION COMPARISON5.0- _ S". 50 M POST&OLMI
..... ST. 50 FROM LVM41STh. 50 FR0f LRCDI2
i.0 - 5TA. 50 .R Lr.DI3
3.0-
¢U')-
- 2.0-E-
L.-j.,_A A A A A .AAwo.o__ V V a A A A AA~ a" Vv ¥v 'V wv Vv V V V V VvU
Li
w. -2.0-
C--
X -3.0-
-4.0-
-5 .0
0.0 25 .0 50.0 75.0 100.0 125.0 150.0 175.0 200.0 225.0 250.0 275.0TIME HRSI
Figure 13. Tidal elevation comparisons in Inner Bolsa Bay,POSTBOLH1 - existing condition, LAKEHI - 350-ft entrance channel,LAKEH2 - 200-ft entrance channel, LAKEH3 - entrance channel closed
ELEVATION COMPARISON5.0- - 5T. 54 FRh1q POUI I
S..M. 54 rnm rt. uDilST. 54 rRnR04"2
4.0- -_. Sm . 54 rI1 LU O43
3.0--J
- 2.0-- I
1.19
I-
-5.0"
0.0 o 2 .0 50.0 71.0 ,i.0 ,25.0 ,.o ,71.0 ,o.o m.o .o P1.0TIME (HRS3
Figure 14. Tidal elevation comparisons in DFG muted tidal cell,POSThOLM1 - existing condition, IAKEHi - 350-ft entrance channel,L.AKEH2 - 200-ft entrance channel, LAKEH3 - entrance channel closed
19

ELEVATION COMPARISON5.0 - S'TA. 77 rROei LAIVI
.*. STR. 77 rR9 UUMD1STR. 77 rROM LAKEOO
4.0-
- 3.0-
2.
1 .0-
Li
LjL)
C-,
x -2.0-
S-3.0-
-4.0-
-5.0-0.0 2i.0 50.0 75.0 100.0 125.0 150.0 17S.0 200.0 2M5.0 250.0 M7.0
T IME (HRS IFigure 15. Tidal elevation comparisons in proposed marina,
LA.KEH1 350-ft entrance channel, LA.KEH2 - 200-ft entrance channel,LA.KEH3 - entrance channel closed
ELE VAT ION COMPAR ISON5.0 - S". 90 F~IR Lfmi1
SS"f. 90 7w2NLMDQSTR. 90 MR LRCO
3.0-
-J0
-j 2.0-
- 1.0-Li
-3.0
L-1.0-
-5.0-
0.0 25.0 50.0 A. 0 ldD.0 ja.0 1j).0 1A.0 200.0 2I'.0 250.0 275.0TIME (HRS)
Figure 16. Tidal elevation comparisons in proposed marina,LAKEH1 - 350-ft entrance channel, LAKEH2 - 200-ft entrance channel,
LAKEH3 - entrance channel closed
20

ELEVATION COMPARISON- 5T. 97 RWI LAKD1I
STR. 97 r'ROi LFKD25TA. 97 FROi LxV3
4.01
3.0-J
- 2.0
-AL3 0.0
L)L-L. -1.0
LO
c -2.0Li
' -3.0-
-4.0-
-5.0
0.0 ;.o SO.0 7.0 a i.o 1... ,50.o i7.o 2C.o 25.0 a .0 27a5.TIME (HRSI
Figure 17. Tidal elevation comparisons in proposed full tidal wetlands,
LAKEHI - 350-ft entrance channel, LAKEH2 - 200-ft entrance channel,
LAKEH3 - entrance channel closed
ELEVATION COMPAR ISONS.0 S MTr. 112 F" LAM1
SM. .", 112 IlR LAD4........................... ......... 5Th'. I12 F50h1LISTm. 112 rROII LMCO
4.0"
3.0"
A- 2.0-
-1.0.
Li
- 0.0-
a: -2.0-U-
-3.0-
-4.0-
-5.0*0.0 25.o 50.0 75.0 i~b.0 in'.o 150.0 i75.0 x6.0 mi.c ;.o 275.0
TIME MHRS)Figure 18. Tidal elevation comparisons in proposed full tidal wetlands,
LAKEHI - 350-ft entrance channel, tAKCEH2 - 200-ft entrance channel,LAKEH3 - entrance channel closed
21

ELEVATION COMPARISONS.....- 1ST . 113 FROM LftUfl}'I5.0 STS. 113 FROM Lt(42
STR. 113 FROM tl E3
3.0-
3.0-
Ux- V.0-
c-
Ln
-I .0-L.Jl-
U
-K -3.0-
-4.0-
-5.0 o . o .0.0 3.0 5 ,0.0 75.0 100.0 13.0 156.0 175.0 200.0 2Z.0 250.0 vA.0
TIME HRSIFigure 19. Tidal elevation comparisons in proposed full tidal wetlands,
LAKEHIl - 350-ft entrance channel, LAKEH2 - 200-ft entrance channel,LAKEH3 - entrance channel closed
ELEVATION COMPARISON5.0- - 5Th. M 17 FRM LflDil
..... .. Al. 117 FROM LAK042." . 117 FMOM L.KR(
4.0-
3.0--1U,r"- 2.0-I-
4.0
-J .0-
I-
0.0 2i.0 50.0 7i.0 106.0 1A.0 150.0 1A.0 300.0 23.0 NO0.0 '275.0
TIME MRfiS)Figure 20. Tidal elevation comparisons in proposed muted tidal wetlands,
LAKEH1 - 350-ft entrance channel, LAKEH2 - 200-ft entrance channel,LAKEH3 - entrance channel closed
22

ELEVATION COMPARISON5.0- - ST1. 123 FRM IAE01
..... STA. 123 rR0N ULIWSTA. 123 R0M LfXDOG
.0-
3.0-
- 2.0-.-
3, -.0W
Li
L)caL- -3.0C,)
S-2.0-CC
S-3.0-
-4.0
-5.0 ,0.0 25.0 50.0 A5.0 I00.0 125.0 350.0 375.0 .0 Z.0 250.0 275.0
TIME MHRS)Figure 21. Tidal elevation comparisons in proposed muted tidal wetlands,
LAKEHI - 350-ft entrance channel, LAKEH2 - 200-ft entrance channel,LAKEH3 - entrance channel closed
ELEVATION COMPAR ISON5.0- - S . 129 FROM LWll I
..... ST. 129 FR N I.KD12..... M5t. 129 FROM' LFKCf3
3.0--
- 2.0-,
-i AAAAAAA AA. A AL- 0.0
Li V V v VV V v V vV V Vv vv V- k
-2 °.0-
L.J
-,-
-3.0-
S-2.0.
Figure 22. Tidal elevation comparisons in proposed muted tidal wetlands,LAKEHI - 350-it entrance channel, LAKEH2 - 200-it entrance channel,
LAKEH3 - entrance channel closed
23

ELEVATION COMPARISON5.01 -_ ST. 132 FRO' LKEli
--- STAI. 132 MONu LPKOI2S5TR. 132 FUOMi Lft(013
4.0
3.0"
-JU~o
-2.0-
3.0-
Li-j
L- 0.0-Li
cc. -2.0-U
I-.
S-3.0)
0.0 3.0 50.0 5.0 10.0 12.0 156.0 1A.0 M0.0 M.o 20.0 35.0TIME HRS)
Figure 23. Tidal elevation comparisons in proposed muted tidal wetlands,LAKEHI - 350-ft entrance channel, LAKEH2 - 200-ft entrance channel,
LAKEH3 - entrance channel closed
Outer Bolsa Bay
14. High tide elevations in Outer Bolsa Bay rise to the same level
regardless of whether a Lake Plan entrance is installed. Outer Bolsa Bay has
the ability to fill from Huntington Harbour, or it can fill from the proposed
new Lake Plan ocean entrance channel at Bolsa Chica. Low water elevations in
Outer Bolsa Bay, especially at large tide range, depend on the characteristics
of the connection channel to a new ocean connection at Bolsa Chica. For
existing conditions, where all flow to the existing wetlands passes through
Outer Bolsa Bay, the hydrography and boundary friction characteristics prevent
low tide elevations from falling as far as low tide elevations in Huntington
Harbour. Outer Bolsa Bay will remain in its present condition for all Lake
Plan alternatives. The proposed new Lake Plan non-navigable ocean entrance
channel at Bolsa Chica will convey a large portion of the tidal prism of the
enhanced wetlands. The nearness of the proposed non-navigable entrance to
24

Outer Bolsa Bay will permit the low water elevations in Outer Bolsa Bay for
Lake 1 and Lake 2 to fall lower than for the existing conditions (Figures 7
through 11, and Table 1).
15. If the proposed non-navigable Lake Plan entrance channel at Bolsa
Chica closes, all the wetland tidal prism is required to traverse through
Outer Bolsa Bay. This condition is analogous to the existing condition with
the exception that the volume of flow is exceedingly greater with the
installation of the proposed new tidal wetlands at Bolsa Chica. Hence, the
low water tidal elevation is retained at a much higher level for the Lake 3
concept than for either Lake 1 or Lake 2 alternatives, or existing conditions.
Inner Bolsa Bay
16. Under existing conditions, water surface elevations in Inner Bolsa
Bay rise to about 1.04 ft msl, and fall to about -0.40 ft msl (maximum tidal
range - 1.5 ft). For either Lake I or Lake 2 alternatives with the wetlands
not connected by a breach in the dike at Link 162, water surface elevations in
Inner Bolsa Bay rise about 0.15 ft higher than existing conditions, and fall
about 0.15 ft lower than existing conditons due to the much greater hydraulic
efficiency of the approach channel to the culvert system. Hence, the Lake I
and Lake 2 alternatives cause an increase in tidal range of about 0.3 ft
(maximum tidal range - 1.8 ft), or about a 20 percent increase in tidal range
in Inner Bolsa Bay (Figures 12 and 13, and Table 1).
DFG muted tidal cell
17. The Lake 1 and Lake 2 alternatives provide for about a 0.1 ft
increase in high tide elevation in the DFG muted tidal cell (from about
1.0 ft msl to about 1.1 ft msl), and about a 0.05 ft decrease in low tide
elevation (from about -0.09 ft msl to about -0.14 ft msl). There results
about a 0.1 ft increase in maximum tidal range when the wetlands are not
connected (from about 1.1 ft to about 1.2 ft), which corresponds to about a
9 percent increase in maximum tidal range (Figure 14, and Table I).
Proposed marina
18. The water surface elevations in the proposed Lake Plan marina
respond almost precisely as the elevations in Outer Bolsa Bay. Maximum high
tide elevations are essentially the same for all Lake Plan alternatives.
Maximum low water elevations are retained at a much higher level for Lake 3
which considers that the entrance channel is closed, falling to about
25

-1.5 ft msl, whereas Lake 1 and Lake 2 maximum low water e vations fall to
about -3.5 ft msl (Figures 15 and 16).
Proposed full tidal wetlands
19. The proposed new full tidal wetlands do not exist under present
conditions; hence, only a comparison of the effects of the Lake Plan alterna-
tives on water surface elevations in this region is available. Maximum high
tide elevation approaches 3.45 ft msl while maximum low tide elevation falls
to about -1.4 ft msl, for both Lake 1 and Lake 2 alternatives. This results
in about a 4.9 ft maximum tidal range. Lake 3 maximum high tide elevation
approaches only about 3.3 ft msl, and maximum low tide elevation fall to only
about -1.1 ft msl (Figures 17 through 19). The resulting maximum tidal range
is about 4.4 ft for the condition which would exist if the proposed Lake Plan
ocean entrance channel at Bolsa Chica is permitted to close by littoral
material in the surf zone.
Proposed muted tidal wetlands
20. The proposed muted tidal wetlands also do not exist under present
conditions. Because of the muting afforded by the second culvert system, the
water surface elevations in these regions are more nearly the same for allLake Plan alternatives than in the other full tidal wetland regions. Maximum
water surface elevations rise to about 1.50 ft msl for Lake 1 and Lake 2, and
rise to about 1.45 ft msl for Lake 3. Maximum low water surface elevations
fall to about -0.55 ft msl for Lake 1 and Lake 2, and fall to about
-0.45 ft msl for Lake 3. There results a maximum tidal range of about 2.1 ft
for Lake I and Lake 2, and about 1.9 ft for Lake 3 (due to potential closure
of the proposed ocean entrance channel at Bolsa Chica), for the situation
where the wetlands are not connected (Figures 20 through 23, and Table 1).
Average Channel Velocities
21. Results of velocity simulations throughout the Bolsa Bay complex
are presented for existing conditions, Lake i, Lake 2, and Lake 3 in
Appendix B, Appendix D, Appendix F, and Appendix H, respectively. Maximum
average channel velocities are shown in Table 2 for specific links throughout
the Huntington Harbour, Outer Bolsa Bay, and the proposed Lake Plan marina
complex. Comparisons of the effects of these plans with existing conditions
26

for typically representative average channel velocities are presented in
Figures 24 through 46 (Huntington Harbour), Figure 47 (Warner Avenue bridge),
Figures 48 through 51 (Outer Bolsa Bay), Figures 52 and 53 (proposed Lake Plan
marina channel), and Figure 54 (ocean entrance channel at Bolsa Chica),
respectively.
27

Table 2
Comparison of Existing Conditionswith
Alternative Lake Plan Concepts
Maximum Average Channel Velocities (ft per sec)
Location Link POSTBOL Lake 1 Lake 2 Lake 3
Pacific Coast Highway bridge 2 2.78 2.50 2.74 3.24
Huntington Harbour 5 1.42 1.28 1.40 1.80Huntington Harbour 7 1.48 1.31 1.44 1.91Huntington Harbour 8 0.29 0.25 0.28 0.35Huntington Harbour 9 0.54 0.49 0.53 0.69Huntington Harbour 10 0.71 0.63 0.70 0.96Huntington Harbour 11 0.53 0.47 0.52 0.68Huntington Harbour 12 0.50 0.42 0.48 0.67Huntington Harbour 13 0.28 0.22 0.26 0.41Huntington Harbour 15 0.27 0.23 0.26 0.36Huntington Harbou_ 16 0.39 0.35 0.38 0.48Huntington Harbour 17 0.66 0.57 0.64 0.91Huntington Harbour 18 0.34 0.27 0.32 0.55Huntington Harbour 20 0.52 0.45 0.50 0.69Huntington Harbour 21 0.14 0.11 0.13 0.21Huntington Harbour 23 0.32 0.27 0.30 0.41Huntington Harbour 24 0.57 0.46 0.55 0.87Huntington Harbour 25 0.30 0.21 0.28 0.54Huntington Harbour 26 0.34 0.24 0.32 0.68Huntington Harbour 27 0.16 0.17 0.16 0.29Huntington Harbour 29 0.11 0.07 0.09 0.42Huntington Harbour 31 0.16 0.11 0.15 0.23Huntington Harbour 32 0.30 0.22 0.28 0.52Huntington Harbour 33 0.19 0.19 0.19 0.21
Warner Avenue bridge 34 1.65 0.93 1.60 4.80
Outer Bolsa Bay 35 1.35 0.70 1.04 1.73Outer Bolsa Bay 36 0.71 0.40 0.65 1.32Outer Bolsa Bay 37 0.88 0.53 0.50 1.29Outer Bolsa Bay 38 1.12 0.67 0.50 1.32
Proposed marina channel 85 0.67 0.63 0.51Proposed marina channel 95 ---- 0.23 0.22 0.18
Ocean entrance channel 109 ---- 2.40 3.34
POSTBOL - existing conditionsLake I - 350-ft wide entrance channelLake 2 - 200-ft wide entrance channelLake 3 - entrance channel closed
28

VELOCITY COMPARISON2.0- STR. 5 FROM POST"BCLV
. ST. 5 FR LFt.CV1ST. 5 FROM LMEV2
- ST. S FROM Lft(M
.5
1.0-
-2.0
.o 2 .O O. 7j.0 10.0 1; ..0 150.0 175.0 20 0.0 ZiS. 0 250. 2A'
I-0.0 0.0
TIME (HRS)
Figure 24. Average channel velocities in Huntington Harbour,POSTBOLVI - existing condition, LAKEVI - 350-ft entrance channel,LAKEV2 - 200-ft entrance channel, LAKEV3 - entrance channel closed
VELOCITY COMPAR I SON2.0- S T . 7 FR l POST rBM.V l
. S"T. 7 FROM LMEVISI . 7 FROM LF KMV2
-. 5T. 7 FROM LKCCV31.5-
" 0.0 "
A !
0." I i ~>-
-2.00.0 25.0 50.0 7S.0 100.0 1;j.0 150.0 1A.0 200.0 Z15.0 250.0 275.0
TIME (HRS IFigure 25. Average channel velocities in Huntington Harbour,
POSTBOLVI - existing condition, LAKEV1 - 350-ft entrance channel,LAKEV2 - 200-ft entrance channel, LAKEV3 - entrance channel closed
29

VELOCITY COMPAR ISON1.5 - SIN. FR0N PDSTBMVI
..... STfl a FROM iKEVI. SIR. 8 RO LJCV2-. STR. 8 rROM LAEV
1.0
0.5
0.0
Li
-2 .0
-!1.5 oI . .o o 1. I o ,. o o ,,o o 2.0.0 25.0 50.0 7A.0 100.0 1A.0 250.0 275.0 200.0 225.0 250.0 275.0
TIME (HRSIFigure 26. Average channel velocities in Huntington Harbour,
POSTBOLV1 - existing condition, LAKEVI - 350-ft entrance channel,LAKEV2 - 200-ft entrance channel, LAKEV3 - entrance channel closed
VELOCITY COMPARISON1.5 -_ STR. 9 fR0m POSThOLVI
. TA. 9 FROM LAM I. STR. 9 ROi LAtKEV2. STR. 9 FR0hM UWEV3
1.0"
_I V
,-0.
I .
0.0 2i.0 50.0 71.0 20.o 5.0 I50.0 27S.0 200.0 2s.O 250.0 A.0
T IIME (HRSI
Figure 27. Average channel velocities in Huntington Harbour,POSTBOLV1 - existing condition, LAKEV1 - 350-ft entrance channel,LAKEV2 - 200-ft entrance channel, LAKEV3 - entrance channel closed
30

VELOCITY COMPRRISON- STR. 10 FROM POSTU.VI
.. SIR. 10 rROl LKEVISTR. 10 rROn UL9EV2STR. 10 FROM LAKEV3
1.0
0.5-
0.0 4
C IIJ i jJJ~
-0.5
-1.0-
-1.5 I
'0.0 25.0 5;.0 75.0 100.0 1 .O 150.0 17.0 200.0 22S.0 250.0 275.0
TIME (HRS)
Figure 28. Average channel velocities in Huntington Harbour,POSTBOLVI - existing condition, LAKEV1 - 350-ft entrance channel,LAKEV2 - 200-ft entrance channel, LAKEV3 - entrance channel closed
VELOC I TY COMPAR I SONI .S - SMR. I1 1031 PS"MVI
... S11. I I rltIM LAKELV I. STR. II ROM LAKC 2
-. SIR. II FROI L ElV3
1.0
0.5-
C-,
0-J
I ,
TI ME (HRSI
Figure 29. Average channel velocities in Huntington Harbour,POSTBOLVI - existing condition, LAKEV1 - 350-ft entrance channel,
LAKEV2 - 200-ft entrance channel, I.AKEV3 - entrance channel closed
31

VELOCITY COMPARISON1.S -_ 5 . 12 FROM POsTrOLVI
..... 5TS. 12 FRWfl L..KEVISTIR. 12 FROM LF(EV2
. Th. 12 FROM LKCV3
1.0-
0.5-
L.
0 .0-
Li I'll i i yliyvIVV-0.5-
-I .5 I~ . . . I@. ,I. ,IoI . . , o 2 .i0.0 25. 0 50.0 7S'.0 1063.0 1A.0 150.0 1A.0 200.0 225.0 250.0 275.0
TIME (HRS)
Figure 30. Average channel velocities in Huntington Harbour,
POSTBOLVI - existing condition, LAKEVI - 350-ft entrance channel,
LAKEV2 - 200-ft entrance channel, LAKEV3 - entrance channel closed
VELOCITY COMPAR I SON1.5- -_ 5ThI. 13 FROM POSThO VI
..... STR. 13 FROM LAC.......... T . 13 RW LFEY2
T. 51. 13 FROM LFtKrv3
1.0-
a-S
0.5
-.J .
CL
0.0 2A.0 50.0 75.0 i.o 1.o 45.0 1'.0 a.0 2A.0 250.0 2n.0TI ME (MRSI
Figure 31. Average channel velocities in Huntington Harbour,
POSTBOLVI - existing condition, LAKEVI - 350-ft entrance channel,
LAKEV2 - 200-ft entrance channel, LAKEV3 - entrance channel closed
32

VELOCITY COMPARISON. ST. 15 rRM MP0TBMVI.... M. IS ROM L KEVI
S.rM. IS rROM LAEV2- ST. 15 rROM LAKEV3
1.0
0.5o_
-0.5
-0.0-
-1.5
0.0 25.0 50.0 7S.0 100.0 125.0 150.0 175.0 20.0 22S.0 250.0 27S.0TIME (HRSI
Figure 32. Average channel velocities in Huntington Harbour,
POSTBOLV1 - existing condition, LAKEV1 - 350-ft entrance channel,
LAKEV2 - 200-ft entrance channel, LAKEV3 - entrance channel closed
VELOCITY COMP19RISON1.5- -_ 5STA. 16 FRWn POSTIUXV1
..... STh. 16 FROM L.EVI
.......... STA. 16 F'ROM LAKC 2SSm. 16 FROMLAKEV3
0.0
0.5
(1.
>" 0.0
._
-0.5-
-1.0
'.1.5 o I -I . . io io ,~ ,Io o = . . .0.0 25.0 50.0 7A.0 106.0 13.0 150.0 ;.0 206.0 23.0 250.0 27.0
T I ME (HRSi
Figure 33. Average channel velocities in Huntington Harbour,POSTBOLV. - existing condition, LAKEV1 - 350-ft entrance channel,LAKEV2 - 200-ft entrance channel, LAKEV3 - entrance channel closed
33

VELOCITY COMPARISON1.5- - SIR. 17 rRW POSTMVl
..... SIR. 17 FROM LW VI.. SIR. 17 FROM I(E2. SIR. 17 FROM IRKEY3
0.5
0.0-0O.S
-1.0
0.0 25. 0 50.0 75.0 i00.0 125. i50.0 175.0 2 .o 225. 250.0 275.0TIME CHRSI
Figure 34. Average channel velocities in Huntington Harbour,POSTBOLV1 - existing condition, LAKEVI - 350-ft entrance channel,LAKEV2 - 200-ft entrance channel, LAKEV3 - entrance channel closed
VELOCITY COMPARISON1.S - - STR. 18 PROM POSTMLVI
..... SIR, 18 FROM LAREVt.......... S"rR. 10 FrROMt t CC2S SIR. 18 FROM (lFY
1.0
0.5- A A(n
i 0.0
-A.5 -
TlE (HRSIFigure 35. Average channel velocities in Huntington Harbour,
POSTEOLVI - existing condition, LAIKEVi - 350-ft entrance channel,LAKEV2 - 200-ft entrance channel, LAK.EV3 - entrance channel closed
34,

VELOCITY COMPARISON1.5 - STA. 20 frROh POSTIQ.VI
STA. 20 MM0i LMV2- STA. 20 MM~e LflCV
0.0
L.
-0.05
-2.
0.0 2i.0 50.0 A5.0 100.0 12A.0 25.0 175.0 200. 0 23s.0 250.0 27.0TIME (HR5J
Figure 36. Average channel velocities in Huntington Harbour,POSTBOLV1 - existing condition, LAKEVI - 350-ft entrance channel,LA.KEV2 -200-ft entrance channel, LA M 3 - entrance channel closed
VELOCITY COMPAR ISON- STA. 21 tF"I POSThM.V1
2.5 STA. 21 FROMl LACV ISTR. 21 rROM IACE2
-. STA. 21 rRWI LFtCEY3
2.0-
0.0-
-1.0-
0.0 25.0 50.0 75.0 200.0 12S.0 10.0 275.0 200.0 M.0 250.0 27n.0T IME MHRS I
Figure 37. Average channel velocities in Huntington Harbour,POSTBOLV1 - existing condition, LAKEV1 - 350-ft entrance channel,LAKEV2 - 200-ft entrance channel, LAKEV3 - entrance channel closed
35

VELOCITY COMPARISON1.5- - STIR. 23 Fn POSTBOMVI
. Sr. 23 nW:M LRCEVIST. 23 FROM LKEV2
- SIR. 23 FROMl LIKEY3
1.0
0.5
Cl)a_
0.0 ° ~~~~~~vy /v V v-jLi
-0.5
-I .0.
-1.5" I I
0.0 25.0 50.0 75.0 100.0 125.0 150.0 175.0 2 0.0 225.0 250.0 275.0TIME (HRS)
Figure 38. Average channel velocities in Huntington Harbour,
POSTBOLV1 - existing condition, LAKEV1 - 350-ft entrance channel,
LAKEV2 - 200-ft entrance channel, LAKEV3 - entrance channel closed
VELOCITY COMPAR I SON1.5 - 5TrS . 24 FROM POSTUO.LVi
. STh. 24 FROM LCEXV1.......... STR. 24 FROM Lf EV2
STR. 24 rR0U LI9EY3
1.0
C, l ) I I
- 0. -1
-0 .5"
0.0 2i.0 S0.0 A.0 1060 i5 .o ,i.o , 0 o.o o .0 2 .0TIME (HRSJ
Figure 39. Average channel velocities in Huntington Harbour,
POSTBOLVI - existing condition, LAKEV1 - 350-ft entrance channel,
LAKEV2 - 200-ft entrance channel, LAKEV3 - entrance channel closed
36

VELOCITY COMPARISON.5- - 5T. 25 FROM P05ThO L.V
..... STR. 25 -RM LlMVISIR. 25 RM LAD2
S5TR. 25 FROM LRKEV 3
0.0
AIM R) A,AE 020- n c L V - el
" I Yi CS-25 'J
-I .2 FOY LCV-
0.0 2j.0 56.0 A.o Io.o 12'.o , 1 .o 1A.0' 20.0 ,,S.o 2 .o 2A.o0T IME (HRS
Figure 40. Average channel velocities in Huntington Harbour,POSTBOLVI - existing condition, IAKEVI - 350-ft entrance channel,
LAKEV2 -200-ft entrance channel, LAKEV3 - entrance channel closed
VELOC ITY COMPARISO0N
.S- - SIR. 26 'Im M VI..... S"IR, 2s Ft" RO m i
.....SM. 26 nm LAKD2.SIR. 26 'ROM UK
> 0.0
-0.5
-1.0
-1.5 , ,
0.0 2S.0 50.0 75.0 100.. 125.0 150.0 1A.0 200.0 22.0 250.0 273.0
T IME (HRS)
Figure 41. Average channel velocities in Huntington Harbour,
POSTBOLVI - existing condition, LAKEV1 - 350-ft entrance channel,
LAKEV2 - 200-ft entrance channel, LAKEV3 - entrance channel closed
37
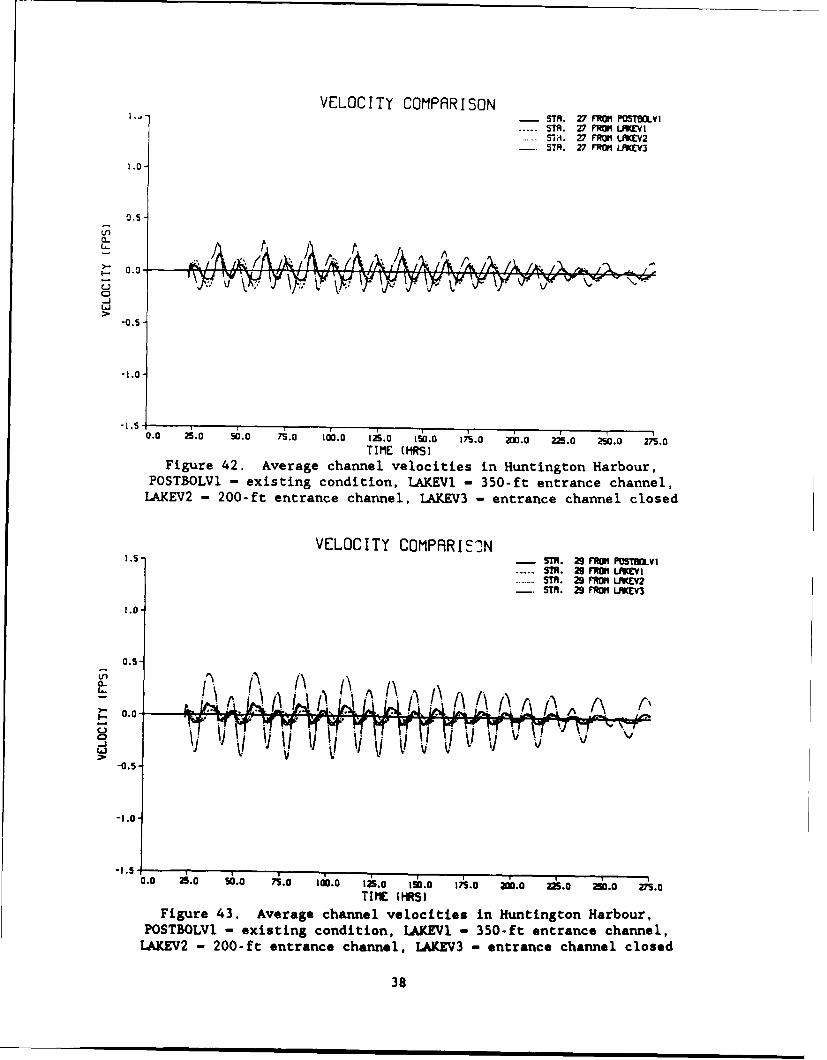
VELOCITY COMPARISONS- sTr. 27 MW0 PQST.V
..... STA. 27 FRO f VI... . 27 FROM FI.KEV2
- 5TR. 27 FROIM LN'(V3
0,5-
.0
l.
CL
-0.5
-1,.0
0.0 25.0 50.0 75.0 100.0 125.0 150.0 175.0 100.0 225.0 250.0 275.0TIME (MRS)
Figure 42. Average channel velocities in Huntington Harbour,POSTBOLVI - existing condition, LAKEVl - 350-ft entrance channel,LAKEV2 - 200-ft entrance channel, LAKEV3 - entrance channel closed
VELOCITY COMPARIEIN1 .5
-_ STh. 29 Mm P S'IOVi. 5. h. 29 "RO UrMI
M Sh. 29 PFI UV 2- T sF. 29 FROII LfEV3
1.0
-.S-
I VI 0 - V1! 'I 1V VI '
10.0 2i.0 506.0 75.j .0 0 125. 15600 . . 2 . ;0 .-I 5 ~o .o s o .o l~ l~o 17 5.0 100.0 -m.o 25.0 275.0
TI ME (HRSJFigure 43. Average channel velocities in Huntington Harbour,
POSTBOLVI - existing condition, LAKIEV - 350-ft entrance channel,LAKEV2 - 200-ft entrance channel, LAKEV3 - entrance channel closed
38

VELOCITY COMPARISON1.5- STA. 31 rRM POSTBtLYI
..... STA. 31 FROR LqlCCVISTR. 31 FRI LFCV2- STR. 31 FROM LI.KY3
1.0"
0.5-
Q-0-
-jj
0.0 25.0 50.0 75.0 100.0 125.0 150.0 17S.0 200.0 225.0 250.0 27S.0TIME {HRS]
Figure 44. Average channel velocities in Huntington Harbour,POSTBOLV1 - existing condition, LAKEVI - 350-ft entrance channel,LAKEV2 - 200-ft entrance channel, LAKEV3 - entrance channel closed
VELOCITY COMPARISON- S"R. 32 fRMM POSTM.V1
.... S". 32 FRIL 1CVI
...... STA. 32 MOM LKEv2STR. 32.FROMLEV3
1.0
0.5
- .0-
-0.5-
-2.0-
-1.5'0.0 35.0 50.0 71.0 100.0 125.0 190.0 1;5.0 206.0 225.0 250.0 2;5.0
TIME (HRS)
Figure 45. Average channel velocities in Huntington Harbour,
POSTBOLVI - existing condition, LAKEV1 - 350-ft entrance channel,
LAKEV2 - 200-ft entrance channel, LAKEV3 - entrance channel closed
39

VELOC I TY COMPAR I SONMSf. 33 i~m POS'Ol. V
1.5 .....S". i .L IS"lf. 3 rROM Lwv2s-. 33 ROM L.ACKi3
1.0
0.5-
CA A
J
-I .0
0.0 25.0 50.0 A.0 io.Q ls.0 )5. 7S.0 200.0 22.0 250.0 27S.0
TIME (MRS)
Figure 46. Average channel velocities in Huntington Harbour,
POSTBOLV1 - existing condition, IA i - 350-ft entrance channel,
LAKEV2 - 200-ft entrance channel, LAKEV3 - entrance channel closed
VELOC I TY COMPAR ISON- S". 34 I'M PSTX.I
"5'. 34 MR LWD I.N Y1
t. S .I. 34 F IM n IACV2
i.0 - I .i S". 34 FROM~ LAE3
2.0-
L .oI -0 I
-1.0 i ii tJ W-V.-j
- 5 0 p II' ' I 4 , 0
0.0 25.0 S.0 As.0 tO.0 IA.0 1,5.O i7s.0 .0 S.O 250.0 VS.0TIME IRS I
Figure 47. Average channel velocities under Warner Avenue bridge,
POSTBOLV1 - existing condition, LAEVi - 350-ft entrance channel,
LAEV2 - 200-ft entrance channel, LAV3 - entrance channel closed
40

VELOCITY COMPARISON2.0 S TA. 35 FIRO1 POST53.VI2.0- ... 518T. 35SFROM LAKEVI
STA. 35 FROMl u'EV2518. 35 FROM1 LIWMV
1.5-
0.5 k' I IV I
I Ir
-0l. 0 2i.0 50S.0 75.0 100.0 12 5.0 150.0 17A.0 200.0 225.0 250.0 2;S.0T IME (HRS I
Figure 48. Average channel velocities in outer Bolsa Bay,POSTBOLV1 - existing condition, LAKEVl - 350-ft entrance channel,LAKEV2 -200-ft entrance channel, LA.KEV3 - entrance channel closed
VELOCITY COMPAR ISON- Th. 36 FROM1 POS1ULVI
-- STA. 36 FROM1 LA(EV2
S"57. 36 r8011L8K-
0.5-
0.5
0.0 25.0 S60 0 A730 100i.0 I A.0 150.0 1AD. 200.0 M2.0 a10.0 v.T IME (HIRS)
Figure 49. Average channel velocities in outer Bolsa Bay,POSTBOLV1 - existing condition, LAICEVI - 350-ft entrance channel,LAKEV2 - 200-ft entrance channel, LAKEV3 - entrance channel closed
41

VELOCITY COMPARISON1.5 STA. 3V FRMI POSMt0VI
... TA. 37 MM LtCEVIASTR. 37 r"I LFWEV2
~ p -. TA. 37 FrOI LftEV3
All 1I~ht~t~iiH V I-j ii
TIME CHRS)Figure 50. Average channel velocities in Outer Bolsa Bay,
POSTBOLV1 - existing condition, LAKEVI - 350-ft entrance channel,LAKEV2 - 200-ft entrance channel, LAKEV3 - entrance channel closed
VELOCITY COMPARISON1.5 STA. 38 VFE1 POSTOv1
... STA. 38 FRM LcEVIA .STm. 36 FROM I?4TCv2
II~ II4i .I if~
UU
0.0 2i.0 50.0 75.0 1iuo IAa- I W' 175.G 21i.0 2A.0 25a.0 A.0TIME (HIRS3
Figure 51. Average channel velocities in Outer Bolsa Bay,POSTEOLVI - existing condition, LAKEV1 - 350-ft entrance channel,LAICEV2 - 200-ft entrance channel, LAM3 - entrance channel closed
42

VELOCITY COMPARISON.5- __ ST. 85 FROMP liEV3
..... STA. e5 PMOM LR V2SM. S RoM LACEV3
1.0
0.5-
00
-0.5
o.o 25.0 50.0 5.0 ,®.o 1 5.0 ,50.0 375.0 0.0 2A.o 256.0 275.0TIME (HRSi
Figure 52. Average channel velocities in proposed marina,
LAKEVI - 350-ft entrance channel, LAKEV2 - 200-ft entrance channel,LAKEV3 - entrance channel closed
VELOCITY COMPARISONL.. STA. 95 fOM ULW I
5Si. 95 rOm" tCCVSM. 95 ROM LAV3
3.0-
0.5.
a-
_-I
-0.0 •
-I oo A o si o A o A x. ,i .o , o ,is.o a o 2 o 2i .o zh.oTIME (MRS I
Figure 53. Average channel velocities in proposed marina,
LAKEVL - 350-ft entrance channel, LAKEV2 - 200-ft entrance channel,LAKEV3 - entrance channel closed
43

VELOC I TY COMPAR ISONS 1". 109 rMO UWV!I
, A..,". . ..'. ..... S"1 109 IrR1O 1EV2
3.0-
2.05
0.0-
0 -0.5,
2o ": i! : !
-2.S
-3.0
-3.0
0.0 25.0 50.0 A5.0 20.0 125.0 150.0 175.0 20.0 225.0 250.0 275.0TIME HRS)
Figure 54. Average channel velocities in proposed entrance channel,LAKEl - 350-ft entrance channel, LAKE2 - 200-ft entrance channel,
LAKE3 - entrance channel closed
Pacific Coast Highway (PCH) bridge at Anaheim Bay
22. Concern exists regarding the effects of strong currents on naviga-
tion craft which at times have difficulty entering and exiting Anaheim Bay
at the Pacific Coast Highway bridge. Helical and spiral flow created by the
velocity field at the relatively sharp curves approaching the PCH bridge where
craft are required to maneuver tend to create a hazardous situation. The
National Marine Fisheries Service also is concerned about such flow field
effects on potential bank erosion of the wetlands at Seal Beach. Potential
increases in velocity under the PCH bridge due to any increase in tidal prism
for nourishing wetland areas at Bolsa Chica are of significant concern to
navigation.
23. The existing maximum average channel velocity simulated through
this PCH bridge opening is 2.78 ft per sec. Lake 1 alternative indicates the
maximum average channel velocity at this location will be 2.50 ft per sec.
This implies that the 350-ft wide entrance channel with a bottom elevation of
44

-6 ft msl is capable of supporting the proposed wetland enhancement areas at
Bolsa Chica, and also conveys a small portion of that tidal prism to Bolsa
Chica all of which otherwise would be required to enter by way of the PCH
bridge at Anaheim Bay. Lake 2 alternative (200-ft wide entrance channel)
simulations result in a velocity of 2.74 ft per sec under the PCH bridge at
Anaheim Bay, effectively the same as existing conditions. Hence, the Lake 2
entrance channel at Bolsa Chica provides enough tidal prism to support the
enhanced wetland areas at Bolsa Chica. If the Lake Plan alternative entrance
channel at Bolsa Chica is permitted to close, the entire tidal prism must be
conveyed by the opening under the PCH bridge at Anaheim Bay. The Lake 3
simulation (proposed entrance channel at Bolsa Chica closed) indicates the
maximum average channel velocity at the PCH bridge at Anaheim Bay will
increase to 3.24 ft per sec, an increase of 17 percent over present
conditions.
Huntington Harbour
24. Average channel velocities in Huntington Harbour resulting from the
Lake Plan alternatives are directly related to existing velocities in approx-
imately the same manner as average channel velocities under the PCH bridge at
Anaheim Bay. In general, Lake I slightly reduces Huntington Harbour veloci-
ties while Lake 2 induces about the same magnitude as existing conditions.
Average channel velocities resulting from the Lake 3 alternative approach
2.0 ft per sec in the western section of Huntington Harbour under extreme
spring high tide conditions (tidal range on the order of 8 ft), and may thus
become hazardous for swimming and navigation (Figures 24 through 46, and
Table 2).
Warner Avenue bridge
25. Under the Lake Plan alternatives, Outer Bolsa Bay and Warner Avenue
bridge remain in their present conditions. Average channel velocities at the
Warner Avenue bridge decrease by about 44 percent for the Lake 1 alternative
(from about 1.65 to about 0.93 ft per sec), and remain approximately the same
as existing conditions for the Lake 2 alternative. If the proposed entrance
channel at Bolsa Chica is permitted to close, thereby requiring all tidal flow
to the Bolsa Chica wetlands to pass under Warner Avenue bridge, average
channel velocities will increase by about a factor of 3, from 1.65 to
4.80 ft per sec (190 percent increase). Bridge stabilization measures would
45

likely be necessary to prevent scour and erosion of the bridge abutments, and
channel bottoms beneath the bridge and into Huntington Harbour. (Figure 47,
and Table 2)
Outer Bolsa Bay
26. The enhanced wetland regions at Bolsa Chica for the Lake Plan
alternatives will fill and empty through the proposed new entrance channel to
the Pacific Ocean at Bolsa Chica. Hence, it will not be necessary for all the
wetland tidal prism to pass through Outer Bolsa Bay. Lake I and Lake 2
thereby results in lower average channel velocities in Outer Bolsa Bay than
for existing conditions. The Lake 3 alternative, however, indicates that
average channel velocities in Outer Bolsa Bay will increase a maximum from
1.35 to 1.73 ft per sec, with the average increase for Outer Bolsa Bay being
39 percent. Hence, scour of unconsolidated bay sediments may occur. Channel
stabilization measures in Outer Bolsa Bay may be necessary near the Warner
Avenue bridge to prevent shoal material from accumulating in Huntington
Harbour, and at the proposed marina channel at Bolsa Chica (Figures 48 through
51, and Table 2).
Proposed Lake Plan marina channel
27. Cross-sectional areas of the channels through the proposed marina
complex at Bolsa Chica are sufficiently large such that maximum spring tide
average channel velocities will remain small (up to 0.67 ft per sec)
(Figures 52 and 53, and Table 2). Swimmer and navigation hazards would not
ensue from such mild average velocities in the Lake Plan marina channel.
ProoOsed ocean entrance channel at Bolsa Chica
28. Average channel velocities in the non-navigable entrance to the
marina complex at Bolsa Chica exceed that sufficient for initiation of
movement of sandy particles, being 2.40 and 3.34 ft per sec for the Lake 1 and
Lake 2 concepts, respectively. Previously, Hughes (1988) considered the
potential of the Secondary Alternative (non-navigable entrance of 160-ft width
and 5-ft depth) at Bolsa Chica to close by littoral material transport in the
surf zone. In that concept, Warner Avenue bridge is relocated and the channel
in that vicinity is enlarged by a factor of 2.5; hence, no restriction at
Warner Avenue bridge exists for the Secondary Alternative concept. The
predominant volume of tidal prism of the tidal wetlands at Bolsa Chica passes
through the relocated Warner Avenue bridge, with the average channel
46

velocities in the entrance channel at Bolsa Chica approaching only about
1 35 ft per sec.
29. Hughes (1988) Loncluded that it is difficult to state whether the
proposed ocean entrance at Bolsa Chica will shoal to the point of closure
after reaching an equilibrium area compatible with observed prototype inlets
for a maximum average velocity of 1.35 ft per sec. He recommended that during
any final design phase, a numerical tidal circulation model be developed for
analyzing this particular condition. Such analysis is presently beyond the
scope of this investigation. However, the existing restrictions afforded by
Warner Avenue bridge will continue to exist under Lake Plan alternative
concepts, and the wetland tidal prism could be required to pass through the
proposed non-navigable entrance channel at Bolsa Chica. Average channel
velocities of either 2.4 ft per sec (Lake i) or 3.34 ft per sec (Lake 2) would
be sufficient to scour surf zone littoral material from the entrance channel
and maintain a non-navigable tidal exchange between the Pacific Ocean and the
proposed enhanced wetlands at Bolsa Chica. The initiation of motion for
quartz sediments depends directly on the grain size. Unconsolidated medium
sand in the surf zone with diameters up to 1.0 mm can be placed in motion by
velocities around 1.0 ft per sec. Finer size particles are affected by
cohesive forces, and can withstand much higher velocities without scouring.
Effect of Interior Wetlands Connection at Bolsa Chica
30. Existing Inner Bolsa Bay may or may not be connected to the
proposed muted tidal wetlands by an opening through the dike along Link 162
which would connect Node 50 (at the rear of Inner Bolsa Bay) with Node 134
(in the proposed muted tidal wetland region). The DYNTRAN simulations were
performed both with and without this wetland connection. It was determined
that any effects created by such connections within the wetlands would not
propagate through the culvert and tide gate system into the marinas and other
regions of Bolsa Chica. Effects resulting from changes within the wetlands
are confined to the wetlands. The effects of a wetland connection at Link 162
on water surface elevations are displayed in Figures 55 through 57 for Inner
Bolsa Bay (Nodes 37, 45, and 50), Figure 58 for the DFG muted tidal cell
(Node 54), Figures 59 through 61 for the proposed full tidal wetlands
47

(Nodes 97, 112, and 113), and Figures 62 through 65 for the proposed muted
tidal wetlands (Nodes 117, 123, 129, and 132), respectively.
31. If Inner Bolsa Bay is connected to the proposed muted tidal
wetlands by a breach in the dike which separates the two wetland regions, the
water surface elevation in Inner Bolsa Bay will rise about 0.15 ft higher than
if the two wetlands remain isolated from each other. This occurs because of
flow entering the proposed muted tidal wetlands through culvert systems with
twice the conveyance of the culvert system which would otherwise connect Inner
Bolsa Bay with the marina complex (Figures 55 through 57). The DFG muted
tidal cell also experiences about a 0.15 ft increase in high tide elevations
(Figure 58), as its high tide responds essentially as existing Inner Bolsa Bay
at high tide. The proposed full tidal wetlands are unaffected by the presence
or absence of a connection between Inner Bolsa Bay and the proposed muted
tidal wetlands (Figures 59 through 61). The proposed muted tidal wetlands
will experience about a 0.10 ft decrease in maximum water surface elevations
as this volume is permitted to flow into Inner Bolsa Bay through the highly
efficient breach in the dike system (Figures 62 through 65). The hydraulic
connections between the Pacific Ocean and the wetlands, the wetland design,
and the culvert system design and operation, can be optimized to provide any
reasonable degree (within maximum limits) of tidal muting, flooding, and
inundation to support marine life and vegetation varieties.
48

ELEVATION COMPARISONSIR. 37 ntom I.CDI5.0..... S . 37 FRM 10"
4.0
_ 3.0
4-,r- 2.0-
1.-L.
J 0.0-L" .o VV V V V v IVV V V v v VV V V VLJCC)
U,
a: -2.0LiJI-x -3.0
-4.0
-5.0 0. i0 5. - 0. A D 10I A0 260 2 . !- 7.-50o.o as.o so.a .o a .o ,ia.o ,i.o ,;s.o .o m .o o.o '.o
TI M MRS I
Figure 55. Effect of wetland connection on
water surface elevations in Inner Bolsa Bay,LAKEHI - wetlands not connected, LAKEH4 - wetlands connected
ELEVATION COMPARISONS.0- S". 45 PRM LFXD11
"ATr. 4S FRI LVU4
4.0-
3.0-
(nr- 2.0-
.0 - , , A A A A A A 'V" V V V V VNV VvvvvV V V V
,. -1 .0"r
w -3.o-
- .0o . 0 2i . 0 5j .0 .o ,i o 1 2 '. 0 ,1 2 .0 1 A .0 o x 2 .0 2 5 . 0 2 A .0T IlME MRS I
Figure 56. Effect of wetland connection on
water surface elevations in Inner Bolsa Bay,LAKEHI - wetlands not connected, LAKEH4 - wetlands connected
49

ELEVATION COMPARISON5.0- - s5 . 50 RO M LRCDID
... Sr. 50 FROM LfA1DI4
4.0-
3.0--J
2.0-
-.-
a-.,;- /, " ' A. '
W, o V V V" V V V V vVv V Vv VLiLi
-LaU,
r -2.0-Lii-.
x -3.0-
-4.0-
-5.0 oI . . . i o , . .. ,I~ I. . .0.0 25.0 50.0 75.0 100.0 125.0 156.0 175.0 2dO.0 225.0 250.0 275.0
TI ME MRS I
Figure 57. Effect of wetland connection on
water surface elevations in Inner Bolsa Bay,LAKEHI -wetlands not connected, LAKEH4 - wetlands connected
ELEVATION COMPARISON.0- - SI". S4 RM LRAOM
5"..... SI. 54 fROM LAK[D4
4.0-
- 3.0
- 2.0-I-.
S1.0
S0.0A A(.J
, -2.0.
-3.0-
-4.0-
-5.00.0 25.0 50.0 A5.0 1 .0 125.0 150.0 1A.0 X6.0 jd.0 A50.0 A.0
TIME MRSI
Figure 58. Effect of wetland connection on
water surface elevations in DFG muted tidal cell,
LAKEH1 - wetlands not connected, LAKEH4 - wetlands connected
5o

ELEVATION COMPARISON5.0- STr. 67 MM LIK014
SM. . 97 9IrLAW"
4.0"
3.0-
- 2.0
-1.0-
LiJ
-j
C.a:. -2.0-
S-2.0-
-4.0
-5.00.0 2i.0 56.0 A.0 100.0 325.0 156.0 1;5.0 2d.0 22.0 250.0 275.0
TIME MfRS)Figure 59. Effect of wetland connection on
water surface elevations in proposed full tidal wetlands,LAKEHI - wetlands not connected, LAKEH4 - wetlands connected
ELEIVAT I ON COMPAR ISON5.0- _ SM. 112 1rRO LfAtQli
..... ST. 112 rRO LAM
4.01
3.01
2.0-
-1.0
L, 0.0 -
--2.0"
z -3.0-
-4.0
-5.01 0.0 0 50.0 A.0 106.0 125.0 3I5.0 ,A.0 2.0.0 2i5.0 2.0 A7.0
TIME (HRSIFigure 60. Effect of wetland connection on
water surface elevations in proposed full tidal wetlands,LAKEH1 - wetlands not connected, LAWIE. - wetlands connected
51

5.0 ~~ELEVATION COMPARISON - 1 AI
3.0-
- 2.0-
0.0JLi
C.-3.0-
-4.01
-. 10.0 2i.0 50.0 75.0 100.0 1A.0 350.0 175.0 30.0 2A5.0 250.0 2A.0T IME (HRS)
Figure 61. Effect of wetland connection onwater surface elevations in proposed full tidal wetlands,
LAIKEHi wetlands not connected, LAK.MH4 - wetlands connected
ELEVATION COMPAR ISON5.0 - SM. 117 PUTl LAKCDI
.................................S. 117 FRO1 LAKOI
4.0-
-3.0-
-J
- 2.0-
1.-
L,
0.0 25. A5.0 750 000 250 900 30 000 . A 0 27.TIM 0.0--
-5.52
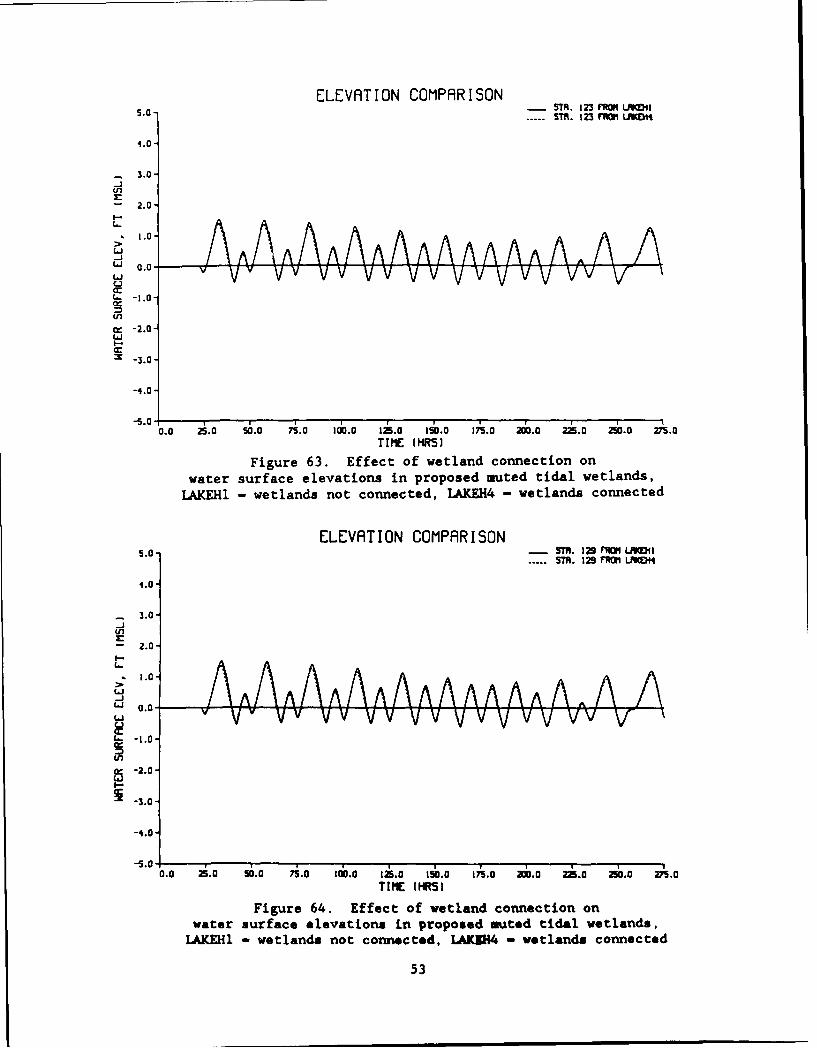
ELEVATION COMPARISON5.0 .... STR. I23 rRII t.flf Ii
1.0
3.0-
2.0-i-
1.0".1
-j
1-U
I-L. -1.0-
-4.0-
-5. 0 2i.0 50.0 7i.0 106.0 126.0 150.0 17.0 20.o 225.0 250.0 A.0
TIME (HRS)
Figure 63. Effect of wetland connection onwater surface elevations in proposed muted tidal wetlands,LAKEHI - wetlands not connected, LIEH4 - wetlands connected
ELEVATION COMPARISON5.0- STI. 129 r10 L9KDl
..... ST. 129 rRO M VD
1.0
3.0iJ
- 2.0
Li.-jo.,, ,, AA A A A AAA . AV" v v vv v v V V Vv-vvv -vv V
z -2.0-
Z-3.0-
-4.0-
-5.0 I
0.0 25.0 0.0 75.0 ,I.0 12.0 4.0 A . i.o 2A.o 25.0 275.0
TI ME (HRS I
Figure 64. Effect of wetland connection onwater surface elevations in proposed muted tidal wetlands,
LAKEHl - wetlands not connected, LAUH4 - wetlands connected
53

ELEVAT ION COMPAR I SON5.0- S ". 132 RM LftaI1
. ST. 132 FPR LMDIH4
1.0-
3.0-..J
,r-- 2.0-
1.. .0 -
-LI 0.0-A A A A AA AAWU l V vv vv v VV V vvvv vv V -a:
U- -2.0-U,
- -3.0-
-4.0-
0.0 2i.0 56.0 A.0 100.o ,4.0 150.0 1A5.0 20.o 22.o 250.o 2.o
TI I HRSI
Figure 65. Effect of wetland connection onwater surface elevations in proposed muted tidal wetlands,
LAKEH1 - wetlands not connected, LAKEH4 - wetlands connected
54

PART III: EAST GARDEN GROVE-VINTERSBURG FLOOD CONTROL CHANNEL(EGG-WFCC) 100-YEAR FLOOD FLOW
32. The hydrograph for the 100-year frequency of occurrence flood for
the EGG-WFCC watershed has been developed by Moffatt & Nichol, Engineers
(1986), based on hydrology guidance provided by the Orange County Flood
Control District (1986). The peak flow rate for the 100-year flood was
determined to be 9,710 cfs. This estimated 100-year peak flow rate is
23 percent higher than the 1977 estimate, and is the result of improved
hydraulic data presently utilized by the County of Orange. The lower reaches
of the existing earthen-lined WFCC can presently convey only approximately
65 percent of a 25-year storm. It is assumed that the channel will be
improved upstream of the Bolsa Chica project to a 100-year storm runoff
capacity.
Water Surface Elevations
33. Concern exists regarding the maximum flood flow elevations which
may be reached in Huntington Harbour, the proposed Lake Plan marina, and
wetlands by the 100-year flood, for both existing conditions and various
alternative proposed plans for wetland enhancement at Bolsa Chica. Levee
elevations with adequate freeboard will be established to preclude flood flow
overtopping. It is assumed that all culvert systems will function during a
100-year storm flood conditions in the same manner as during normal tidal
cycles; i.e., the culverts will not be closed to prevent flood flow from
entering either the existing or proposed wetlands.
34. Accordingly, the 100-year flood flow (9,710 cfs) was introduced
through flood control gates on the EGG-WFCC at the proposed Bolsa Chica-
Garfield Roadway location. The numerical model was operated for 3 days under
simultaneous spring tide and flood flow conditions. While the peak flow rate
will last only a few hours, the 3-day model simulation was performed to
observe maximum dynamic equilibrium elevations which would develop in the
wetlands. Maximum water surface elevations for existing conditions and
alternative Lake Plans are displayed in Figures 66 through 77 for representa-
tive locations throughout the Bolsa Chica system. Table 3 presents maximum
55

EGG-kJFCC FLOOD -9,710 CFS5.0- S TA. S rRn POSTUM
M9T. S rm" LMNcr-SM. S rn IUNMWH
4.0- A. . S MROM LMC)'
:3.0-(n
1 .0-
0 -. 0-
U
U E
-4.0-
-3.00.0 2i.0 56.0 A5.0 1w.0
TI ME MHRS)
Figure 66. Water surface elevations in Huntington Harbour,POSTBOL - existing condition, LAM~ - 350-ft entrance channel,
LAKE2 -200-ft entrance channel, LAXE3 - entrance channel closed
EGG-WFCC FLOO 9,710 CF'S5.0 5M. 25 FRM POSTBMHO~
-". 25 MOM ftVIl
4.0- a . m uRmLYm
.3.0.
-5.
0.5.0 Sko A5.0 1 .0TIME (MRS)
Figure 67. Water surface elevations in Huntington Harbour,POSTEOL - existing condition, LAM~ - 350-ft entrance channel,
LAKE2 - 200-ft entrance channel, LAKE3 - entrance channel closed
56

EGG-kJFCC FLOOD -9,710 CFS
2..0000.
0- V
........ ............... ,
-. 0
-20
-6.0-
-7.00.0 A.0 *. 1.m0.0
T IME MRSSI
Figure 6. Water surface elevations in Outer Bolsa Bay,POSTOL - existing condition, LAM~ - 350-ft entrance channel,
LAIE2- 200-ft entrance channel, LAKE3 - entrance channel closed
EG-WCCFLOO 9p57CF

EGG-NFCC FLOOD -9,710 CFS
I.TR *1
.... ... .... ... .... ... ..
Li %C.3 ... ...
L-
cc
LiI-
X -4.0-
-5.0-
-6.0-
-7.00.0 2i.0 50.0 7.0 100.0
T IME MHRS)
Figure 70. Water surface elevations in Outer Balsa Bay,POSTBOL - existing condition, LAME] - 350-ft entrance channel,
LAKE2 -200-ft entrance channel, LAKE3 - entrance channel closed
EGG-WFCC FLOOD -9,710 CFS
I-0
Li V..*V
3. 30 0l10.TIE(HJ
Figure..... 71... Wtr.ufaeelvtin.i..trBas.ByPOSBO .xsigcodt0,LACl-30-tetacecanl
LAE"-20f nrnecanl LIE nrnecanlcoe
c58

EGG-kJFCC FLOOD 9,710 CFS8.0 -- 5 3FM OML
6.0-
2.0
U
-6.a 750o-
T IME MHRS IFigure 72. Water surface elevations in Outer Balsa Bay,
POSTBOL - existing condition, LAM~ - 350-ft entrance channel,LAKE2 -200-ft entrance channel, LAKE3 - entrance channel closed
EGG-WFCC FLOOD 9,710 CFS
6.0-
3.0-
2.0-
...... ... ...
............ ....
-2.0-
S-3.0-
-4.0-
-5.0-
-6.0-
-7.00.0 3i.0 3.0 Ai.0 10.0
TIME (MRS)Figure 73. Water surface elevations in Inner Bolsa Bay,
POSTEOL - existing condition, LAKEl - 350-ft entrance channel,LAKE2 - 200-ft entrance channel, LAKE3 - entrance channel closed
59

EGG-WFCC FLOOD 9,710 CFS7.0- T.5 RMPSBX
6.0-".5FRMPOY
5.0-
=4.0-3.0
L. 2.0-
U
L -2.0-
(Z -2.0-
Li 30
x -4.0-
-6.0-
-7.00.0 2i.0 50.0 A3.0 100.0
TIMlE MRS)Figure 74. Water surface elevations in DFG muted tidal cell,POSTBOL - existing condition, LAKEl - 350-ft entrance channel,
LAKE2 -200-ft entrance channel, LAKE3 - entrance channel closed
EGG-WFCC FLOOD 9,710 CFS7.0-- STA. 98 FNO LN~FM l'
-~ *. --. . . SM.~ SSPNW! Lw-FM~............. * ~ ..- ~ -- 1T l ~ R0lt~6.0-
5.0-
-4.0-
3.0.
2.0 *.
-J
-2.0-
-3.0-
-4.0-
-S.0-
-6.0a
-7.00.0 3i.0 90.0 13. 2.0
TIME MHRS)
Figure 75. Water surface elevations in proposed marina,LAKE1 - 350-ft entrance channel, LAKE2 - 200-ft entrance channel,
LAKE3 - entrance channel closed
60

EFF-WFCC FLOOD - 9,710 CFS7.0 - STA. I 10 rROM LFEIN
... .. .... .. ....... - .* Slfl 310 .FROM IAKE7I........................ h ................. . . - . r "ITO F LR E -6 .0" ......... .......
5.0
4.0
r 3.0
S..................Li
C-)CE 1I.0-
E.
-2.0
z -4.0-
-5.0-
-6.0-
-7.00.0 25.0 50.0 Ax030.
TI ME MRS IFigure 76. Water surface elevations in proposed full tidal wetlands,
LAKE - 350-ft entrance channel, LAKE2 - 200-ft entrance channel,LAKE3 - entrance channel closed
EFF-WFCC FLOOD - 9,710 CF57.0- - S". 134 F LNM l
MR.....S. 134 rFI LAtCCI16.0- ..........
S.0-
4.0-
E 3.0-
1. . .... ................E-L) 0.0-
L)
-2.0-
-3.0-
-4.0-
-5.0-
4.0-
-7.0.0 .0 3.0 A.0300.0
TIME (IUSfFigure 77. Water surface elevations in proposed muted tidal wetlands,
LAKE1 - 350-ft entrance channel, LAKE2 - 200-ft entrance channel,LAKE3 - entrance channel closed
61
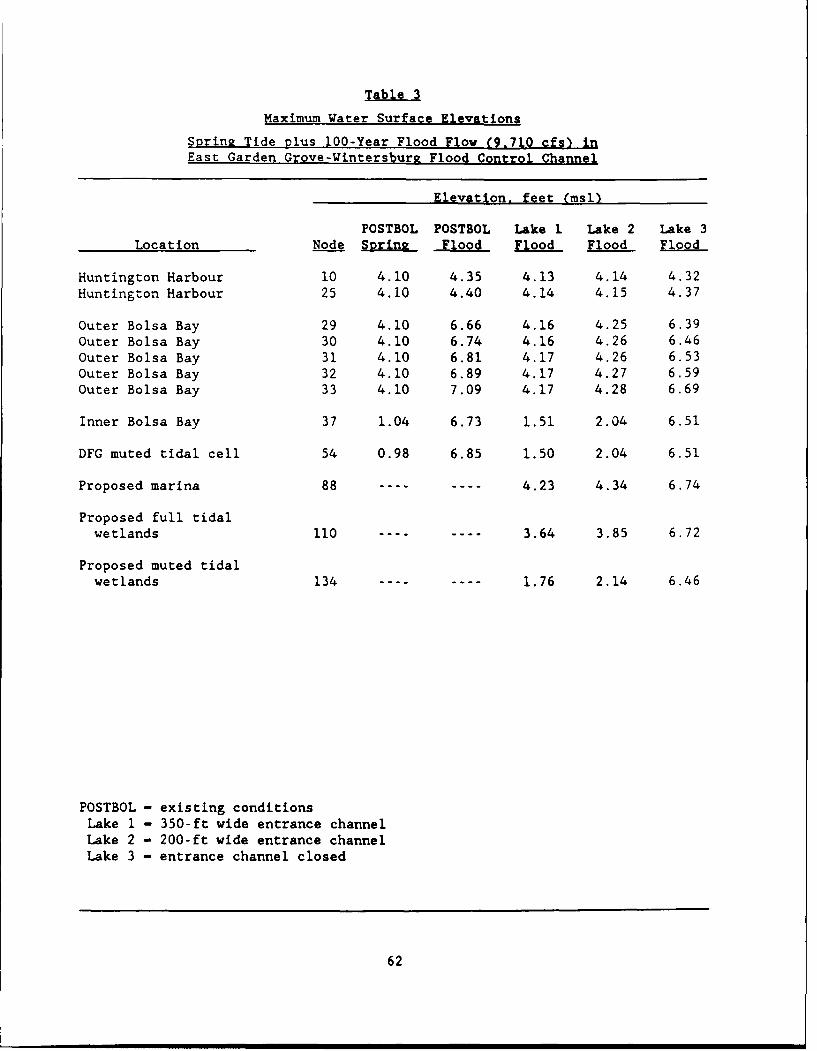
Table3
Maximum Water Surface Elevations
Spring Tide plus 100-Year Flood Flow (9,710 cfs) inEast Garden Grove-Wintersbur& Flood Control Channel
Elevation. feet (msl)
POSTBOL POSTBOL Lake 1 Lake 2 Lake 3Location Node Sring Flood Flood Flood Flood
Huntington Harbour 10 4.10 4.35 4.13 4.14 4.32Huntington Harbour 25 4.10 4.40 4.14 4.15 4.37
Outer Bolsa Bay 29 4.10 6.66 4.16 4.25 6.39Outer Bolsa Bay 30 4.10 6.74 4.16 4.26 6.46Outer Bolsa Bay 31 4.10 6.81 4.17 4.26 6.53Outer Bolsa Bay 32 4.10 6.89 4.17 4.27 6.59Outer Bolsa Bay 33 4.10 7.09 4.17 4.28 6.69
Inner Bolsa Bay 37 1.04 6.73 1.51 2.04 6.51
DFG muted tidal cell 54 0.98 6.85 1.50 2.04 6.51
Proposed marina 88 ---- ---- 4.23 4.34 6.74
Proposed full tidalwetlands 110 ---- ---- 3.64 3.85 6.72
Proposed muted tidalwetlands 134 .... ---- 1.76 2.14 6.46
POSTBOL - existing conditionsLake 1 - 350-ft wide entrance channelLake 2 - 200-ft wide entrance channelLake 3 - entrance channel closed
62

water surface elevations for the spring tide plus the simultaneous 100-year
flood flow (9,710 cfs) in the EGG-WFCC.
Existing conditions
35. Under existing conditions, all flood flow is required to pass
tb-ough Outer Bolsa Bay and Huntington Harbour. The wide conveyance channels
of Huntingtcn Harbour allow the passage of the flood flow with only minimal
increase in maximum water surface elevation of about 0.3 ft, from about 4.1 to
about 4.4 ft msl (Figures 66 and 67, and Table 3). Warner Avenue bridge acts
as a restriction to the passage of the 100-year flood discharge, causing
ponding to occur in Outer Bolsa Bay. The water surface elevation occurring
from flood flows in Outer Bolsa Bay is estimated to reach 7.1 ft msl, an
increase beyond the normal spring high tide elevation of about 3.0 ft
(Figures 68 and 72, and Table 3).
36. Because of the elevated water surfaces in Outer Bolsa Bay, flood-
ing also occurs in Inner Bolsa Bay, where the maximum water surface elevation
increases to around 6.7 ft msl, an increase over normal spring high tide
elevations of about 5.7 ft (Figure 73, and Table 3). A similar increase in
water surface elevation occurs in the DFG muted tidal cell (Figure 74, and
Table 3).
37. Damping created by Warner Avenue bridge prevents most undulations
of tidal activity existing in Huntington Harbour from propagating upstream
into Outer Bolsa Bay. Thus, the bridge opening prevents the passage of a
quantity of flood flow that would otherwise be transmitted through the harbor.
Such constriction results in a hydraulic drop across Warner Avenue bridge of
about 2.3 ft, from 6.7 ft msl elevation in Outer Bolsa Bay (Node 29) to
4.4 ft msl in Huntington Harbour (Node 25).
Lake Plan alternatives
38. High tide elevations in Huntington Harbour and Outer Bolsa Bay for
both Lake 1 and Lake 2 alternatives for the 100-year flood flow would remain
approximately the same as existing spring tide elevations because the proposed
non-navigable entrance at Bolsa Chica would permit flood flows to escape
directly into the Pacific Ocean. The maximum difference in high tide
elevations for spring and flood conditions would be only about 0.2 ft with the
inclusion of the proposed channel at Bolsa Chica. Conversely, for Lake 3 when
the entrance channel closes, all tidal prism must discharge through
63

Outer Bolsa Bay and Huntington Harbour. High tide elevations for this
situation approximate those of existing flood flow (Figures 66 through 72, and
Table 3).
39. Both Lake i and Lake 2 alternatives under flood flow conditions
result in a moderate transient increase in water surface elevation in Inner
Bolsa Bay and the DFG muted tidal cell, being about 0.5 ft and 1.0 ft,
respectively (Figures 73 and 74, and Table 3). Lake 3 flood flow results in
the existing muted tidal wetlands (Inner Bolsa Bay and the DFG cell) are
slightly less than existing flood flow conditions, with the maximum water
surface elevation increasing from about 1.0 to about 6.5 ft msl for Lake 3
floods, and to about 6.8 ft msl for existing condition floods.
40. Because neither the proposed Lake Plan marina, proposed full tidal
wetlands, nor proposed muted tidal wetlands presently exist, it is not
possible to compare results from the Lake Plan alternatives with existing
conditions for these regions. Lake 1 and Lake 2 alternatives under flood flow
conditions provide for modest increase in high tide elevations in the proposed
full tidal wetlands beyond normal spring tide elevations, being about 0.2 and
0.4 ft, respectively. Lake 3 induces a significant increase for these
conditions, being an increase of about 3.4 ft. Lake I and Lake 2 alternatives
result in increases in high tide elevations in the proposed muted tidal
wetlands for flood flow conditions beyond normal spring tide elevations of
about 0.3 and 0.6 ft, respectively. Lake 3, however, induces an increase in
this region of about 5.0 ft (Tables 1 and 3).
Average Channel Velocities
41. Maximum average channel velocities for the simultaneous occurr-nce
of spring tide and 100-year flood flow discharging into the Bolsa Bay complex
by the EGG-WFCC are presented in Figures 78 through 93 for representative
locations throughout the system. These data are tabulated in Table 4. Warner
Avenue bridge and Outer Bolsa Bay remain in their present condition for all
Lake Plan alternative evaluations.
ExistLn& conditions
42. Maximum average channel velocity increases throughout the Bolsa
Chica system are non-linearly proportional to the water surface elevation
64

EGG-WFCC FLOOD -9,710 CFS6.0- STA. 2 FROM POSTS(OLr
SS". 2 rROM LftCE~rV5.-SIR. 2 FROM LFt(1:ZV5.0-.SMR 2 FROM LAcrErV
4.0-
3.0-
2.0-
0 .0... .. .. .. ... .. .. ..
2 .0 X
-6.00G.0 25.0 5007S.0 IL
T IME MuRS)Figure 78. Average channel velocities under PCH bridge at Anaheim Bay,
POSTBOL - existing condition, LAKEl - 350-ft entrance channel,LA.KE2 -200-ft entrance channel, LAKE3 - entrance channel closed
EFF-WFCC FLOOD -9,710 CFSS.0 - S"N. S rR Pmt1 au-v
SSM. 5 rm" IN.c~-ST". S rRn IUVMCE7
4.0-- STN. 5 M FUw I jC
3.0-
2.0-
-2 .0
S 0.0 ~ A.0 Si. A,'. .0 5
T If ME RS)IFigure 79. Average channel velocities in Huntington Harbour,POSTBOL - existing condition, LAKEl - 350-ft entrance channel,
LAKE2 - 200-ft entrance channel, LAICE3 - entrance channel closed
65

EGG-NFCC FLOOD 9,710 CFS5.0 _ SThI. 7 7F0N POSThO.FV
*.. SmR. 7 FROM LftCEIrVSTm. 7 MROM LFtaWY
4.0-- STm. 7 rROfl UWcr=
3.0-
2.0
CL. 1.0-
-1.0
T IME MRSI
Figure 80. Average channel velocities in Huntington Harbour,POSTBOL - existing condition, LAM~ - 350-ft entrance channel,
LAKE2 -200-ft entrance channel, LAKES - entrance channel closed
EGG-WFCC F'LOOO -9,710 CFS5.0- - S. 10 Frmf PGSTU0LFV
-5si. 10 FRM LAEr
4.0-- STm. 10 FRMS LftC~r
3.0-
2.0-
-4.0-
3.0000L 10.0 7S.0 1 .0T I ME MRS)
Figure 81. Average channel velocities in Huntington Harbour,POSTBOL - existing condition, LAM~ - 350-ft entrance channel,
LAKE2 - 200-ft entrance channel, LAKE3 - entrance channel closed
66

EFF-NFCC FLOOD -9,710 CFS5.0- - 5T". 17 FROM1 POSThOMrY
.*. STh. 17 FTM0 4 MIrSMh 17 FROM UFCEZrV
i.0 -. 5Th. 17 FROMi LACCYV
3.0
2.0-
CL 1.0-
Li
2.0
030
a-5.0 5. I3.T0.0 (HRS
Figure 82. Average channel velocities in Huntington Harbour,POSTBOL - existing condition, LAM~ - 350-ft entrance channel,
LAKE2 -200-ft entrance channel, LAKE3 - entrance channel closed
EGG-WFCC FLOOD -9,710 CFS5.0 - S". 24 F"~ P05 10LF
SMT. 24 FW LFtNEINSM5T. 24 FRMhqLWEZrV
4.0- SM5T. 24 FROMI LWKYV
3.0-
2.0
-2.0
-2.0
-3.0
0.0 A.0 Ui.0 75.0 0.TIME (MRS)
Figure 83. Average channel velocities in Huntington Harbour,POSTBOL - existing condition, LAKEl - 350-ft entrance channel,
LAKE2 - 200-ft entrance channel, LAKE3 - entrance channel closed
67

EGG-WFCC FLOOD 9,P710 CFS5.0- S TA. 25 nMO POSTBOUrV
SMh. 25 rR0I1LFWErV-- SMh. 2SF 0I1LUVCErV
4.0- S TA. 25 FROII LAKCTrV
:3.0-
2.0-
ZJ-
-2 .0-
-3.
-4.0-
-5.0-0.0 2i.0 a0. 750 0.0
T IME (HRSIFigure 84. Average channel velocities in Huntington Harbour,POSTBOL - existing condition, LAM~ - 350-ft entrance channel,
LAKE2 -200-ft entrance channel, LAKE3 - entrance channel closed
EGG-WFF FLOOD 9,710 CFSs.0- -SM. 26 MRW PORUJV
SSM. a Ffm lmiE11-SIR. M ONLUM7V
4.0- M5T. 26 niM CTCYV
3.0-
2.0-
o. . ............... ... -.-.... .> .. . . . . . .
-2.0
0.0 2i.0 3i.0 4.o 100.0TIMC (fIRS)
Figure 85. Average channel velocities in Huntington Harbour,POSTBOL - existing condition, LAM~ - 350-ft entrance channel,
LAKE2 - 200-ft entrance channel, IAKE3 - entrance channel closed
68

EGG-NFCC FLOOO -9,710 CFS5.0- - STfl. 31 VWON P05TBMXV
.... . 31 TrR1 LftCC1VSTA. 31 rR0I LIWE7'
4.0-- STS. 31 ~RFT LMCYYF
3.0-
2.0-
25. 500.0. 10.
T IME (HRSJFigure 86. Average channel velocities in Huntington Harbour,POSTBOL - existing condition, LAK.El - 350-ft entrance channel,
LAKE2 -200-ft entrance channel, LAK.3 - entrance channel closed
EGG-WFCC FLOO 9,710 CFS12.0- SMTh 34 Fw P0STOX~V
-- SMi. 34 Twal LMEiY10.0- - TA. 34 rR FCr
6.0-
4.0-
(nS 2.0-
S 0.0-
-2.0 ...........................
TIME (MRiS)Figure 87. Average channel velocities under Warner Avenue bridge,
POSTEOL -existing condition, LAKE1 - 350-ft entrance channel,LAKE2 - 200-ft entrance channel, LAKE3 - entrance channel closed
69

EGG-NFCC FLOOD - 9,710 CFS7.0- - STh. 35 FI"O POSTUV
..... STA. 35 FROML't CIfV6.0 .. STM. 35 FROM WLUEV
- -TR. 35 FROILtRCE3V5.0-
4.0-
3.0-
2.0U,
1.-
~0.0o .0...
.. 1.0S i. g u..e.. ... Avr c veloc..... i in Outer.Bol.... Bay,
-F3.0,-
-4.0 -
-5.0-
6.0-
-. 0
- .0 5.o.0 .0 ,., .oTIME (MRS)
Figure 88. Average channel velocities in Outer Bolsa Bay,POSTBOL - existing condition, LAKE1 - 350-ft entrance channel,
LAKE2 - 200-ft entrance channel, LAE3 - entrance channel closed
EGG-FCC FLOOD 9,710 CF4.0" 5" . w nm 03nno18v
M._36 mm. im'rv__ TR. 36 F'ROMU923r
3.0-
2.0-
-20.
-:3.0 -
-4.0o~ . . o,.TIME (IMRS)
Figure 89. Average channel velocities in uter Blolsa Bay,POSTBOL- existing condition, LAKE1 - 350-ft entrance channel,
LAKE2 - 200-ft entrance channel, LAKE3 - entrance channel closed
70

EGG-WFCC FLOOD - 9,710 CFS4.0- _ SM. 37 rRM P05nnILV
...STfR. 37 M1M1 t.VMl~ll
.. STR. 37 'ROII ULE3FV
3.0-
2.0-
(1.0CL.
> 0.0..... ...... ......°~~ ~~~~~~ ................................
..............
- 0.0 2. 001 .
TIME (HRSIFigure 90. Average channel velocities in Outer Bolsa Bay,
POSTBOL - existing condition, LAKE1 - 350-ft entrance channel,LAKE2 - 200-ft entrance channel, LAKE3 - entrance channel closed
EGG-WFCC FLOOD - 9,710 CFS.- S TH. M fR101 PVSThO.V
SM. 30 10 LRCITV4.0 - Sm. 38r R VM
3.0-
2.0-
a .0-
.. .. ....-0.0-
, /'/ -- * . .. , ,*,. , /-,,*.. : : ,
POST-OL .existing condition, LKE. - 350-ft entrance channel,LAKE2 - 200-ft entrance channel, LAKE3 - entrance channel closed
71

i~aEGG-NFCC FLOOD -9,710 CES
3.0-
2.0-
0.0
L.
0.02.0Sxa10
T I MC MRS IFigure 92. Average channel velocities in proposed marina channel,LAKE1 - 350-ft entrance channel, LAKE2 - 200-ft entrance channel,
L.AKE3 - entrance channel closed
EGG-WFCC FLOGOD 9,710 cr510.0- - S. IM FM LCIrV
6.0-
6.0-
2.0-
3 0.0-
-2.0-
-1.0-
-$.0.
-6.0
-10.00.0 M.0 10.0 11. I.0
TI ME (MRS I
Figure 93. Average channel velocities in proposed entrance channel,LAKE1 - 350-ft entrance channel, LAJCE2 -200-ft entrance channel
72

Table 4
Maximum Avera2e Channel Velocities
Spring Tide plus 100-Year Flood Flow (9.710 cfs) inEast Garden Grove-Wintersbure Flood Control Channel
Velocity. ft Rer sec
POSTBOL POSTBOL Lake 1 Lake 2 Lake 3Location Link Syrin2 Flood Flood Flood Flood
Pacific Coast Highwaybridge 2 2.78 5.04 2.98 3.30 5.07
Huntington Harbour 5 1.42 3.18 1.61 1.86 3.16Huntington Harbour 7 1.48 3.50 1.70 1.99 3.48Huntington Harbour 10 0.71 1.88 0.85 1.02 1.86Huntington Harbour 17 0.66 1.85 0.80 0.97 1.82Huntington Harbour 24 0.57 2.11 0.74 0.96 2.06Huntington Harbour 25 0.30 1.58 0.43 0.61 1.53Huntington Harbour 26 0.34 2.30 0.58 0.86 2.21
Warner Avenue bridge 34 1.65 11.60 4.94 6.48 11.39
Outer Bolsa Bay 35 1.35 2.34 1.71 1.85 2.18Outer Bolsa Bay 36 0.71 1.97 1.33 1.48 1.85Outer Bolsa Bay 37 0.88 2.07 1.31 1.50 1.95Outer Bolsa Bay 38 1.12 2.77 1.33 1.58 2.11
Proposed marina channel 85 ---- ---- 2.63 2.40 1.72
Entrance channel 109 ---- ---- 6.73 8.17
POSTBOL - existing conditionsLake 1 - 350-ft wide entrance channelLake 2 - 200-ft wide entrance channelLake 3 - entrance channel closed
73

increases. While the maximum water surface elevations throughout Huntington
Harbour are not significantly greater under the 100-year flood flow condi-
tions, maximum average channel velocities occur near mean tide elevations
where the flow cross-sectional areas are less than maximum. Hence, the tidal
flows and flood flows are being conveyed simultaneously through a minimum area
and, thus, at a maximum velocity.
43. Maximum average channel velocities increase at the Pacific Coast
Highway bridge at Anaheim Bay from about 2.8 ft per sec to about
5.0 ft per sec (80 percent increase) (Figure 78, and Table 4). Maximum
average channel velocities in Huntington Harbour increase up to a maximum of
3.5 ft per sec from about 1.5 ft per sec (130 percent increase). Other
sections experience a greater percentage increase, although not as large an
absolute magnitude (Figures 79 through 86, and Table 4).
44. Warner Avenue bridge experiences excessively high velocities due to
the large difference in water levels upon either side of the bridge. Maximum
average velocities increase from about 1.6 ft per sec during maximum spring
tides to about 11.6 ft per sec under 100-year flood flow conditions
(600 percent increase) (Figure 87, and Table 4). Outer Bolsa Bay would
experience velocities approaching 2.8 ft per sec, which would be significantly
greater if not for the damming effect created by existing Warner Avenue bridge
(Figures 88 through 91, and Table 4).
Lake Plan alternatives
45. Average channel velocities under the PCH bridge at Anaheim Bay are
not exceedingly larger for flood flow conditions with either the Lake 1 or
Lake 2 concept than for maximum spring tide velocities, and are significantly
less than flood flows under existing conditions. Lake 1 concept average
velocity at the PCH at Anaheim Bay bridge increases from about 2.8 to about
3.0 ft per sec (7 percent increase), whereas the Lake 2 concept average
velocity increases to about 3.3 ft per sec (19 percent increase). The Lake 3
concept which requires all flow to pass under the PCH bridge at Anaheim Bay
(analogous to existing conditions) induces an average velocity of about
5.0 ft per sec at this location (82 percent increase) (Figure 78, and
Table 4). Here again, these are average channel velocities over the entire
cross-sectional area, and do not account for spiral flow around channel bends
which would likely exceed this velocity.
74

46. The Lake I concept with the 100-year flood flow results in average
channel velocities in Huntington Harbour which are only slightly greater than
maximum spring tide conditions. The main channel into Huntington Harbour
experiences average channel velocities approaching 2.0 ft per sec under the
Lake 2 concept at Link 7, increasing from 1.48 ft per sec (34 percent
increase). Average channel velocities throughout Huntington Harbour for
Lake 1 and Lake 2 flood flow conditions are not significantly greater than for
maximum spring tide flows under existing conditions, because the majority of
the flood flow will discharge through the proposed entrance channel at Bolsa
Chica. The restriction afforded by Warner Avenue bridge retards flood flow
into Huntington Harbour. Even for the Lake 3 condition, average channel
velocities throughout the harbor do not exceed the corresponding flood flow
velocities under existing conditions (Figures 79 through 86, and Table 4).
47. Only a portion of the flood flow passes under Warner Avenue bridge,
for the Lake I and Lake 2 alternatives, although average velocities increase
from 1.65 ft per sec to 4.94 and 6.48 ft per sec, respectively. The Lake 3
concept essentially reproduces the existing condition velocities under the
bridge (11.39 ft per sec). Scour and erosion of the soft sediments of Outer
Bolsa Bay and the bridge abutment may ensue, with corresponding shoaling of
the eastern portion of Huntington Harbour, unless bridge and channel stabili-
zation measures are instituted at Warner Avenue bridge. Average channel
velocities in Outer Bolsa Bay approach 1.7 and 1.9 ft per sec for the Lake I
and Lake 2 concepts, respectively, even though much of the flood flow
discharges through the proposed entrance channel at Bolsa Chica to the ocean.
Lake 3 average channel velocities approach 2.2 ft per sec in Outer Bolsa Bay
(Figures 88 through 91, and Table 4). Lake 3 flood velocities are slightly
less than existing condition flood velocities because a portion of the flood
flow is going into temporary storage within the proposed wetlands. The
maximum water surface elevations within the existing and proposed wetlands
under Lake 3 flood conditions are slightly less than under existing flood
conditions.
48. Because such a large volume of flood flow passes directly through
the Lake Plan marina complex and into the ocean for both the Lake 1 and Lake 2
concepts, resulting average channel velocities in the Lake Plan marina
channels for these plans are actually greater than for the Lake 3 plan,
75

being 2.63, 2.40, and 1.72 ft per sec, respectively. The average channel
velocities in the entrance channel at Bolsa Chica resulting from flood flow
under the Lake I and Lake 2 concepts (6.73 and 8.17 ft per sec, respectively)
are of sufficient magnitude to reestablish design dimensions of the channel
(i.e., allowing removal of all sediment buildup in the proposed entrance
channel at Bolsa Chica) (Figures 92 and 93, and Table 4). Velocities up to
8 ft per sec from the 100-year flood flow will have no deleterious effect on
entrance channel closure; however, this velocity magnitude will require
consideration in the design of the stabilizing jetties and new bridge over the
entrance channel. These high velocities may keep the entrance channel open
only a short time; a 100-year opening frequency is not sufficient to prevent
closure at other times.
76

PART IV: EVALUATION OF TRANSPORT CHARACTERISTICS
49. DYNTRAN simulations were performed to evaluate the impacts of the
transport and mixing characteristics of the three potential entrance config-
urations (Lake 1, Lake 2, and Lake 3) of the proposed Lake ?lan alternative on
water quality in the Huntington Harbour-Bolsa Bay complex. First, overall
residence time (water age) was calculated for the whole system. Ocean water
is in a comparatively clean condition, and residence time in the system
generally corresponds to degradation of the water quality. Although there is
not a direct correlation, and other factors may improve or degrade water
quality conditions, the residence time serves as an indicator of system water
quality particularly in the harbor and marina areas. Rapid flushing within
the wetland itself, however, is not considered a necessary beneficial
condition. Also, transport of runoff from the EGG-WFCC was simulated for the
Lake Plan configurations. EGG-WFCC has previously been shown in the main
report (Report No. 3) to be a major source of toxic materials which are
transported into Outer Bolsa Bay and, to a lesser degree, into Huntington
Harbour.
50. This series of simulations addresses the potential impacts of
circulation changes in the system on water quality. No attempt has been made
to estimate the potential increase in pollutants from new development or
recreational uses of the Lake Plan alternatives.
Tidal Boundary Driver
51. The tidal boundary conditions used for the transport tests are
shown in Figure 94. This signal is simply the tidal pattern from constitu-
ents at the NOAA Los Angeles-Long Beach tide gage for the month of September
1988. For the water age calculation, 1,375 hr of simulation were performed.
The September tidal pattern was repeated for the additional simulation time.
In the runoff tests, the first 200 hr were utilized. The September 1988 tides
do not contain the extreme high and low tide range observed in this area, and
utilized in the hydrodynamic simulations. However, this lower tidal range
condition is a more environmentally stressful condition; i.e., system flushing
is lower for lower tidal ranges. This is the same tidal boundary driver
77

0
C-D
a~' I~ ,.
0-a 2 .0 4 . .0 JO 200.0 140.0
TIME (HRS1
Figure 94. Tidal boundary driver (September 1988)for transport and mixing characteristics, Bolsa Bay, and vicinity
previously used in the main report (Report No. 3) to evaluate the Preferred
Alternative and the Secondary Alternative transport characteristics and water
age. Direct comparisons of residence times are applicable.
System Water Age
52. In this series of tests, the average age for a parcel of water
(i.e., the t-ime since that parcel of water left the ocean) was calculated for
the existing condition (POSTBOL), and for each of the three potential entrance
configurations of the proposed Lake Plan alternative previously described.
These three variations include:
a. Lake 1: Lake Plan with 350-ft wide entrance channel,wetlands not connected,
b. Lake 2: Lake Plan with 200-ft wide entrance channel,wetlands not connected, and
. Lake 3: Lake Plan with entrance channel closed,wetlands not connected.
78

53. Water age was calculated by setting the age of the ocean water
equal to zero, and solving the "water age" transport equation previously
discussed in the main report (Report No. 3). Use of the time decay boundary
option was overridden in the model in this case, and a 0.0 boundary value was
specified as follows. For the existing entrance, the age boundary (i.e., the
location where the water was considered outside the system) was taken at the
boundary of Node 1. Water age was set to zero in Nodes 73 and 74 at the
Anaheim Bay entrance (Figure 3). Similarly, for the variations of the Lake
Plan alternative, the zero boundary was set at the edge of the land area
rather than at the boundary of the nodes extending out into the ocean. Water
age was set to zero in Nodes 91, 139, and 140. For all water age simulations,
the hydrodynamic model was started at a zero velocity condition and zero water
surface elevation (msl), and allowed 25 hr (two complete tidal cycles) for
model "spinup" before starting the water age calculations. Water age was
initially zero throughout the entire system.
54. For existing conditions, water age results are presented graphic-
ally for Nodes 9, 15, 17, 24, 32, 35, 40, and 54 in Figures 95 through 102,
respectively (location of nodes shown on Figure 3). The graphs demonstrate
several general characteristics of the aging simulations. During the initial
phase of the simulations, the water age increases linearly. As the system
equilibrates, the water age oscillates with the tidal variations in a plateau
range. At Node 9 (Figure 95) in the main channel of Huntington Harbour,
velocities are relatively high, and water moves rapidly in from the ocean and
back out, resulting in large variations in water age over a tidal cycle at
this location. In the side channels of Huntington Harbour (Figures 96 and 97)
where flow is low, intertidal variations are decreased and average water age
is much higher. These side channel areas occasionally have low dissolved
oxygen (DO), particularly in the deeper reaches due to increased residence
time, low vertical mixing, and biological oxygen demand (BOD) sources in the
marinas. As the water moves away from the Anaheim entrance into Bolsa Bay,
average age increases. In the DFG muted tidal cell, water age equilibrates to
over 800 hr (a residence time in the system of more than a month), and tidal
oscillations are damped.
79

-SIP%JL~rw
--- -- -- --
NO
0.0 20. 0 4a).: S .0 acO .C)000.0 1200.0 1400.0
TEr'E (HRS)Figure 95. Water age for Node 9 existing conditions,
main channel, Huntington Harbour
- -sip~Rra)
~- - - ------------------.----------- ---- - --------- -- - -
4M G .aa. 10.a 2200.0 .400.0TIME (HRSI
Figure 96. Water age for Node 15 existing conditions,side channel, Huntington Harbour
80

SIP)LR rCD
C.
-- I
0.0 2M.0 4Mf. 0 SM.0 M0.0 1000.0 1200.0 14 0.0TIME (HRSr
Figure 97. Water age for Node 17 existing conditions,
side channel, Huntington Harbour
, ,
o a aa I a a
-2---------------------- --------- - -.. . - - - - - - -
- -------- .--------- 1-.-----------------**
0.0 2 0 1) 0 0 .O.0 1000.0 1200.0 1400.0
TIME (HRS)Figure 98. Water age for Node 24, existing conditions,
main channel, Huntington Harbour
81

0
-- ------- -- IP-JLR -
Ci
o "i
o ,*
C.0 2C6.O 4130.0 S .0 S .0 1000.0 2200.0 14'0.0
TIME (HRS)Figure 99. Water age for Node 32 existing conditions,
Outer Bolsa Bay
--- S---R -
0+
0
0.0 21:6.0 40. 0 Gm.0 1.000.0 2200.0 14o.0TIlt (HRS)
Figure 100. Water age for Node 35 existing conditions,Inner Bolsa Bay
82

-SIN~LRra)
C5
Cr
0.0 2M.0 4M. 0 SM. e .0 1000.0 1200-0 1400. 0TIM~E (HRS)
Figure 101. Water age for Node 40 existing conditions,o Inner Bolsa Bay
- ---------
C
C
W
0.0 2C.0 4M.0 1M.0 SM.0 1000.0 1200.0 1400.0TIME (HRS)
Figure 102. Water age for Node 54 existing conditions,DFG muted tidal cell
83

55. Table 5 summarizes the ageing results for a series of nodes in
Huntington Harbour and Bolsa Bay under existing conditions, and for the three
potential entrance variations of the Lake Plan alternative. The average age
for the final 25 hr (two full tidal cycles) of simulation is shown in this
table. The Lake Plan alternative variations do not adversely affect flushing
in the Huntington Harbour area. Water age is reduced for the open entrance
configurations (Lake 1 and Lake 2), and is close to existing values where the
entrance channel may close (Lake 3) due to shoaling if not maintained.
Table 5
Water Age
Huntington Harbour and Bolsa Bay, California
Existing Conditions versus Lake Plan Alternatives
Average Age (hours) for Final 25 hours of Simulations
Wetlands Not Connected
Location Node POSTBOL Lake 1 Lake 2 Lake 3
Huntington Harbour 9 281 167 152 265Huntington Harbour 15 425 285 267 444Huntington Harbour 17 435 295 260 433Huntington Harbour 24 434 276 251 389
Outer Bolsa Bay 29 487 341 295 450
inner Bolsa Bay 37 684 88 94 601Inner Bolsa Bay 40 751 145 151 689
DFG muc-d tidal cell 54 855 242 252 808
Proposed full tidal wetlands i1 --- 384 387 905
Proposed muted tidal wetlands 122 --- 513 518 1,014Proposed muted tidal wetlands 129 --- 487 492 996Proposed muted tidal wetlands 134 --. 491 496 998
POSTBOL - existing conditionsLake I - 350-ft wide entrance channelLake 2 - 200-ft wide entrance channelLake 3 - entrance channel closed
84

56. In all existing wetland areas, water age is greatly reduced for
both the Lake 1 and Lake 2 configurations. The culvert system to the existing
Inner Bolsa Bay wetlands for the Lake Plan configurations is located close to
the proposed ocean entrance "analogous to the supplemental channel to Inner
Bolsa Bay previously evaluated as part of the navigable entrance channel
concept in the main report, Report No. 3). Thus, as expected, water entering
the wetlands has been in the system a relatively short period of time.
57. Water age is very slightly lower in the wetlands for the 350-ft
wide entrance channel (Lake 1) than for the 200-ft wide entrance channel
(Lake 2). Water age within the existing wetland area is slightly lower for
Lake 3 (entrance channel closed) than for existing conditions. Node 37 is the
first node within the Inner Bolsa Bay muted tidal wetland for the Lake Plan
configuration, whereas under existing conditions the culvert system discharges
into Node 35 (i.e., the areas represented by Nodes 35 and 36 are removed from
the Inner Bolsa Bay wetland area under the Lake Plan configuration).
58. The water age from the front to the back of the existing Inner
Bolsa Bay muted tidal wetland (Nodes 37, 40, and 54) is virtually unchanged
(slightly reduced) from existing conditions by the Lake 3 concept which,
again, considers that the entrance channel has closed by littoral material
transport in the surf zone. This is anticipated since the culvert system is
identical for the two situations; however, the Lake Plan alternative provides
for a much greater hydraulic efficiency of the approach channel to the culvert
system. In the proposed full tidal wetland area and proposed muted tidal
wetland area, water age is lower for the open entrance Lake Plan configura-
tions (Lake I and Lake 2) than in the existing Inner Bolsa Bay muted tidal
wetlands. For the closed entrance channel Lake Plan configuration (Lake 3),
the water age in the proposed full tidal wetland area and proposed muted tidal
wetland area is substantially greater than for the existing Inner Bolsa Bay
muted tidal wetlands.
85

East Garden Grove-WintersburgFlood Control Channel (EGG-W7CC) Runoff
59. To test the impacts of the Lake Plan alternative variations on the
transport of runoff from the EGG-WFCC into the existing and proposed wetland
enhancement areas, a simulation was performed using the first 200 hours of the
tidal signal of Figure 94. The model simulation was started from still water
conditions at mean tide elevation, and was "warmed up" for 50 hours before
constituent simulations were begun to remove all transient variations, and to
allow the model to equilibrate to steady state conditions. A runoff inflow
with a dissolved tracer (Figure 103) entered the model at the node adjoining
the EGG-WFCC. For the existing condition, inflow was introduced into Node 33.
For the three Lake Plan alternative concepts, the same runoff inflow was
introduced into Node 83. The constituent boundaries were set at the edge of
the model network for EGG-WFCC runoff; i.e., extending out into the ocean
region.
60. Figure 104 compares the concentrations of the dissolved tracer
resulting from the EGG-WFCC runoff at a point immediately beyond the culvert
system at the entry to the Inner Bolsa Bay wetland for existing and proposed
Lake Plan conditions. Node 35 of this display is located at the entry to
existing Inner Bolsa Bay and results are for existing conditions, while
Node 37 is located at the entry to Inner Bolsa Bay after the Lake Plan
alternative configurations have been developed. Figures 105 and 106 depict
the time histories of the dissolved tracer resulting from the EGG-WFCC runoff
for the existing condition and for the three Lake Plan alternative concepts at
a location representative of Inner Bolsa Bay (Node 40), and in the DFG muted
tidal cell (Node 54), respectively. Figure 107 compares the inflow concentra-
tions immediately beyond the culvert system at the entry of the existing Inner
Bolsa Bay muted tidal wetlands (Node 35), and immediately beyond the culvert
system at the entry to the proposed full tidal wetland enhancement region
(Node 93), respectively.
61. Presently, inflow from EGG-WFCC enters Outer Bolsa Bay
immediately in front of the culvert system into Inner Bolsa Bay. For the
existing condition configuration, runoff is swept into the existing Inner
Bolsa Bay with little dilution. The location of the culvert system to the
86

10.01
A0 4-jL
2
0 26 60 76 100 126 10 176 200 226
TIME (hrs)
10.0
Z,
0
1 4
ze
z
01 20 7 0
0 26 so 76 106 li6 40 46 2106 226
TIME (hrs)
Figure 103. Runoff inflow hydrograph with dissolved tracer toevaluate transport from EGG-WFCC into wetlands
87

-nJ)
0 0 0 0-
z. z z z
+ x 0 CP
6-0~~ 9-0 VO
('l/O) NOIY~l30Nr
Be-

Cs
a
00
C0
C) -
00
9* cc t 6' . Eo 0r(I/O ) NOIY~l30U '.,q
a89

0
LaJC
rr-l C: 7
m- ad
o0
-0 0- 0 0
+ x
I -60 8.0 Co 9*0 slo vo* V o 1.0 0
(V119W) NOlIU8.LNJONOO
90

>
00
- C :
6. . o 0-
('l/O- N0168N3NO
91 ~

existing Inner Bolsa Bay muted tidal wetlands at a substantial distance from
the channel inflow (Node 83) as configured in the Lake Plan alternative,
provides an opportunity for the dilution of the toxicants being carried by the
runoff. In addition, the Lake Plan alternative is a deep, high volume
configuration which provides tremendous dilution potential for the intermit-
tent inflow from the EGG-WFCC. For all the Lake Plan alternative configura-
tions, runoff concentrations are reduced to a negligible level; i.e., on the
order of 1 percent of those observed for the existing conditions. Although
Lake 3 (which considers that the entrance channel has closed) indicates a
slightly greater concentration reaching the wetland compared to the concentra-
tions for the open entrance Lake Plan concepts (Lake I and Lake 2), this value
is truly minuscule compared to the present configuration.
Assessment of Transport Characteristics
62. The three Lake Plan alternative concepts have no apparent negative
impacts on water age in sensitive areas of Huntington Harbour. For the
Lake 3 concept (entrance channel closed), water age in the proposed new
wetland enhancement areas is greater than that presently found within the
existing muted tidal wetlands (Inner Bolsa Bay). This indicates that water
quality in the proposed new wetlands for the Lake 3 concept may be slightly
degraded relative to water quality of the existing wetlands. Both the Lake I
and Lake 2 concepts provide for significant reductions in water residence
times in the existing wetlands (Inner Bolsa Bay) compared to existing
conditions. This reduction in water residence time occurs because Inner Bolsa
Bay tidal prism has a much shorter connection through the proposed Lake Plan
entrance channel to the Pacific Ocean than through Huntington Harbour. Both
of these concepts (Lake 1 and Lake 2) also provide for significant reductions
in water age in the proposed new wetland enhancement regions compared to the
existing Inner Bolsa Bay wetlands, for the same reasons.
63. The Lake Plan alternative concepts also provide a very effective
buffer to the inflow of flood discharge from the EGG-WFCC into the wetlands.
Dilution of this inflow is much greater for all the Lake Plan configurations
than under existing conditions, and is a significantly beneficial consequence.
Presently, flood flow from the EGG-WFCC discharges into Outer Bolsa Bay at the
92

entzance to Inner Bolsa Bay, with minimal dilution. Under Lake Plan concepts,
flow from the EGG-WFCC will discharge into a large volume of relatively fresh
(less degraded) water in the marina region, thus reducing concentrations
available for transport into the proposed and existing wetlands.
93

PART V: SUMMARY AND CONCLUSIONS
Summary
64. The Lake Plan was introduced for analysis by Signal Landmark, as a
third alternative to the Preferred and Secondary Alternatives. The Lake Plan
provides for a non-navigable entrance channel at the same location as the
Preferred and Secondary Alternatives, but with a marina reduced in size from
that of the Preferred Alternative. The design of the proposed wetland
enhancement will remain the same as for the Preferred Alternative.
65. Design details of the Lake Plan include a total water surface area
of approximately 112 acres encompassing the main channel, marina basins, lower
reach of the EGG-WFCC, interior waterways, and secondary channels. The design
depLh of the non-navigable entrance channel is -6 ft msl, while the depth of
the marina complex is -20 ft msl. The Lake Plan alternative design contem-
plates an ocean entrance channel whose width should only be great enough to
support an 1,100 acre marsh area from a hydraulic standpoint.
66. The calibrated and verified numerical simulation model DYNTRAN,
previously utilized to evaluate both the Preferred and Secondary Alternatives,
was used to determine the hydrodynamics and water quality aspects of the Bolsa
Bay complex resulting from the proposed Lake Plan alternative. The existing
conditions as previously evaluated are considered to be the base conditions
for comparison of Lake Plan effects. Optimization of the entrance channel
design has not been performed, although two entrance channel widths have been
evaluated (Lake 1 - 350-ft wide entrance channel; Lake 2 - 200-ft wide
entrance channel). Additionally, the possibility exists that the entrance
channel may close by littoral material transport in the surf zone. Hence, it
was necessary to evaluate the effects of a closed entrance on hydrodynamic and
water quality aspects. The Lake Plan alternative when the ocean entrance
channel is closed has been designated Lake 3.
94

Conclusions
Tidal water surface elevations
67. Primary interest with regard to water surface elevations is direct-
ed toward the ability of the Lake Plan non-navigable entrance channel concept
to fully support the proposed wetland enhancement plan. Conclusions in this
regard include:
j. Water surface throughout Huntington Harbour respondsidentically as existing conditions for all Lake Planconcepts,
b. The nearness of the proposed non-navigable entrance toOuter Bolsa Bay will permit low water elevations in thebay for Lake 1 and Lake 2 to fall about 1.0 ft lower than forexisting conditions,
c. Low water elevation in Outer Bolsa Bay for Lake 3 isretained about 1.0 higher than existing conditions, andabout 2.0 ft higher than Lake 1 or Lake 2,
d. When the wetlands are not connected, either Lake Plancauses about 0.15 ft higher high water elevation andabout 0.15 ft lower low water elevation in Inner Bolsa Bay,
e. Either Lake Plan alternative causes about a 0.1 ft higherhigh water elevation and about 0.05 ft lower low waterelevation in the DFG muted tidal cell,
f. High tide elevations in the proposed marinas are thesame for all Lake Plan alternatives,
g. Low tide elevations in the proposed marinas fall to about-3.5 ft msl for Lake 1 and Lake 2, and fall only to about-1.5 ft msl for Lake 3,
h. Lake I and Lake 2 provide for about a 4.9 ft maximum tidalrange in the proposed full tidal wetland, while Lake 3 allowsfor about a 4.4 ft maximum tidal range in the proposed fulltidal wetland, and
1. Lake 1 and Lake 2 provide for about a 2.1 ft maximum tidalrange in the proposed muted tidal wetland, while Lake 3allows for about a 1.9 ft maximum tidal range in theproposed muted tidal wetland.
95

Tidal average channel velocities
68. Major concerns pertaining to channel velocities exist with regard
to navigation hazards at the PCH bridge at Anaheim Bay, swimmer safety in
Huntington Harbour, potential for scour and erosion of soft sediments in Outer
Bolsa Bay with accompanying shoaling in Huntington Harbour, and the possibil-
ity of closure of the non-navigable entrance channel by littoral material in
the surf zone. Conclusions include the following:
a. Average channel velocities at the PCH bridge at Anaheim Bayare equal to or slightly less than existing conditions forLake 1 and Lake 2, with Lake 3 providing for about a0.5 ft per sec increase from 2.78 to 3.24 ft per sec, formaximum spring tide conditions,
k. Lake 1 slightly reduces average channel velocities inHuntington Harbour from existing conditions, Lake 2 inducesabout the same magnitude as existing conditions, and Lake 3causes an increase to about 2.0 ft per sec for maximum springtides, and may become hazardous for swimming,
&. Lake 1 reduces average channel velocities under Warner Avenuebridge from existing conditions, Lake 2 induces about the samemagnitude as existing conditions, Lake 3 causes an increase toabout 4.8 ft per sec for maximum spring tides which maynecessitate bridge stabilization measures to prevent scour ofabutments and channel bottom,
4. Lake 1 and Lake 2 reduce average channel velocities in OuterBolsa Bay from existing conditions, Lake 3 increases maximumaverage channel velocities from about 1.4 to about 1.7 ft persec for maximum spring tides; potential scour effects could beprevented by channel stabilization measures installed as partof project construction,
i. Large channel cross-sectional areas in the proposed Lake Planmarina provide for low average channel velocities, and swimmerhazards will not result, and
. Average channel velocities in the non-navigable entrance atBolsa Chica will exceed that necessary to initiate sedimentmotion, being about 2.4 and 3.3 ft per sec for Lake I andLake 2, respectively. This will contribute to keeping theentrance channel from closing by littoral material transportin the surf zone, although may not be entirely sufficient.
96

Effect of wetland connection
69. Inner Bolsa Bay may or may not be connected to the proposed muted
tidal wetlands by an opening through the existing dike. Conclusions regarding
the effects of such a connection on wetland tidal elevations include:
a. If the wetlands are connected, water surface elevations inInner Bolsa Bay and the DFG muted tidal cell will rise about0.15 ft higher than if the two regions are not connected,
b. The proposed full tidal wetlands are unaffected by such aconnection between the wetlands, and
c. The proposed muted tidal wetlands will experience about a0.1 ft decrease in maximum water surface elevation as thisvolume is permitted to flow into Inner Bolsa Bay.
100-Year flood flow water surface elevations
70. Concern exists regarding maximum flood flow elevations resulting
from the 100-year flood flow (9,710 cfs) occurring on the EGG-WFCC at maximum
spring tide conditions. Levee elevations must be established to preclude
overtopping. Assuming culverts will not be closed to prevent flood flow from
entering the wetlands, conclusions include the following:
a. Under existing conditions, water surface elevations inHuntington Harbour increase about 0.3 ft beyond normal springtide elevations (to about 4.4 ft msl); Lake 1 and Lake 2alternatives produce about the same flood flow elevations asnormal spring tide because most of the flood discharge exitsdirectly into the Pacific Ocean at Bolsa Chica; Lake 3 hightide elevations approach those of existing flood flow,
b. Warner Avenue bridge restricts flow from Outer Bolsa Bay,causing water surface elevations in Outer Bolsa Bay toincrease beyond normal spring tide for existing conditions byabout 3.0 ft (from about 4.1 to about 7.1 ft msl); Lake 1 andLake 2 alternatives result in flood elevations approximatingthose of normal spring tide; Lake 3 high tide elevationsapproach those of existing flood flows,
.. For existing flood flows, Inner Bolsa Bay and the DFG mutedtidal cell high water surface elevations increase from about1.0 to about 6.7 ft msl; Lake 1 and Lake 2 increase high tideelevations beyond normal spring tides by about 0.5 and 1.0 ft,respectively; Lake 3 alternative approximates the existinghigh tide flood flow elevation,
d. Lake 1 and Lake 2 alternatives provide for increases in highwater elevation beyond normal spring tide in the proposedfull tidal wetlands of about 0.2 and 0.4 ft, to about 3.6 and3.8 ft msl, respectively; Lake 3 alternative causes anincrease of about 3.4 ft, to about 6.7 ft msl, and
97

e. Lake 1 and Lake 2 alternatives provide for increases in highwater elevation beyond normal spring tide in the proposedmuted tidal wetlands of about 0.3 and 0.6 ft, to about 1.8 and2.1 ft msl, respectively; Lake 3 alternative causes anincrease of about 5.0 ft, to about 6.5 ft msl.
100-Year flood flow average channel velocities
71. Conclusions regarding maximum average channel velocities resulting
from the 100-year flood flow on the EGG-WFCC include:
a. For existing conditions at the PCH bridge at Anaheim Bay,maximum average channel velocities increase from about2.8 ft per sec for maximum spring tides to about 5.0 ft persec for flood flows; Lake 1, Lake 2, and Lake 3 conceptsresult in maximum average channel velocities of 3.0, 3.3, and5.0 ft per sec, respectively; these average channel velocitiesdo not consider spiral flow around bends which may result ingreater localized velocities,
. For existing conditions in Huntington Harbour, maximum averagechannel velocities increase from about 1.5 ft per sec formaximum spring tides to about 3.5 ft per sec for flood flows;Lake 1, Lake 2, and Lake 3 concepts result in maximum averagechannel velocities of 1.7, 2.0, and 3.5 ft per sec, respec-tively,
£. Restrictions caused by Warner Avenue bridge increase maximumaverage channel velocities for existing conditions from 1.6 to11.6 ft per sec; Lake 1, Lake 2, and Lake 3 concepts resultin maximum average velocities of 4.9, 6.5, and 11.4 ft persec, respectively,
. For existing conditions, maximum average channel velocitiesin Outer Bolsa Bay increase from 1.4 ft per sec under normalspring tide conditions to 2.3 ft per sec for flood flows;Lake 1, Lake 2, and Lake 3 concepts provide for maximumaverage channel velocities of 1.7, 1.9, and 2.2 ft per sec,respectively,
e. Scour of soft sediments in Outer Bolsa Bay which may resultfrom increased flow velocities could be prevented by channelstabilization measures at either or both ends of the bay, and
. Maximum average channel velocities in the non-navigableentrance channel at Bolsa Chica for Lake i and Lake 2(6.7 and 8.2 ft per sec, respectively, are of sufficientmagnitude to reestablish design dimensions of the channel.These high velocities may keep the entrance channel open onlya short time; a 100-year opening frequency is not sufficientto prevent closure at other times.
98

Presently existing water quality assessment
72. Three categories of water quality problems presently existing or
potentially arising need to be considered in evaluating impacts of proposed
alternatives to develop and enhance the wetlands of Bolsa Chica. These condi-
tions have been previously addressed in the main report, Report No. 3.
a. Dissolved oxygen standards and criteria are violatedoccasionally in Outer Bolsa Bay, and in the deeper waters ofHuntington Harbour, during the summer months. An additionalocean entrance will provide a source of water with higherdissolved oxygen concentrations. However, additionaldevelopment will potentially increase biological oxygen demandsources to the area (increased vessel wastes and runoff),unless standard control measures are provided.
b. Certain trace metals (lead, zinc, arsenic, and cadmium), andorganic toxicants (chlordane and organochlorine) are detectedin sediments throughout the area. TBT is observed in local-ized portions of Huntington Harbour, but has been prohibitedand should decline in the future. Increased flushing with anadditional ocean entrance will tend to mediate existingsediment problems associated with system toxicants.
. Low flushing in the wetlands has resulted in stagnationconditions in the most interior portions of the wetlands.Primary productivity within the wetlands may be nutrient-limited without sufficient tidal exchange. This situationwill be significantly improved with an additional oceanentrance at Bolsa Chica.
Assessment of Lake Plan transport characteristics
73. DYNTRAN simulations were performed to evaluate the impacts of the
transport and mixing characteristics of Lake 1, Lake 2, and Lake 3 alterna-
tives on water quality in the Huntington Harbour-Bolsa Bay complex. Overall
residence time (water age) was calculate for the whole system, and transport
of runoff from the EGG-WFCC was simulated as the flood channel has previously
been shown to be a major source of toxic materials which are transported into
the wetlands. These simulations only addressed the potential impacts of
circulation changes in the system on water quality. No attempt was made to
estimate the potential increases of pollutant loadings associated with
recreational use increases.
a. The three Lake Plan alternative concepts have no apparentnegative impacts on water age in sensitive areas ofHuntington Harbour.
99

k. Both Lake 1 and Lake 2 concepts provide for significantreductions in water residence times in the existing mutedtidal wetlands (Inner Bolsa Bay) compared to existingconditions. Both also provide for significant reductions inwater age in the proposed wetland enhancement regions at BolsaBay compared to the existing muted tidal wetlands.
c. Lake 3 (entrance channel closed) water age in the proposednew wetland enhancement areas is greater than that presentlyfound within the existing muted tidal wetlands (Inner BolsaBay), indicating water quality in the proposed new wetlandsfor the Lake 3 concept may be slightly degraded relative towater quality of the existing muted tidal wetlands.
d. The Lake Plan alternative concepts provide a very effectivebuffer to the inflow of flood discharge from the EGG-WFCC intothe wetlands. Dilution of this inflow is much greater for allthe Lake Plan configurations than under existing conditions.
Lake 3 perspective
74. The Lake 3 concept assumes that the proposed entrance channel at
Bolsa Chica associated with either the Lake 1 or Lake 2 concept has closed.
Velocities resulting from spring tide conditions will be sufficient to cause
erosion of bottom material under Warner Avenue bridge (up to 4.8 ft per sec),
and in portions of Outer Bolsa Bay (up to 1.7 ft per sec). Stabilization
measures to preclude scouring should be included as part of project construc-
tion.
75. Velocities resulting from the 100-year flood flow under Lake 3
conditions occurring at high spring tide would be excessive from the PCH
bridge at Anaheim Bay through Outer Bolsa Bay, approaching 5.1 ft per sec
under the PCH bridge, 3.5 ft per sec in Huntington Harbour, 11.4 ft per sec
under Warner Avenue bridge, and 2.2 ft per sec in Outer Bolsa Bay. Scour
prevention measures for the bridges, and channel stabilization measures for
Outer Bolsa Bay, should be designed and included as part of project construc-
tion.
76. The probability of the 100-year flood occurring at high spring
tide, with a simultaneous inability to reopen the proposed entrance channel at
Bolsa Chica, is exceedingly low. This situation may be important from the
standpoint of bridge scour, but should be of no concern regarding swimming or
water age. It is possible that heavy rains and flood conditions may follow
high waves which have closed the proposed entrance channel at Bolsa Chica;
hence, closure of the entrance channel and a flood is not an impossible
100

situation. However, the entrance channel could be reopened immediately
following a storm to alleviate excessively high velocities throughout Bolsa
Bay. Even if the 100-year flood occurred and the proposed entrance channel at
Bolsa China were not reopened immediately, scour expected to result from high
velocities could be prevented by various channel stabilization measures
provided as part of project construction.
Summary Conclusions
77. The development of either Lake 1 (350-ft wide entrance channel) or
Lake 2 (200-ft wide entrance channel) new non-navigable entrance channel
system to Bolsa Bay, with associated marinas, full tidal, and muted tidal
wetland enhancement, is feasible from engineering, hydrodynamic, and water
quality standpoints investigated by this study. Any potential for scour
resulting from high velocities near bridges or in Outer Bolsa Bay under the
Lake 3 concept (where the proposed Lake 1 or Lake 2 entrance !hannel at Bolsa
Chica has closed) could be prevented by channel stabilization measures
installed as psrt of project construction. Since the entrance channel could
be reopened immediately following closure by a storm, other related environ-
mental elements such as water age may not be adversely impacted. The Bolsa
Bay complex will provide for multiple public and private uses with an emphasis
on wildlife habitat enhancement, public recreation, coastal access, and water
dependent residential development.
101

REFERENCES
Huruhes, S. -.... S (Jul). Appendix C. "Stability Analysis of Proposed OceanEnLravce C,:- :m s, Bols.i Chica, California," in Gravens, Mark. 1990. BolsaBay, Califor-ia, Proposed Ocean Entrance System Studv; Report , ComprehensiveShoreline Response Computer Simulation, Bolsa Bay, California," MiscellaneousPaper CERC-89-17, US Army Engineer Waterways Experiment Station, Vicksburg, !S.
Moffatt & Nichol, Engineers. 1986 (Oct). "Draft Preliminary Desilting Basin
Design for East Garden Grove-Wintersburg Channel at the Proposed Bolsa ChicaProject," Moffatt & Nichol, Engineers, Long Beach, California. Prepared forSignal Bolsa Corporation, Irvine, CA.
Moore, C. I. and Walton R. 1984 (Oct). "DYNTRAN/TRAN Users Manual," CampDresser & McKee, Inc., Annandale, Virginia. Prepared for SRA Technologies,Inc., Arlington, VA.
Orange County Environmental Management Agency. 1985. "Bolsa Chica Land UsePlan," Local Coastal Program, North Coast Planning Unit, Orange County Boardof Supervisors, Santa Ana, CA.
Orange County Flood Control District. 1986 (Jun). "Orange County HydrologyManual," Santa Ana, CA.
Radovich, R. 1987. "Department of Fish and Game Recommendations for Elementsto be Included in the Corps of Engineers Feasibility Study for Bolsa ChicaOcean Entrance and Alternative Means of Restoring Wetland Resources,"Memorandum to California State Lands Commission, State of CaliforniaResources Agency, Sacramento, CA.
102

APPENDIX A:
EXISTING CONDITION
WATER SURFACE ELEVATIONS

C
U-,
'1#3
ccJco.m3
A2

POSTOFG NODE 5EXISTING CONDITIONS
tj
Cc
Ch~ V
axn 2a.c sia 75.0 1w.0 13s.0 13Jc 175.0 2do0 mo 2ic0 Z"S.TIME, IflS
Figure Al. Tidal elevations in Huntington Harbour
9POSTDFG NODE 10'n EXISTING CONDITIONS
-V P
'
Re
.0 . L . C. =. ~ . o0 M 0 M0V.
TIEHR
FiueA.Tdleeain nHnigo abu
I.A3

POSTOFG NODE 12C! EXISTING CONDITIONS
C1(C0
a
C'J
0.a50 SO A0 I60 L50 L1. k0 200 Z 0 = 0 V.
TIE aR
EI TIG, CNIION
EITIE, CONITON
4A4

POSTOFG NODE 25EXISTING CONDITIONS
c.-
0. j9 S. . ca i o 160 1'0 a - i- 5-TIME HR
FiueA.Tdleeain nHnigo abu
POTCG NDE 2
Figure A5. Tidal elevations in Huntington Harbour
ASTFG NDE 2

POSTDFG NODE 29EXISTING CONDITIONS
0. i0S:A0160 L- SL 7. 0. 30 M. .TIEaR
FiueA.Tdleeaiosi ue os a
POTFG NDE3
EXSIN ODIIN
E -
6. a L U 1A Lm I=A VL d. UV-TIE-HR
FiueA.Tdleeaiosi ue os a
d~A6

POSTDFG NODE 31EXISTING CONDITIONS
Co
,a(o
TIME. HRSFigure A9. Tidal elevations in Outer Bolsa Bay
oPOSTDFG NODE 32- EXISTING CONDITIONS
0
=4-
wI
0.0 .0 S.0 71.0 £16.0 iJ.0 IjO. 1.0 23.0 inm.@ i.0 V1.0
TIME, RSFigure AO. Tidal elevations in Outer Bolsa Bay
A7

POSTOFG NODE 33EXISTING CONDITIONS
P-.
'0.0 2i.0 i-s .A0 IiL 1i" "C.A 1ls0 2.0 2.0 2.0 V3.0TIME, HRS
Figure All. Tidal elevations in Outer Balsa'Bay
POSTOFO NODE 34EXISTING CONDITIONS
R
4.
A A A A A A
0A3 M.5 3.0 4.0 23.0 Liu 13. 1A5.0 ai~ aini 135 V5.0TREf, HRS
Figure A12. Tidal elevations in Inner Bolsa Bay
A8

POSTDFG NODE 45EXISTING CONDITIONS
:IC!
9 P
-JA AA A 84\ 4U.;
V -VVVVVVV
9
Figure A13. Tidal elevations in Inner Bolsa Bay
POSTOFG NODE 50EXISTING CONDITIONS
9
AAA
J,"N fli 7i8 &Wa 11ke miA I4M O M.0TIME, MR~S
Figure A1.4. Tidal elevations. in Inner Bolsa Bay
A9

POSTDFG NOOE 54
6EXISTING CONDITIONS
C!a
- N/I-
S-
.0 ro vA
FigeA A AT e- A c
CA
0.0 5. .o 71.0 1W.o 13.0 IU. 171.0 . "n.o .o VI.oIlE, IRS
Figure Al5. Tidal elevations in DFG muted tidal cell
AIO

APPENDIX B:
EXISTING-CONDITION
AVERAGE CHAN~NEL VELOCITIESZ

00
0.-
C144
-4-4
00 U
0
040v
~0>
Lf) 1 6
M a
4,N
B2

POSTDFG LINK 5EXISTING CONDITIONS
,
0-
2in .0 SLO 7S.0 1M.0 A.0 ILO. xiS.0 2M.0 22.0 2.0 Z5s0TIME, IfiS
Figure Bi. Average channel velocities in Huntington Harbour
POSTDFG LINK 7
EXISTING CONDITIONS
00
0I.
*a.R
0.0 3.0 OLD 7i.0 £i.0 13.0 tiu. A.0 adn.0 .0 2i.0 A'.0TIME, HRS
Figure B2. Average channel velocities in Huntington Harbour
B3

POSTOFG LINK 8EXISTING CONDITIONS
ei-.
,al
No
.
WAmI
TIlE, HSFigure B3. Average channel velocities in Huntington Harbour
POSTDFG LINK 9
EXISTING CONDITIONS
C1AAAAAA A AAA AAAA AAA- I AA
'06. '1 vijv vv v Vvvvvvvilv -Va-
C-7
Figure B4. Average channel velocities in Huntington Harbour
B4

POSTDFG LINK 10EXISTINn CONDITIONS
C.
Figure B5. Average channel velocities in Huntington Harbour
POSTOFG LINK 11EXISTING CONOITIONS
C.
0. A M 10eM iO dO A mOO ZJ AD A
TIME, IfiSFigure B6. Average channel velocities in Huntington Harbour
B5

POSTOFG LINK 12EXISTING CONDITIONS
cn
TIME, MRS
Figure B7. Average channel velocities in Huntington Harbour
POSTOFO LINK 13EXISTING CONOITIONS
TIME, imS
Figure B8. Average channel velocities in Huntington Harbour
B6

POSTOFG LINK ISEXISTING CONDITIONS
Figre 9~ Avrge carel velocities in Huntingto.t Harbour
POSTOPS LINK 16EXISTING CONDITIONS
ULO
-a 05-11L
F i g u e B l . A v r a g e c h a r e l v e l o c i t i e s i n H u n t i n g t o n H a r b o u r
B7

MI OSTDFG LINK 17-~ EXISTING CONDITIONS
W!MI
0,
................. ......
Figre 11.Average channel velocities in Huntington Harbour
V! POSTDPG LINK i8EXISTING CONDITIONS
9.
FiueB2 vrg h R
nn l v l c ti s i u t ng o a b u
UB8

POST""" LINK 20EXISTING CONDITIONS
/9
Figure B13. Average channel Veoite in Huntington Harbour
U! POSTOPG LINK 21EXISTING CONDITIONS
V3.
i u e B 4 v r g h n e e oc t e n H n i g o a b uU89

POTFG LNK21 EXISTING CONDITIONS
Cm
a_
C!~
ta
TIME, HRSFigure B15. Average channel velocities in Huntington Harbour
InPOSTOFG
LINK 24EXISTING CONDITIONS
R
TIME, iRMFigure B16. Average channel velocities in Huntington Harbour
B10

POSTOFO LINK 25EXISTING CONDITIONS
6 21
>c! AAAA
I VVVVVVV
.4
IME, HRSFigure B17. Average channel velocities in Huntington Harbour
POSTOFG LINK 26EXISTING CONDITIONS
C.
0i .0 2LB iA .0 I&A Li AMA3 ADJ 1 3.0J A A.0 p1.0TIME, HRS
Figure B18. Average channel velocities in Huntington Harbour
B1i

POSTOFG LINK 27EXISTING CONDITIONS
0a
,aC.
0.0 2.0 Six A.0 1 6.0 1,2p. 9;.O M0.0 178.0 z0 Z5.DIME, IRS
Figure B19. Average channel velocities in Huntington Harbour
POSTDFG LINK 29EXISTING CONDITIONS
*0
a-.
in
?iPE, NoFigure B20. Average channel velocities in Hunti ngton Harbour
B12
m i n n I I •I lI

POSTOFG LINK 31W! EXISTING CONDITIONS
a-
f-A
W!
-10j 1.0 s.8 75.a ido 12.8 13.0 Ax. 2d.o 2=0 2.0 V 1.0
Figure B21. Average channel velocities in Huntington Harbour
POST0FG LINK 32EXISTING CONDITIONS
0u
AAA AAA .~n~ ZV
-JV V V V V V V -
C,
0.8 3.0 S.8 AUO u3. 4w. 13.8 115.8 xhi =.o 2iu mTIM, HR3
Figure B22. Average channel velocities in Huntington Harbour
B13

POSTOFG LINK 33
EXISTING CONDITIONS
in
0j0 5.5 m.D 75.0 I.0 21.0 iuJ A075.0 2i.0 2i.0 ZA.0TIME, IfiS
Figure B23. Average channel velocities in Huntington Harbour
POSTDFG LINK 34U, EXISTING CONDITIONS
0. i ma-ea, R
FiueB4 vrg hanlvlctenerWre vnebig
B1

POSTOFG LINK 35EXISTING CONDITIONS
00
0-
UV
0l-
0i-
C!
0.0 5.0 3.1 A.0 13.0 =A. A 17V'.0 in.0 =A M. V.TIMD HS
Figure B2. Average channel velocities in Outer Bolsa Bay
POSOFG LIN13

POSTOFG LINK 37
EXISTING CONOITIONS
o I
TIME, MRS
Figure B27. Average channel velocities in Outer Bolsa Bay
POSTOFG LINK 38EXISTING CONDITIONS
N N(I a
~B16

APPENDIX C:
LAKE 1
350-FT NON-NAVIGABLE ENTRANCE CHANNEL
WATER SURFACE ELEVATIONS

C40C14 en
cen))Oo-i
020

LAKEI NODE 5
o WETLANDS NOT CONNECTED
L.
U
0
Li'
0.0 5.0 50. 0 7.0 100.0 12,.0 150.0 17A.0 200.0 Z.0 250. 0 A.0TIMlE, HRS
Figure Cl. Tidal elevations in Huntington Harbour,350-ft non-navigable entrance channel
LAKEI NODE 10WETLANDS NOT CONNECTED
L'
2.
L.
0
940pLi.0 50 5. 50 1. 2 S. ;. O 250 200 A
TIE v RSFiur C2 ia lvain nHnintnHror
350-tnon-nvigbeetac hne
ciC3

LAKE1 NODE 12WETLANDS NOT CONNECTED
-3U
VLi I \ V
0)
z.V7
0.0 2i.0 5 0 A. 07 10.0 1j5.0 15.0 1 7.0 2 .0 2 2.0 S . .Figure C3. Tidal elevations in Huntington Harbour,350-ft non-navigable entrance channel
LAKEl NODE 23WETLANDS NOT CONNECTED
U1
U
LO.0
Li
0. 50 S. j0 160 160 1 . A0 9 . i0 2 O 3 .TIE,'R
FiueC.Tdleeainsi utntnHror
35Utnnnaial nrac hne
0C

LAKEI NODE 25WETLANDS NOT CONNECTED
V
ro
C.0
TIME, HRS3Figure C5. Tidal elevations in Huntington Ha rbour,
350-ft non-navigable entrance channel
LAKE1 NODE 28
9
- WETLANDS NOT CONNECTED
V
l. ,
I.-
U ,
TIMEC, HRSFigure C. Tidal elevtion in Huntington Harbour,
350-ft non-navigable entrance channel
C5

LAKE 1 NODE 29WETLANDS NOT CONNECTED
-Jcc~2Ca
()0 2. 60 7. r. A0 4 0 1. N. A0 200 V.T M- R
L.J
C-,(,a
CC~
9~
9'0. i0 5. i0 16. i. -. ;. 300 Z . d- ;-
TIEaR
FiueC.Tdl1lvtosi OtrBlaBy
05-tnnnvgbeetac hne
aC

LAKE 1 NODE 31
WETLANDS NOT CONNECTED
A' A
Li
0
0P
A. . 00 7.0 100.0 Ci25.0 1!50.0 17A.0 200.0 2i.0 250.0 27S.0TIME, HRS
Figure C9. Tidal elevations in Outer Bolsa Bay,350-ft non-navigable entrance channel
LAKEl NODE 32WETLANDS NOT CONNECTED
r 7
'.
CC -
0.0 25.0 !G.0 75.0 100.0 :25.0 110.0 175.0 200.0 z.0 250.0 275.0TItME, HRS
Figure C1O. Tidal elevations in outer Bolsa Bay,350-ft non-navigable entrance channel
C7

LAKE1 NODE 33WETLANDS NOT CONNECTED
U" VA/,A A
U ,
I-
._T
o
07.
0.0 25.0 50.0 75.0 100.0 125.0 150.0 1A5.0 Z0.0 221.0 27.0TIME, HRS
Figure Cll. Tidal elevations in entrance to proposed marina,350-ft non-navigable entrance channel
LAKEI NODE 35WETLANDS NOT CONNECTED
E-0ro
T" I ME'R
I.-
-
Li.
Figure C12. Tidal elevations in Outer Bolsa Bay,350-ft non-navigable entrance channel
C8

LAKEI NODE 37WETLANDS NOT CONNECTED
U_J
w A'AAA AAAA A AAA,-, i VV V VV VV TVV- Vv VVV n,, V v "/croL
L"I
I-C
I I
0.0 25.0 50.0 75.0 100.0 125.0 150.0 175.0 200.0 225.0 250.0 27n.0TIME, HRS
Figure C13. Tidal elevations in Inner Bolsa Bay,350-ft non-navigable entrance channel
LAKE1 NODE 45WETLANDS NOT CONNECTED
C
C
-J
-o AA AAAA AAU d
,..,V "V V V V V VV V VV VvVV VV Vv V " Vcr
U,.
I-
0.0 25.0 0.0 .o 75o. i.o .o , .o 17. .o 2i.o zi.o 2. s.oTIME, MRS
Figure C14. Tidal elevations in Inner Bolsa Bay,350-ft non-navigable entrance channel
C9

LAKEl NODE 50WETLRNOS NOT CONNECTED
65
ro
.
(n
LI
I-
a. n
0
20
,"
0.0 2i.0 S0.0 A5.0 100.0 22A.0 450.0 A75. 206.0 225.0 250.0 V5s.0
TIME, HRS
Figure C1. Tidal elevations in Inner Bolsa Bay,350-ft non-navigable entrance channel
LAKE1 NODE 54o WETLAN0S NOT CONNECTED
0
- AAA.,A
-- A A
oA.0.Li0 o o 1 . o ,~ 0 . 0,. .
-~ A AII A ARIFiue06 ia eeLin nDG ue ia el
35-Unnna'0 l nrac hne
Li'O

LAKE1 NODE 74WETLANDS NOT CONNECTED
0
- J . i 0 S . i 1 0 0 1 ' . . 7 5 0 2 o . ' o 2 6 o ' 7 .TIEHR
(EJd 1A,
0
9
'0.0 A5.0 56.0 A5.0 100.0 125.0 150.0 175.0 X.0 225.0 2i0.0 275.0TINEC, HRS
Figure C18. Tidal elevations in pacificd Ocan,drivitnnAnaeig ayl entrance channel
LAKE1 NOE 7

LAKE1 NODE 90WETLANDS NOT CONNECTED
0
0
U,Lj
0
I.-crc
0.0 25.0 5.0 A .0 1o .o 1A .0 156.0 1A.0 ; .0 Z .o 25.0 A-0TIME, HR
Figure C19. Tidal elevations in proposed marina,350-ft non-navigable entrance channel
LA::KE 1 NODE 91
C-
l WETLANDS NOT CONNECTED
0.0 2.0 S0.0 75.0 100.0 1.0 150.0 17A.0 200.0 23.0 250.0 2750
T I ME, MRS
Fiur 20 Tdl leaos n350-ft non-navigable entrance channel
U'C
.H
.-J
U,-
L.
T\]Vy\IIIVVV
I-I

LAKE1 NODE 97WETLANDS NOT CONNECTED
C
FJ
@0
=Vo
Ca
I,d
U 0
I.-
0.0 25.0 50.0 75.0 100.0 Ii5.0 150.0 175.0 200.0 225.0 250.0 2;S.0
TIl E, HRS
Figure C2l. Tidal elevations in full tidal wetlands,350-ft non-navigable entrance channel
LAKE C NODE 102o - WETLAINDS NOT CONNECTED
0
La
"-0
0L,.-
CL-
o0.
Ca1

LAKE1 NODE 112
a
WETLNDSNOT CONNECTED
0
.o 2 . 0 5 . 0 7 . 0 , . 0 1 2 . 0 4i . 0 , A . G 2 C . 0 2i . 0 2 .o A -0TIME,
Figure C23. Tidal elevations in full tidal wetlands,350-it non-navigable entrance channel
LRKE1 NODE 113° - WETLANDS NOT CONNECTED
oV
0
0
0.0 2i.o 0.o . 1i.o 1,s.0 ii.0 27.o 200.o 2.o 250.o 5.oTIME, HRS
Figure C24. Tidal elevations in full tidal wetlands,350-ft non-navigable entrance channel
C14

aLAKE: NODE 117WETLANDS NOT CONNECTED9
TC,,0R 50
U,0n0
a 00 7. ~ * 2. S . 0 M. n o 2 0. 0 V .TIME, tRFigure C2. Tidal elevation in muted tidal wetlands,350-ft n-navigable entrance channel
o L R K E 1N O DEC1 2

a LAKE1 NODE 129WETLANDS NOT CONNECTED
a
-J
LJ V A AAAAAAAAAAAAAAAU1 V v VVVVVVVVVVVVV
C.-I-
a
W_ T
M
a
C.,
C!
0.o 3.o 50.0 75.o 100.o 13.0 150.0 I5.0 200.0 2A.0 20.0 25.0TIME, HR5
Figure C27. Tidal elevations in muted tidal wetlands,350-ft non-navigable entrance channel
o LAKEl NOOE 132WETLANDS NOT CONNECTED
ro
N
IR AA AA A A A A A A, =~ ~~ ~~ V v vv vVv vV v v V-
C1.
1.j
oa . . . i o , . i , , . . ' . .TIa'14
91.6

LAKE1 NODE 140WETLAND5 NOT CONNECTED
-J
U V=7
am
tn.
0
Lj
T IME, HRS
Figure C29. Tidal elevations in Pacific Ocean,driving 350-ft non-navigable entrance channel
C17

C18

APPENDIX D:
350-FT NON-NAVIGABLE ENTRANCE CHANNEL
AVERAGE CHANNEL VELOCITIES

I'loaI
cc -
r- %0 6- t- C
D2D

L19KEI LINK 5WETLANDS NOT CONNECTED
C-j
10.0 250 50.0 75.0 100.0 1A.0 150.0 173.0 200.0 225.0 250.0 27.0TIME, IIRS
Figure Dl. Average channel velocities in Huntington Harbour,350-ft non-navigable entrance channel
LAKE1 LINK 7
In WETLANDS NOT CONNECTED
0
T III, R
FiueD.Aeaecanlvloiisi0utntnHror
Figure0-f D2.nvgal Averagce channelveoiis nHutgonaru,
D3
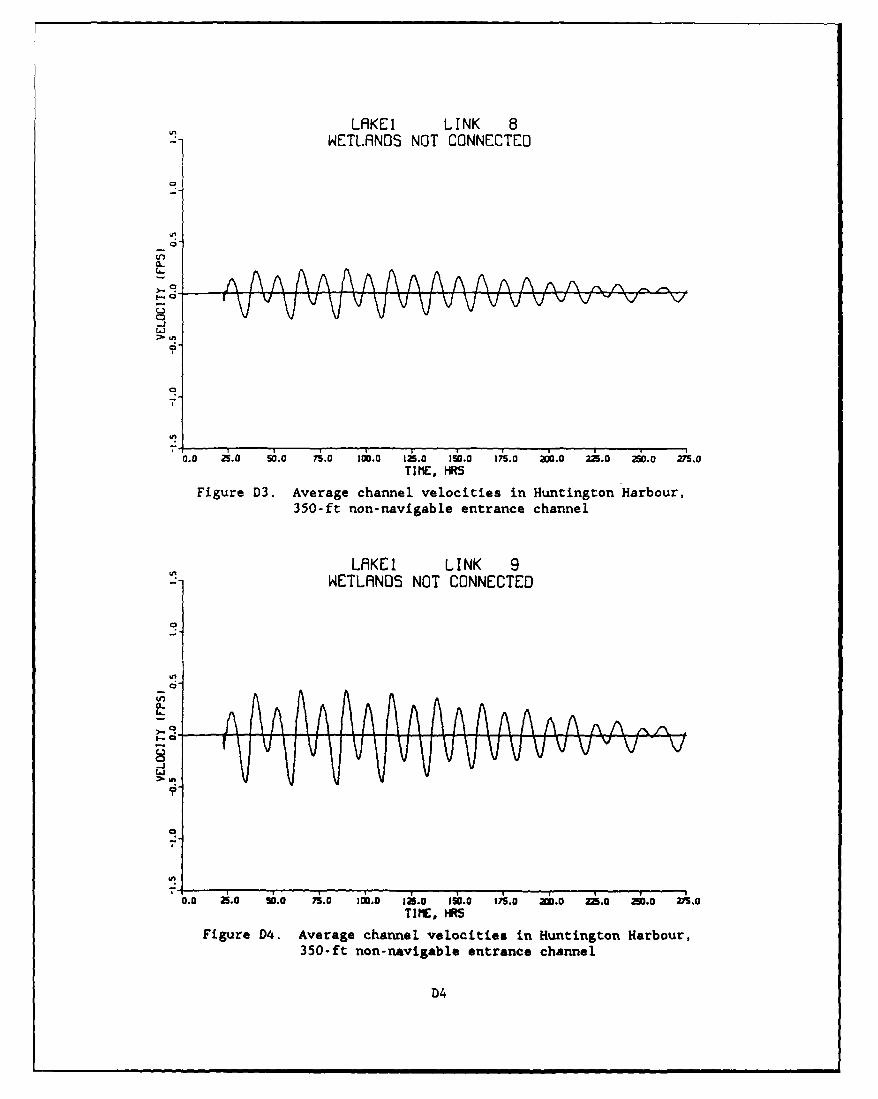
LAKE1 LINK 8WETLANOS NOT CONNECTED
a
',,!0"
a-
0.0 3i.0 50.0 7A.0 100.0 13.0 156.0 1A.0 200.0 25. 0 250.0 '275.
TIME., ,RS
Figure D3. Average channel velocities in Huntington Harbour,350-ft non-navigable entrance channel
L9KEI LINK 9WETLANOS NOT CONNECTED
a
in
0.0 2i.0 50.0 A.0 200.0 Ii.0 45.0 175S.0 300.0 25.0 A50.0 2Z5.GT I ME, FIRS
Figure D4. Average channel velocities in Huntington Harbour,350-ft non-navigable entrance channel
D4
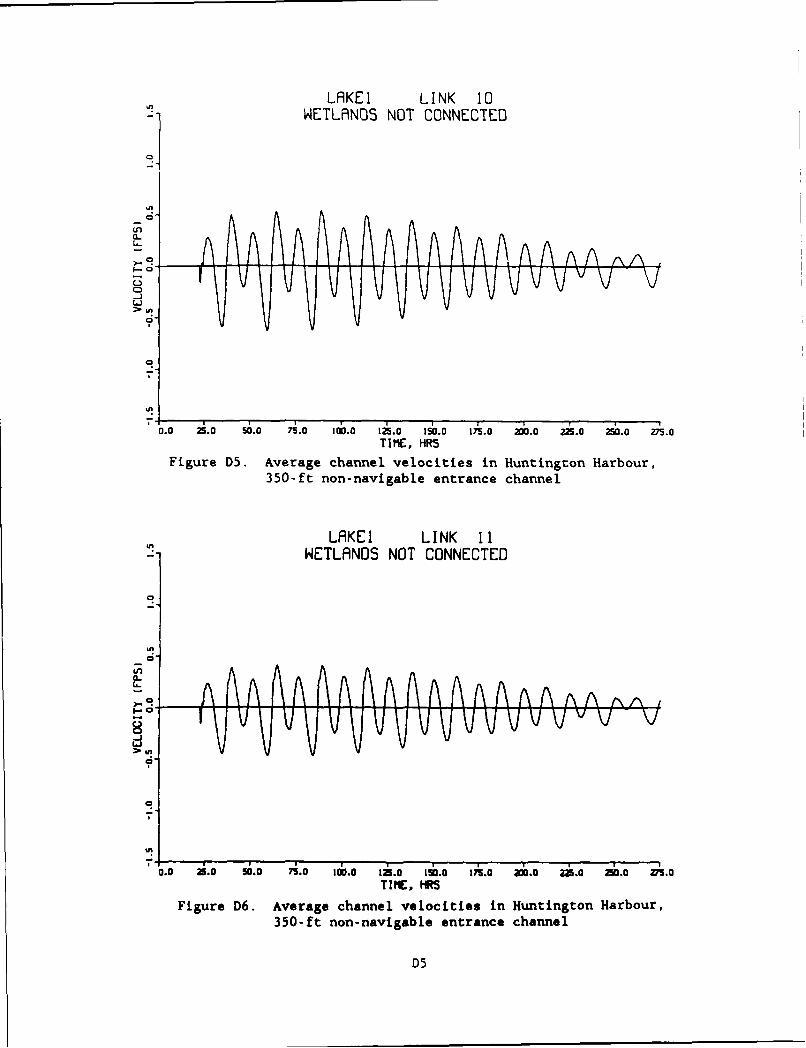
LAKE1 LINK 10WETLaNOS NOT CONNECTED
a
-1
0.0 2i.0 50.0 7A.0 100.0 125.0 150.0 175.0 2.0 23.0 250.0 A5.0TIM'E, HRS
Figure D5. Average channel velocities in Huntington Harbour,350-ft non-navigable entrance channel
LAKEI LINK 11WETL9NOS NOT CONNECTED
0
9_
U!0"
'A
0.0 25.0 !50.0 75.0 106.0 125.0 156.0 1A1.0 A0.0 225.0 250 V1.0
TIME, HRSFigure D6. Average channel velocities in Huntington Harbour,
350-ft non-navigable entrance channel
D5
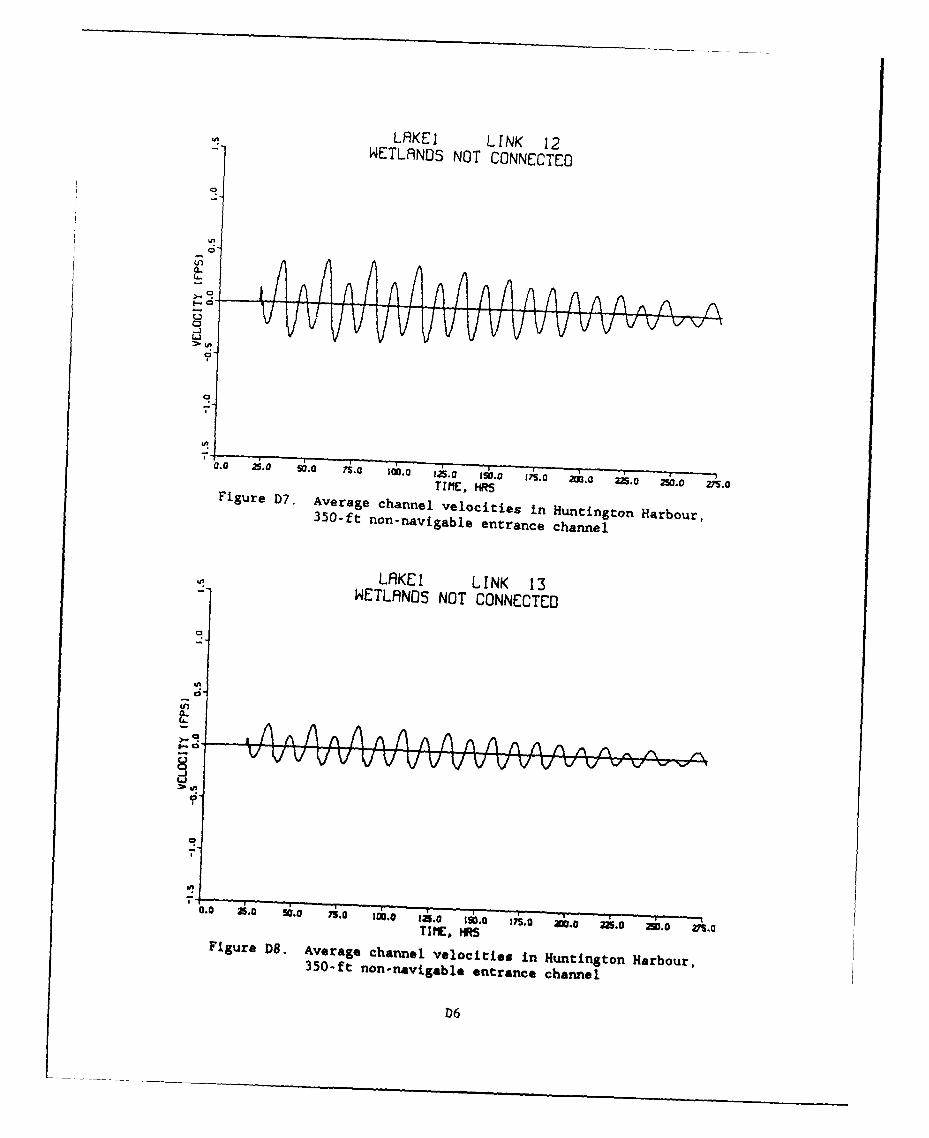
In LRKEI LINK 12WETLANOS NOT CONNECTED
0"
Cn
C?
2S0 .0 50.0 75.0 1000 2.0 156.0 17S.0 max 25.0a 300 7 m 0TI ME, MRSFigure D7. Average channel velocities in Huntington Harbour,350-ft non-navigable entrance channel
9LAKE1 LINK 13WETL9NOS NOT CONNECTED
E
L?
7
0.0 3.0 50.0 A5.0 100.0 Ii.010. 350 i0-0 Zio 25'0 V5.GTItME, MRSFigure D8. Average channel velocities in Huntington Harbour,
350-ft non-navigable entrance channel
D6
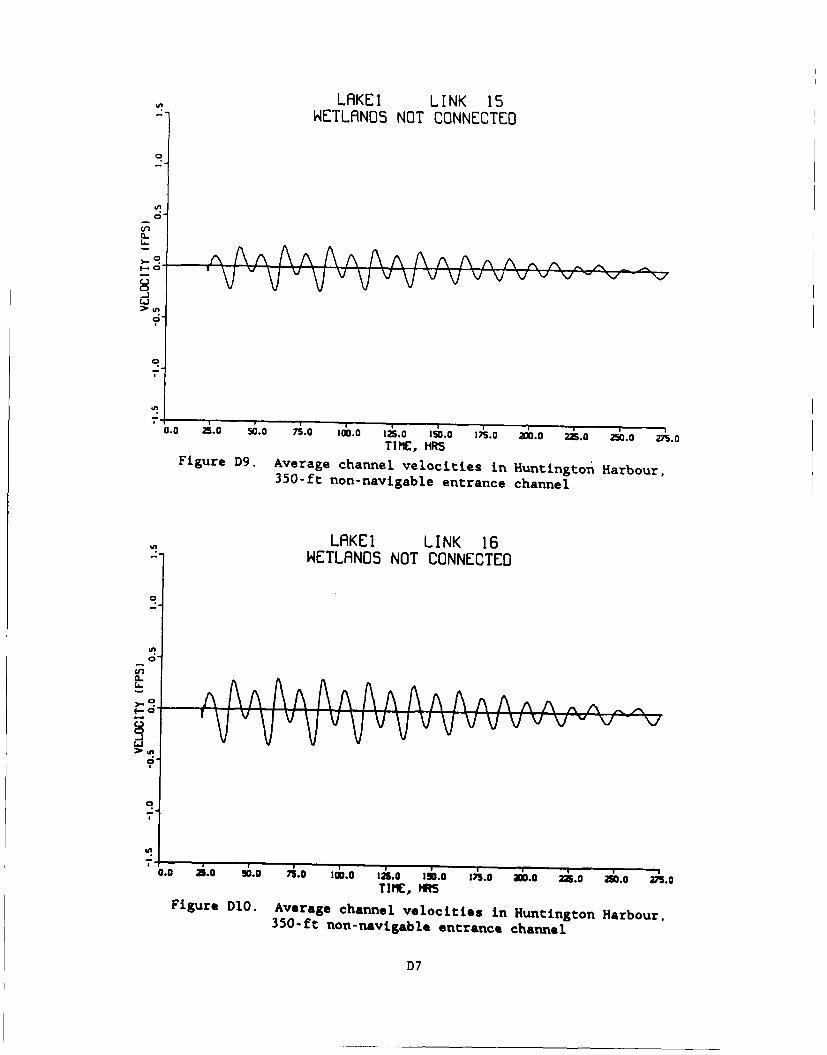
LAKEI LINK 15WETLANDS NOT CONNECTED
CL
U'
i I
0.0 2i.0 50.0 7i.0 100.0 125.0 150.0 1A5.0 200.0 225.0 250.0 27S.0TIME, lIRS
Figure D9. Average channel velocities in Huntington Harbour,350-ft non-navigable entrance channel
LAKEI LINK 16WETLANDS NOT CONNECTED
9 AA A A / \/n ,4
0.
.
I
0.0 A5.0 5;. 7.0 100.0 125.0 150.0 271.S .0 0 2.0 0 M5.0 V.TIME, HRS
Figure D10. Average channel velocities in Huntington Harbour,350-ft non-navigable entrance channel
D7

L9KEI LINK 17WETLANDS NOT CONNECTED
CV
a
C,-
0-.
U,~g0.0 2i.0 S6.0 7i.0 100.0 125.0 150.0 17s. 0 2d0.0 2A..0 250.0 275.0
T IME, HRS
Figure DlI. Average channel velocities in Huntington Harbour,350-ft non-navigable entrance channel
LAKEI LINK 18WETLANDS NOT CONNECTED
aA
.-
0
0-
10.0 25.0 50.0 7A.0 I00.0 1A5.0 196.0 1A1.0 206.0 225.0 250.0 WS.0
TIME, MRS
Figure D12. Average channel velocities in Huntington Harbour,350-ft non-navigable entrance channel
D8

LAKEl1 LINK 20WETLANDS NOT CONNECT[D
9i.
0.0 25.0 S0.0 7i.0 100.0 225.0 45.0 175.0 200.0 2kG 250.0 A5.0TIME, HRS
Figure D13. Average channel velocities in Huntington Harbour,350-ft non-navigable entrance channel
LAKEI LINK 21WETLANDS NOT CONNECTED
t:0V V V V V
in
0.0 2i.0 50.0 75.0 106.0 1j5.0 236.0 275.0 inO.o 2i.0 2iO.0 2iS.0
TIME, HRS
Figure D14. Average channel velocities in Huntington Harbour,350-ft non-navigable entrance channel
D9

LAKE 1 LINK 23WETLANDS NOT CONNECTED
-J
10.0 2j.0 50.0 7A.0 106.0 1A.0 I50.0 17A.0 2 0.0 225.0 250.0 2A.0TIME, HRS
Figure Dl5. Average channel velocities in Huntington Harbour,350-ft non-navigable entrance channel
LAKE1 LINK 21WETLANDS NOT CONNECTED
9_
Ln
10.0 A5.0 50.0 75.0 100.0 125.0 150.0 175.0 200.0 i.a 25.0 mi.oT IME, MRS
Figure D16. Average channel velocities in Huntington Harbour,350-ft non-navigable entrance channel
D10

LAKEl LINK 25WETLANDS NOT CONNECTED
0-
6'-
0.0 25.o 50.0 A5.0 100.0 125.0 150.0 175.0 200.0 225.0 Z.Q p5.0
T I ME, HRSFigure D17. Average channel velocities in Huntington Harbour,
350-ft non-navigable entrance channel
LAKEI LINK 26WETLANDS NOT CONNECTED
n0
0o.0 2i.0 50.0 71.0 ic6.0 125.0 i50.o Ax. 2;;.0 zi.o zi0.0 p1.0
TI ME, HRS
Figure D18. Average channel velocities in Huntington Harbour,350-ft non-navigable entrance channel
Dl1

LAKEI LINK 27WETLRNDS NOT CONNECTED
0
L-
_ : Vvvvvvvvvvvvv vv - v -U,.
C3
0
C3
0.0 25.0 50.0 .0 100.0 125.0 1.0 17.0 200.0 2Z.0 25.0 2 .0TIME, HRS
Figure D19. Average channel velocities in Huntington Harbour,
350-ft non-navigable entrance channel
LAKEl LINK 29WETLANDS NOT CONNECTED
0
Figure D20 Avrg channel VV vlcte in HuntingtonHarbou--
TIE
350-ft non-navigable entrance channel
D12

LAKEI LINK 31WETLANDS NOT CONNECTED
Ln
0.
,-
.J -
Figure D21. Average channel velocities in Huntington Harbour,350- ft non-navigable entrance channel
LRKE1 LINK 32-- WETLANDS NOT CONNECTED
0-
(n
U,
.
0 . !.o .o 7.0 10.0 ,,.o ,50.0 17A.0 30.0 2.o 2o.o 2n.0TIM, HRS
Figure D22. Average channel velocities in Huntington Harbour,350-ft non-navigable entrance channel
D13

LAKE1 LINK 33WETLANDS NOT CONNECTEO
Li
U,
kA
00 .0 0. .0 1M0.0 125.0 150.0 175.0 200.0 2i.0 2i0.Q 27.0T IME, HRS
Figure D23. Average channel velocities in Huntington Harbour,350-ft non-navigable entrance channel
LAKEI LINK 34WETLANDS NOT CONNECTED
i
1D14

W! LAKE I LINK 35WETLRNOS NOT CONNECTEO
0
C-
F i g u r D 2 5.o A v e r a g c5 .T3IM ,.S Z 5 . 0 250 .o 0 7 .Figur D25 Ave age hannel velocities in Outer Bolsa Bay,350-ft non-navigable
entrance channel
LAKE I LINK 36~1WETLANOS
NOT ONCE
aT
0. 5. .....
In~0 30 5.0 -300.0
1~a 50.0T HEkRS 17. 0. 30 .0 V73.0
Figure D26. Average channel velocities in Outer Bolsa Bay,350.ft non-navigable
entrance channel
D15

LAKEI LINK 37WETLANDS NOT CONNECTED
0
0"
I.--
ci
0.0 25. 0 10.0 7A.0 100.0 1A.0 150.0 175.0 20.0 225.0 250.0 275.0
TIME, HRS
Figure D27. Average channel velocities in Outer Bolsa Bay,
350-ft non-navigable entrance channel
LAKE1 LINK 38WETLANOS NOT CONNECTED
0
I"
0.0 n.0 50.0 71.0 100.0 1.0 4.0 1A.0 Z.0 Z.0 2;0.0 5.0
TIME, HRS
Figure D28. Average channel velocities in Outer Bolsa Bay,
350-ft non-navigable entrance channel
D16

LAKEI LINK 85WETLAND3 NOT CONNECTED
U,
Q- V
.
0
-J
U1
0
0
10. 0 2i.0 10.0 7A.0 100.0 125.0 150.0 175.0 2 0.0 221.0 210.0 275.0
TIME, HRS
Figure D29. Average channel velocities in proposed marina,
350-ft non-navigable entrance channel
LAKE1 LINK 95WETLA9NDS NOT CONNECTED
0
C..
I-V V
in
,-
10.0 2i.0 50.0 A5.0 106.0 121.0 110.0 175.0 200.0 2.0 210.0 275.0
T IMPE, HRS
Figure D30. Average channel velocities in proposed marina,350-ft non-navigable entrance channel
D17

LRKEI LINK 109WETLANOS NOT CONNECTED
U,
C
LJ
0
0.0 .O 50.0 7j.0 w0o.0 ia5.0 150.0 175.0 ZW.0 2dS.0 2i0.O 2i.0TiI MC, MRS
Figure D31. Average channel velocities in proposed entrance channel,350-ft non-navigable entrance channel
LAKEI LINK 148WETLANOS NOT CONNECTED
A A
C.-
TI ME, HRS
Figure D32. Average channel velocities in proposed miarina,350-ft -in-navigable entrance channel
D18

APPENDIX E:
200-FT NON-NAVIGABLE ENTRANCE CHANNEL
WATER SURFACE ELEVATIONS

P-4
e4- 0 m
0 m
E2

LAKE2 NODE 50i WETLANDS NOT CONNECTED
L,
CC0
C',
E-.o
tLJ
0
cc
C-
TIME, HR5
Figure El. Tidal elevations in Huntington Harbour,200-ft non-navigable entrance channel
LRKE2 NODE 10o WETLR9NDS NOT CONNECTED
U.
C 0LI'
I -
0
m
,'.
0.0 2.0 50.0 75.0 100.0 125.0 150.0 175.0 200.0 225.0 250.0 2A.0
TIME, HRSFigure E2. Tidal elevations in Huntington Harbour,
200-ft non-navigable entrance channel
E3

LAKE2 NODE 12WETLNDSNOT CONNECTED
CE0
r T
(.J
0
0. i0 5. . d. 2. 160 1 .U- d - .
(J6
U-
z J6
0.0 25.0 50.0 A5.0 100.0 123.0 15.0 175.0 2M0.0 Z.0 250.0 V.TIME, HRS
Figure E. Tidal elevations in Huntington Harbour,200-ft non-navigable entrance channel
LAKE NOEE2

LAKE2 NODE 25n WETLANDS NOT CONNECTED
U
CC0
CC-
9
0. 50 5. .U,0 1 . . A0 C. O 200 .TIE0R
FiueE.Tia lvton nHnignHror
CC0E n. ' _ _ _ _ _ _ _ _ _ _ _ _ _ _ _ _ _ _ _ _ _ _ _w 7 V
0. 50 5. 50 1.0 150 100 150A. 2. 5. 7.
U,
I-CCm0
9
6. iosI A 6o iso 4. ixm. iso 2oo 2s
0IE R
FiueE.Tia lvton nHnigtnHror
00-tnnnvgbeetac hne
L~E5

LAKE2 NODE 29WETLANDS NOT CONNECTED
-I ' AA AA A73
U
ro
C-.
CC0
6-1 I. v vv0
C 0Li
;.-
0.0 2i.0 50.0 7.0 100.0 125.0 150.0 17S.0 290.0 225.0 250.0 27.0TIME, HRS
Figure E7. Tidal elevations in Outer Bolsa Bay,200-ft non-navigable entrance channel
LRKE2 NODE 30WETLANDS NOT CONNECTED
V
0
I-o
w 70
('.
0"IME , ,
a
U,
Figure E8. Tidal elevations in Outer Bolsa Bay,
200-it non-navigable entrance channel
E6

LAKE2 NODE 31WETLANOS NOT CONNECTED
0A
-Jr A
UCr 0 Vv V vV Vw 7I-
o
LO.C:,.0
Ll
0. 25. 51. A- 1d. i. 1i. 1A. 2C. 2250 26. 7S
TIME, RFigure E9. Tidal elevations in Outer Bolsa Bay,
200-ft non-navigable entrance channel
LAKE2 NONE 32- WETILANDS NOT CONNECTED
L.J
U 0
1.
o
I-
I.
0
0.0 25.0 50.0 7.0 10o.0 125.0 150.0 1A.0 200.0 26s.0 250.o 275.0TI ME, HRS
Figure E10. Tidal elevations in Outer Bolsa Bay,200-ft non-navigable entrance channel
E7

LAKE2 NODE 33oWETLANDS NOT CONNECTED
CC0
-I. A AAU,
F--
re-
.
0
TIME, HR
Figure Ell. Tidal elevations in entrance to proposed marina,200-ft non-navigable entrance channel
LAKE2 NODE 35o - WETLANDS NOT CONNECTED
=
Q_ V
a
T 4
.0 2. O A0 106.0 1A5.0 150.0 1A.0 225 0 ad.0 250.0 A7.0I ME R
Figure Eli . Tidal elevations in ntanert poosed marina200-ft non-navigable entrance channel
-JE
U,"
I-
a~ . o o , o , o io ,~ . . ,. .
TLiHI
FiueE2 ia lvtin nOtralaBy20-Lnnnalal nrac hne
=E

° LAKE2 NODE 37WETLANDS NOT CONNECTED
0
-JC1',roI-
- A
° " V" Vv VV VV VV VvV V v v v VL)
Licrc
9
I--
T.
0.0 2.0 S.0 7.0 ,00.0 125.o 150.0 175.0 0.0 25.o 30.0 A .oTIME, HRS
Figure E13. Tidal elevations in Inner Bolsa Bay,200-ft non-navigable entrance channel
LAKE2 NODE 45WETL9NOS NOT CONNECTED
0
-J A AAAAA AAAALJ i 4 ,, 8 ^ /\ Z\AA,Li V" VV VV VV VV VvV VV vv 'V-
Cr0
cr 7a'dI--
U)0Li
0
i.T
Li
C.)
T IME, HRSFigure E14. Tidal elevations in Inner Bolsa Bay,
200-ft non-navigable entrance channel
E9

LAKE2 NODE 50WETLANDS NOT CONNECTED
=0-. I-~
-JF_
0.0 2S.0 50.0 75.0 300.0 235.0 156.0 375.0 200.0 23.0 250.0 A7.0
TIME, HRS
Figure El5. Tidal elevations in Inner Balsa Bay,200-ft non-navigable entrance channel
LAKE2 NODE 54a WETLANDS NOT CONNECTED
U'
E- '
cr 7
0.0 25.0 50.0 7i.0 200.0 136.0 I50.0 275.0 200.0 23.0 30 .0 27.0
T I ME, HRS
Figure E16. Tidal elevations in DFG muted tidal cell,200-ft non-navigable entrance channel
E10

LAKE2 NODE 74
WETLANDS NOT CONNECTED
U1
Li
ULiLC 6cr0
Cr
0V
0.0 25.0 50.0 75.0 100.0 1 . 0 150.0 17.0 200 .0 23.0 250.0 27.
TIME, HRS
Figure E17. Tidal elevations in Pacific Ocean,driving Anaheim Bay entrance channel
LAKE2 NODE 770n WETLANDS NOT CONNECTED9n
"z 4
I-0c
,3( ;0 5. .L. i.0 160 ls0i00 Z . 5.
TIE R
FiueE8 Tdleeaiosi rpoe.aia
00-tnnnvgbeetac hne
LEl

LAKE2 NODE 90WELAD NOT CONNECTED
CC0
-J
CC
Xi
r -0- T7a.) 2. 00 7. 000 150 100 150 6. 2. 5. .
CR
73.q(n,
0J
0o A
V
0.0 ~ ~ ~ ~ ~ V 3. V007. 0. 2. 5. 7. 50200p.cr.E HR
Cc0
T I EHR
EE1

LAKE2 NODE 97WETLANDS NOT CONNECTED
0
0
-J
I- -
Li
C.
:. .0 56.0 7.0 106.0 1250 156 0 17'5. 2 .0 .o 2 .o A .o
TIME, R
Figure E21. Tidal elevations in full tidal wetlands,200-ft non-navigable entrance channel
LAKE2 NODE 102WETLANDS NOT CONNECTED
0
-J AA
'g.
c.
0
UJ
TIME, HRSFigure E22. Tidal elvations in full tidal wetlands,
200-ft non-navigable entrance channel
E13

LAKE2 NODE 112In- WETLANDS NOT CONNECTEDa
0
-J
ro
0
TIME:, R
Figure E23. Tidal elevations in full tidal wetlands,
200-ft non-navigable entrance channel
LAKE2 NODE 11!3VV_ WETLANDS NOT CONNECTED
-.J.
a
CC
I - o
a
0
0.0 2.0 50.0 A.0 1I.0 1A.0 50.0 175.0 .00.0 -m.o 30.o 275.0
TIME. HRS
Figure E24. Tidal elevations in full tidal wetlands,
200-ft non-navigable entrance channel
E14

LAKE2 NODE 117WETLANDS NOT CONNECTED
Cj
CC0
U:3
I.-
Cc,
0.0 25.0 50.0 75.0 300.0 125.0 350.0 175.0 200.0 235.0 2S0.0 275.0T ItME, HRS
Figure E25. Tidal elevations in muted tidal wetlands,200-ft nan-navigable entrance channel
LFIKE2 NODE 123WETLANDS NOT CONNECTED
-J
ro7
I-
0.0 2i.0 50.0 71.0 100.0 13S.0 350.0 1.0 206.0 23.0 j0.0 A7.0
T I ME, MRiS
Figure E26. Tidal elevations in muted tidal wetlands,200-ft non-navigable entrance channel
E15

LAKE2 NODE 129WETLANDS NOT CONNECTED
R
U
L.I-
7,
0.0 25.0 5.0 A1.0 100.0 125.0 150.0 17A.0 206.0 225.0 250.0 27S.0T I M, HRS
Figure E27. Tidal elevations in muted tidal wetlands,200-ft non-navigable entrance channel
LR9KE2 NODE 132WETLANDS NOT CONNECTED
0:4
0. 250 i . 0. 40 4. '0.,. i0 d.0 V.
TIEHR
FiueE8 ia eeain nmte ia elns
N0-tnnnvgbeetac hne
CE1-

LAKE2 NODE 140WETLRNOS NOT CONNECTED
0
U_
Li
Li.F0
Li
0. 5 0 S - S 0 IO 0 1 . 5 . 7 .U. A 0V .
TIE=RFiueE9Uia lvtin nPcfcOendrvn00-tnnnvgbeetac hne
LE1

E18

APPENDIX F:
200-FT NON-NAVIGABLE ENTRANCE CHANNEL
AVERAGE CHANNEL VELOCITIES

co -
000
coz
C
F2

LAKE2 LINK 5WETLANDS NOT CONNECTED
U?
090-
U,
a-
Li
'0.0 2g.0 50.0 7;. 0 100.0 13.0 150.0 175.0 . 0 225. 0 3 0.0 2A. 0TIME, HRS
Figure Fl. Average channel velocities in Huntington Harbour,200-ft non-navigable entrance channel
LAKE2 LINK 7WETLANDS NOT CONNECTED
60
0. . 00 7. CUO 160 160 1 .,. 2. 5. 7.
T0 E R
FiueF.Aeaecanlvloiisi utntnHror
200tnnnaial nrac hne
F0

LAKE2 LINK 8U% WETLANDS NOT CONNECTED
0-
n
0.0 25.0 50.0 7A.0 100.0 125.0 45.0 17S.0 2 0.0 Z.0 250.0 2A.0
TIMlE, HRS
Figure F3. Average channel velocities in Huntington Harbour,
200-ft nan-navigable entrance channel
LAKE2 LINK 9U?_ WETLANDS NOT CONNECTED
CL
0.0 2i.0 50.0 75.0 100.0 15s.0 4.0 175. 200.0 z.o 250.0 273.0TIME, WS
Figure F4. Average channel velocities in Huntington Harbour,200-ft non-navigable entrance channel
F4

LAKE2 LINK 1OWETLANDS NOT CONNECTED
°V V v V V V -V,
C
1~ 10 .1 2 5. rj.G 7.a iao.O 1A.0 4s.0 A~.,3 2 .0 25.0 250.0 M.0TIME, HRS
Figure F5. Average channel velocities in Huntington Harbour,200-ft non-navigable entrance channel
LAKE2 LINK 11WETLANDS NOT CONNECTED
C
0.0 25.0a 50.0 A5.0 100.0 1A.0 45.0 1A5.0 20.0 225.0 250.0 VS.OT IME, FIRS
Figure F6. Average channel velocities in Huntington Harbour,200-ft non-navigable entrance channel
F 5

LflKE2 LINK 12WETLRNOS NOT CONNCCTED
7,
V!
Figre ?. verge channel 'velocities in Huntington
Harbour,
200-ft fonnavigable entrance channel
U? LflKC2 LINK 1i9LFNDS NOT CONNECTED
2S 50.0 7.0 100.0 s ~ V~ o
Figue P8 Average channel. velocities in Huntington Harbour,
200-ft floflnavigable entrance channel
F 6

LAKE2 LINK 15WETLANDS NOT CONNECTED
C
r.: ,A AA A AAA A A A A , . ..C.
0.0 25.0 50.0 75.0 100.0 125.0 150.0 175.0 200.0 225.0 250.0 275.0
TIME, HRS
Figure F9. Average channel velocities in Huntington Harbour,
200-ft non-navigable entrance channel
LRKE2 LINK 16WETLAN05 NOT CONNECTED
0"C.-. AAA AAA AA A AAAAA A^V v V V v vv v v V
6J-
,-
a
0.0 A .0 s6.o A .,a ,i .o ,i .o 4, .a ,A .a az .o ai.o 2 .o 2A .oI ME HR
Figure F10. Average channel velocities in Huntington Harbour,200-ft non-navigable entrance channel
F7

W!-KE2 LINK 17WETLRNOS NOT CONNECTED
C;
~ ~ o 5.0 75. i~o is~o ~ so Z .0 250.0 275.0T I C, HRSFigure F11. Average channel velocities in Huntington Harbour,200-ft noan-navigable entrance channel
U' LKE2 LINK 18WETL19NOS NOT CONNECTEj
0
c'
A
7
V!
0.0 A.0 !5.0 7 .0 Ir .0 I.o l . . O . .0 D.0 V .0
IMC.i - MFigure F12. Average channel velocities in Huntington Harbour,
200-ft non-navigable entrance channel
P8S
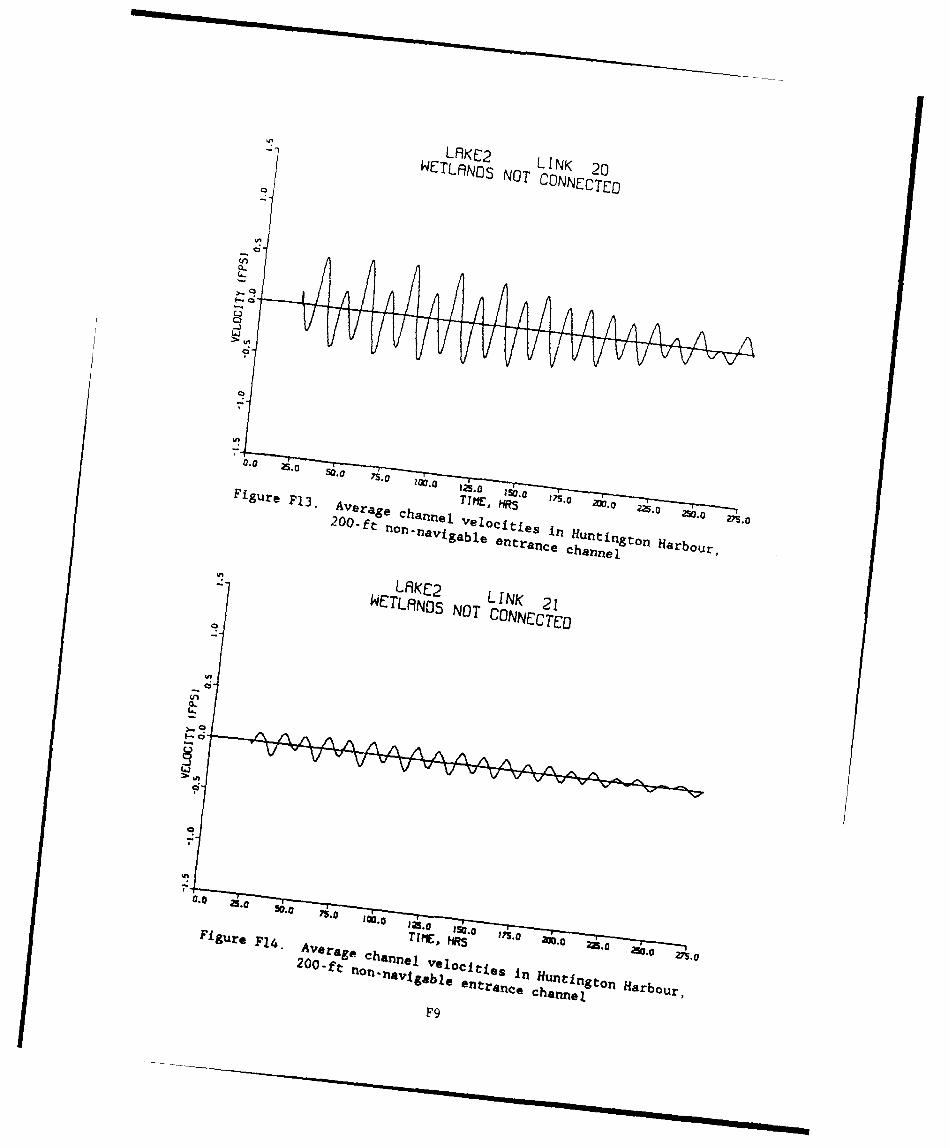
LflKC2 LINK 20C WTLfNOS NOT CONNECTED
7
..........
Figure F13. Average channei l octe n Hnignlon-navigable entrance chantnl on Harbour,
UTL19NS NO LINK 21WETU NDS NOTCONN~cCTCD
Li
Fiur 14 veae ahnnel veoi i iHutnonarbou V,20-tnnnavigablenrac
channel ra
F.9

LAKE2 LINK 23WETLANDS NOT CONNECTED
U
-
10.0 2S.0 50.0 75.0 100.0 125.0 150.0 175.0 20.O 225.0 250.0 27S.0
TIME, HRSFigure Fl5. Average channel velocities in Huntington Harbour,
200-ft non-navigable entrance channel
LAKE2 LINK 24WETLANDS NOT CONNECTED
,n
.0.0 25.0 50.0 75.0 100.0 121.0 150.0 175.0 200.0 z.0 250.0 275.0TIME, HRS
Figure F16. Average channel velocities in Huntington Harbour,200-ft non-navigable entrance channel
FIO

LRKE2 LINK 25WETLANDS NOT CONNECTED
U!
0n
0-j
Li
,.
0.0 2i.0 50.0 7A.0 100.0 12'.0 150.0 17S.0 2 .0 2 5.0 20.0 275.0TIME, HRS
Figure Fl7. Average channel velocities in Huntington Harbour,200-ft non-navigable entrance channel
LRKE2 LINK 26WETLANDS NOT CONNECTED
0
,AA\AAAAAAAAAAAA ^~V V V V V V iVVV V V V V V V
U'W
C4,-
0G.0 25.0 50.0 75.0 100.0 k 15 6. i0. 171.0 200.0 22.0 250.0 27S.0TIME, HRS
Figure F18. Average channel velocities in Huntington Harbour,
200-ft non-navigable entrance channel
Fl1

LAKE2 LINK 27WETLANDS NOT CONNECTED
U11
0 o A ~x . 6 ~~ 6.ai. ooA
In-
C
00 qx
0.0 2.0 5.0 A.0 1d.0 i. 150.0 15.0 X0. 225.0 ai0.0 Z5.oTI E, RS
Figure Fl9. Average channel velocities in Huntington Harbour,200-ft non-navigable entrance channel
LAKE2 INK12
WETLADS NT CONECTE

LRKE2 LINK 31U- WETLANDS NOT CONNECTED
0
U'
A- Vo VVV V V V V V V V W V -
-J
0.0 25.0 50. 0 A5.0 100.0 125.0 45.0 17A.0 20.0 2A.0 250.0 275.0TIME, HRS
Figure F21. Average channel velocities in Huntington Harbour,200-ft non-navigable entrance channel
LAKE2 LINK 32WETLANDS NOT CONNECTED
0
U,a_
AAAA\AAAAAAA~fAA^A^/6 'VV Vv V v v v v v VVVVV-0
9,
TIME, HIS
Figure F22. Average channel velocities in Huntington Harbour,200-ft non-navigable entrance channel
F13
I-. 0| | | |

LAKE2 LINK 33WETLANDS NOT CONNECTED
0.0 25.0 50.0 75.0 lc6.0 125.0 I 50.0a 1A.0 2C0.0 225.0 250.0 275.0T IME, HRS
Figure F23. Average channel velocities in Huntington Harbour,200-ft non-navigable entrance channel
LAKE2 LINK 31WETLANDS NOT CONNECTED
C',C-
'1*0. 2i0 5. 7i0 i,. 12. 60 1;. 6 0 ds 2 .0 S0
T I EMR
FiueF4 vrg hne eoite ne anrAeu rde
FigureF24. verag channlveglce enrner chanerlvne rde
Fl14

LAKE2 LINK 35WETLANDS NOT CONNECTED
0
Q
U
U>. U1
9'
0.0 2i.o 50.0 75.0 ,00.0 125.0 150.0 1A,.o 20.o Z .o 20.0 2n.oTIME, HRS
Figure F25. Average channel velocities in Outer Bolsa Bay,200-ft non-navigable entrance channel
LAKE2 LINK 36WETLANDS NOT CONNECTED
U
C.-
TIME MRS
.)
-J
0.0 ,5.0 50.0 75.0 ,0.0 12.0 ,50.0 ,1.0 20.0 m.o 25.0 27.0TIME,HR
Figure F26. Average channel velocities in Outer Bolsa Bay,200-ft non-navigable entrance channel
F15

LAKE2 LINK 37WETLANDS NOT CONNECTED
0o
(i
1 II
TIME, HRS
Figure F27. Average channel velocities in Outer Bolsa Bay,200-ft non-navigable entrance channel
LAKE2 LINK 38
i] WETLANDS NOT CONNECTED
0"
L)
-3
o
0.o 2.0 50.0 75.0 106.0 ,.0 10.0 15.0 20.0 2i5.0 30.0 m .
TIME, HRS
Figure F28. Average channel velocities in Outer Bolsa Bay,200-ft non-navigable entrance channel
F16
U- , i I E

LRKE2 LINK 85WETLf3NOS NOT CONNECTED
Ln0
Z.3
0V7
9'
I ME R
Figure F29. Average channel velocities in proposed marina,200-ft non-navigable entrance channel
LAKE2 LINK 95WETLANDS NOT CONNECTED
A AAA -
0. . 00 7.0 1rA.0 125.0 150.0 1;5.0 Jda.0 mi.0 . m.oT IME, H"5
Figure F30. Average channel velocities in proposed marina,200-ft non-navigable entrance channel
F17

LAKE2 LINK 109
WETLANO$ NOT CONNECTED
00
A.0 1001UG 1560 1 ., Z . . n
0-
V. V 0 V)
'0 . 60 A0O60 U. .0 1. d. 60 20 'o
TIME, 1-FiueF2 vrg hne elcte npooe aia
Figure20f FlAvrgchnonvglotesnpoe entrance channel ,
200ftno-nviabe ntaneFhane

APPENDIX G:
NON-NAVIGABLE ENTRANCE CHANNEL CLOSED
WATER SURFACE ELEVATIONS

C4)
an3
G2

LAKE3 NODE 5WETLANDS NOT CONNECTED
Cn
V
Ln
U
V J0.0 25.0 50.0 7S.0 100.0 13.0 150.0 175.0 200.0 225.0 250.0 P.
T IME, tIRSFigure Gi. Tidal elevations in Huntington Harbour,
non-navigable entrance channel closed
LAKE3 NODE 10WETL19NOS NOT CONNECTED
0A
cr
L..
CC,
I.0 5. 6o Ao,.o is 4a i~ c. i~ 6.
0 E R
FiueG.Tdleeainsi utntnHror
no-aialeetac hanlcoe
1G3

LAKE3 NODE 12WETLANDS NOT CONNECTED
n
-0U,
aoLj
C
L
TIME, HRSFigure G3. Tidal elevations in Huntington Harbour,
non-navigable entrance channel closed
oLRKE3 NODE 23WETLANDS NOT CONNECTED
_JU AAA A AQ
C.-
U,
LiI.-aE0
Fig::e G. Tidal e1evations in 7Vti\JnVaborR0U.
0.0 2.0 !io .0 106.0 12,.0 22 a 15.0 X o zh0 X.o 275.0
non-navigable entrance channel closed
G4
m LAKE NOD 2

LAKE3 NOOE 25WETLANOS NOT CONNECTEO
U1Eq-
I-_J
L"-.
LJ
TIME, HRSFigure G5. Tidal elevations in Huntington Harbour,
non-navigable entrance channel closed
LAKE3 NODE 28
C.
o
0
0
U,-
0.0 A.0 S0.0 7.0 I00.0 125.0 S.0 175.0 3m.0 225.0 2M0.0 27.0TIME, HRS
Figure G6. Tidal elevations in Huntington Harbour,non-navigable entrance channel closed
G5

LAKE3 NODE 29WETLANDS NOT CONNECTED
1,
LI _ V
L.n
Ck:
L]
Cr
0
Figure G7. Tidal elevations in Outer Bolsa Bay,non-navigable entrance channel closed
L19KE3 NODE 300 -WETLANDS NOT CONNECTED
0
CC-- 0 .-
"V VL)
I..-
I-
0
,.-
0.0 0 .0 10.0 1.,.0 A.0 1A.0 d.0 -. o Z6.0 .0
T I!ME, HRSFigure G. Tidal elevations in Outer Bolsa Bay,
non-navigable entrance channel closed
G6

LAKE3 NODE 310~ WETLANDS NOT CONNECTED
_J
LJ V
e'.
LiCc
9
0.0 2i.0 so 7.0 ,ob.o ,i5.0 i o , . . . .T IME, HRS
Figure G9. Tidal elevations in Outer Bolsa Bay,non-navigable entrance channel closed
LAKE3 NODE 32
0
- WETLAlNDS NOT CONNECTED
0
-jwoA
A
(CC,
0
0.0 A.0 50.0 A.0 16.0 ,.0 16.0 1A.0 20.0 25.0 25.0 A7.0
TIME, HRS
Figure GIO. Tidal elevations in Outer Bolsa Bay,non-navigable entrance channel closed
G7
LRKE3|NODE 3

LAKE3 NODE 33-WETL0NOS NOT CONNECTED
0
I-
0. .0 .0 A.0 um.o dOo kQo t s.0 iA.o 0.o .o O4.0 2A.0TIME, HRS
Figure GIl. Tidal elevations in entrance to proposed marina,
non-navigable entrance channel closed
L19KE3 NODE 35WETLANDS NOT CONNECTED
a
r
t.J
Li
°-.
Co
Figure G12. Tidal elevations in Outer Bolsa Bay,non-navigable entrance channel closed
G8I I I i I mI

LAKE3 NODE 37In; WETLANDS NOT CONNECTED
LA0
.J
I
0-U
C.-
=
C°_
TIME , HRS
Figure G13. Tidal elevations in Inner Bolsa Bay,
non-navigable entrance channel closed
LAKE3 NODE 45o - WETLANDS NOT CONNECTED
0
(.
'
LQAAAAAA Aw. v V" v v v v- V v V v V v V v V V v V"
0.0 2.0 50.0 75.0 Ioo.0 I. MsO 175.0 2.0 22.0 2o.0 m.0TIME, HRS
Figure G1. Tidal elevations in inner Bolsa Bay
non-navigable entrance channel closed
U'
0
I-.
0.0 3 .0 10.0 75.0 100.0 ,ia.o ,0.0 ,75.0 .0 ,.O UO.O V .0TINE, Ii
Figure G14. Tidal elevations in Inner Bolsa Bay,non-navigable entrance channel closed
G9

9 LAKE3 NODE 50WETLANDS NOT CONNECTED
0
(.
Cs,-
cJ
.-o
0
aU:
0.0 2.0 50.0 7A.0 100.o 3.0 150.0 175.0 0.0 23S.0 2,.o 27.0TIME, HRS
Figure G15. Tidal elevations in Inner Bolsa Bay,non-navigable entrance channel closed
9 LAKE3 NODE 54WETLANDS NOT CONNECTED
0
-J
LtA A aa _ -aA AA A oo L Ao--
z.J
~.
a
I-I
Pt m I
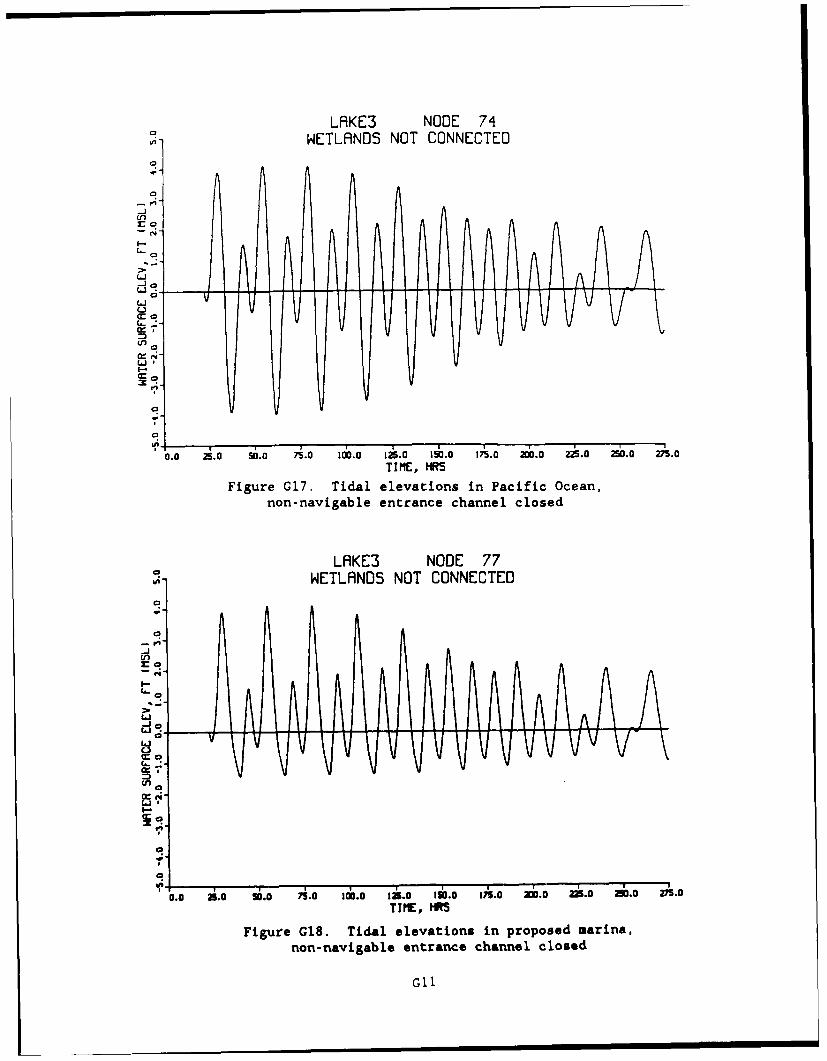
LAKE3 NODE 74WETLANDS NOT CONNECTED
--
U
ro
.I
T
LJi
CC'
OO 2S.0 S0n.0 7S.0 1 0 125.0 150.0 175.0 2MI.0 22S .a 2!O.O 275.0
C!
TI-£
o . WETLANDS NOT CONNECTED
0,
iU1
0
0.0 .0 S0.0 74.0 100.0 1'2.0 1506.0 75. 0 200.0 23.0 250.0 275.0
T I ME, HRS
Figure G1. Tidal elevations in pcificd Ocan,non-navigable entrance channel closed
-G.1
-'
-oll.
TIEa'JFiueLSiia lvtln npooe aia
Co-.,aleetac hanlcoe
CG 0
C.- I II

LAKE3 NODE 90WETLANOS NOT CONNECTED
0 0
ro
I-Li
Figure G19. Tidal elevations in proposed marina,non-navigable entrance channel closed
oLRKE3 NODE 97"WETLANDS NOT CONNECTED
i.
9
L,.
Wo
(4,
'I-
uo.
0.0 25.0 S0.0 7.0 fd.0 13s.0 15.0 17.0 ad.O zi.0 20.0 A7.0
TIME, HIR
Figure G20. Tidal elevations in full tidal wetlands,
non-navigable entrance channel closed
G12
LAE NOD 97

LAKE3 NODE 102WETLANDS NOT CONNECTED
0
o, IAAAAAAAA A Am-J
U..'
o,, VvV Vv Vv Vv v- v-7
(nJ
0
U'
0.0 25-..@ 0.0 7S.0 Im00. 125.0 156.0 1A7'.0 2C6.0 :Z2.0 256.0 A;'.0T I ME, HRS
Figure G21. Tidal elevations in full tidal wetlands,
non-navigable entrance channel closed
LAKE3 NODE 112WETLANDS NOT CONNECTED
W
a
_,.AAA AAA A A A -AV UoN.. V VV v V V VV v v V v
-J
G0
U.
.'
0
TiIME, HRS
Figure G22. Tidal elevations in full tidal wetlands,non-navigable entrance channel closed
013

LAKE3 NODE 113WETLANDS NOT CONNECTED
(.5
r-0
L, *
Li
Cr0
2i tO . 0.01fD 16. A 02-. i 0 4. .TIEHR
FiueG3 idleeainsi-ultda.elns
no-aial nrnecanlcoe
LfE3 NOE 1
WELNSNT0ONCE
R
Ln*
0.0 2i.0 50.0 75.0 100.0 1A.0 116.0 AS. 0 2 .0 2A.0 Zo.a V;S.oTIPE, HRS
Figure G2. Tidal elevations in fulld tidal wetlands,non-navigable entrance channel closed
LAKE NOD1 11

LAKE3 NODE 123
WETLANDS NOT CONNECTED
_j0
CC0
-J
rc
:n
-JoLi
0,C-, ,-
UI-
0C.
x
0.0 2i.0 0. 0 7.0 100.0 1A.0 156.0 17.0 0.0 ;25.0 30.0 A.0TIME, HRS
Figure G25. Tidal elevations in muted tidal wetlands,non-navigable entrance channel closed
LRKE3 NODE 129WETLANDS NOT CONNECTED
70ii,,,A" ^A A A A AA AA AA A A A A/° V v v VVVvv v _ V - '
C.
I--
0
Cig-~
Li.
Figure G26. Tidal elevations in muted tidal wetlands,non-navigable entrance channel closed
G15
a

LAKE3 NODE 132WETLAlNDS NOT CONNECTED
L)
CC,
WM,
0.0 25.0 50.0 j5.0 300.0 125.0 156.0 175.0 260.0 M.0 250.0 VS.0TI ME, MRS
Figure G27. Tidal elevations in muted tidal wetlands,non-navigable entrance channel closed
G16

APPENDIX H:
NON-NAVIGABLE ENTRANCE CHANNEL CLOSED
AVERAGE CHANNEL VELOCITIES

71~
fn0
4:N
H2

LAKE3 LINK 5WETLANDS NOT CONNECTED
TIME HR
C;_
0 .0 2. O0 n0 I60 40 160 J. 0. i0 260 V.T M, R
FiueH.Aeaecanlvloiisi0utntnHror
Figurennaigbl Hi.tAverae channel veoclesi oHninsne abor
-~ 3,

LFIKE3 LINK 8WETLANDS NOT CONNECTED
U,
>. 0A
C.,
0 . lo so 7.o i6o i o s. o . Ao 260 V.TIEHR
FiueH.Aeaecanlvloiisi utntnHrorno-aial enrne hnelcoe
0AE LN
0ELN5NT ONCE
W!
T I lE, HRS
Figure H. Average channel velocities in Huntington Harbour,
non-navigable entrance channel closed
LAKE3 ~ LIK4
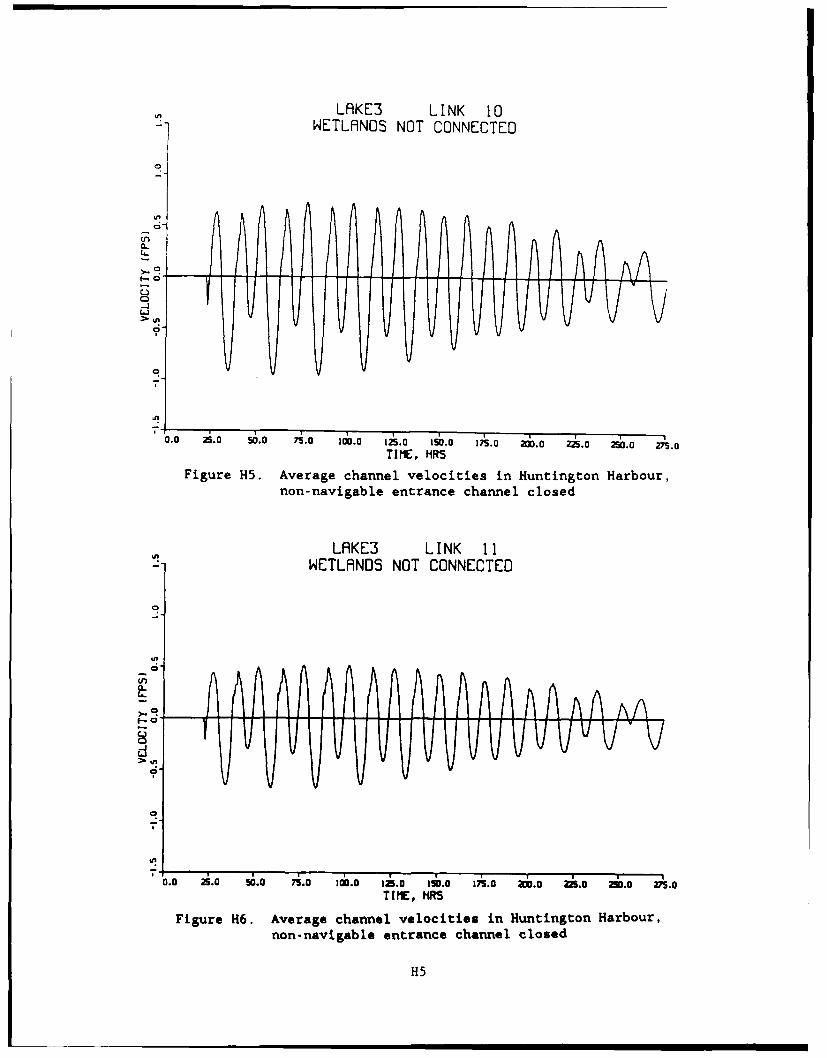
LAKE3 LINK 10-WETLANDS NOT CONNECTED
U!
a->.-.
T I ME HR
,-0
F i '0.0 25.0 50.0 75.0 loLo 125.0 150.0 175.0 ao.o :,.o 25.o 27.TIME, lIRS
Figure H5. Average channel velocities in H1untington Harbour,
non-navigable entrance channel closed
LAKE3 LINK 11WETLANDS NOT CONNECTED
0
UL
a.I
0
10.0 2i.0 $.o 7i.0 1.o ,iS.0 1I.0 1A.0 2d0.0 25.0 2.o VS.oTIME, HRS
Figure H6. Average channel velocities in Huntington Harbour,non-navigable entrance channel closed
H5

LAKE3 LINK 12WETLANDS NOT CONNECTED
Li
0"
L
a
TIME, HRS
Figure H7. Average channel velocities in Huntington Harbour,non-navigable entrance channel closed
LKE3 LINK 13
- WETLANDS NOT CONNECTED
I-
0
10.04 2i.0 50.0 7A.0 100.0 I12. 0 45.0 175.0 ;d0.0 2i.0 210.0 275.0
T IE, HRS
Figure HS. Average channel velocities in Huntington Harbour,non-navigable entrance channel closed
H6
LRKE3 LIN 1

UWCTLPNOS
NOT CONNECTCO
I0
Figure H9ve ag Time,~ 17arbour.nonefagcanne
velocities in Huntington
Hrornon- avig bleentrance c a n l C o e
U?
LRKE3 LINK 1C? WCTLRNDS. NOT CONNCCTEO
C.-
erag.velocities In Huntington
Haro,
non-navigabl, entrance channel* closed
ror
H7

LRKE3 LINK 17WETLANOS NOT CONNECTED
,-
-Li
0.0 2.0 S0.0 A'.0 [email protected] 125.0 150.0 175.0 2.0 22'.0 250.0 25.O
TIME, MRS
Figure HIl. Average channel velocities in Huntington Harbour,
non-navigable entrance channel closed
LRKE3 LINK 18WETLANDS NOT CONNECTED
0
a--
I..,o
vV vV VVV VVVv.In
0.0 ,,.0 S0.0 7j.0 oo.0 12s.0 13.0 1A.0 Jo.0 .o 0.0 dS.0TI ME, MRS
Figure H12. Average channel velocities in Huntington Harbour,
non-navigable entrance channel closed
H 8

LAKE3 LINK 20WETLANDS NOT CONNECTED
'"
-o V VVV VVV VVV V V VC
.
C,-
C
2
Li
'
0.0 2j.0 0.0 7A.0 100.0 1A.0 150.0 175.0 2d0O 2AX. 250.0 27S.0TIME, HRS
Figure H13. Average channel velocities in Huntington Harbour,non-navigable entrance channel closed
LAKE3 LINK 21WETLANDS NOT CONNECTED
0
U,-'.
0-. 0 9 -
-J
Li
U,
TIME, MRSFigure H14. Average channel velocities in Huntington Harbour,
non-navigable entrance channel closed
H9

LAKE3 LINK 23WETLANDS NOT CONNECTED
0
O"~~~~~ AAAAAAAAn
,V .0
0
0.0 2i. 0 50.0 7i.0 16.0 126.0 150.0 1A.0 2d0.0 2d.0 250.0 A7.0T I E, MRS
Figure H15. Average channel velocities in Huntington Harbour,non-navigable entrance channel closed
LAKE3 LINK 24WETLANDS NOT CONNECTED
.
TIME,
Figure H16. Average channel velocities in Huntington Harbour,
non-navigable entrance channel closed
HIO

LAKE3 LINK 25WETLANDS NOT CONNECTED
10.0 2i. 0 50.0 75.0 300.0 325.0 150.0 17A.0 20.0 225.0 250.0 P.0T IME, HRS
Figure H17. Average channel velocities in Huntington Harbour,non-navigable entrance channel closed
LAKE3 LINK 26WETLANDS NOT CONNECTED
0.0 25.0 50.0 71.0 200.0 121.0 350.0 171.0 dO.o Xk.0 25.0 PLO0T I ME, MRS
Figure H18. Average channel velocities in Huntington Harbour,non-navigable entrance channel closed
HI 1

LAKE3 LINK 27WETLANDS NOT CONNECTED
In
2.
a,_1
U'
C;_
0.0 25.0 S6.0 A~.0 A.0 1l.0 156.0 1A3.0 2 .0 2A.0 2 .0 A7.0
TIME, JIRS
Figure H19. Average channel velocities in Huntington Harbour,non-navigable entrance channel closed
LRKE3 LINK 29WETLANOS NOT CONNECTED
0-.
r'J
a
0.0 2i.o !.o A.0 ,i.0 ai.a ,5.0 ,is.o ado.a zi.0 n6.0 .oTIME, 1RS
Figure H20. Average channel velocities in Huntington Harbour,non-navigable entrance channel closed
H12

LAKE3 LINK 31WETLANDS NOT CONNECTED
Un
0\j
> u
0.0 2i.0 50.0 7A.0 IC .O 125.0 150.0 1.0 20.0 225.0 250.0 M7.0T IME, HRS
Figure H2l. Average channel velocities in Huntington Harbour,non-navigable entrance channel closed
LAKE3 LINK 32WETLA9NOS NOT CONNECTED
.
ti
0.0 A.0 3b.0 75.0 36.0 34.0 13.0 1A5.0 adn.0 z.0 A.0 A1.0TI ME, t95
Figure H22. Ak,'erage channel velocities in Huntington Harbour,non-navigable entrance channel closed
H13

LAKE3 LINK 33WETLANDS NOT CONNECTED
CL.
0-jU
0.0 25.0 5O.0 7A.0 100.0 I2A.0 15.27.M~02. .0 2n5.0
T I IE, IRS 0 ;S0d. 50Figure H23. Average channel velocities in Huntington Harbour,
non-navigable entrance channel closed
QLAKE3 LINK 34WETLANDS NOT CONNECTED
0
I. 0;
C96j
0V
'H14

LfKE3 LINK 35N- WETLANDS NOT CONNECTED
a-
NV
TM, , A !
0
Figure H25. Average channel velocities in Outer Bolsa Bay,
non-navigable entrance channel closed
LRKE3 LINK 36-- WETLANDS NOT CONNECTED
4n
t0-
a
L"
0V
0.0 25.0 50.0 5.0 10.0 1A.0 4,.0 A. Z.0 -2.0 250.0 21.0
TIME, HRS
Figure H26. Average channel velocities in Outer Bolsa Bay,
non-navigable entrance channel closed
Ht15
LIKI3 INK 3

LAKE3 LINK 37WETLANDS NOT CONNECTED
0
0n
0.0 25.0 50.0 75.0 100.0 125.0 150.0 1A.0 206.0 2i5.0 250.0 275.0TIME, HRS
Figure H27. Average channel velocities in Outer Balsa Bay,non-navigable entrance channel closed
L19KF3 LINK 38WETLANDS NOT CONNECTED
0-
1H16

LAKE3 LINK 85WETLANDS NOT CONNECTED
C,
0. . i0 A0 1. A. sx io 6. Ao26o 2oTIEHR
FiueH9 veaecanlveoiisi rooe aia
no-nvgal enrne hnelcoe
0AE IK 9
0.0 .0 5.0 75.0 100.0 13.0 15.0 i1s.0 2oo ~ So. 2.0T IME, HRS
Figure H30. Average channel velocities in proposed marina,non-navigable entrance channel closed
LRKE3 INK1 9

LAKE2 LINK 148WETLRNOS NOT CONNECTED
V
0.0 30 !. . d. j0 160 1. d. A0 2 G V.
TIE,,R
FiueH10vrg hne elcte npooe aia
no-aial0nrnecanlcoe
CH18