boegman, l., m. r. loewen, p. f. hamblin, and d. a....
TRANSCRIPT

Vertical mixing and weak stratification over zebra mussel colonies in western Lake Erie
L. Boegman1
Department of Civil Engineering, Queen’s University, Kingston, Ontario K7L 3N6, Canada
M. R. LoewenDepartment of Civil and Environmental Engineering, University of Alberta, Edmonton, Alberta T6G 2G7, Canada
P. F. Hamblin2
National Water Research Institute, Environment Canada, Burlington, Ontario L7R 4A6, Canada
D. A. CulverDepartment of Evolution, Ecology and Organismal Biology, The Ohio State University, Columbus, Ohio 43210
Abstract
Zebra mussels (Dreissena polymorpha) are an invasive species that have been implicated in the reduction of algaestocks in the near-shore environment of western Lake Erie. To determine their basin-wide effects, we applied a two-dimensional hydrodynamic and water-quality model for 1994. The model accurately reproduced lake-widehydrodynamics and water quality. When modeled as true benthic organisms (resting on the bottom), the dreissenidsgrazed 53% of the western basin May through September net algal growth. This grazing resulted in a ,0.1-mg L21
reduction in the pelagic algae concentration relative to the case without dreissenids. In comparison, dreissenidsgrazed 77% western basin net algal growth when the lake was modeled as a fully mixed water column. We found thatthe biomass grazed was governed by a balance between the timescales of vertical wind-induced mixing and benthicgrazing. During calm conditions, weak diurnal stratification (,1uC between surface and bottom waters) wassufficient to suppress vertical mixing, when the mean daily wind speed 4 m above the lake surface (U4) was,6 m s21. These conditions allowed a concentration boundary layer ,1 m thick to form, accounting for thereduced grazing effect relative to the fully mixed case. Entrainment of the concentration boundary layer occurred forU4 .6 m s21 (associated with the lake’s characteristic 10-d storm cycle) facilitating algae supply to the benthos. Weformulated the mean daily biomass grazed in terms of the dreissenid areal pumping rate (a) and U4 and found thatbecause typically U4 is ,6 m s21, the western basin is weakly stratified thermally and a concentration boundarylayer forms when U4 ,3a or a .2 m3 m22 d21. The dynamics of both wind-mixing and thermal stratification must,therefore, be considered in mixing models applied to shallow weakly stratified lake basins.
Zebra mussels (Dreissena polymorpha) successfully in-vaded the Laurentian Great Lakes in the mid–1980s. By the1990s they had achieved an ecologically dominant status inthe benthos of Lake Erie (e.g., Berkman et al. 1998). Theirabundance and large areal filtering capacity have led to themussels being implicated in the dramatic increase in waterclarity observed since the late 1960s (e.g., Hebert et al.1991). The establishment of the mussels was preceded by
the1970s phosphorus load abatement programs (DePinto etal. 1986) and consequently delineation of the relative effectsof these processes on Lake Erie water quality remains achallenge (Charlton 1994, Boegman et al. in press). Thesubsequent colonization by the quagga mussel (D. bugensis)further complicates the analysis.
Observational studies have shown that the effect ofdreissenid mussels is extreme in shallow near-shore environ-ments with high mussel densities (Hecky et al. 2004).Dreissenid mussel densities as high as 2.5 3 105 musselsm22 have been observed in western Lake Erie and are amongthe largest reported for any freshwater mollusk (MacIsaac etal. 1992). When these densities are coupled with pumpingrates estimated to be as high as 234 mL mussels21 h21 (Yuand Culver 1999), the potential filtering capacity is enormous(,60 m3 m22 h21). Potential filtering capacity (PFC) modelshave been applied to gauge the effects of dreissenid musselson the algae stocks of the shallow and productive Lake Eriewestern basin. MacIsaac et al. (1992) argued that the westernbasin is usually well-mixed vertically, a seasonal thermoclinedoes not form, and the temperature difference betweensurface and bottom waters is usually confined to #1uC.Under these conditions, they suggested that dreissenidmussels would have access to phytoplankton throughout
1 Corresponding author (email).2 Retired.
AcknowledgmentsTom Cole from the USACE provided the original CE-QUAL-
W2 source code and helped with its application to Lake Erie.Chris Rehmann is thanked for comments on the manuscript. JosefAckerman provided the observed data in Fig. 3 and Farrell Boycecollected the physical data at Sta. W1. Murray Charlton providedthe observed data in Fig. 2; we appreciate his encouragement ofthis study.
Adaptation of CE-QUAL-W2 to Lake Erie was funded by theOhio Sea Grant College Program grant NA86RG0053 (project R/EM-20) to D.A.C. and by the University of Toronto. Ongoingsupport was provided by NSF Environmental Biology grantDEB-410336 to D.A.C. and a Queen’s University ResearchInitiation Grant to L.B.
Limnol. Oceanogr., 53(3), 2008, 1093–1110
E 2008, by the American Society of Limnology and Oceanography, Inc.
1093

the water column at most times, such that they couldtheoretically filter a 7-m water column equivalent to the meandepth of the western basin between 3.5 and 18.8 times daily.Bunt et al. (1993) assumed that dreissenid mussels in thewestern basin of Lake Erie have access to phytoplanktonstocks throughout the majority of the water column at mosttimes and estimated that during 1990, juvenile dreissenidmussels were capable of filtering between 39% and 96% of a7-m water column daily. However, PFC models neithersimulate spatial gradients in plankton, nor the turbulentsupply of plankton to the benthos.
Laboratory flume experiments (Butman et al. 1994;O’Riordan et al. 1995) and in situ observations over musselbeds characterized by periodic intertidal flows (Frechette etal. 1989) have shown that near-bed plankton concentra-tions are regulated by a balance between horizontaladvection and vertical diffusion of plankton, whereconcentration boundary layer formation can cause as muchas 48% of the near-bed water to be refiltered by themussels. These results have been applied to the Lake Eriewestern basin water column (MacIsaac et al. 1999; Edwardset al. 2005), where the one-dimensional advection–diffusionequation was solved by assuming neutral stratification andthe existence of a logarithmic law-of-the-wall velocityprofile through the entire water column. Edwards et al.(2005) found that between 8% and 67% of a 7-m nearshorewater column could be filtered daily, with the range ofgrazing resulting from the flow of algal biomass to thebenthos being tightly coupled to the vertical turbulentmixing rate. MacIsaac et al. (1999) also reported a strongcorrelation between hydrodynamic forcing and musselgrazing. The logarithmic velocity profiles and associatedvertical mixing models applied in these studies wereoriginally developed for neutrally stratified riverine systems(Fischer et al. 1979, p. 106) and while applicable tolaboratory flumes and intertidal flows, these equations donot necessarily describe the low velocity seiche-drivenoscillatory dynamics occurring throughout the watercolumn of western Lake Erie. Moreover, they neglectmomentum transfer from the surface wind stress. Acker-man et al. (2001) found the logarithmic law-of-the-wallvelocity profile provided an accurate description of thenear-bed flow in western Lake Erie ,2% of the time andsuggested that wind-forcing may play an important role inregulating vertical mixing. Similarly in Lake Alpnach,Lorke et al. (2002) found the law-of-the-wall velocity layerto be confined to a thin near-bed region and not the entirewater column. Due to the oscillatory dynamics, turbulencequantities within this region, and the water column above,did not satisfactorily obey law-of-the-wall scaling. Thesuitability of applying riverine models to the western basinis further challenged by the observation that weak diurnalstratification occurred 60% of the time in the western basinof Lake Erie (Loewen et al. 2000). Ackerman et al. (2001),showed that weak stratification of ,0.5 kg m23 or 2uCbetween surface and bottom water reduced vertical mixingrates by ,40% relative to neutrally stratified conditions,leading to the formation of a ,2-m-thick concentrationboundary layer above the dreissenid mussel beds. Loewenet al. (2000) found that surface wind speeds in excess of
7 m s21 from the 10-d storm cycle characteristic to theregion (e.g., Hamblin 1987) enhanced vertical mixing, thusrendering the water column neutrally stratified.
Seasonal stratification will act to further suppressvertical mixing of plankton to the benthos. In the stratifiedenvironment of Hargus Lake (Ohio), Yu and Culver (1999)collected faeces and pseudofaeces of dreissenid mussels inorder to estimate the volume of water that was cleared ofseston per unit time, and estimated refiltration fractions tobe between 71% and 86%.
In general, the relative magnitudes of the verticaldiffusive and benthic grazing timescales will govern thedistribution of phytoplankton above a mussel colony. Theyare defined by Koseff et al. (1993) as
TD ~H2
Kz
ð1Þ
TG ~H
að2Þ
where TD is the approximate time for a water column ofdepth H to be vertically mixed by turbulence characterizedby the turbulent diffusivity Kz (m2 s21) and TG is theapproximate time for benthic grazers with an arealpumping rate a (m3 m22 s21) to deplete the water columnof phytoplankton. When TD . TG the mussels grazeplankton faster than it is supplied and a concentrationboundary layer is expected to form; when TD , TG,plankton is supplied faster than it is grazed and aconcentration boundary layer is not expected.
In the present study, we numerically modeled thehydrodynamics and water quality of Lake Erie. Theobjective of the study is to quantify the effects of dreissenidmussels in the deeper, less energetic offshore environmentsof the western basin. We investigate the hypothesis thatoffshore mussel effects are less than those predicted usingPFC models or by extrapolating nearshore observations(Ackerman et al. 2001; Noonburg et al. 2003; Edwards etal. 2005). The offshore mussel effects will be influenced byboth physical and biological processes, which we capture inthe numerical hydrodynamic and water-quality framework.We varied the dreissenid mussel pumping rate, the verticaldistribution of dreissenid mussels within the water columnand the strength of vertical turbulent diffusion to examinehow these coupled processes control phytoplankton stocksin the western basin of the lake. We then used the results tovalidate simple analytical models of the physical dynamics,which may be readily applied to other systems.
Methods
Previous applications of multidimensional models toLake Erie have been either hydrodynamic or water-quality–based (see discussion in Boegman et al. in press). However,to fully understand the biological responses to physicalvariability requires models that couple hydrodynamics andthe dynamics of water quality and biota (e.g., Koseff et al.1993). Recent studies integrating the hydrodynamics andnutrient–plankton–dreissenid mussel dynamics have been
1094 Boegman et al.

localized in application to an idealized water column (e.g.,Edwards et al. 2005) or conceptual food web models (e.g.,Noonburg et al. 2003). These studies confirm that the effectof dreissenid mussel filtering is influenced by severalcoupled abiotic factors which vary naturally in space andtime throughout a water body (e.g., the local hydrody-namics and spatial arrangement of suitable benthicsubstrate). The problem thus involves adequately modelingthe complexity of physical and biological processes in timeand space, with sufficient computational efficiency thatlong-term trends in water quality may be economicallysimulated. To address these issues, we have applied a two-dimensional hydrodynamic and water-quality reservoirmodel, CE-QUAL-W2 version 2.11 (Cole and Buchak1995) to Lake Erie for the year 1994. We found thehydrodynamic model accurately predicted water levelfluctuations without adjustment, but significant modifica-tions to the eddy coefficient turbulence algorithm (vT butnot Kz) were required in order to simulate acceptablelongitudinal currents (Boegman et al. 2001). The water-quality model reasonably simulated longitudinal trends inalgae and nutrients, as well as the dynamics of hypolimneticanoxia in the central basin (Boegman et al. in press).
CE-QUAL-W2 solves the Reynolds-averaged Navier–Stokes equations along longitudinal and vertical reservoir
axes and is thus suited for application to relatively longnarrow water bodies such as Lake Erie, which has a 6 : 1aspect ratio (Fig. 1a). We aligned the longitudinal coordi-nate direction with the lake’s longitudinal axis (west–east),corresponding to the direction of hydraulic flow, strongestseiching and gradients in temperature, nutrient concentra-tion, and plankton biomass (Charlton 1994). The verticalcoordinate direction resolves the vertical thermal structure,which supports internal waves and regulates the rate ofvertical mixing and, hence, the vertical distribution ofnutrients and plankton above benthic mussel reefs. Verticalturbulent diffusion of heat, mass, and momentum weremodeled in time and space using first-order eddy coeffi-cients. The vertical diffusion of momentum (vT) isformulated with a mixing-length model (Cole and Buchak1995; Boegman et al. 2001). The vertical diffusion of heatand mass are assumed to be equal (Kz) and are calculatedfrom vT as
Kz ~nT
Pr
~kl2
2Pr
ffiffiffiffiffiffiffiffiffiffiffiffiffiffiffiffiffiffiffiffiffiffiffiffiffiffiffiffiffiffiffiffiffiffiffiLu
Lz
� �2
zLv
Lz
� �2s
e{cRi
&kl2
2Pr
ffiffiffiffiffiffiffiffiffiffiffiffiffiffiffiffiffiffiffiffiffiffiffiffiffiffiffiffiffiffiffiffiffiffiffiffiffiffiffiffiffiffiffiffiffiffiffiffiffiffiLu
Lz
� �2
ztw yð Þe{2kz
nT
� �2s
e{cRig
ð3Þ
Fig. 1. (a) Lake Erie bathymetric plan view. Depth contours are at 10-m intervals. W1, W2, C and E denote positions ofmeteorological, temperature and current sampling stations during 1994. (b) Numerical solution plane (longitudinal cross-section)showing width contours. Contour interval is 20 km.
Stratification and zebra mussels 1095

where k is the von Karman constant, l is a turbulent length
scale (taken arbitrarily as the vertical grid point spacing),
Pr 5 2 is the turbulent Prandtl number, c 5 1.5 is an
arbitrary constant and u and v are the longitudinal and
lateral (north–south) velocities, respectively. The exponen-
tial function reduces vertical mixing in stably stratified
regions according to the local gradient Richardson number
Rig 5 N2/(Lu/Lz)2, which characterizes the stabilizing effect
of stratification relative to the destabilizing effect of vertical
shear. Here, N ~ffiffiffiffiffiffiffiffiffiffiffiffiffiffiffiffiffiffiffiffiffiffiffiffiffiffiffiffiffiffi{g=ro Lr=Lzð Þ
pis the buoyancy fre-
quency of a water column with density r(z). Thelongitudinal–vertical nature of the two-dimensional modelcauses the lateral velocity and its vertical gradient to bezero. To account for this simplification, it is assumed thatthe effect of cross-wind stress tw(y) generates a lateral wind–wave component that is parameterized for Lv/Lz. Thevertical longitudinal shear term Lu/Lz, results from longi-tudinal currents associated with the resolved hydrodynam-ics (surface and internal seiche motions as well as hydraulicflow through the lake system). These currents areinfluenced by longitudinal wind shear tw, which decaysexponentially from the surface, and longitudinal bed sheartb applied along the sediment area associated with thebottom cells. The stresses are modeled as
tw ~ CDraU210e{bz ð4Þ
tb ~gro
C2z
Ubj jUb ð5Þ
where z is the depth from the free surface, CD is a dragcoefficient, ra is the density of air, U10 is the wind speed10 m above the lake surface, Ub is the longitudinal near-bedcurrent velocity, g is the gravitational constant, ro is thecharacteristic density of the water column, Cz 5 90 m1/2 s21
is the Chezy roughness coefficient, and b is a coefficient thatis a function of fetch length and wind speed that accounts forthe effect of wind waves on regulating the depth of the wind-driven surface layer.
The water-quality module of CE-QUAL-W2 is organic-matter– (carbon) based. The model simulates the temporaland spatial dynamics of inorganic suspended carbon, labileand refractory dissolved organic matter, particulate organiccarbon (detritus), soluble reactive phosphorus, ammonium,nitrate plus nitrite, dissolved oxygen, biochemical oxygendemand, and a single algae type. Boegman et al. (in press)modified the model to include dreissenid mussel and
zooplankton water-quality modules including algae andoxygen consumption and nitrogen and phosphorus excre-tion. The growth rate of a single taxon of edible algae ismodeled as AGR 5 cT lmin AGRmax. This equation adjustsgrowth downward from the maximum growth rate(AGRmax) by applying rate multipliers that characterizethe ambient temperature (cT) and the limiting resource(lmin) of light (availability and photoinhibition), phospho-rus, or nitrogen (Monod kinetics) at each time-step. Algaesettle at a rate of 0.1 m d21.
The model was forced with 10-min data collected in 1994from surface meteorological buoys and daily measurementsof precipitation, inflows and outflows. We adjusted windspeed observations measured at 4 m to 10 m, for use inEqs. 4 and 5 by assuming a power law wind profile U10 5U4(10/4)1/7. We specified nutrient boundary conditions forthe water-quality model for the Maumee, Detroit, San-dusky and Grand (Ontario) rivers and for the four largestmunicipal wastewater treatment plants that directly dis-charge into the lake. We applied a dreissenid musselpumping rate of ZMQ 5 90 mL mussel21 h21 6 50%(Ackerman et al. 2001), and specified a unique dreissenidmussel population density at each longitudinal modelsegment (Haltuch and Berkman 1999; Boegman et al. inpress). We modeled the bathymetry of each segment as arectangular box of equivalent surface width and totalvolume (Boegman et al. in press). The laterally averagedbathymetric grid of Lake Erie used in this study consists offrom 5 to 65 layers spaced at 1-m intervals in the verticaland 222 longitudinal segments that are 1,414 m to 2,000 min length (west to east; Fig. 1b). At each grid node, wespecified a unique lateral width (north to south) over whichthe hydrodynamic and water-quality variables are aver-aged. We then applied the dreissenid mussel source andsink terms in the bottom layer of water (i.e., at the max.depth of each longitudinal segment). By this approach, werepresent dreissenid mussels as true benthic organismswithin the constraints of the laterally averaged model,which first affected the layer at maximum depth for thesegment in which they occur.
We performed a suite of numerical simulations toinvestigate the role of stratification and vertical mixing insupplying plankton to the mussel beds (Table 1). Thesesimulations include the standard model configurationwhere Kz is dependant upon the local wind stress andRichardson number and mussels are located upon the lakebed; a totally mixed reactor (TMR) model, where Kz 51,000 m2 s21 and the mussels were distributed evenly
Table 1. Summary of numerical simulations. Runs ZM45, ZM90, and ZM135 apply the locally variable Kz based upon the surface-wind stress and stratification with varying mussel individual pumping rates. Run TMR90 applies an approximation to a potential filteringcapacity model.
Run Kz Mussel location ZMQ (mL mussel21 h21)
NOZM locally variable no dreissenid mussels N/AZM45 locally variable lake bed 45ZM90 locally variable lake bed 90ZM135 locally variable lake bed 135TMR90 1,000 m2 s21 water column 90
1096 Boegman et al.

throughout the water column; and the case of no dreissenidmussels (NOZM). The TMR model is analogous to a PFCmodel that includes phytoplankton production (Edwards etal. 2005). We analyzed the results from the numericalsimulations to investigate the roles of stratification andvertical mixing in regulating the supply of phytoplanktonto the dreissenid mussels.
Numerical results
Model calibration, validation, and simulation for 1994field characteristics—We validated hydrodynamics andwater quality against an extensive 137-d field data setcollected during 1994. The model accurately simulates thethermal structure and longitudinal currents at Sta. W1 andW2 (model segments 27 and 33, respectively; Boegman et al.2001). We validated the water-quality model againstobservations from four water-quality surveys (Charlton1994). To facilitate comparison to the laterally averagedmodel results, we present the vertically integrated fieldobservations as a variation between the minimum andmaximum lateral value at each model segment after weaverage the model results vertically. This representationpreserves some of the spatial heterogeneity in water-qualityobservations from large lakes. The model reasonablysimulates concentrations and longitudinal trends in algae(Fig. 2), nitrogen, phosphorus and dissolved oxygen (Boeg-man 2006; Boegman et al. in press), with model resultsgenerally being within the observed ranges. Although wehave averaged both modeled and observed data to facilitatedirect comparison, the model does reproduce the mussel-feeding signature within 2 m above the mussel reef at Sta.W2 (Fig. 3) within the error bounds of the observed data.
Diurnal variation in water-column dynamics—We ana-lyzed hourly model output at Sta. W1 spanning severalwind-mixing events to illustrate the physical dynamicsleading to enhanced mixing and, hence, grazing over sub-daily timescales. For example, on 09 June 1994 (day 159)the sudden onset of the wind causes a down-welling of thefree surface as water is pushed from the western basin(Fig. 4a). Mixing of the water column is evident with thetemperature difference between surface and bottom water(DT) changing from 2.5uC to 0uC with a correspondingsudden increase in the modeled rate of algal biomass grazedby the mussels (Fig. 4b). The mixing event is a direct resultof elevated Kz through the water column (Fig. 4c; event A).Two other significant mixing events (defined as times whenDT R 0 in Fig. 4b) occur during the period shown (eventsB and C). Each event is generated as U4 R 6 m s21
(Fig. 4a), leading to enhanced wind stress (Fig. 4d) and inturn enhanced vertical shear (Fig. 4e). Interestingly,although in both cases U4 < 6 m s21, event B ischaracterized by strong mixing (i.e., large Kz) and weakshear and stress, while event C has weaker mixing yetstronger shear/stress. The difference may be explained bynoting that buoyancy production due to surface heattransfer is not expected during the night in early June (day159), after mixing event A. Hence, the water column is lessstratified (DT ,1uC) prior to event B relative to event C
(DT ,2uC) and so less wind energy is needed to overcomethe stabilizing effect of buoyancy, resulting in deepermixing. This effect is shown clearly in the Ri term (Fig. 4f)from Eq. 3, which incorporates the competing effects ofshear and buoyancy. The qualitative correspondencebetween Kz and Ri has been observed in the field (Boegmanet al. 2003), suggesting that the governing physics are well-represented within the model.
The observation that the mixing response is being drivenby the surface wind stress demonstrates that riverinemodels, which neglect surface momentum transfers andapply law-of-the-wall scaling to calculate vertical mixingrates from bed shear, are unsuitable for describing thedynamics of the shallow weakly stratified water column of
Fig. 2. Western basin modeled and field-observed laterallyand vertically averaged algal biomass (observed algae 5 67 3chlorophyll a). Observations were obtained during three 5-d lake-wide Lake Erie cruises in June, July, and August 1994. The modeloutput corresponds to the temporal midpoint of each cruise, asindicated. Gray shading denotes the lateral variation of thevertically integrated field observations. Black shading denotesvariation in simulated results for ZMQ 5 90 6 50% mL mussel21
h21. Corresponding bathymetry and vertical distributions of algaeand temperature are shown in Fig. 9.
Stratification and zebra mussels 1097

western Lake Erie. Elevated bed stress does occur (Fig. 4d)throughout the simulation as a result of the dominantbarotropic seiche currents (Boegman et al. 2001); however,this leads neither to an enhancement of the vertical shearnor of Kz. The results shown in Fig. 4 did not varyqualitatively when Cz was varied 650%. Boegman (1999)further discusses the effects of Cz on the bottom mixed-layer thickness.
Seasonal variation in water-column dynamics—Over aseasonal timescale, mean daily 4-m wind speed in thewestern basin at Sta. W1 (model segment 27) is ,5 m s21
(Fig. 5a) with regular events exceeding 6 m s21 resultingfrom the 10-d storm cycle. The modeled isotherms at W1
(Fig. 5c) indicate that the water column does not seasonallystratify (i.e., a stable thermocline does not develop) becausewind speeds in excess of 6 m s21 regularly mix the watercolumn from the surface toward the bed (Fig. 5b) resultingin an isothermal profile (Fig. 5a). Portions of the watercolumn where Kz . 2 3 1023 m2 s21 are denoted as beingactively mixed regions (shaded). This value of Kz liesbetween observed estimates of turbulent diffusion duringneutrally stratified (Kz ,4.1 3 1023 m2 s21) and stablystratified (Kz,1.7 3 1023 m2 s21) conditions at W2, which
is located ,1.4 km southeast of W1 (Ackerman et al. 2001).These mixing dynamics are physically consistent with thoseobserved by Loewen et al. (2000) at Sta. W2.
The periodic mixing of the water column in western LakeErie should cause similar vertical distributions of temper-ature and algae. Buoyancy and algal biomass are bothproduced in the epilimnion due to surface thermodynamicsand light availability, respectively, and both are mixed todepth by turbulent diffusion. However, grazing of algalbiomass by dreissenid mussels in the benthos of Lake Erieleads to the formation of a near-bed algae concentrationboundary layer (e.g., MacIsaac et al. 1999; Ackerman et al.2001). Isopleths of simulated algae concentration for runZM90 (Table 1) reproduce the concentration boundarylayer near the lake bed, which is visible as a sharp verticalconcentration gradient (Fig. 6a). This gradient is strikinglydissimilar to the weak stratification and near-verticalisotherms of the temperature field in Fig. 5c. Within theconcentration boundary layer, the algae concentrations areas low as 0.1 mg L21, well below the 0.3–0.5-mg L21
concentrations simulated to occur in the pelagic zone. Theimportance of vertical diffusive processes and the spatiallocation of the mussels (i.e., on the bed) in maintaining theconcentration boundary layer are evident through compar-
Fig. 3. Profiles of organic seston concentrations for on- and off-reef sampling stations at W2 (the mean value and SE bars arepresented) and modeled algae concentration with height above the bottom. Observed data are unpublished daily averages from the studyby Ackerman et al. (2001), which reports averages over the 4 d of sampling. Model output is daily at 12:00 h. To enable comparison to themodel output, one-third of observed organic seston in western Lake Erie was estimated to be living algae; the remainder being mainlydetritus (Leach 1975).
1098 Boegman et al.

ison of Fig. 6a to Fig. 6b. In the latter, the mussels wereuniformly distributed vertically within the water columnand complete vertical mixing was simulated by specifyingKz 5 1,000 m2 s21 (Table 1, TMR90). For these simula-tions, which approximate a PFC model, no concentrationboundary layer forms and the modeled algae concentra-tions are uniform in the vertical and vary with time between0.2 mg L21 and 0.4 mg L21 These concentrations are,0.1 mg L21 less than those from 0 m to 6 m (Fig. 6a).Calculation of the total daily consumption of algae bydreissenid mussels in model segment 27 for ZM90 (7 3106 g d21) and TMR90 (9 3 106 g d21) shows an average
30% reduction in algal biomass grazed when the musselsare located on the bed and more realistic vertical mixingrates are applied (Fig. 6c).
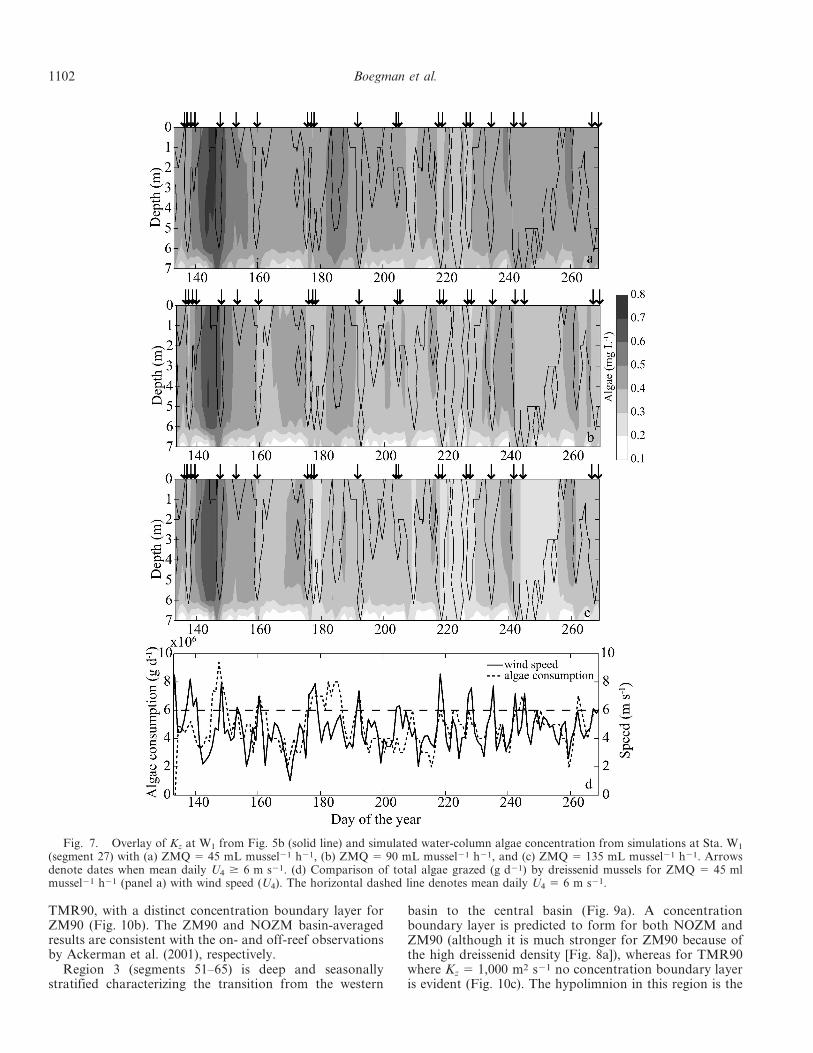
Overlays of data from Figs. 5b and 6a show the spatialand temporal correlations between the strength of thesurface winds, the rate of vertical mixing, the algaeconcentration and the concentration boundary layer(Fig. 7b). When mean daily U4 . 6 m s21, periods ofenhanced vertical mixing toward the bed occur, reducingthe algae concentration as mixing events entrain theconcentration boundary layer. During these events, thetimescale of vertical mixing is expected to be larger than
Fig. 4. Effect of variable wind fields on seasonal variation in water column dynamics in 1994 at Sta. W1 (located in model segment27). Data output at 20-min intervals. (a) Relative variation in 10-min average wind speed (at 4 m above the surface) and the modeledlake-surface elevation at segment 27; (b) modeled algal biomass grazed relative to the temperature difference (DT, uC) between the surfaceand bottom water; (c) temporal evolution of the turbulent diffusion coefficient (Kz); (d) temporal variation of the applied surface and
bottom stresses (tw + tb); (e) temporal variation in the vertical shear term (
ffiffiffiffiffiffiffiffiffiffiffiffiffiffiffiffiffiffiffiffiffiffiffiffiffiffiffiffiffiffiffiffiffiffiffiffiffiffiffiffiffiffiffiffiffiffiffiffiffiffiffiffiffiffiffiffiffiffiffiLu=Lzð Þ2 z tw yð Þe{2kz
�nT
� �2q
) from Eq. 3; (f) temporal
variation in the Richardson number term (e2cRi) from Eq. 3. Regions where the density profile is unstable (e.g., inflows or large-scaleoverturns) are mixed using Kz 5 1,000 m2 s21 (indicated in [c] where Kz .1022 m2 s21). Apart from these events the turbulence closuremodel calculates 1027 m2 s21 , Kz ,1022 m2 s21 in agreement with observed data (Yeates and Imberger 2003; their fig. 8).
Stratification and zebra mussels 1099

that of benthic grazing and increased biomass grazing bythe dreissenid mussels can occur (Fig. 7d). Conversely,when U4 , 6 m s21, the water column remains weaklystratified, the time scale of vertical mixing is expected to besmaller than that of benthic grazing, the concentrationboundary layer is well-defined and grazing is reduced. Thebenthic–pelagic coupling process is dependent upon theareal pumping rate of the mussels, but variation in theindividual mussel pumping rate by 650% (i.e., from 45 mLmussel21 h21 to 135 mL mussel21 h21) does not signifi-cantly influence the temporal distribution of the concen-tration boundary layer and only raises or lowers the watercolumn algae concentrations by ,0.1 mg L21 during thewind-mixing events (Figs. 7a, c). In the TMR90 model(Fig. 6b) no benthic–pelagic coupling between winds,mixing, and algae grazing occurs. The numerical frame-work of this study allows these results to be easily extendedfrom model segment 27 (Sta. W1) to the entire westernbasin.
Spatial variation in the effects of seasonal water-columndynamics on dreissenid grazing—To investigate the influ-
ence on phytoplankton stocks of differences in spatialvariation of dreissenid mussel density, depth, stratificationand/or nutrient availability, we computed the mean dailyalgal biomass grazed by the mussels for each modelsegment in the western basin (Fig. 8). As would beexpected, the model predicts enhanced grazing per squaremeter for TMR90 relative to ZM90 (Fig. 8a). Thedifference in algal biomass grazed per square meterbetween these two models is proportional to the musseldensity (Fig. 8c) and generally increases with the degree ofthermal stratification from west to east across the basin(Fig. 9a). This west-to-east trend is not as apparent in thedaily biomass grazed per mussel (Fig. 8b). Locations ofenhanced difference in daily biomass grazed per musselbetween TMR90 and ZM90 occur near segments 5, 25, and60. These are associated with high concentrations ofoverlying algae throughout the water column (Figs. 9b–d). Segments 5 and 25 are near the inflows from theMaumee River and Detroit River, respectively, andsegment 60 lies in the transition region to the central basin,where a seasonal thermocline forms separating the musselsfrom the euphotic zone (Fig. 9a). Local minima in biomass
Fig. 5. The influence of variation in wind speed on thermal stratification and turbulent diffusion at Sta. W1 (model segment 27). (a)Mean daily 4-m wind speed (U4) and temperature difference between surface and bottom water (DT) in 1994. Dotted line and arrowsindicate U4 $ 6 m s21. (b) Temporal and vertical evolution of the modeled diffusion coefficient Kz. Shaded region denotes Kz $ 2 31023 m2 s23. (c) Simulated vertical and seasonal variation in water temperature (isotherm interval 5 2.5uC isotherms). All data, with theexception of wind speed, are output daily at 12:00 h.
1100 Boegman et al.

grazed per mussel (for both ZM90 and TMR90) occur nearsegments 10 and 50. This is likely due to reduced effectiveclearance at locations of high mussel density (Pontius andCulver 2001). These dynamics are generally consistent withthe concept of concentration boundary layer formation(i.e., Fig. 9c). Despite the relatively coarse vertical resolu-tion (1 m), the thickness of the concentration boundarylayer, averaged over the simulation, is well-modeled(Fig. 9c) at ,1–2 m in agreement with field observations(MacIsaac et al. 1999; Ackerman et al. 2001).
The west-to-east gradients in physical and water-qualityparameters support dividing the western basin into threedistinct longitudinal regions (Fig. 9a), so that the influenceof the spatial gradients on the basin-averaged water-columnalgae concentration in each region can be investigated.
Region 1 (segments 2–10) is neutrally stratified andshallow, representative of the nearshore regions of the
western basin perimeter. Nutrient-rich Maumee Riverinflows (Boegman 1999) and moderate mussel densitiescause the algae consumption per individual mussel to behigh (Fig. 8b). Profiles of the mean water-column algaeconcentration show little difference between ZM90 andTMR90 models and no strong concentration boundarylayer forms (Fig. 10a). The presence of the mussels greatlyreduces the algae stocks compared to the NOZM case.
Region 2 (segments 11–50) is weakly stratified and ,8 mdeep and, thus, is typical of the offshore western basin. Thelow dreissenid mussel densities on soft sediments but higherdensities on reefs and high ambient algae concentrationfavor the development of a concentration boundary layer,and an increase in biomass grazed for TMR90 occursrelative to ZM90 (Fig. 8b; quantified below). Profiles of themean water-column algae concentration show a decrease inthe pelagic algae concentration from NOZM to ZM90 to
Fig. 6. Comparison of algal vertical distribution with time at Sta. W1 (segment 27) as influenced by dreissenid consumption andturbulent mixing. (a) Algae distribution simulated with dreissenid mussels located on the lake bed (model ZM90), (b) algae distributionsimulated with dreissenid mussels evenly distributed vertically throughout the water column and Kz 5 1,000 m2 s21 (model TMR90).Contour interval is 0.1 mg L21 and data are output daily at 12:00 h. (c) Comparison of the vertically integrated algae consumption(g d21) by dreissenid mussels in segment 27 for ZM90 and TMR90 models (panels a and b). Dotted lines in (c) indicate the averageconsumption over the simulation period, while the arrows denote days when the mean daily U4 $ 6 m s21.
Stratification and zebra mussels 1101
TMR90, with a distinct concentration boundary layer forZM90 (Fig. 10b). The ZM90 and NOZM basin-averagedresults are consistent with the on- and off-reef observationsby Ackerman et al. (2001), respectively.
Region 3 (segments 51–65) is deep and seasonallystratified characterizing the transition from the western
basin to the central basin (Fig. 9a). A concentrationboundary layer is predicted to form for both NOZM andZM90 (although it is much stronger for ZM90 because ofthe high dreissenid density [Fig. 8a]), whereas for TMR90where Kz 5 1,000 m2 s21 no concentration boundary layeris evident (Fig. 10c). The hypolimnion in this region is the
Fig. 7. Overlay of Kz at W1 from Fig. 5b (solid line) and simulated water-column algae concentration from simulations at Sta. W1
(segment 27) with (a) ZMQ 5 45 mL mussel21 h21, (b) ZMQ 5 90 mL mussel21 h21, and (c) ZMQ 5 135 mL mussel21 h21. Arrowsdenote dates when mean daily U4 $ 6 m s21. (d) Comparison of total algae grazed (g d21) by dreissenid mussels for ZMQ 5 45 mlmussel21 h21 (panel a) with wind speed (U4). The horizontal dashed line denotes mean daily U4 5 6 m s21.
1102 Boegman et al.

only portion of the western basin where algae growth islight-limited, in the remainder of the basin it is phosphorus-limited, and so for NOZM the presence of the near-bedconcentration boundary layer may be attributed toseasonal stratification impeding vertical transport of algaebetween the euphotic zone and the benthos (Figs. 9a–c),resulting in lower hypolimnetic algae concentrations. ForZM90, algae depletion due to grazing further reduces near-bed algae concentrations compared to NOZM. Augmentedgrazing and suppressed mixing will increase TD relative toTG, thus facilitating the lower near-bed algae concentra-tions. For TMR90, TD R 0, causing the large total grazingdifferential between TMR90 and ZM90 over segments 51to 65 (Fig. 8a).
Basin-wide interactions of fluid dynamics and dreissenidgrazing—We have examined the influence of longitudinalgradients in physical and biological parameters on mussel
grazing and algae concentration in the western basin. Thebiomass grazed by the mussels is also dependent upon theareal pumping rate a (Figs. 7a–c) and the supply ofplankton to the benthos, which is in turn stronglycorrelated with the surface wind speed U4 (Fig. 7). Theamount of algae biomass grazed daily is maximized whenboth U4 and a are large, but grazing is suppressed as a R0 (pumping limitation) or U4 R 0 (food supplylimitation; Fig. 11a). For U4 . 3a grazing becomes astrong function of a (directly proportional); for U4 , 3a,grazing becomes independent of a and a concentrationboundary layer is formed when the water column is notactively mixing (i.e., U4 , 6 m s21 [Fig. 11a]). When theconcentration boundary layer forms, grazing is thusindependent of a and weakly proportional to U4, whichcontrols vertical mixing and, hence, food supply to thebenthos. Characteristic values of U4 for May throughSeptember 1994 are 4 to 5 m s21 (i.e., U4 , 6 m s21;
Fig. 8. Spatial variation in algal consumption and dreissenid abundance in western Lake Erie. (a) Variation in mean daily biomassof algae grazed by dreissenid mussels over the simulation period at western basin segments. (b) Spatial variation in mean daily biomassgrazed mussel21. (c) Spatial variation in dreissenid mussel abundance. Panel (c) is generated from dreissenid mussel distribution maps(Haltuch and Berkman 1999) that have been discretized for the CE-QUAL-W2 bathymetry according to substrate type (Boegman et al.in press).
Stratification and zebra mussels 1103

Fig. 12) and, hence, concentration boundary layer formationis expected for a . 2 m3 m22 d21 (Fig. 11a). Publishedestimates of a (Table 2) from nearshore environments (1.7 ,a , 132 m3 m22 d21), offshore environments (a,16.2 m3 m22 d21) and the entire western basin (1.7 , a ,13.9 m3 m22 d21) suggest that this condition for concentra-tion boundary-layer formation will typically be satisfied. Themeteorological conditions during 1994 have been shown to befairly typical for the lake (Boegman et al. in press) and, hence,the presence of a concentration boundary layer may beconsidered to be the natural mean state of the western basin(as shown in Fig. 9c).
The results shown in Fig. 11a, may be generalized for awater column of arbitrary depth and stratification using abulk form of the Richardson number Ri , N2 /(U4/H)2
(Fig. 11b). Here, we evaluated the bulk buoyancy frequen-
cy N ~ffiffiffiffiffiffiffiffiffiffiffiffiffiffiffiffiffiffiffiffiffiffiffiffiffiffiffiffiffiffig=roð Þ Dr=Hð Þ
pusing the observed density
difference (Dr) between the surface and bottom water(from Boegman et al. 2001). The biomass grazed in Riversus a space is in qualitative agreement with that in U4
versus a space. However, grazing becomes a strongfunction of a when Ri , 0.1a and grazing becomesindependent of a when Ri . 0.1a. Concentration boundarylayer formation occurs when Ri . 6 3 1024.
To determine the effect of dreissenid mussels on thealgae stocks, we performed an algal mass balance for thewestern basin. We partitioned the algae budget into thefollowing five compartments: inflow (only Detroit Riveralgae loads were available), exchange with the centralbasin, net growth (algal growth minus mortality andsettling) and grazing by zooplankton and dreissenidmussels. In the cumulative partitioning of algal biomass
Fig. 9. Mean simulated spatial variation in temperature and algae concentration relative to dreissenid grazing regimen. (a)Temperature distribution (isotherm interval 5 1uC), (b) algae biomass distribution for the NOZM model (isopleth interval 50.1 mg L21), (c) algae biomass distribution for the ZM90 model, and (d) algae biomass distribution for the TMR90 model.
1104 Boegman et al.

into each of these compartments throughout the seasonalsimulation (Fig. 13), two approximate source–sink balanc-es are evident. First there is a boundary-flux balance wherethe influx via the Detroit River is approximately balancedby efflux to the central basin and second, a growth-versus-predation balance where the sum of grazing by dreissenidmussels and zooplankton balances the net algal growth(Boegman et al. in press). In the ZM90 simulation, duringMay through September the mussels graze 53% of thewestern basin net algae growth, which is consistent with the
results of Edwards et al. (2005), who locally modeledvertical mixing in a nearshore (5-m depth) site and founddreissenid mussels to be capable of filtering between 8%and 67% of the biomass in the water column, depending onthe shape and magnitude of the diffusivity profile. For ourTMR90 model, the mussels graze 77% of the net growth, avalue much closer to those of the PFC models, whichestimate filtration of 39–96% of the water column (Bunt etal. 1993) or the entire water column 3.5–18 times daily(MacIsaac et al. 1992).
Fig. 10. Spatial variation in simulated algal biomass verticaldistribution for NOZM, ZM90, and TMR90 models. (a) Region1: Segments 2–10; (b) Region 2: Segments 11–50; (c) Region 3:Segments 51–65; and (d) the entire western basin. The profileswere computed by averaging the instantaneous daily algaeconcentration at each grid cell, normalizing by the local water-column depth and averaging the normalized profiles overeach region.
Fig. 11. Contours of algal biomass grazed (mg m2 d21) bydreissenid mussels in western Lake Erie (segments 2–50) as afunction of: (a) areal pumping rate (a) and mean daily wind speed(U4) and (b) areal pumping rate and bulk Richardson number.For dimensional consistency the coefficient 0.1 has units of s m21.Shaded region denotes parameter space where concentrationboundary layer formation is predicted. Data points are bin-averaged with bin centers shown by dots. Contours may beconverted from areal units to basin-wide units (e.g., g d21) bymultiplying by the western basin sediment area over segments 2–50 (i.e., 3,024 km2). Note that the vertical scale is reversed in b.See text for further explanation.
Stratification and zebra mussels 1105

Observational results
The characteristic timescales—To facilitate generaliza-tion of the model results beyond our Lake Erie application,we developed analytical models where we calculated thegrazing and diffusive timescales from field data. To ensurethat the analytical models are reproducing the dynamicsassociated with benthic–pelagic coupling over a dreissenidmussel reef, we cross-validated the analytical responsesagainst the numerical results.
We computed the grazing timescale from Eq. 2 usingobservations of mussel density at W2 (Ackerman et al.2001)
TG*H
a*
7 m
7500 mussels m{2ð Þ 90 mL mussel{1 h{1� �*10 h ð6Þ
The diffusive timescale is generally more challenging toevaluate from Eq. 1, because direct observations of Kz aredifficult to obtain. In the present study, direct observationsof Kz were not available and so we formulated TD usingtwo analytical mixing models that only require observa-tions of the surface wind stress and the water-columnthermal structure at ,1-m scale. The models assume a
quasi-steady kinetic energy cascade where the rate of workperformed by an impulse wind stress over a quiescent watercolumn equals the energy utilized to vertically mix the fluidplus the volumetric rate of dissipation of turbulent kineticenergy in the upper mixed layer. In the first model, thewater column is neutrally stratified; while in the second, thewater column has continuous weak stratification charac-terized by the buoyancy frequency (N). The formulae make
use of the surface shear velocity u� ~ffiffiffiffiffiffiffiffiffiffiffiffitw=ro
p, where tw is
from Eq. 4 with CD 5 1.3 3 1023 (Fischer et al. 1979,p. 162), rA 5 1.2 kg m23, ro 5 1,000 kg m23 and U10 isadjusted from 4 m (Fig. 5a). Because the stress is beingevaluated at the surface, we neglected the exponential term.
In the first model, transient stirring of the neutrallystratified fluid will occur and a turbulent front will deepenfrom the free surface. The rate of penetration of theturbulent front may be calculated from Spigel andImberger (1980; their eq. 12) as
Lz
Lt* 0:3u� ð7Þ
where z is the vertical coordinate (positive downwards) andthe coefficient of 0.3 accounts for the stirring efficiency ofthe wind, shear production and convective overturns(Spigel et al. 1986, their table 1). Integrating Eq. 7 overthe water column of depth H 5 7 m gives the stirringtimescale for a neutrally stratified water column
TstirD &
H
0:3u�ð8Þ
In the second model, both transient stirring anddiapycnal mixing of the fluid occur and a turbulent frontwill deepen from the free surface, homogenizing the wateras it mixes the stratified column. The rate of penetration ofthe turbulent front has been modeled by J. Imberger(unpubl. lecture notes) using eqs. 34 and 35 from Spigel etal. (1986)
Lz
Lt*
1:4u�ð Þ3
zNð Þ2ð9Þ
Integrating over the water column gives the diffusivetimescale for mixing the stratified water column
Fig. 12. Histogram of mean daily 4-m wind speed (U4) asobserved at W1 between 09 May and 26 September 1994. We bin-averaged data points over integer values of U4 6 0.5 m s21.
Table 2. Published estimates of dreissenid mussel density, individual pumping rate (ZMQ) and areal pumping rate (a) characteristicto the nearshore, offshore and basin-wide environments of western Lake Erie.
Source Yr EnvironmentSubstrate
typeMean density(mussels m22)
ZMQ (mLmussel21 h21)
a(m3 m22 d21)
MacIsaac et al. (1992) 1990–1991 nearshore rock 270,000 size specific 25–132Pontius and Culver (2001) 1993 nearshore shoal 18,000–21,000 size specific 1.7–2.3Edwards et al. (2005) 1995 nearshore cobble 10,000–20,000 - 25Bunt et al. (1993) 1991 nearshore rock 100,000–300,000 size specific 2.7–6.7Ackerman et al. (2001) 1994 offshore reef 7,500 90 16.2Noonburg et al. (2003) - Western basin - - - 3.08MacIsaac et al. (1992) 1990–1991 Western basin - - size specific 13.9Boegman et al. (In press) 1994 western basin variable 800 90 1.7
1106 Boegman et al.

TmixD &
N2
3
H
1:4u�
� �3
ð10Þ
We calculated the temporal evolution of the observedcharacteristic timescales from the wind and temperaturedata available from the meteorological buoy and thermis-tor at W1. During the majority of the observational periodthe mean daily surface wind speed was ,6 m s21 and thewater column is stably stratified (Fig. 14a). Loewen et al.(2000) showed that weak yet significant stratification (0 #Dr # 0.5 kg m23) has occurred 60% of the time at W2
during summer as a result of a net positive diurnal surfaceheat flux. During the stratified periods, when U4 ,6 m s21, our model for the stratified water column predictsthat TG ,, T mix
D (Fig. 14b) and a strong concentrationboundary layer should form (Fig. 7b). When the surfacewind speed exceeds 6 m s21 the water column fully mixes(i.e., Dr R 0), the stratification becomes neutral, TG .T mix
D and erosion of the concentration boundary layer isexpected. These analytical predictions are dynamicallyconsistent with the numerical results (Fig. 7).
The model for the neutrally stratified water column(Eq. 8) predicts that T stir
D ,, TG over the entire 45-dobservational period. Under these conditions T stir
D ,1 h,implying that the western basin of Lake Erie should mixvery rapidly and concentration boundary-layer formation
Fig. 13. Algae mass balances for western basin controlvolume (segments 2–48) for simulations (a) NOZM, (b) ZM90,and (c) TMR90. DR 5 Detroit River influent, CB 5 exchange tocentral basin, GR 5 net growth (growth minus mortality andsettling), ZM 5 dreissenid mussel grazing, ZP 5 zooplanktongrazing. Error bars in b) and c) denote fluctuation in totals forZMQ 5 45 mL mussel21 h21 and 135 mL mussel21 h21 relativeto the simulations shown for ZMQ 5 90 mL mussel21 h21.
Fig. 14. Seasonal variation in the relationships amongthermal stratification, wind stress and the time scales of musselgrazing, diffusive stirring, and diffusive mixing at the W1 samplingsite (segment 27) in Lake Erie, 1994 (a) Time series of the observeddaily 12:00-h water density and temperature difference betweensurface and near-bed observations at W1 (from Boegman et al.2001; their fig. 7b). (b) Time series of the daily TG (mussel grazingtimescale), T stir
D (diffusive stirring timescale), and T mixD (diffusive
mixing timescale). The shading denotes periods when mean dailyU4 .6 m s21. We used mean daily wind speeds to evaluate T stir
D
and T mixD because fluctuations in the wind stress occurring over
timescales less than the diffusive timescale will not effectively mixthe water column. This averaging removes high-frequencyfluctuations while preserving the mean daily system response.
Stratification and zebra mussels 1107

would be quite infrequent. However, although the strati-fication is weak (shown to be generally ,0.5 kg m23 or 2uCbetween surface and bottom waters), a neutral stratificationmodel is inappropriate and the effects of weak stratificationin inhibiting mixing must be considered.
A model of the vertical diffusion coefficient—Reynolds-averaged lake models such as CE-QUAL-W2, solve thegoverning equations by applying a turbulence closurescheme in the form of a Kz parameterization, which is afunction of the resolved flow dynamics (e.g., Eq. 3). Oftenwe wish to estimate Kz from field data but, as is the casewith Reynolds-averaged models, are not able to directlyresolve the flow at turbulent scales. An analyticalparameterization for Kz, suitable for use with field data,may be formulated by equating TD and T mix
D . Substitutionof typical values from this study into Eqs. 1 and 10 showstheir equivalence
TD *H2
Kz
*102
10{3* 105 s and
TmixD *
N2H3
u3�
*10{4103
10{6* 105 s
ð11Þ
Rearranging for Kz leads to a simple parameterization forthe vertical mixing coefficient
Kz *u3�
N2Hð12Þ
This model is of the same form as that given by Imbodenand Wuest (1995) and is appropriate for shallow systemsthat do not seasonally stratify. The variables may be readilymeasured using a thermistor chain and a wind anemometer.The mean daily Kz computed from Eq. 12 reproduces thenumerically modeled average daily water column Kz over
Fig. 15. Seasonal variation in the observed (a) daily average bulk buoyancy frequency and (b) shear velocity at field site W1, 1994.(c) Comparison of numerical Kz versus Kz from Eq. 12 with a unit constant of proportionality. We calculated the numerical Kz andobserved N as daily averages of instantaneous hourly data, while u* is calculated from daily averages of 10-min average U4 observations.
1108 Boegman et al.

several orders of magnitude during the 47-d observationalperiod (Fig. 15). The model Eq. 12 becomes invalid as N R0 (Fig. 15a, near day 137). Here a balance between Eq. 1 andEq. 8 should be more suitable (i.e., Kz , u*H), where fromEq. 8 H/u* , 10/1022 , 103 s ,, 105 s. However, Kz is stilloverpredicted by a factor of 50 near day 137 (17 May).
Discussion
The results from this study show the importance of wind-induced mixing and weak stratification in regulating thesupply of plankton to benthic mussel beds. We found thepresence of a concentration boundary layer to be the typicalstate of the western basin and, hence, the effects of dreissenidmussels are less than previously estimated by applyingpotential filtering capacity models (e.g., MacIsaac et al.1992; Bunt et al. 1993). Moreover, we showed that weakdiurnal stratification (,0.5 kg m23 or 2uC between surfaceand bottom waters) is sufficient to suppress vertical mixingand plankton supply to the benthos. Advective riverinemodels that neglect wind stress and assume a neutrallystratified water column do not adequately describe the westernbasin dynamics. We found that surface wind speeds of U4 .6 m s21 are sufficient to vertically mix the water column, thuseroding the concentration boundary layer. Edwards et al.(2005) found a small temperature difference (0.1uC) betweensurface and bottom waters at their study site, so they couldreasonably neglect the effects of stratification, but notnecessarily wind stress, when calculating the vertical turbulentmixing rate. However, MacIsaac et al. (1999) observed largertemperature differences of #2uC (Dr # 0.5 kg m23), whichare comparable to the observations in Fig. 14a. Theirconclusion that the western basin of Lake Erie is usually wellmixed vertically during summer months and that the weaktemperature difference of 1uC to 2uC between lake surface andbottom does not constitute physical stratification—causingsettled Dreissena to have access to phytoplankton throughoutthe water column at most times (MacIsaac et al. 1992, 1999)—is not supported by our findings.
The importance of weak stratification may be illustratedusing a simple model of the wind energy required to mix astratified water column. Consider a water column equivalentto the mean basin depth (H 5 7 m), with a constanttemperature gradient from 21uC (r1 5 998.0 kg m23) at thesurface to 20uC (r2 5 998.25 kg m23) at the bed (e.g.,Fig. 9a), where r(z) 5 r2 2 (r1 + r2)(z/H) with z positiveupwards. The potential energy (PE ~ g
ÐH
0r zð Þzdz) per
square meter of the stratified water column is PES 5 g(2r1
+ r2)H2/6 and the potential energy per square meter of ahomogeneous water column of density (r1 + r2)/2 is PEM 5g(r1 + r2)H2/4. The energy required to homogenize the watercolumn is thus PEM 2 PES 5 g(r2 2 r1)H2 / 12 < 10 J m22. Ifall of this energy is produced by the surface wind stress, wherethe rate of work by the wind on the surface W
? < twus <0.3twu* (Fischer et al. 1979; their eq. 6.18), the mean dailywind speed needed to generate the required power is U10 56 m s21. Here, us is the surface drift velocity, the shear velocityu� &
ffiffiffiffiffiffiffiffiffiffiffiffitw=ro
p, and the surface shear stress tw < CD ra U 2
10,where CD 5 1.3 3 1023 (Fischer et al. 1979, p. 162), rA 51.2 kg m23 and ro 5 1,000 kg m23. From this simple model it
is evident that a significant amount of wind energy (,6 m s21
at 10 m for 24 h) is required to mix a weakly stratified andshallow water column. As expected this value is consistentwith the numerical, analytical, and observational results.
The grazing and diffusive timescales may be directlycompared to those computed using Eqs. 1 and 2 by Acker-man et al. (2001), who also worked at Sta. W2. They applied alogarithmic law-of-the-wall formulation to evaluate Kz frombarotropic seiching along the lake bed, the magnitude ofwhich was reduced in regions of stable stratification. Thismixing model was originally developed for inter-tidalestuarine systems (Frechette et al. 1989; Koseff et al. 1993;Butman et al. 1994) and has often been applied to westernLake Erie (MacIsaac et al. 1999; Ackerman et al. 2001;Edwards et al. 2005), where the near-bed barotropic seichecurrents have a period of 14 h and amplitude ,5 cm s21
(Boegman et al. 2001). Ackerman et al. (2001) found thatduring neutrally stratified periods TG . TD (11.9 h . 4.5 h)and a weak concentration boundary layer was expected.Conversely during stable stratification TG ,TD (11.9 h,10.4 h) and a relatively strong concentration boundarylayer was observed. Although these timescales are compara-ble to those found in this study as calculated using wind-mixing models and direct observations, Ackerman et al.(2001) found the logarithmic boundary layer model toprovide an accurate description of the flow ,2% of the timeand suggested that wind-forcing may play an important rolein regulating vertical mixing. The importance of wind-mixingis further supported by observations that show surface waveheights to be in excess of 0.5 m during strong wind events(Loewen et al. 2000, 2007), sufficient to increase near surfaceturbulence. The numerical mixing routine utilized in CE-QUAL-W2 parameterizes Kz in terms of the wind-inducedturbulence and the vertical shearing associated with hydrau-lic flow, wind stress, seiche currents, and the bottomboundary stress using Eqs. 3–5. Of these physical processes,which are all captured by the model, the surface wind stress isshown to be the dominant process governing mixing of thewater column (Fig. 7). Interestingly, the bottom boundarystress excited by seiche currents causes mixing that is also anindirect result of the surface wind stress.
We have numerically modeled the benthic–pelagic couplingover dreissenid mussel colonies in western Lake Erie. Whenmodeled as true benthic organisms, we found the dreissenidmussels consumed 53% of the net algal growth in the watercolumn during the simulation period, causing a reduction inthe pelagic algae concentration of ,0.1 mg L21, relative tothe no dreissenid mussel case. By comparison, a totally mixedreactor model predicted that 77% was grazed for the fullymixed case. The biomass grazed in the western basin wasgoverned by a balance between the timescales of vertical wind-induced mixing and benthic grazing over the water column.During calm conditions, weak stratification of 2uC(0.5 kg m23) between surface and bottom waters was shownto be sufficient to suppress vertical mixing when the meandaily wind speed U4 , 6 m s21, and a concentrationboundary layer of thickness ,1 m forms accounting for thereduced grazing. Erosion of the concentration boundary layeroccurred due to enhanced vertical turbulent mixing whensurface wind speeds were in excess of 6 m s21 facilitating
Stratification and zebra mussels 1109

algae supply to the benthos. We found the mean daily biomassgrazed by the mussels in the western basin to be governed bythe areal pumping rate a and the surface wind speed U4.Typically in the western basin, mean daily U4 , 6 m s21, thewater column is weakly stratified and a concentrationboundary layer forms when a . 2 m3 m22 d21. Thesefindings lead to the recommendation that the dynamics ofboth wind-mixing and thermal stratification be included in allmixing models applied to shallow and weakly stratifiedsystems such as the western basin of Lake Erie.
References
ACKERMAN, J. D., M. R. LOEWEN, AND P. F. HAMBLIN. 2001.Benthic–pelagic coupling over a zebra mussel reef in westernLake Erie. Limnol. Oceanogr. 46: 892–904.
BERKMAN, P. A., AND oTHERS. 1998. Invading mussel beds in LakeErie. Nature 393: 27–28.
BOEGMAN, L. 1999. Application of a two-dimensional hydrody-namic and water-quality model to Lake Erie. M.A.Sc. thesis,The Univ. of Toronto.
———. 2006. A model of the stratification and hypoxia in centralLake Erie, p. 608–613. In G. N. Ivey [ed.], Proc. 6thInternational Symposium on Stratified Flows, 11–14 Dec.IAHR, Univ. of Western Australia.
———, J. IMBERGER, G. N. IVEY, AND J. P. ANTENUCCI. 2003.High-frequency internal waves in large stratified lakes.Limnol. Oceanogr. 48: 895–919.
———, M. R. LOEWEN, D. A. CULVER, P. F. HAMBLIN, AND M. N.CHARLTON. In press. Spatial-dynamic modeling of algalbiomass in Lake Erie: Relative impacts of zebra musselsand nutrient loads. J. Environ. Eng.
———, ———, P. F. HAMBLIN, AND D. A. CULVER. 2001.Application of a two-dimensional hydrodynamic reservoirmodel to Lake Erie. Can. J. Fish. Aquat. Sci. 58: 858–869.
BUNT, C. M., H. J. MACISAAC, AND W. G. SPRULES. 1993. Pumpingrates and projected filtering impacts of juvenile zebra mussels(Dreissena polymorpha) in western Lake Erie. Can. J. Fish.Aquat. Sci. 50: 1017–1022.
BUTMAN, C. A., M. FRECHETTE, W. R. GEYER, AND V. R.STARCZAK. 1994. Flume experiments on food supply to theblue mussel Mytilus edulis L. as a function of boundary layerflow. Limnol. Oceanogr. 39: 1755–1768.
CHARLTON, M. N. 1994. The case for research on the effects ofzebra mussels in Lake Erie: Visualization of information fromAugust and September 1993. J. Biol. Syst. 2: 467–480.
COLE, T. M., AND E. M. BUCHAK. 1995. CE-QUAL-W2: A two-dimensional, laterally averaged, hydrodynamic and waterquality model, version 2.0: User manual. Instruction Rep. EL-95-1 of the U.S. Army Engineer Waterways ExperimentStation, Vicksburg, Mississippi, USA.
DEPINTO, J. V., T. C. YOUNG, AND L. M. MCILROY. 1986. GreatLakes water quality improvement. Environ. Sci. Technol. 20:752–759.
EDWARDS, W. J., C. R. REHMANN, E. MCDONALD, AND D. A.CULVER. 2005. The impact of a benthic filter feeder:Limitations imposed by physical transport of algae to thebenthos. Can. J. Fish. Aquat. Sci. 62: 205–214.
FISCHER, H. B., E. J. LIST, R. C. Y. KOH, J. IMBERGER, AND N. H.BROOKS. 1979. Mixing in inland and coastal waters. AcademicPress.
FRECHETTE, M., C. A. BUTMAN, AND W. R. GEYER. 1989. Theimportance of boundary-layer flows in supplying phytoplank-ton to the benthic suspension feeder, Mytilus edulis L. Limnol.Oceanogr. 34: 19–36.
HALTUCH, M. A., AND P. A. BERKMAN. 1999. Lake Erie geographicinformation system: Bathymetry, substrates and mussels.Publication No. OHSU-GS-20. The Ohio State Univ.
HAMBLIN, P. F. 1987. Meteorological forcing and water levelfluctuations on Lake Erie. J. Gt. Lakes Res. 13: 436–453.
HEBERT, P. D. N., C. C. WILSON, M. H. MURDOCH, AND R. LAZAR.1991. Demography and ecological impacts of the invadingmollusc Dreissena polymorpha. Can. J. Zool. 69: 405–409.
HECKY, R. E., R. E. H. SMITH, D. R. BARTON, S. J. GUILDFORD, W.D. TAYLOR, T. D. HOWELL, AND M. N. CHARLTON. 2004. Thenearshore shunt: A consequence of ecosystem engineering bydreissenids in the Laurentian Great Lakes. Can. J. FishAquatic Sci. 61: 1285–1293.
IMBODEN, D. M., AND A. WUEST. 1995. Mixing mechanisms inlakes, p. 83–138. In A. Lerman, D. M. Imboden and J. Gat[eds.], Physics and chemistry of lakes. Springer-Verlag.
KOSEFF, J. R., J. K. HOLEN, S. G. MONISMITH, AND J. E. CLOERN.1993. Coupled effects of vertical mixing and benthic grazingon phytoplankton populations in shallow, turbid estuaries. J.Mar. Res. 51: 843–868.
LEACH, J. H. 1975. Seston composition in the Point Pelee area ofLake Erie. Internationale Revue der gesamten Hydrobiologieund Hydrographie 60: 347–357.
LOEWEN, M. R., J. D. ACKERMAN, AND P. F. HAMBLIN. 2007.Environmental implications of stratification and turbulent mix-ing in a shallow lake basin. Can. J. Fish. Aquat. Sci. 64: 43–57.
———, P. F. HAMBLIN, AND J. D. ACKERMAN. 2000. Fieldobservations of stratification over a zebra mussel bed in the west-ern basin of Lake Erie, p. 255–260. In G. A. Lawrence, R. Pieters,and Y. Yonemitsu [eds.], Proc. 5th International Symposiumon Stratified Flows, 10–13 July 2000. Univ. of British Columbia.
LORKE, A., L. UMLAUF, T. JONAS, AND A. WUEST. 2002. Dynamicsof turbulence in low-speed oscillating bottom-boundary layersof stratified basins. Environ. Fluid Mech. 2: 291–313.
MACISAAC, H. J., W. G. SPRULES, O. E. JOHANNSSON, AND J. H.LEACH. 1992. Filtering impacts of larval and sessile zebra mussels(Dreissena polymorpha) in western Lake Erie. Oecologia 92: 30–39.
———, AND oTHERS. 1999. Filtering impacts of an introducedbivalve (Dreissena polymorpha) in a shallow lake: Applicationof a hydrodynamic model. Ecosystems 2: 338–350.
NOONBURG, E. G., B. J. SHUTER, AND P. A. ABRAMS. 2003. Indirecteffects of zebra mussels (Dreissena polymorpha) on theplanktonic food web. Can. J. Fish. Aquat. Sci. 60: 1353–68.
O’RIORDAN, C. A., S. G. MONISMITH, AND J. R. KOSEFF. 1995. Theeffect of bivalve excurrent jet dynamics on mass transfer in abenthic boundary layer. Limnol. Oceanogr. 40: 330–344.
PONTIUS, R. A., AND D. A. CULVER. 2001. Estimating zebra musselimpact on pelagic food webs: The role of size-specific grazingrates. Verhandlungen Internationale Vereinigung fur Theore-tische und Angewandte Limnologie 27: 3025–3028.
SPIGEL, R. H., AND J. IMBERGER. 1980. The classification of mixed-layer dynamics in lakes of small to medium size. J. Phys.Oceanogr. 10: 1104–1121.
———, J. IMBERGER, AND K. N. RAYNER. 1986. Modeling thediurnal mixed layer. Limnol. Oceanogr. 31: 533–556.
YEATES, P. S., AND J. IMBERGER. 2003. Pseudo two-dimensionalsimulations of internal and boundary fluxes in stratified lakesand reservoirs. Int. J. River Basin Manag. 1: 297–319.
YU, N., AND D. A. CULVER. 1999. Estimating the effectiveclearance rate and refiltration by zebra mussels, Dreissenapolymorpha, in a stratified reservoir. Freshw. Biol. 41: 481–492.
Received: 19 January 2007Accepted: 10 January 2008Amended: 10 January 2008
1110 Boegman et al.