bobtail: avoiding long tails in the cloud - usenix · bobtail: avoiding long tails in the cloud...
TRANSCRIPT

USENIX Association 10th USENIX Symposium on Networked Systems Design and Implementation (NSDI ’13) 329
Bobtail: Avoiding Long Tails in the Cloud
Yunjing Xu, Zachary Musgrave, Brian Noble, Michael BaileyUniversity of Michigan
{yunjing,ztm,bnoble,mibailey}@umich.edu
Abstract
Highly modular data center applications such as Bing,Facebook, and Amazon’s retail platform are known tobe susceptible to long tails in response times. Servicessuch as Amazon’s EC2 have proven attractive platformsfor building similar applications. Unfortunately, virtual-ization used in such platforms exacerbates the long tailproblem by factors of two to four. Surprisingly, we findthat poor response times in EC2 are a property of nodesrather than the network, and that this property of nodes isboth pervasive throughout EC2 and persistent over time.The root cause of this problem is co-scheduling of CPU-bound and latency-sensitive tasks. We leverage these ob-servations in Bobtail, a system that proactively detectsand avoids these bad neighboring VMs without signifi-cantly penalizing node instantiation. With Bobtail, com-mon communication patterns benefit from reductions ofup to 40% in 99.9th percentile response times.
1 Introduction
Modern Web applications such as Bing, Facebook, andAmazon’s retail platform are both interactive and dy-namic. They rely on large-scale data centers with manynodes processing large data sets at less than human-scaleresponse times. Constructing a single page view on sucha site may require contacting hundreds of services [7],and a lag in response time from any one of them canresult in significant end-to-end delays [1] and a pooropinion of the overall site [5]. Latency is increasinglyviewed as the problem to solve [17, 18]. In these datacenter applications, the long tail of latency is of partic-ular concern, with 99.9th percentile network round-triptimes (RTTs) that are orders of magnitude worse thanthe median [1, 2, 29]. For these systems, one out of athousand customer requests will suffer an unacceptabledelay.
Prior studies have all targeted dedicated data centers.
In these, network congestion is the cause of long-tail be-havior. However, an increasing number of Internet-scaleapplications are deployed on commercial clouds such asAmazon’s Elastic Compute Cloud, or EC2. There area variety of reasons for doing so, and the recent EC2outage [21] indicates that many popular online servicesrely heavily on Amazon’s cloud. One distinction betweendedicated data centers and services such as EC2 is the useof virtualization to provide for multi-tenancy with somedegree of isolation. While virtualization does negativelyimpact latency overall [24, 19], little is known about thelong-tail behavior on these platforms.
Our own large-scale measurements of EC2 suggestthat median RTTs are comparable to those observed indedicated centers, but the 99.9th percentile RTTs are upto four times longer. Surprisingly, we also find that nodesof the same configuration (and cost) can have long-tailbehaviors that differ from one another by as much asan order of magnitude. This has important implications,as good nodes we measured can have long-tail behav-iors better than those observed in dedicated data cen-ters [1, 29] due to the difference in network congestion,while bad nodes are considerably worse. This classifica-tion appears to be a property of the nodes themselves,not data center organization or topology. In particular,bad nodes appear bad to all others, whether they arein the same or different data centers. Furthermore, wefind that this property is relatively stable; good nodesare likely to remain good, and likewise for bad nodeswithin our five-week experimental period. Conventionalwisdom dictates that larger (and therefore more expen-sive) nodes are not susceptible to this problem, but wefind that larger nodes are not always better than smallerones.
Using measurement results and controlled experi-ments, we find the root cause of the problem to bean interaction between virtualization, processor sharing,and non-complementary workload patterns. In particular,mixing latency-sensitive jobs on the same node with sev-
1
330 10th USENIX Symposium on Networked Systems Design and Implementation (NSDI ’13) USENIX Association
eral CPU-intensive jobs leads to longer-than-anticipatedscheduling delays, despite efforts of the virtualizationlayer to avoid them. With this insight, we develop a sim-ple yet effective test that runs locally on a newborn in-stance and screens between good and bad nodes. Wemeasure common communication patterns [29] on liveEC2 instances, and we show improvement in long-tailbehavior of between 7% and 40%. While some limitsto scale remain, our system effectively removes this firstbarrier.
2 Observations
Amazon’s Elastic Compute Cloud, or EC2, provides dy-namic, fine-grained access to computational and storageresources. Virtualization is a key enabler of EC2. We pro-vide background on some of these techniques, and we de-scribe a five-week measurement study of network latencyin several different EC2 data centers. Such latency hasboth significant jitter and a longer tail than that observedin dedicated data centers. Surprisingly, the extra long tailphenomenon is a property of nodes, rather than topologyor network traffic; it is pervasive throughout EC2 datacenters and it is reasonably persistent.
2.1 Amazon EC2 BackgroundAmazon EC2 consists of multiple geographically sepa-rated regions around the world. Each region contains sev-eral availability zones, or AZs, that are physically iso-lated and have independent failure probabilities. Thus,one AZ is roughly equivalent to one data center. A ver-sion of the Xen hypervisor [3], with various (unknown)customizations, is used in EC2. A VM in EC2 is called aninstance, and different types (e.g., small, medium, large,and extra large) of instances come with different perfor-mance characteristics and price tags. Instances within thesame AZ or in different AZs within the same region areconnected by a high-speed private network. However,instances within different regions are connected by thepublic Internet. In this paper, we focus on network taillatency between EC2 instances in the same region.
2.2 Measurement MethodologyAlizadeh et al. show that the internal infrastructure ofWeb applications is based primarily on TCP [1]. But in-stead of using raw TCP measurement, we use a TCP-based RPC framework called Thrift. Thrift is popularamong Web companies like Facebook [20] and delivers amore realistic measure of network performance at the ap-plication level. To measure application-level round-trip-times (RTTs), we time the completion of synchronousRPC calls—Thrift adds about 60µs of overhead when
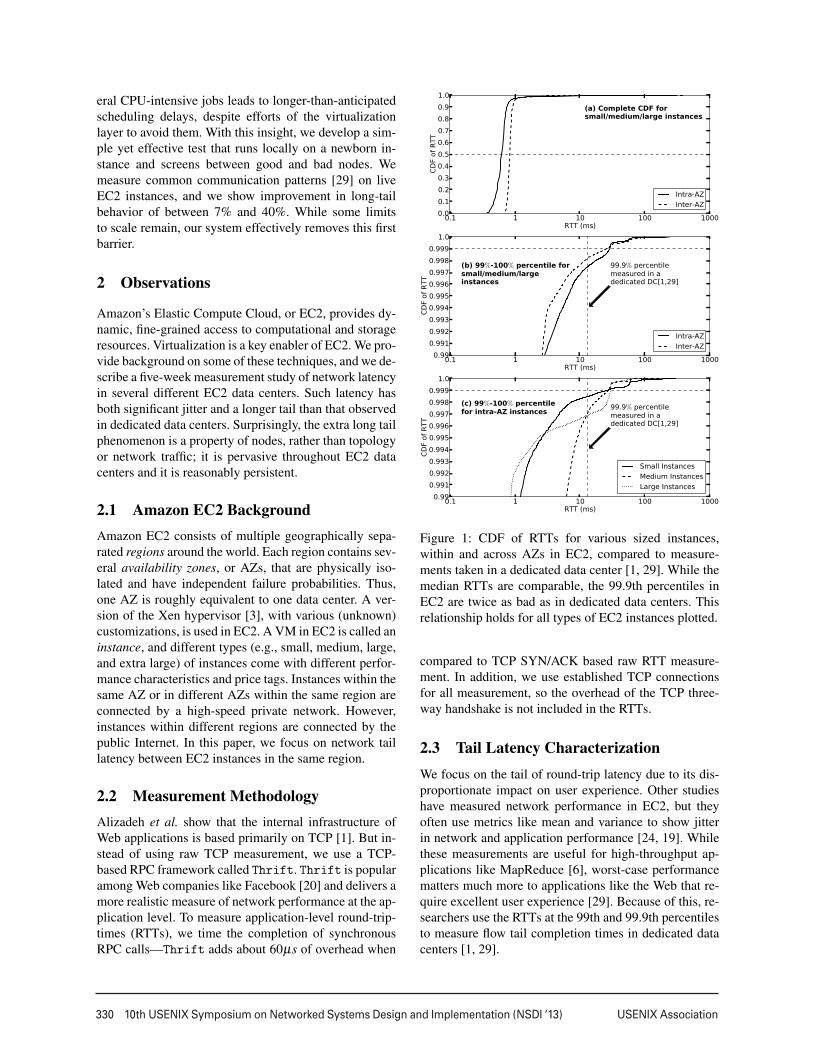
Figure 1: CDF of RTTs for various sized instances,within and across AZs in EC2, compared to measure-ments taken in a dedicated data center [1, 29]. While themedian RTTs are comparable, the 99.9th percentiles inEC2 are twice as bad as in dedicated data centers. Thisrelationship holds for all types of EC2 instances plotted.
compared to TCP SYN/ACK based raw RTT measure-ment. In addition, we use established TCP connectionsfor all measurement, so the overhead of the TCP three-way handshake is not included in the RTTs.
2.3 Tail Latency CharacterizationWe focus on the tail of round-trip latency due to its dis-proportionate impact on user experience. Other studieshave measured network performance in EC2, but theyoften use metrics like mean and variance to show jitterin network and application performance [24, 19]. Whilethese measurements are useful for high-throughput ap-plications like MapReduce [6], worst-case performancematters much more to applications like the Web that re-quire excellent user experience [29]. Because of this, re-searchers use the RTTs at the 99th and 99.9th percentilesto measure flow tail completion times in dedicated datacenters [1, 29].
2
USENIX Association 10th USENIX Symposium on Networked Systems Design and Implementation (NSDI ’13) 331
We tested network latency in EC2’s US east region forfive weeks. Figure 1 shows CDFs for both a combina-tion of small, medium, and large instances and for dis-crete sets of those instances. While (a) and (b) show ag-gregate measurements both within and across availabilityzones (AZs), (c) shows discrete measurements for threeinstance types within a specific AZ.
In Figure 1(a), we instantiated 20 instances of eachtype for each plot, either within a single AZ or across twoAZs in the same region. We observe that median RTTswithin a single AZ, at ∼0.6ms, compare well to thosefound within a dedicated data center at ∼0.4ms [1, 29],even though our measurement method adds 0.06ms ofoverhead. Inter-AZ measurements show a median RTTof under 1ms. However, distances between pairs of AZsmay vary; measurements taken from another pair of AZsshow a median RTT of around 2ms.
Figure 1(b) shows the 99th to 100th percentile range of(a) across all observations. Unfortunately, its results painta different picture of latency measurements in Amazon’sdata centers. The 99.9th percentile of RTT measurementsis twice as bad as the same metric in a dedicated data cen-ter [1, 29]. Individual nodes can have 99.9th percentileRTTs up to four times higher than those seen in such cen-ters. Note that this observation holds for both curves; nomatter whether the measurements are taken in the samedata center or in different ones, the 99.9th percentiles arealmost the same.
Medium, large, and extra large instances ostensiblyoffer better performance than their small counterparts.As one might expect, our measurements show that ex-tra large instances do not exhibit the extra long tail prob-lem (< 0.9ms for the 99.9th percentile); but surprisingly,as shown in Figure 1(c), medium and large instances aresusceptible to the problem. In other words, the extra longtail is not caused by a specific type of instance: all in-stance types shown in (c) are equally susceptible to theextra long tail at the 99.9th percentile. Note that all threelines in the figure intersect at the 99.9th line with a valueof around 30ms. The explanation of this phenomenon be-comes evident in the discussion of the root cause of thelong tail problem in § 3.2.
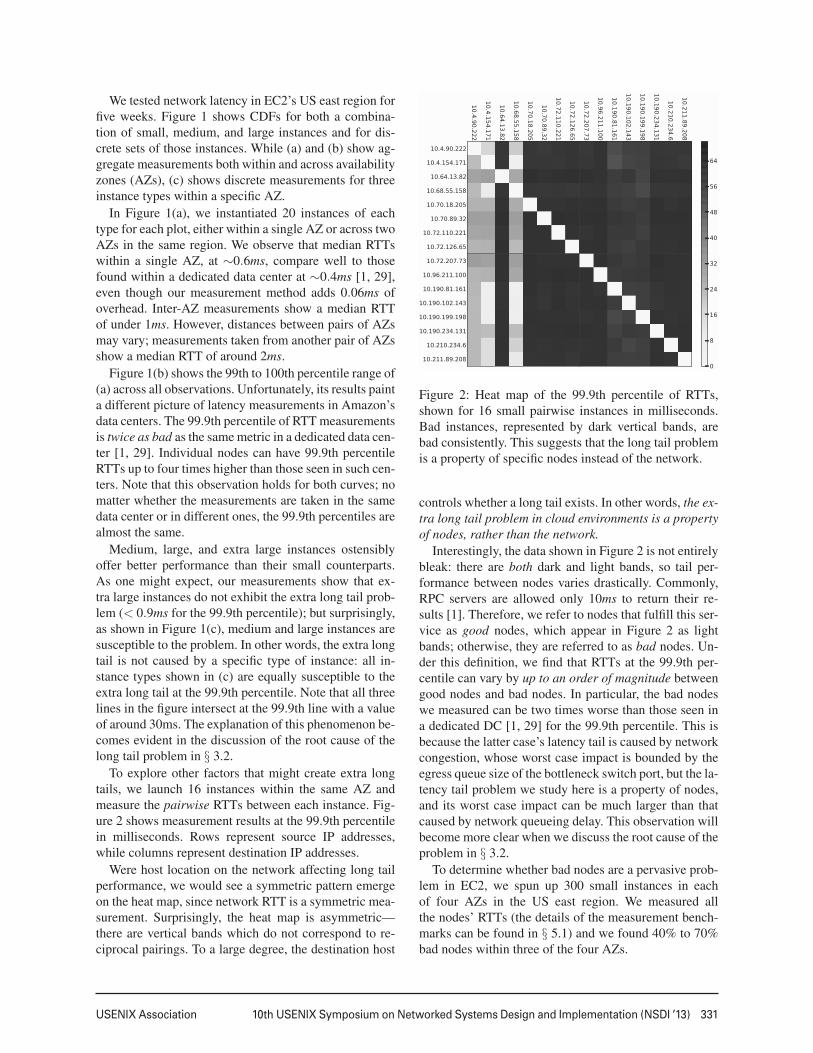
To explore other factors that might create extra longtails, we launch 16 instances within the same AZ andmeasure the pairwise RTTs between each instance. Fig-ure 2 shows measurement results at the 99.9th percentilein milliseconds. Rows represent source IP addresses,while columns represent destination IP addresses.
Were host location on the network affecting long tailperformance, we would see a symmetric pattern emergeon the heat map, since network RTT is a symmetric mea-surement. Surprisingly, the heat map is asymmetric—there are vertical bands which do not correspond to re-ciprocal pairings. To a large degree, the destination host
Figure 2: Heat map of the 99.9th percentile of RTTs,shown for 16 small pairwise instances in milliseconds.Bad instances, represented by dark vertical bands, arebad consistently. This suggests that the long tail problemis a property of specific nodes instead of the network.
controls whether a long tail exists. In other words, the ex-tra long tail problem in cloud environments is a propertyof nodes, rather than the network.
Interestingly, the data shown in Figure 2 is not entirelybleak: there are both dark and light bands, so tail per-formance between nodes varies drastically. Commonly,RPC servers are allowed only 10ms to return their re-sults [1]. Therefore, we refer to nodes that fulfill this ser-vice as good nodes, which appear in Figure 2 as lightbands; otherwise, they are referred to as bad nodes. Un-der this definition, we find that RTTs at the 99.9th per-centile can vary by up to an order of magnitude betweengood nodes and bad nodes. In particular, the bad nodeswe measured can be two times worse than those seen ina dedicated DC [1, 29] for the 99.9th percentile. This isbecause the latter case’s latency tail is caused by networkcongestion, whose worst case impact is bounded by theegress queue size of the bottleneck switch port, but the la-tency tail problem we study here is a property of nodes,and its worst case impact can be much larger than thatcaused by network queueing delay. This observation willbecome more clear when we discuss the root cause of theproblem in § 3.2.
To determine whether bad nodes are a pervasive prob-lem in EC2, we spun up 300 small instances in eachof four AZs in the US east region. We measured allthe nodes’ RTTs (the details of the measurement bench-marks can be found in § 5.1) and we found 40% to 70%bad nodes within three of the four AZs.
3
332 10th USENIX Symposium on Networked Systems Design and Implementation (NSDI ’13) USENIX Association
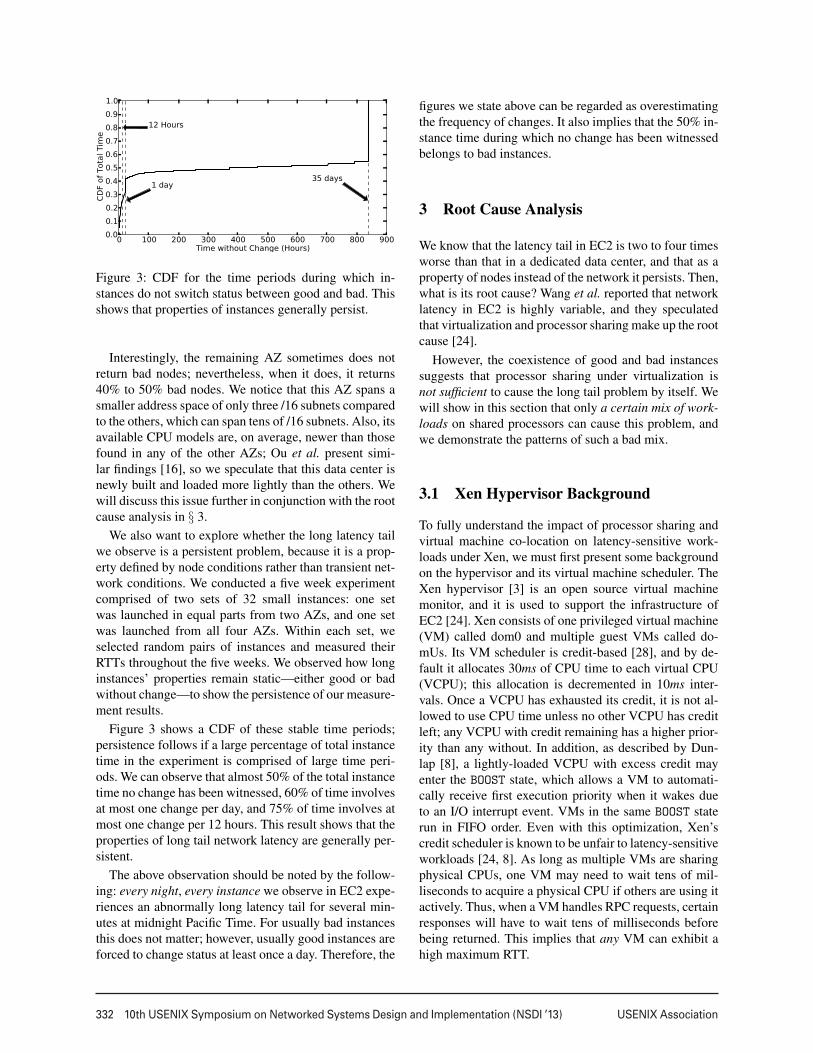
Figure 3: CDF for the time periods during which in-stances do not switch status between good and bad. Thisshows that properties of instances generally persist.
Interestingly, the remaining AZ sometimes does notreturn bad nodes; nevertheless, when it does, it returns40% to 50% bad nodes. We notice that this AZ spans asmaller address space of only three /16 subnets comparedto the others, which can span tens of /16 subnets. Also, itsavailable CPU models are, on average, newer than thosefound in any of the other AZs; Ou et al. present simi-lar findings [16], so we speculate that this data center isnewly built and loaded more lightly than the others. Wewill discuss this issue further in conjunction with the rootcause analysis in § 3.
We also want to explore whether the long latency tailwe observe is a persistent problem, because it is a prop-erty defined by node conditions rather than transient net-work conditions. We conducted a five week experimentcomprised of two sets of 32 small instances: one setwas launched in equal parts from two AZs, and one setwas launched from all four AZs. Within each set, weselected random pairs of instances and measured theirRTTs throughout the five weeks. We observed how longinstances’ properties remain static—either good or badwithout change—to show the persistence of our measure-ment results.
Figure 3 shows a CDF of these stable time periods;persistence follows if a large percentage of total instancetime in the experiment is comprised of large time peri-ods. We can observe that almost 50% of the total instancetime no change has been witnessed, 60% of time involvesat most one change per day, and 75% of time involves atmost one change per 12 hours. This result shows that theproperties of long tail network latency are generally per-sistent.
The above observation should be noted by the follow-ing: every night, every instance we observe in EC2 expe-riences an abnormally long latency tail for several min-utes at midnight Pacific Time. For usually bad instancesthis does not matter; however, usually good instances areforced to change status at least once a day. Therefore, the
figures we state above can be regarded as overestimatingthe frequency of changes. It also implies that the 50% in-stance time during which no change has been witnessedbelongs to bad instances.
3 Root Cause Analysis
We know that the latency tail in EC2 is two to four timesworse than that in a dedicated data center, and that as aproperty of nodes instead of the network it persists. Then,what is its root cause? Wang et al. reported that networklatency in EC2 is highly variable, and they speculatedthat virtualization and processor sharing make up the rootcause [24].
However, the coexistence of good and bad instancessuggests that processor sharing under virtualization isnot sufficient to cause the long tail problem by itself. Wewill show in this section that only a certain mix of work-loads on shared processors can cause this problem, andwe demonstrate the patterns of such a bad mix.
3.1 Xen Hypervisor Background
To fully understand the impact of processor sharing andvirtual machine co-location on latency-sensitive work-loads under Xen, we must first present some backgroundon the hypervisor and its virtual machine scheduler. TheXen hypervisor [3] is an open source virtual machinemonitor, and it is used to support the infrastructure ofEC2 [24]. Xen consists of one privileged virtual machine(VM) called dom0 and multiple guest VMs called do-mUs. Its VM scheduler is credit-based [28], and by de-fault it allocates 30ms of CPU time to each virtual CPU(VCPU); this allocation is decremented in 10ms inter-vals. Once a VCPU has exhausted its credit, it is not al-lowed to use CPU time unless no other VCPU has creditleft; any VCPU with credit remaining has a higher prior-ity than any without. In addition, as described by Dun-lap [8], a lightly-loaded VCPU with excess credit mayenter the BOOST state, which allows a VM to automati-cally receive first execution priority when it wakes dueto an I/O interrupt event. VMs in the same BOOST staterun in FIFO order. Even with this optimization, Xen’scredit scheduler is known to be unfair to latency-sensitiveworkloads [24, 8]. As long as multiple VMs are sharingphysical CPUs, one VM may need to wait tens of mil-liseconds to acquire a physical CPU if others are using itactively. Thus, when a VM handles RPC requests, certainresponses will have to wait tens of milliseconds beforebeing returned. This implies that any VM can exhibit ahigh maximum RTT.
4
USENIX Association 10th USENIX Symposium on Networked Systems Design and Implementation (NSDI ’13) 333
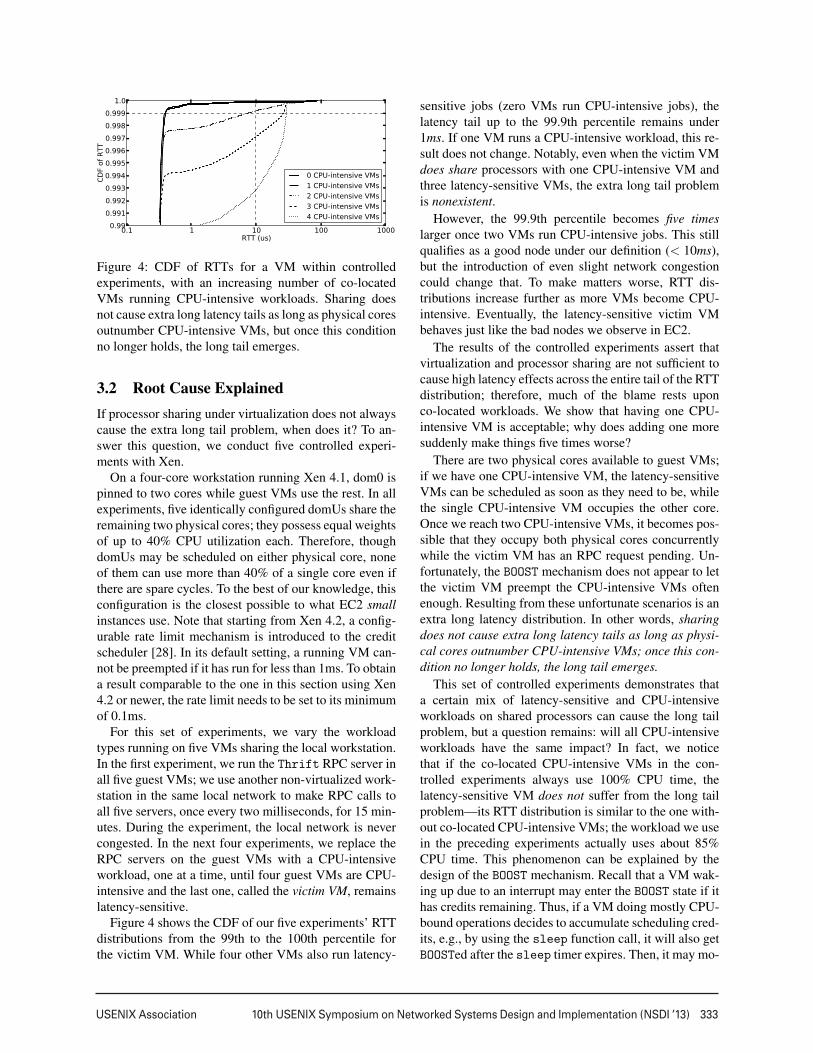
Figure 4: CDF of RTTs for a VM within controlledexperiments, with an increasing number of co-locatedVMs running CPU-intensive workloads. Sharing doesnot cause extra long latency tails as long as physical coresoutnumber CPU-intensive VMs, but once this conditionno longer holds, the long tail emerges.
3.2 Root Cause ExplainedIf processor sharing under virtualization does not alwayscause the extra long tail problem, when does it? To an-swer this question, we conduct five controlled experi-ments with Xen.
On a four-core workstation running Xen 4.1, dom0 ispinned to two cores while guest VMs use the rest. In allexperiments, five identically configured domUs share theremaining two physical cores; they possess equal weightsof up to 40% CPU utilization each. Therefore, thoughdomUs may be scheduled on either physical core, noneof them can use more than 40% of a single core even ifthere are spare cycles. To the best of our knowledge, thisconfiguration is the closest possible to what EC2 smallinstances use. Note that starting from Xen 4.2, a config-urable rate limit mechanism is introduced to the creditscheduler [28]. In its default setting, a running VM can-not be preempted if it has run for less than 1ms. To obtaina result comparable to the one in this section using Xen4.2 or newer, the rate limit needs to be set to its minimumof 0.1ms.
For this set of experiments, we vary the workloadtypes running on five VMs sharing the local workstation.In the first experiment, we run the Thrift RPC server inall five guest VMs; we use another non-virtualized work-station in the same local network to make RPC calls toall five servers, once every two milliseconds, for 15 min-utes. During the experiment, the local network is nevercongested. In the next four experiments, we replace theRPC servers on the guest VMs with a CPU-intensiveworkload, one at a time, until four guest VMs are CPU-intensive and the last one, called the victim VM, remainslatency-sensitive.
Figure 4 shows the CDF of our five experiments’ RTTdistributions from the 99th to the 100th percentile forthe victim VM. While four other VMs also run latency-
sensitive jobs (zero VMs run CPU-intensive jobs), thelatency tail up to the 99.9th percentile remains under1ms. If one VM runs a CPU-intensive workload, this re-sult does not change. Notably, even when the victim VMdoes share processors with one CPU-intensive VM andthree latency-sensitive VMs, the extra long tail problemis nonexistent.
However, the 99.9th percentile becomes five timeslarger once two VMs run CPU-intensive jobs. This stillqualifies as a good node under our definition (< 10ms),but the introduction of even slight network congestioncould change that. To make matters worse, RTT dis-tributions increase further as more VMs become CPU-intensive. Eventually, the latency-sensitive victim VMbehaves just like the bad nodes we observe in EC2.
The results of the controlled experiments assert thatvirtualization and processor sharing are not sufficient tocause high latency effects across the entire tail of the RTTdistribution; therefore, much of the blame rests uponco-located workloads. We show that having one CPU-intensive VM is acceptable; why does adding one moresuddenly make things five times worse?
There are two physical cores available to guest VMs;if we have one CPU-intensive VM, the latency-sensitiveVMs can be scheduled as soon as they need to be, whilethe single CPU-intensive VM occupies the other core.Once we reach two CPU-intensive VMs, it becomes pos-sible that they occupy both physical cores concurrentlywhile the victim VM has an RPC request pending. Un-fortunately, the BOOST mechanism does not appear to letthe victim VM preempt the CPU-intensive VMs oftenenough. Resulting from these unfortunate scenarios is anextra long latency distribution. In other words, sharingdoes not cause extra long latency tails as long as physi-cal cores outnumber CPU-intensive VMs; once this con-dition no longer holds, the long tail emerges.
This set of controlled experiments demonstrates thata certain mix of latency-sensitive and CPU-intensiveworkloads on shared processors can cause the long tailproblem, but a question remains: will all CPU-intensiveworkloads have the same impact? In fact, we noticethat if the co-located CPU-intensive VMs in the con-trolled experiments always use 100% CPU time, thelatency-sensitive VM does not suffer from the long tailproblem—its RTT distribution is similar to the one with-out co-located CPU-intensive VMs; the workload we usein the preceding experiments actually uses about 85%CPU time. This phenomenon can be explained by thedesign of the BOOST mechanism. Recall that a VM wak-ing up due to an interrupt may enter the BOOST state if ithas credits remaining. Thus, if a VM doing mostly CPU-bound operations decides to accumulate scheduling cred-its, e.g., by using the sleep function call, it will also getBOOSTed after the sleep timer expires. Then, it may mo-
5
334 10th USENIX Symposium on Networked Systems Design and Implementation (NSDI ’13) USENIX Association
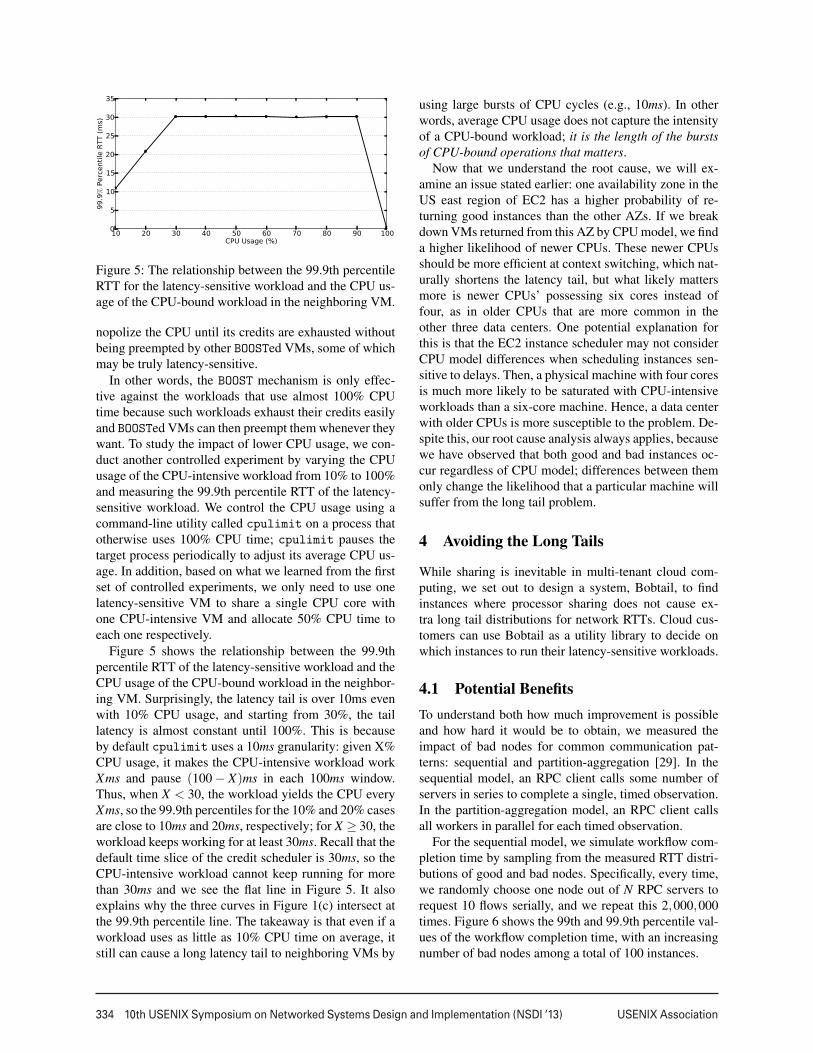
Figure 5: The relationship between the 99.9th percentileRTT for the latency-sensitive workload and the CPU us-age of the CPU-bound workload in the neighboring VM.
nopolize the CPU until its credits are exhausted withoutbeing preempted by other BOOSTed VMs, some of whichmay be truly latency-sensitive.
In other words, the BOOST mechanism is only effec-tive against the workloads that use almost 100% CPUtime because such workloads exhaust their credits easilyand BOOSTed VMs can then preempt them whenever theywant. To study the impact of lower CPU usage, we con-duct another controlled experiment by varying the CPUusage of the CPU-intensive workload from 10% to 100%and measuring the 99.9th percentile RTT of the latency-sensitive workload. We control the CPU usage using acommand-line utility called cpulimit on a process thatotherwise uses 100% CPU time; cpulimit pauses thetarget process periodically to adjust its average CPU us-age. In addition, based on what we learned from the firstset of controlled experiments, we only need to use onelatency-sensitive VM to share a single CPU core withone CPU-intensive VM and allocate 50% CPU time toeach one respectively.
Figure 5 shows the relationship between the 99.9thpercentile RTT of the latency-sensitive workload and theCPU usage of the CPU-bound workload in the neighbor-ing VM. Surprisingly, the latency tail is over 10ms evenwith 10% CPU usage, and starting from 30%, the taillatency is almost constant until 100%. This is becauseby default cpulimit uses a 10ms granularity: given X%CPU usage, it makes the CPU-intensive workload workXms and pause (100 − X)ms in each 100ms window.Thus, when X < 30, the workload yields the CPU everyXms, so the 99.9th percentiles for the 10% and 20% casesare close to 10ms and 20ms, respectively; for X ≥ 30, theworkload keeps working for at least 30ms. Recall that thedefault time slice of the credit scheduler is 30ms, so theCPU-intensive workload cannot keep running for morethan 30ms and we see the flat line in Figure 5. It alsoexplains why the three curves in Figure 1(c) intersect atthe 99.9th percentile line. The takeaway is that even if aworkload uses as little as 10% CPU time on average, itstill can cause a long latency tail to neighboring VMs by
using large bursts of CPU cycles (e.g., 10ms). In otherwords, average CPU usage does not capture the intensityof a CPU-bound workload; it is the length of the burstsof CPU-bound operations that matters.
Now that we understand the root cause, we will ex-amine an issue stated earlier: one availability zone in theUS east region of EC2 has a higher probability of re-turning good instances than the other AZs. If we breakdown VMs returned from this AZ by CPU model, we finda higher likelihood of newer CPUs. These newer CPUsshould be more efficient at context switching, which nat-urally shortens the latency tail, but what likely mattersmore is newer CPUs’ possessing six cores instead offour, as in older CPUs that are more common in theother three data centers. One potential explanation forthis is that the EC2 instance scheduler may not considerCPU model differences when scheduling instances sen-sitive to delays. Then, a physical machine with four coresis much more likely to be saturated with CPU-intensiveworkloads than a six-core machine. Hence, a data centerwith older CPUs is more susceptible to the problem. De-spite this, our root cause analysis always applies, becausewe have observed that both good and bad instances oc-cur regardless of CPU model; differences between themonly change the likelihood that a particular machine willsuffer from the long tail problem.
4 Avoiding the Long Tails
While sharing is inevitable in multi-tenant cloud com-puting, we set out to design a system, Bobtail, to findinstances where processor sharing does not cause ex-tra long tail distributions for network RTTs. Cloud cus-tomers can use Bobtail as a utility library to decide onwhich instances to run their latency-sensitive workloads.
4.1 Potential BenefitsTo understand both how much improvement is possibleand how hard it would be to obtain, we measured theimpact of bad nodes for common communication pat-terns: sequential and partition-aggregation [29]. In thesequential model, an RPC client calls some number ofservers in series to complete a single, timed observation.In the partition-aggregation model, an RPC client callsall workers in parallel for each timed observation.
For the sequential model, we simulate workflow com-pletion time by sampling from the measured RTT distri-butions of good and bad nodes. Specifically, every time,we randomly choose one node out of N RPC servers torequest 10 flows serially, and we repeat this 2,000,000times. Figure 6 shows the 99th and 99.9th percentile val-ues of the workflow completion time, with an increasingnumber of bad nodes among a total of 100 instances.
6
USENIX Association 10th USENIX Symposium on Networked Systems Design and Implementation (NSDI ’13) 335
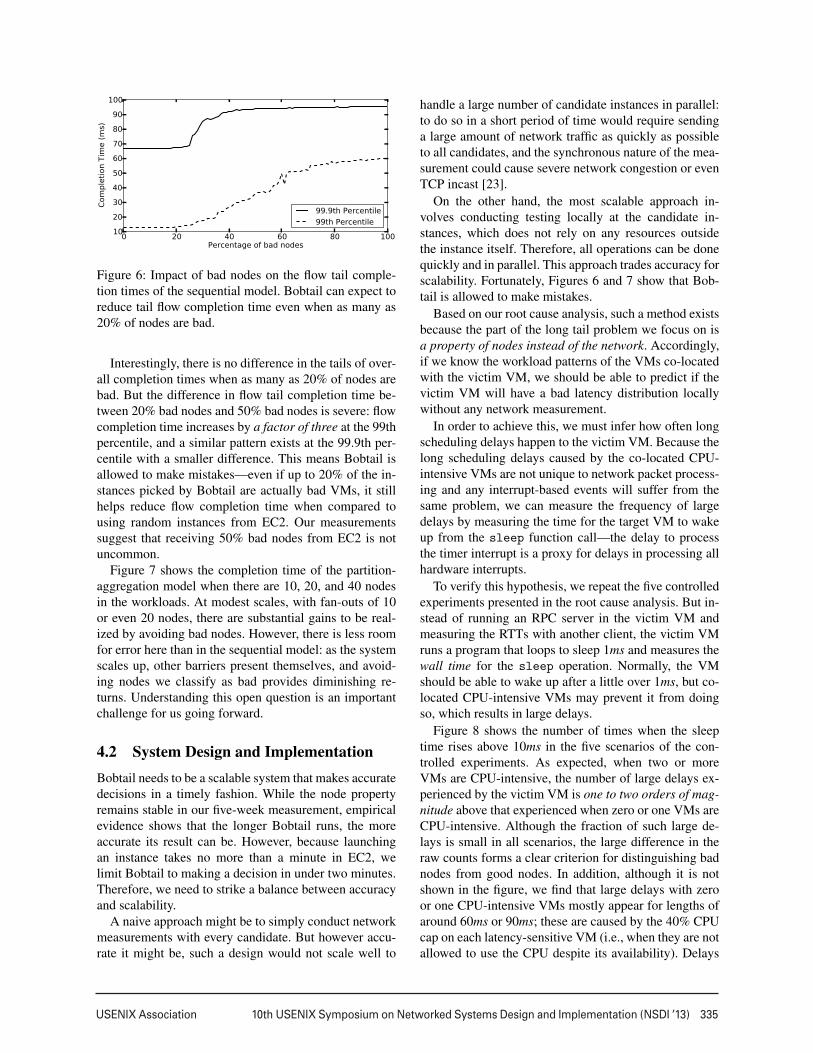
Figure 6: Impact of bad nodes on the flow tail comple-tion times of the sequential model. Bobtail can expect toreduce tail flow completion time even when as many as20% of nodes are bad.
Interestingly, there is no difference in the tails of over-all completion times when as many as 20% of nodes arebad. But the difference in flow tail completion time be-tween 20% bad nodes and 50% bad nodes is severe: flowcompletion time increases by a factor of three at the 99thpercentile, and a similar pattern exists at the 99.9th per-centile with a smaller difference. This means Bobtail isallowed to make mistakes—even if up to 20% of the in-stances picked by Bobtail are actually bad VMs, it stillhelps reduce flow completion time when compared tousing random instances from EC2. Our measurementssuggest that receiving 50% bad nodes from EC2 is notuncommon.
Figure 7 shows the completion time of the partition-aggregation model when there are 10, 20, and 40 nodesin the workloads. At modest scales, with fan-outs of 10or even 20 nodes, there are substantial gains to be real-ized by avoiding bad nodes. However, there is less roomfor error here than in the sequential model: as the systemscales up, other barriers present themselves, and avoid-ing nodes we classify as bad provides diminishing re-turns. Understanding this open question is an importantchallenge for us going forward.
4.2 System Design and ImplementationBobtail needs to be a scalable system that makes accuratedecisions in a timely fashion. While the node propertyremains stable in our five-week measurement, empiricalevidence shows that the longer Bobtail runs, the moreaccurate its result can be. However, because launchingan instance takes no more than a minute in EC2, welimit Bobtail to making a decision in under two minutes.Therefore, we need to strike a balance between accuracyand scalability.
A naive approach might be to simply conduct networkmeasurements with every candidate. But however accu-rate it might be, such a design would not scale well to
handle a large number of candidate instances in parallel:to do so in a short period of time would require sendinga large amount of network traffic as quickly as possibleto all candidates, and the synchronous nature of the mea-surement could cause severe network congestion or evenTCP incast [23].
On the other hand, the most scalable approach in-volves conducting testing locally at the candidate in-stances, which does not rely on any resources outsidethe instance itself. Therefore, all operations can be donequickly and in parallel. This approach trades accuracy forscalability. Fortunately, Figures 6 and 7 show that Bob-tail is allowed to make mistakes.
Based on our root cause analysis, such a method existsbecause the part of the long tail problem we focus on isa property of nodes instead of the network. Accordingly,if we know the workload patterns of the VMs co-locatedwith the victim VM, we should be able to predict if thevictim VM will have a bad latency distribution locallywithout any network measurement.
In order to achieve this, we must infer how often longscheduling delays happen to the victim VM. Because thelong scheduling delays caused by the co-located CPU-intensive VMs are not unique to network packet process-ing and any interrupt-based events will suffer from thesame problem, we can measure the frequency of largedelays by measuring the time for the target VM to wakeup from the sleep function call—the delay to processthe timer interrupt is a proxy for delays in processing allhardware interrupts.
To verify this hypothesis, we repeat the five controlledexperiments presented in the root cause analysis. But in-stead of running an RPC server in the victim VM andmeasuring the RTTs with another client, the victim VMruns a program that loops to sleep 1ms and measures thewall time for the sleep operation. Normally, the VMshould be able to wake up after a little over 1ms, but co-located CPU-intensive VMs may prevent it from doingso, which results in large delays.
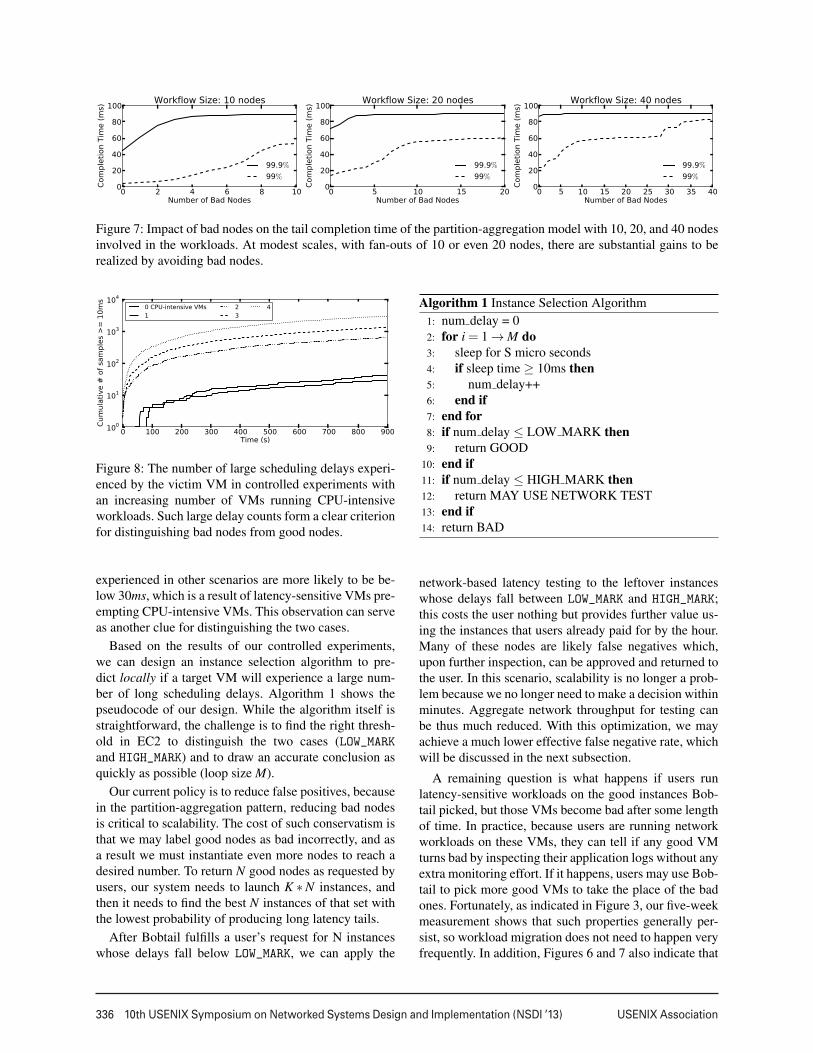
Figure 8 shows the number of times when the sleeptime rises above 10ms in the five scenarios of the con-trolled experiments. As expected, when two or moreVMs are CPU-intensive, the number of large delays ex-perienced by the victim VM is one to two orders of mag-nitude above that experienced when zero or one VMs areCPU-intensive. Although the fraction of such large de-lays is small in all scenarios, the large difference in theraw counts forms a clear criterion for distinguishing badnodes from good nodes. In addition, although it is notshown in the figure, we find that large delays with zeroor one CPU-intensive VMs mostly appear for lengths ofaround 60ms or 90ms; these are caused by the 40% CPUcap on each latency-sensitive VM (i.e., when they are notallowed to use the CPU despite its availability). Delays
7
336 10th USENIX Symposium on Networked Systems Design and Implementation (NSDI ’13) USENIX Association
Figure 7: Impact of bad nodes on the tail completion time of the partition-aggregation model with 10, 20, and 40 nodesinvolved in the workloads. At modest scales, with fan-outs of 10 or even 20 nodes, there are substantial gains to berealized by avoiding bad nodes.
Figure 8: The number of large scheduling delays experi-enced by the victim VM in controlled experiments withan increasing number of VMs running CPU-intensiveworkloads. Such large delay counts form a clear criterionfor distinguishing bad nodes from good nodes.
experienced in other scenarios are more likely to be be-low 30ms, which is a result of latency-sensitive VMs pre-empting CPU-intensive VMs. This observation can serveas another clue for distinguishing the two cases.
Based on the results of our controlled experiments,we can design an instance selection algorithm to pre-dict locally if a target VM will experience a large num-ber of long scheduling delays. Algorithm 1 shows thepseudocode of our design. While the algorithm itself isstraightforward, the challenge is to find the right thresh-old in EC2 to distinguish the two cases (LOW_MARKand HIGH_MARK) and to draw an accurate conclusion asquickly as possible (loop size M).
Our current policy is to reduce false positives, becausein the partition-aggregation pattern, reducing bad nodesis critical to scalability. The cost of such conservatism isthat we may label good nodes as bad incorrectly, and asa result we must instantiate even more nodes to reach adesired number. To return N good nodes as requested byusers, our system needs to launch K ∗N instances, andthen it needs to find the best N instances of that set withthe lowest probability of producing long latency tails.
After Bobtail fulfills a user’s request for N instanceswhose delays fall below LOW_MARK, we can apply the
Algorithm 1 Instance Selection Algorithm1: num delay = 02: for i = 1 → M do3: sleep for S micro seconds4: if sleep time ≥ 10ms then5: num delay++6: end if7: end for8: if num delay ≤ LOW MARK then9: return GOOD
10: end if11: if num delay ≤ HIGH MARK then12: return MAY USE NETWORK TEST13: end if14: return BAD
network-based latency testing to the leftover instanceswhose delays fall between LOW_MARK and HIGH_MARK;this costs the user nothing but provides further value us-ing the instances that users already paid for by the hour.Many of these nodes are likely false negatives which,upon further inspection, can be approved and returned tothe user. In this scenario, scalability is no longer a prob-lem because we no longer need to make a decision withinminutes. Aggregate network throughput for testing canbe thus much reduced. With this optimization, we mayachieve a much lower effective false negative rate, whichwill be discussed in the next subsection.
A remaining question is what happens if users runlatency-sensitive workloads on the good instances Bob-tail picked, but those VMs become bad after some lengthof time. In practice, because users are running networkworkloads on these VMs, they can tell if any good VMturns bad by inspecting their application logs without anyextra monitoring effort. If it happens, users may use Bob-tail to pick more good VMs to take the place of the badones. Fortunately, as indicated in Figure 3, our five-weekmeasurement shows that such properties generally per-sist, so workload migration does not need to happen veryfrequently. In addition, Figures 6 and 7 also indicate that
8

USENIX Association 10th USENIX Symposium on Networked Systems Design and Implementation (NSDI ’13) 337
Figure 9: Trade-off between false positive and false neg-ative rates of the instance selection algorithm. Our sys-tem can achieve a < 0.1 false positive rate while main-taining a false negative rate of around 0.3. With the helpof network-based testing, the effective false negative ratecan be reduced to below 0.1.
even if 20% of instances running latency-sensitive work-loads are bad VMs, their impact on the latency distribu-tion of sequential or partition-aggregation workloads islimited.
4.3 ParameterizationTo implement Bobtail’s algorithm, we need to defineboth its runtime (loop size M) and the thresholds for theLOW_MARK and HIGH_MARK parameters. Our design in-tends to limit testing time to under two minutes, so inour current implementation we set the loop size M to be600K sleep operations, which translates to about 100seconds on small instances in EC2—the worse the in-stance is, the longer it takes.
The remaining challenge we face is finding theright thresholds for our parameters (LOW_MARK andHIGH_MARK). To answer this inquiry, we launch 200small instances from multiple availability zones (AZs)in EC2’s US east region, and we run the selection al-gorithm for an hour on all the candidates. Meanwhile,we use the results of network-based measurements as theground truth of whether the candidates are good or bad.Specifically, we consider the instances with 99.9th per-centiles under 10ms for all micro benchmarks, which arediscussed in § 5.1, as good nodes; all other nodes areconsidered bad.
Figure 9 shows the trade-off between the false positiveand false negative rates by increasing LOW_MARK from 0to 100. The turning point of the solid line appears whenwe set LOW_MARK around 13, which lets Bobtail achievea < 0.1 false positive rate while maintaining a false neg-ative rate of around 0.3—a good balance between falsepositive and false negative rates. Once HIGH_MARK is in-troduced (as five times LOW_MARK), the effective falsenegative rate can be reduced to below 0.1, albeit with thehelp of network-based testing. We leave it as future work
to study when we need to re-calibrate these parameters.The above result reflects our principle of favoring a
low false positive. Therefore, we need to use a relativelylarge K value in order to get N good nodes from K ∗Ncandidates. Recall that our measured good node ratiofor random instances directly returned by EC2 rangesfrom 0.4 to 0.7. Thus, as an estimation, with a 0.3false negative rate and a 0.4 to 0.7 good node ratio forrandom instances from multiple data centers, we needK ∗N ∗(1−0.3)∗0.4=N or K ≈ 3.6 to retrieve the num-ber of desired good nodes from one batch of candidates.However, due to the pervasiveness of bad instances inEC2, even if Bobtail makes no mistakes we still need aminimum of K∗N ∗0.4=N or K = 2.5. If startup latencyis the critical resource, rather than the fees paid to startnew instances, one can increase this factor to improveresponse time.
5 Evaluation
In this section, we evaluate our system over two avail-ability zones (AZs) in EC2’s US east region. These twoAZs always return some bad nodes. We compare the la-tency tails of instances both selected by our system andlaunched directly via the standard mechanism. We con-duct this comparison using both micro benchmarks andmodels of sequential and partition-aggregation work-loads.
In each trial, we compare 40 small instances launcheddirectly by EC2 from one AZ to 40 small instances se-lected by our system from the same AZ. The compar-ison is done with a series of benchmarks; these smallinstances will run RPC servers for all benchmarks. Tolaunch 40 good instances, we use K = 4 with 160 can-didate instances. In addition, we launch four extra largeinstances for every 40 small instances to run RPC clients.We do this because, as discussed earlier, extra large in-stances do not experience the extra long tail problem; wetherefore can blame the server instances for bad latencydistributions.
5.1 Micro BenchmarksOur traffic models for both micro benchmarks and se-quential and partition-aggregation workloads have inter-arrival times of RPC calls forming a Poisson process. Formicro benchmarks, we assign 10 small instance serversto each extra large client. The RPC call rates are set at100, 200, and 500 calls/second. In each RPC call, theclient sends an 8-byte request to the server, and the serverresponds with 2KB of random data. Meanwhile, bothrequests and responses are packaged with another 29-byte overhead. The 2KB message size was chosen be-cause measurements taken in a dedicated data center in-
9

338 10th USENIX Symposium on Networked Systems Design and Implementation (NSDI ’13) USENIX Association
Figure 10: Reduction in flow tail completion time inmicro benchmarks by using Bobtail in two availabilityzones in EC2’s US east region. The mean reduction timeis presented with a 90% confidence interval.
dicate that most latency-sensitive flows are around 2KBin size [1]. Note that we do not generate artificial back-ground traffic, because real background traffic alreadyexists throughout EC2 where we evaluate Bobtail.
Figure 10 presents the reductions in completion timesfor three RPC request rates in micro benchmarks acrosstwo AZs. Bobtail reduces latency at the 99.9th percentilefrom 50% to 65%. In micro benchmark and subsequentevaluations, the mean of reduction percentages in flowcompletion is presented with a 90% confidence interval.
However, improvements at the 99th percentile aresmaller with a higher variance. This is because, as shownin Figure 1, the 99th percentile RTTs within EC2 are notvery bad to begin with (∼2.5ms); therefore, Bobtail’s im-provement space is much smaller at the 99th percentilethan at the 99.9th percentile. For the same reason, net-work congestion may have a large impact on the 99thpercentile while having little impact on the 99.9th per-centile in EC2. The outlier of 200 calls/second in thesecond AZ of Figure 10 is caused by one trial in theexperiment with 10 good small instances that exhibitedabnormally large values at the 99th percentile.
5.2 Sequential ModelFor sequential workloads, we apply the workload modelto 20-node and 40-node client groups, in addition to the10-node version shown in the micro benchmarks. In thiscase, the client sends the same request as before, but theservers reply with a message size randomly chosen fromamong 1KB, 2KB, and 4KB. For each workflow, insteadof sending requests to all the servers, the client will ran-domly choose one server from the groups of sizes 10, 20,and 40. Then, it will send 10 synchronous RPC calls tothe chosen server; the total time to complete all 10 RPCrequests is then used as the workflow RTT. Because ofthis, the workflow rates for the sequential model are re-duced to one tenth of the RPC request rates for microbenchmarks and become 10, 20, and 50 workflows persecond.
Figure 11 shows our improvement under the sequen-
Figure 11: Reduction in flow tail completion time for se-quential workflows by using Bobtail in two availabilityzones in EC2’s US east region. The mean reduction timeis presented with a 90% confidence interval.
tial model with different numbers of RPC servers in-volved. Bobtail brings a 35% to 40% improvement tosequential workloads at the 99th percentile across all ex-periments, and it roughly translates to an 8ms reduction.The lengths of the confidence intervals grow as the num-ber of server nodes increases; this is caused by a rela-tively smaller sample space. The similarity in the reduc-tion of flow completion time with different numbers ofserver nodes shows that the tail performance of the se-quential workflow model only depends on the ratio ofbad nodes among all involved server nodes. Essentially,the sequential model demonstrates the average tail per-formance across all server nodes by randomly choosingone server node each time with equal probability at theclient side.
Interestingly, and unlike in the micro benchmarks, im-provement at the 99.9th percentile now becomes smallerand more variable. However, this phenomenon doesmatch our simulation result shown in Figure 6 when dis-cussing the potential benefits of using Bobtail.
5.3 Partition-Aggregation ModelFor the partition-aggregation model, we use the same 10,20, and 40-node groups to evaluate Bobtail. In this case,the client always sends requests to all servers in the groupconcurrently, and the workflow finishes once the slowest
10
USENIX Association 10th USENIX Symposium on Networked Systems Design and Implementation (NSDI ’13) 339
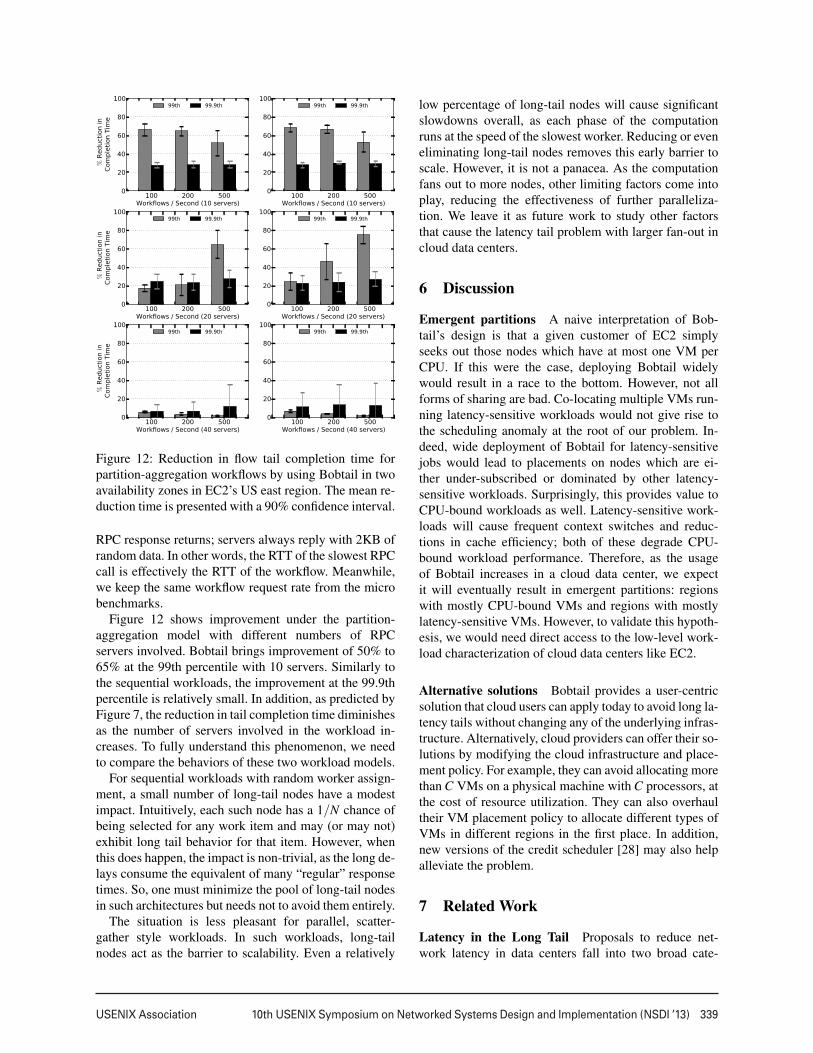
Figure 12: Reduction in flow tail completion time forpartition-aggregation workflows by using Bobtail in twoavailability zones in EC2’s US east region. The mean re-duction time is presented with a 90% confidence interval.
RPC response returns; servers always reply with 2KB ofrandom data. In other words, the RTT of the slowest RPCcall is effectively the RTT of the workflow. Meanwhile,we keep the same workflow request rate from the microbenchmarks.
Figure 12 shows improvement under the partition-aggregation model with different numbers of RPCservers involved. Bobtail brings improvement of 50% to65% at the 99th percentile with 10 servers. Similarly tothe sequential workloads, the improvement at the 99.9thpercentile is relatively small. In addition, as predicted byFigure 7, the reduction in tail completion time diminishesas the number of servers involved in the workload in-creases. To fully understand this phenomenon, we needto compare the behaviors of these two workload models.
For sequential workloads with random worker assign-ment, a small number of long-tail nodes have a modestimpact. Intuitively, each such node has a 1/N chance ofbeing selected for any work item and may (or may not)exhibit long tail behavior for that item. However, whenthis does happen, the impact is non-trivial, as the long de-lays consume the equivalent of many “regular” responsetimes. So, one must minimize the pool of long-tail nodesin such architectures but needs not to avoid them entirely.
The situation is less pleasant for parallel, scatter-gather style workloads. In such workloads, long-tailnodes act as the barrier to scalability. Even a relatively
low percentage of long-tail nodes will cause significantslowdowns overall, as each phase of the computationruns at the speed of the slowest worker. Reducing or eveneliminating long-tail nodes removes this early barrier toscale. However, it is not a panacea. As the computationfans out to more nodes, other limiting factors come intoplay, reducing the effectiveness of further paralleliza-tion. We leave it as future work to study other factorsthat cause the latency tail problem with larger fan-out incloud data centers.
6 Discussion
Emergent partitions A naive interpretation of Bob-tail’s design is that a given customer of EC2 simplyseeks out those nodes which have at most one VM perCPU. If this were the case, deploying Bobtail widelywould result in a race to the bottom. However, not allforms of sharing are bad. Co-locating multiple VMs run-ning latency-sensitive workloads would not give rise tothe scheduling anomaly at the root of our problem. In-deed, wide deployment of Bobtail for latency-sensitivejobs would lead to placements on nodes which are ei-ther under-subscribed or dominated by other latency-sensitive workloads. Surprisingly, this provides value toCPU-bound workloads as well. Latency-sensitive work-loads will cause frequent context switches and reduc-tions in cache efficiency; both of these degrade CPU-bound workload performance. Therefore, as the usageof Bobtail increases in a cloud data center, we expectit will eventually result in emergent partitions: regionswith mostly CPU-bound VMs and regions with mostlylatency-sensitive VMs. However, to validate this hypoth-esis, we would need direct access to the low-level work-load characterization of cloud data centers like EC2.
Alternative solutions Bobtail provides a user-centricsolution that cloud users can apply today to avoid long la-tency tails without changing any of the underlying infras-tructure. Alternatively, cloud providers can offer their so-lutions by modifying the cloud infrastructure and place-ment policy. For example, they can avoid allocating morethan C VMs on a physical machine with C processors, atthe cost of resource utilization. They can also overhaultheir VM placement policy to allocate different types ofVMs in different regions in the first place. In addition,new versions of the credit scheduler [28] may also helpalleviate the problem.
7 Related Work
Latency in the Long Tail Proposals to reduce net-work latency in data centers fall into two broad cate-
11

340 10th USENIX Symposium on Networked Systems Design and Implementation (NSDI ’13) USENIX Association
gories: those that reduce network congestion and thosethat prioritize flows according to their latency sensitiv-ity. Alizadeh et al. proposed to reduce switch buffer oc-cupancy time by leveraging Explicit Congestion Notifi-cation (ECN) to indicate the degree of network conges-tion rather than whether congestion exists [1]. Follow-up work further reduced the buffer occupancy time byslightly capping bandwidth capacity [2]. Wilson et al.and Vamanan et al. both argued that the TCP conges-tion control protocols used in data centers should bedeadline-aware [26, 22]. Hong et al. designed a flowscheduling system for data centers to prioritize latency-sensitive jobs with flow preemption [10]. Zats et al. pro-posed a cross-stack solution that combined ECN withapplication-specified flow priorities and adaptive loadbalancing in an effort to unify otherwise disparate knowl-edge about the state of network traffic [29].
The above solutions focus on the component of longtail flow completion times that is the result of the networkalone and, as such, are complementary to our approach.We have shown that the co-scheduling of CPU-intensiveand latency-sensitive workloads in virtualized data cen-ters can result in a significant increase in the size of thelong tail, and that this component of the tail can be ad-dressed independently of the network.
The Xen Hypervisior and its Scheduler In § 3, wediscussed how Xen uses a credit-based scheduler [28]that is not friendly to latency-sensitive workloads. Var-ious characteristics of this credit scheduler have beenexamined, including scheduler configurations [15], per-formance interference caused by different types of co-locating workloads [15, 12, 25], and the source of over-head incurred by virtualization on the network layer [25].Several designs have been proposed to improve the cur-rent credit scheduler, and they all share the approach ofboosting the priority of latency-sensitive VMs while stillmaintaining CPU fairness in the long term [9, 8, 11].However, the degree to which such approaches will im-pact the long tail problem at scale has yet to be studied.
Instead of improving the VM scheduler itself, Woodet al. created a framework for the automatic migra-tion of virtual machines between physical hosts in Xenwhen resources become a bottleneck [27]. Mei et al.also pointed out that a strategic co-placement of differ-ent workload types in a virtualized data center will im-prove performance for both cloud consumers and cloudproviders [14]. Our work adopts a similar goal of improv-ing the tail completion time of latency-sensitive work-loads for individual users while also increasing the over-all efficiency of resource usage across the entire virtual-ized data center. However, our solution does not requirethe collaboration of cloud providers, and many cloudcustomers can deploy our system independently.
EC2 Measurements Wang et al. showed that the net-work performance of EC2 is much more variable thanthat of non-virtualized clusters due to virtualization andprocessor sharing [24]. In addition, Schad et al. found abimodal performance distribution with high variance formost of their metrics related to CPU, disk I/O, and net-work [19]. Barker et al. also quantified the jitter of CPU,disk, and network performance in EC2 and its impact onlatency-sensitive applications [4]. Moreover, A. Li et al.compared multiple cloud providers, including EC2, us-ing many types of workloads and claimed that there is nosingle winner on all metrics [13]. These studies only in-vestigate the average and variance of their performancemetrics, while the focus of our study is on the tail of net-work latency distributions in EC2.
Ou et al. considered hardware heterogeneity withinEC2, and they noted that within a single instance typeand availability zone, the variation in performance forCPU-intensive workloads can be as high as 60% [16].They made clear that one easy way to improve instanceperformance is to check the model of processor assigned.While selecting instances also represents the core of ourwork, Bobtail examines dynamic properties of EC2 asopposed to static configuration properties.
8 Conclusion
In this paper, we demonstrate that virtualization used inEC2 exacerbates the long tail problem of network round-trip-times by a factor of two to four. Notably, we findthat poor response times in the cloud are a property ofnodes rather than the network, and that the long latencytail problem is pervasive throughout EC2 and persis-tent over time. Using controlled experiments, we showthat co-scheduling of CPU-bound and latency-sensitivetasks causes this problem. We present a system, Bobtail,which proactively detects and avoids these bad neighbor-ing VMs without significantly penalizing node instanti-ation. Evaluations in two availability zones in EC2’s USeast region show that common communication patternsbenefit from reductions of up to 40% in their 99.9th per-centile response times.
9 Acknowledgments
We are grateful to the anonymous reviewers and ourshepherd, George Porter, for their comments on thispaper. This work was supported in part by the De-partment of Homeland Security (DHS) under contractnumbers D08PC75388, and FA8750-12-2-0314, the Na-tional Science Foundation (NSF) under contract numbersCNS 1111699, CNS 091639, CNS 08311174, and CNS0751116, and the Department of the Navy under contractN000.14-09-1-1042.
12

USENIX Association 10th USENIX Symposium on Networked Systems Design and Implementation (NSDI ’13) 341
References[1] ALIZADEH, M., GREENBERG, A., MALTZ, D. A., PADHYE,
J., PATEL, P., PRABHAKAR, B., SENGUPTA, S., AND SRIDHA-RAN, M. Data center TCP (DCTCP). In Proceedings of the ACMSIGCOMM 2010 conference (SIGCOMM’10) (New Delhi, India,August 2010).
[2] ALIZADEH, M., KABBANI, A., EDSALL, T., PRABHAKAR, B.,VAHDAT, A., AND YASUDA, M. Less Is More: Trading a LittleBandwidth for Ultra-Low Latency in the Data Center. In Proceed-ings of the 9th USENIX conference on Networked Systems Designand Implementation (NSDI’12) (San Jose, CA, USA, April 2012).
[3] BARHAM, P., DRAGOVIC, B., FRASER, K., HAND, S.,HARRIS, T., HO, A., NEUGEBAUER, R., PRATT, I., ANDWARFIELD, A. Xen and the Art of Virtualization. In Proceed-ings of the 19th ACM Symposium on Operating Systems Princi-ples (SOSP’03) (Bolton Landing, NY, USA, October 2003).
[4] BARKER, S. K., AND SHENOY, P. Empirical Evaluation ofLatency-sensitive Application Performance in the Cloud. In Pro-ceedings of the 1st annual ACM SIGMM conference on Multime-dia systems (MMSys’10) (Scottsdale, AZ, USA, February 2010).
[5] BOUCH, A., KUCHINSKY, A., AND BHATTI, N. Quality is inthe eye of the beholder: meeting users’ requirements for Internetquality of service. In Proceedings of the SIGCHI conference onHuman factors in computing systems (CHI’00) (The Hague, TheNetherlands, April 2000).
[6] DEAN, J., AND GHEMAWAT, S. MapReduce: Simplified DataProcessing on Large Clusters. In Proceedings of the 6th confer-ence on Symposium on Opearting Systems Design & Implemen-tation (OSDI’04) (San Francisco, CA, USA, March 2004).
[7] DECANDIA, G., HASTORUN, D., JAMPANI, M., KAKULAPATI,G., LAKSHMAN, A., PILCHIN, A., SIVASUBRAMANIAN, S.,VOSSHALL, P., AND VOGELS, W. Dynamo: amazon’s highlyavailable key-value store. In Proceedings of the 21st ACM Sym-posium on Operating Systems Principles (SOSP’07) (Stevenson,WA, USA, October 2007).
[8] DUNLAP, G. W. Scheduler Development Update. In Xen SummitAsia 2009 (Shanghai, China, November 2009).
[9] GOVINDAN, S., NATH, A. R., DAS, A., URGAONKAR, B., ANDSIVASUBRAMANIAM, A. Xen and Co.: Communication-AwareCPU Scheduling for Consolidated Xen-based Hosting Platforms.In Proceedings of the 3rd international conference on Virtualexecution environments (VEE’07) (San Diego, CA, 2007, June2007).
[10] HONG, C.-Y., CAESAR, M., AND GODFREY, P. B. Finish-ing Flows Quickly with Preemptive Scheduling. In Proceed-ings of the ACM SIGCOMM 2012 conference (SIGCOMM’12)(Helsinki, Finland, August 2012).
[11] KIM, H., LIM, H., JEONG, J., JO, H., AND LEE, J. Task-awareVirtual Machine Scheduling for I/O Performance. In Proceedingsof the 5th international conference on virtual execution environ-ments (VEE’09) (Washington, DC, USA, March 2009).
[12] KOH, Y., KNAUERHASE, R. C., BRETT, P., BOWMAN, M.,WEN, Z., AND PU, C. An Analysis of Performance Interfer-ence Effects in Virtual Environments. In Proceedings of the 2007IEEE International Symposium on Performance Analysis of Sys-tems and Software (ISPASS’07) (San Jose, CA, USA, April 2007).
[13] LI, A., YANG, X., KANDULA, S., AND ZHANG, M. Cloud-Cmp: Comparing Public Cloud Providers. In Proceedings of the2010 Internet Measurement Conference (IMC’10) (Melbourne,Australia, November 2010).
[14] MEI, Y., LIU, L., PU, X., AND SIVATHANU, S. PerformanceMeasurements and Analysis of Network I/O Applications in Vir-tualized Cloud. In Proceedings of the 3rd IEEE InternationalConference on Cloud Computing (CLOUD’10) (Miami, FL, June2010).
[15] ONGARO, D., COX, A. L., AND RIXNER, S. Scheduling I/O invirtual machine monitors. In Proceedings of the 2009 ACM SIG-PLAN/SIGOPS International Conference on Virtual ExecutionEnvironments (VEE’09) (Washington, DC, USA, March 2008).
[16] OU, Z., ZHUANG, H., NURMINEN, J. K., YLA-JAASKI, A.,AND HUI, P. Exploiting Hardware Heterogeneity within theSame Instance Type of Amazon EC2. In Proceedings of the4th USENIX Workshop on Hot Topics in Cloud Computing (Hot-Cloud’12) (Boston, MA, USA, June 2012).
[17] PATTERSON, D. A. Latency lags bandwidth. Communication ofACM 47, 10 (Oct 2004), 71–75.
[18] RUMBLE, S. M., ONGARO, D., STUTSMAN, R., ROSENBLUM,M., AND OUSTERHOUT, J. K. It’s Time for Low Latency. InProceedings of the 13th Workshop on Hot Topics in OperatingSystems (HotOS XIII) (Napa, CA, USA, May 2011).
[19] SCHAD, J., DITTRICH, J., AND QUIANE-RUIZ, J.-A. RuntimeMeasurements in the Cloud: Observing, Analyzing, and Reduc-ing Variance. In Proceedings of the 36th International Confer-ence on Very Large Data Bases (VLDB’10) (Singapore, Septem-ber 2010).
[20] SLEE, M., AGARWAL, A., AND KWIATKOWSKI, M. Thrift:Scalable Cross-Language Services Implementation. Tech. rep.,Facebook, Palo Alto, CA, USA, April 2007.
[21] TECHCRUNCH. There Goes The Weekend! Pinterest,Instagram And Netflix Down Due To AWS Outage.http://techcrunch.com/2012/06/30/there-goes-the-weekend-pinterest-instagram-and-netflix-down-due-to-aws-outage/.
[22] VAMANAN, B., HASAN, J., AND VIJAYKUMAR, T. N.Deadline-Aware Datacenter TCP (D2TCP). In Proceedings of theACM SIGCOMM 2012 conference (SIGCOMM’12) (Helsinki,Finland, August 2012).
[23] VASUDEVAN, V., PHANISHAYEE, A., SHAH, H., KREVAT, E.,ANDERSEN, D. G., GANGER, G. R., GIBSON, G. A., ANDMUELLER, B. Safe and Effective Fine-grained TCP Retrans-missions for Datacenter Communication. In Proceedings of theACM SIGCOMM 2009 conference (SIGCOMM’09) (Barcelona,Spain, August 2009).
[24] WANG, G., AND NG, T. S. E. The Impact of Virtualization onNetwork Performance of Amazon EC2 Data Center. In Proceed-ings of the 29th conference on Information communications (IN-FOCOM’10) (San Diego, CA, USA, March 2010).
[25] WHITEAKER, J., SCHNEIDER, F., AND TEIXEIRA, R. Explain-ing Packet Delays Under Virtualization. SIGCOMM ComputerCommunication Review 41, 1 (January 2011), 38–44.
[26] WILSON, C., BALLANI, H., KARAGIANNIS, T., ANDROWTRON, A. Better Never than Late: Meeting Deadlinesin Datacenter Networks. In Proceedings of the ACM SIGCOMM2011 conference (SIGCOMM’11) (Toronto, ON, CA, August2011).
[27] WOOD, T., SHENOY, P. J., VENKATARAMANI, A., ANDYOUSIF, M. S. Black-box and Gray-box Strategies for Vir-tual Machine Migration. In Proceedings of the 4th conferenceon Symposium on Networked Systems Design & Implementation(NSDI’07) (Cambridge, MA, USA, April 2007).
[28] XEN.ORG. Xen Credit Scheduler. http://wiki.xen.org/
wiki/Credit_Scheduler.
[29] ZATS, D., DAS, T., MOHAN, P., BORTHAKUR, D., AND KATZ,R. DeTail: Reducing the Flow Completion Time Tail in Data-center Networks. In Proceedings of the ACM SIGCOMM 2012conference (SIGCOMM’12) (Helsinki, Finland, August 2012).
13