bob foster submission to - garnaut climate change … foster submission to garnaut climate change...
TRANSCRIPT


Bob Foster submission to Garnaut Climate Change Review
5 January 2008 My submission addresses the more-general aspects of this important topic as presented in the Introduction and Context sections of Issues Paper 1. These are: 1. Introduction The Review will examine the impacts of climate change on the Australian economy, and recommend medium to long-term policies and policy frameworks to improve prospects for sustainable prosperity. In carrying out this task, the Review will undertake an extensive consultation process to encourage open and informed debates on key climate change issues. 2. Context Climate change is likely to result in changes to long term climate trends and an increase in the variability of an already variable climate. I submit that the “key climate change issue” is the direction of the “long term climate trend”. Is it to be warming or cooling? Policy-makers and planners need to know. 1. WARMING OR COOLING? TIME REVEALS TRUTH The Summary for Policymakers of the Synthesis Report of the IPCC Fourth Assessment Report of 17 November 2007 presents but one of two – clearly, mutually-exclusive - hypotheses for past/future climate-change. That promoted by the Intergovernmental Panel on Climate Change was developed over almost two decades, in a series of four Assessment Reports. We are not told by IPCC that the hypothesis which it favours has at least one credible competitor. IPCC promotes a people-driven climate – our self-contained planet enjoyed a stable and benign climate during pre- industrial Arcadia, only now disturbed by people burning fossil fuels. There will be NO cooler periods ahead; and strong continued warming is inevitable. There will be no return to climatic stability unless an early and very substantial reduction is made in the emission of greenhouse gases. The principal cause of both instability and warming is pollution by anthropogenic CO2 – mainly from coal- fired electricity generation. Sceptics like me invoke a variable Sun-climate connection – our externally-driven climate is ever-changing at time-scales from the millennial to the quotidian. Because timing, although not yet magnitude, of influences on the Sun - and hence Earth - can be calculated in advance, the direction of climate-change can be predicted. Cooling has begun, should be discernible by 2015; and the next Little Ice Age cold period will be fully-developed by 2030. To sceptics, CO2 is THE crucial plant- food – rather than ‘global warming pollution’, as claimed by the scientific consensus. Its atmospheric concentration during the Palaeocene/Eocene abundance – when many plant families evolved - was some x5 the 380 ppm today. When working in Holland, I learned that market-gardeners sited close enough for reticulation from Pernis Refinery, doubled the CO2 in the atmosphere of their greenhouses - so their vegies would grow better.

BOB FOSTER page 2 Which of these hypotheses is correct? No-one knows, of course. Indeed, it has been well said (I forget by whom): He who foretells the future, lies – even when he tells the truth. However, this crucial question will be resolved – because Time reveals Truth. The ‘engine-room’ for mainstream climate-change science is the UK Met Office Hadley Centre in Exeter. Until now, the Establishment has only provided us with projections of future warming – not predictions; but, in a breakthrough-paper1 in Science of 10 August 2007, six scientists from the Centre have made a specific – and hence testable – prediction of future climate. The abstract of their paper tells us: Our system predicts that internal variability will partially offset the anthropogenic global warming signal for the next few years. However, climate will continue to warm, with at least half of the years after 2009 predicted to exceed the warmest year currently on record. No doubt about it - this is a prediction. In confirmation, the body of the paper concludes: … at least half of the years after 2009 are predicted to be warmer than 1998, the warmest year currently on record. IPCC’s Synthesis Report is not an even-handed analysis of this very-complicated and poorly-understood subject. It is advocacy. But, because the potential for human misery is so great – either by impoverishing the world in a spurious “fight to defeat climate change”, or not planning ahead to feed people during the next Little Ice Age cold period – we sceptics must speak out. 2. CONSENSUS AND REAL-LIFE SCIENTISTS Scientists revere consensus - because they are herd animals. I learned this hard lesson in the concluding decade of the 50-year struggle between the dominant paradigm of Hutton/Lyell uniformitarianism and Wegener’s contrarian hypothesis of continental drift. Geologists fought like tigers to repel the new idea; and had we students openly supported it, we might have failed. The defence, led by USGS, said (rightly) that there was no demonstrated mechanism to explain why continents drift; and hence, this unwelcome newcomer is supported solely by observations. But, as compelling correlations kept flooding in, geologists were forced to invoke increasingly baroque explanations as to how plants and animals, recent and fossil, came to be where found. You may remember those ‘intermittent land bridges’ of which no trace now remains. The new science of geophysics defeated uniformitarianism – not geologists quitting the ir consensus. Climate-change has engendered yet another zealous defence of the consensus by the geological establishment. A 2001 submission2 by Research School of Earth Sciences at Australia National University is unequivocal; and its Concluding Statement trenchantly concludes: … we are of the firm view that 20th Century global warming and sea level rise are observed and, on scientific grounds, attributable to changes in the Earth’s atmospheric composition caused by human activities. ______________________________________________________________________________ 1. Doug M. Smith et al 2007, “Improved surface temperature prediction for the coming decade from a global climate model”, Science v.317 pp.796-9. 2. In a submission to the Joint Standing Committee on Treaties inquiry into the Kyoto Protocol, dated 1 September 2001. Signatories were: Dr M. Bird, Prof J.M.A. Chappell, Dr M. Gagan, Prof D.H. Green FRS, Prof R. Grun and Prof K. Lambeck.

BOB FOSTER page 3 In the Geological Society of Australia Newsletter Number 142 of March 2007, Professor Andy Gleadow’s editorial From the President also unreservedly embraces a people-driven climate3 : Debate amongst atmospheric and climate scientists in all of this is long-since over. Their clear consensus is that the principal culprit in global warming, added to all the normal forcing factors, is CO2 emissions from fossil fuel burning. Why did neither those ANU academics, nor Prof Gleadow from Melbourne, give due weight to the plausible alternative of a variable Sun-climate connection? It seems that Australian scientists still are as much part of the herd as was the case in the 1950s. If the people-driven-climate consensus is to be overthrown, it is likely to be from outside – by the growing flood of satellite-based observations. But not all scientists are in the herd. David Bellamy, in The Times of 22 October 2007 (p.19) says under the heading “Why I would rather be called a heretic on global warming”: Am I worried about man-made global warming? The answer is “no” and “yes”. No, because the Hadley Centre for Climate Prediction has come up against an “inconvenient truth”. Its research shows that since 1998 the average temperature of the planet has not risen, even though the concentration of carbon dioxide in the atmosphere has continued to increase. Yes, because the self-proclaimed consensus among scientists has detached itself from the questioning rigours of hard science and become a political cause. Those of us who dare to question the dogma of the global warming doomsters … are vilified as heretics or worse as deniers. He later continues: Name-calling may be acceptable in politics but it should have no place in science; indeed, what is happening smacks of McCarthyism, witch-hunts and all. Scientific understanding, however, is advanced by robust, reasoned argument based on well-researched data. So I turn to simple sets of data that are already in the public domain. The last peak global temperatures were in 1998 and 1934 and the troughs of low temperature were around 1910 and 1970. The second dip caused pop science and the media to cry wolf about an impending devastating Ice Age. Our end was nigh! Then when temperatures took an upward swing in the 1980s, the scaremongers changed their tune. Global warming was the imminent catastrophe. 3. DOMINANT ROLE OF ROYAL SOCIETY The Royal Society leads the people-driven-climate campaign. Back in 1801, the Astronomer Royal (Sir William Herschel) noted the connection between Sun and Earth. But the Sun set, connection-wise, in 1892. Then, William Thomson (aka the Lord Kelvin, President of the Royal Society) announced4 that he had done the calculations, and was forced to conclude that the conjunction between events on the Sun and events on Earth could be nothing more than “mere coincidence”. Was it a scientific-first, when Kelvin chose calculations ahead of observations? ______________________________________________________________________________ 3. I am a member of GSA, and my dissenting response “Will it be warmer or cooler?” was published as a Letter to the Editor in the next issue (June 2007, p.31). It is Attachment 1. 4. Here quoting from Soon and Yaskell 2003, “The Maunder Minimum and the variable Sun-Earth connection”, World Scientific, 278 p.

BOB FOSTER page 4 This result, it seems to me, is absolutely conclusive against the supposition that terrestrial magnetic storms are due to magnetic action of the Sun; or to any kind of dynamical action taking place within the Sun, or in connection with hurricanes in his atmosphere, or anywhere near the Sun outside. … [W]e may also be forced to conclude that the supposed connection between magnetic storms and sun-spots is unreal and that the seeming agreement between the periods has been mere coincidence. The Royal Society has not yet resiled from that implausible dogma. As recently as 10 April 2007, the Society released its immodestly-titled Man made climate change: the real science, and sub-headed CLIMATE CHANGE controversies – a simple guide. (I surmise it was greatly influenced by Sir John Houghton, former head of IPCC and previously with UK Met Office.) This partisan analysis adopts the ‘straw man’ debating technique; saying: … the Society – as the UK’s national academy of science – responds here to six arguments that are currently in circulation by setting out, in simple terms, where the weight of scientific evidence lies. By far the most fundamental of the straw men is: Argument 4: It’s all to do with the Sun – for example, there is a strong link between increased temperatures on Earth with the number of sunspots on the Sun. A swingeing demolition follows; and I here quote it in small part: While there is evidence of a link between solar activity and some of the warming in the early 20th century, measurements from satellites show that there has been very little change in underlying solar activity in the last 30 years – there is even evidence of a detectable decline – and so this cannot account for the recent rises we have seen in global temperatures. The demolition of Argument 4 appears to owe much to a paper5 by Lockwood and Frolich which was received by the Society only 6 days earlier (4 April 2007) I will here set down the Conclusions section in its entirety. The first part is unmitigated good news (and also quite unsurprising – see my Figure 7): There are many interesting palaeoclimate studies that suggest that solar variability had an influence on pre-industrial climate. Thus is quietly dismissed the infamous “hockeystick” graph used by IPCC as the leading feature for attracting lay-public attention to its Third Assessment Report of 2001. Northern Hemisphere temperature showed a stable climate in 1000-1900AD, with little variation but for a gentle cooling – IPCC had abolished the Mediaeval Warm Period, and subsequent series of Little Ice Age cold periods. Then, temperature sky-rocketed in the 20th Century – and it was our fault. Following on, is a puzzling, and curiously diffident, statement: There are also some detection-attribution studies using global climate models that suggest there was a detectable influence of solar variability in the first half of the twentieth century and that the solar radiative forcing variations were amplified by some mechanism that is, as yet, unknown. ______________________________________________________________________________ 5. Mike Lockwood and Claus Fröhlich 2007, “Recent oppositely directed trends in solar climate forcings and the global mean surface air temperature”, Proc. R. Soc. A, doi: 10. 1098, 14p.

BOB FOSTER page 5 But then, the Society got precisely the statement it needed as timely support for its Argument 4: However, these findings are not relevant to any debates about modern climate change. Our results show that the observed rapid rise in global mean temperatures seen after 1985 cannot be ascribed to solar variability, whichever of the mechanisms is invoked and no matter how much the solar variation is amplified. IPCC’s hockeystick demonstrates, sadly, that scientists are essentially advocacy-oriented – perhaps, even at the expense of veracity. My Figure 1 (see graph at the bottom) shows the hockeystick as it appeared in Figure 1 (b) of the Summary for Policymakers of the scientific volume of IPCC’s Third Assessment Report (TAR). This was the very graph which I had seen projected onto the wall behind the lectern, in photos of Sir John Houghton presenting TAR back in 2001. Shamefully, the Scientific Establishment closed ranks behind this nonsense. Early in his term as President of the Royal Society, Bob May (from Sydney – now the Lord May of Oxford) organised a statement by 17 academies including Australia’s Academy of Sciences, as an editorial in Science (18 May 2001, v.292 p.1261). “The Science of Climate Change” began: The work of the Intergovernmental Panel on Climate Change represents the consensus of the international scientific community on climate change science. We recognize the IPCC as the world’s most reliable source of information on climate change and its causes; and we endorse its method of achieving this consensus. Despite increasing consensus on the science underpinning predictions of global climate change, doubts have been expressed recently about the need to mitigate the risks posed by global climate change. We do not consider such doubts justified. Note that “consensus” is mentioned three times in that opening paragraph. Academicians really do think that the advancement of scientific understanding is a matter of voting. By this very statement, Mainstream Science had granted IPCC a monopoly on scientific thought about climate change. I therefore wrote to Sir Robert, complaining that: Climate-change is an instance where the dominant paradigm really does dominate. … IPCC is under the thrall of a serious case of ‘imagination block’. It can’t do it, so I will here put the case contra to reliance on the “Greenhouse Effect” hypothesis as sole explanation for observed warming in the second half of the 20th century. His reply (14 June 2001) explained all. As I hope my editorial made clear, I think new and different and questioning ideas are always to be welcomed, particularly in the earlier stages of a science when many possible avenues lead forward in different directions. Obviously, the landscape changes over time, as people learn more and more; this certainly is the case in many aspects of climate change. As they do so, provocative ideas that initially fully merited exploration become less supported by the growing body of knowledge and evidence. In a scientific endeavour, there comes a time beyond which new ideas are no longer welcome . The Sun doesn’t drive climate – people do. The scientific consensus has been established – and hence, by definition, the debate is over.

BOB FOSTER page 6 4. IPCC’S SUMMARY FOR POLICYMAKERS – CAN YOU FIND THE BIG LIE? Adolf Hitler’s Mein Kampf saw the “Big Lie” as a means of attracting a naive and credulous public to his view; and Dr Goebbels brought the technique to malevolent fruition. I absolutely am not likening IPCC to Germany’s National Socialist Worker’s Party of the 1930s – although one IPCC supporter (and Nobel Peace Prize winner) has described climate-sceptics as “deniers”. No, I am only talking here of techniques aimed at scientifically- illiterate “policymakers”. Second Assessment Report IPCC’s Second Assessment Report (SAR) “Climate Change 1995: the science of climate change” provided the scientific underpinning for the treaty negotiated at Kyoto in 1997. However, there is little chance that policymakers around the world - be they politicians or bureaucrats - would have read that intensely-scientific 572-page Report, before they began negotiating the Protocol. Doubtless, most would have relied on its Summary for Policymakers. To reach the Summary, policymakers would have passed a brief introductory statement, which misleadingly asserted that the Report presents a comprehensive, objective, and balanced view of the subject matter. Then, over the page, they would have encountered the Preface - containing but a single reference to climate-change science: … that observations suggest “a discernible human influence on global climate”, one of the key findings of this report, adds an important new dimension to the discussion of the climate change issue. This attention-getting statement is repeated almost verbatim, and quite without elaboration, in the subsequent Summary for Policymakers (p.5). However, policymakers seeking more detail on this “key finding” would have been disappointed. The relevant chapter is much less forthright. It says (p.439): Finally, we come to the difficult question of when the detection and attribution of human-induced climate change is likely to occur. And it continues only briefly – without detailing the supporting evidence6 : The body of statistical evidence … when examined in the context of our physical understanding of the climate system, now points towards a discernible human influence on global climate. Our ability to quantify the magnitude of this effect is currently limited by uncertainties in key factors . After release of SAR, the man who became the principal representative of the United States (Clinton/Gore) Administration at Kyoto, Timothy Wirth, Under Secretary of State for Global Affairs, was quoted in Nature on 25 July 1996 (v.382, p.267): Wirth described as a ‘remarkable statement’ the conclusion of the IPCC’s latest report on climate change, that ‘the balance of evidence suggests that there is a discernible human influence on global climate’. He said the administration took the report ‘very seriously’. And, as a reminder of the scientific climate prevailing at that time: Wirth described the IPCC’s critics as ‘naysayers and special interest groups bent on belittling, attacking and obfuscating climate change science’. ______________________________________________________________________________ 6. Only after the SAR had made its mark, were supporting details published in a peer-reviewed paper in a generally-available scientific journal, in Santer, B.D. et al 2006, “A search for human influences on the thermal structure of the atmosphere”, Nature v.382, pp.39-46.

BOB FOSTER page 7 We now know what had been done . It turns out7 IPCC had chosen to rely on a short (25-year) run of observed atmospheric temperatures, encompassing 1963-87; and the years selected did show a warming trend. But that is not the whole story. Available at that time was a 37-year run of data, including 5 earlier years back to 1958, and 8 later years up to 1995. When the full run is used, the warming trend disappears! Peer review failed to assure quality – even to undergraduate level. IPCC chose to start in a year which was cooled by the Mt Agung volcanic eruption, and finish in the warm 1987/8 El Niño. If it had come further, IPCC would have been caught by the cooling from the Mt Pinatubo eruption of 1991. IPCC’s “warming trend” was an artefact of the years chosen. Surprisingly, this dissembling caused little stir when exposed. Third Assessment Report IPCC’s Third Assessment Report (TAR) “Climate Change 2001: the scientific basis” dropped the SAR “key finding”, and proffered up a totally-unrelated replacement. The ‘Mann hockeystick’ (Figure 1b in the Summary for Policymakers, and repeated several times thereafter – see my Figure 1) purported to show 900 years of relatively- invariant Northern Hemisphere climate, followed by abrupt warming during the past century – caused by people. Unwisely, IPCC had crossed from climatology (numerical modelling) into palaeoclimatology (observation/correlation), and triggered an outcry - which continues. Palaeoclimatologists (I am one) have abundant pre-thermometer proxy evidence that climate in Europe and North America fluctuated widely over the past millennium. These fluctuations have the same timing on both continents – often correlating with proxy evidence of solar variability. Damage control ensued. Dr Michael C. MacCracken8, an IPCC Lead Author, evaluated the Sun/climate connection in his “Uncertainties emphasised by special interests”, thus: Twentieth century warming is primarily a recovery from the Little Ice Age and results largely from natural changes in solar output (or changes in cosmic rays, or solar field strength, or the lengths of sunspot cycles, or whatever curve one can construct) rather than the increase in greenhouse gas concentrations. Most of these claims are based on little more than correlations rather than on causal mechanisms supported by high quality, or even any quantitative, data. Some claims require small changes in a solar parameter to magically have large effects on the climate while insisting that much larger changes in energy due to increasing concentrations of greenhouse gases will only cause small changes in temperature. A number of these results would require overturning all that science has learned about global and planetary energetics while failing to explain how the Sun possibly knows to initiate its unique changes at exactly the same time that human activities start having an influence. In these arguments, The Skeptics glory in reporting the uncertainties described by IPCC about greenhouse gases and climate sensitivity while the same uncertainty is waved away in presentations that would make a revivalist preacher proud. ______________________________________________________________________________ 7. All is revealed in Michaels, P.J. and P.C. Knappenberger 1996. “Human effect on global climate?”, Nature v.384, pp.522-3. 8. President of the International Association of Meteorology and Atmospheric Sciences - in a paper “Uncertainties: how little do we really understand?” given to a Science and Technology Conference at Rice University in November 2003. (The underlining is original.)

BOB FOSTER page 8 Fourth Assessment Report The Summary for Policymakers of IPCC’s Fourth Assessment Report (AR4) “Climate Change 2007: the physical science basis” was released in February 2007. The ‘hockeystick’ appears no longer to be with us. However, the Sun has NOT been reinstated - but demoted to the point of irrelevance. Changes in solar irradiance since 1750 are here estimated to cause a natural forcing of +0.12 Wm-2, which is less than half the estimate given in the TAR. On the other hand, the globally averaged net effect of human activities since 1750 has been warming with a net radiative forcing of +1.6 Wm-2. Who needs a Sun? If it were not for people, there would be no perceptible difference between climate in 1750 and now9. In addition (and I agree): Volcanic aerosols contribute an additional natural forcing but are not included in this figure due to their episodic nature. Ours is indeed a people-driven climate. The only good news is that about the ‘hockeystick’. But recanting10 was in strange fashion: Some recent studies indicate greater variability in Northern Hemisphere temperatures than suggested in the TAR, particularly finding that cooler periods existed in the 12th to 14th, 17th, and 19th centuries. Warmer periods prior to the 20th century are within the uncertainty range given in the TAR. To refer to “some recent studies”, is being economical with the truth – there has been a long-term flow of papers11 on this topic, which has never stopped. And now IPCC has declared the Sun hors de combat, what variability caused those “cooler periods”? Is IPCC really interested in science – or only when it gets caught out? 5. DOES THE SUN’S VARIABLE MAGNETIC OUTPUT INFLUENCE CLIMATE? Although the Royal Society/UK Met Office/IPCC ignore inertial and resonant influences (of which more later), this is not the main difference between the competing hypotheses of a self-contained climate versus an external driver. As mentioned above, IPCC does allow a minuscule external warming-contribution from total solar irradiance (TSI). However, AR4 asserts that radiative forcing since 1750 from increased atmospheric concentrations of CO2 and CH4, has grown to 1.66 and 0.48 Wm-2 respectively in 2005 - compared to only 0.12 W-2 from TSI increase. The ‘Mainstream’ still sees the Sun as climatically irrelevant. It has been accepted now for half a century that most transportation of energy in the outer reaches of the Sun is via convection associated with the bulk turbulent motion of gas – not via radiation. Total solar irradiance varies only by fractions of a per cent; but the eruptive outflow of magnetised plasma can vary by many times. From hours to millennia, it is much more-plausible that the solar wind – not TSI – is the principal mediator of variability in the quantity of solar-sourced energy reaching Earth. _____________________________________________________________________________ 9. Figure SPM-2 “Radiative Forcing Components” in the (AR4) Summary for Policymakers of “Climate Change 2007: The Physical Science Basis” (p.4 of 18, in the electronic version). 10. Here quoting the AR4 Summary section “A paleoclimatic perspective” on p.10. 11. The first that attracted my attention was: George H. Denton, and Wibjörn Karlén 1973, “Holocene climatic variations – their pattern and possible cause”, Quaternary Research, v.3 pp.155-205. They didn’t blame concurrent fluctuations in North America and Europe on people.

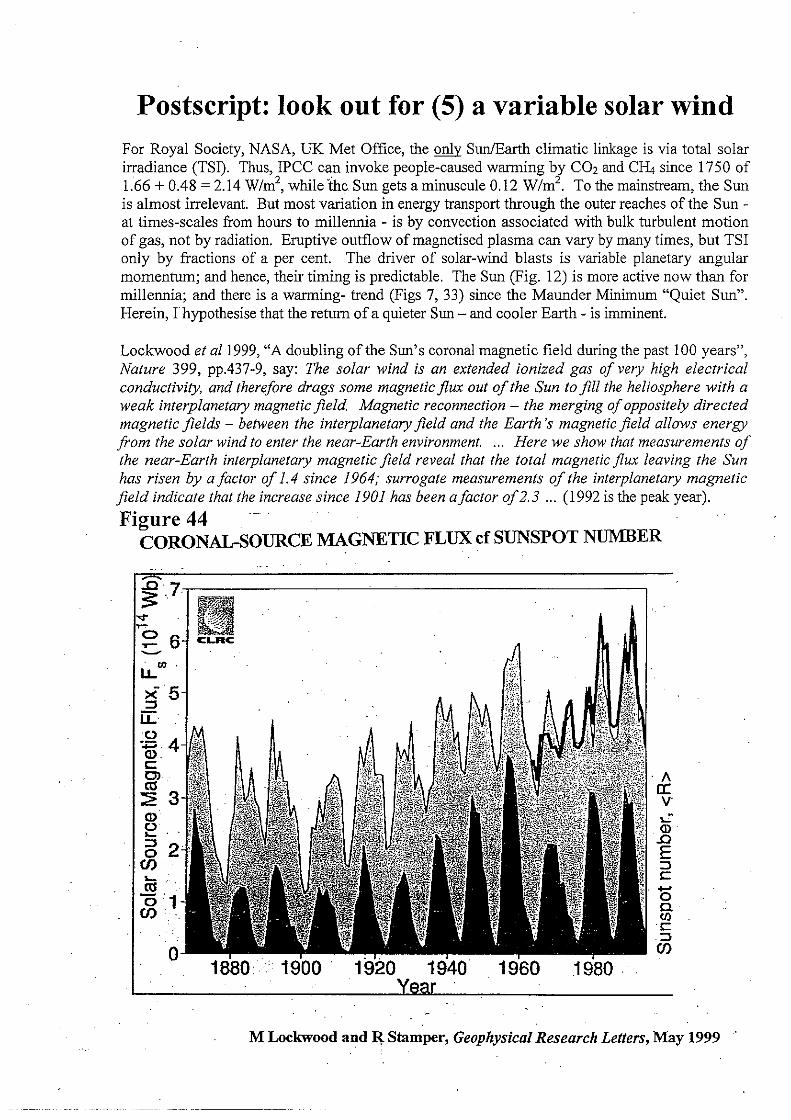
BOB FOSTER page 9 I here quote Usoskin, Solanki and Korte 2006, “Solar activity reconstructed over the past 7000 years: The influence of geomagnetic field changes”, GRL 33, GL025921. Their study: … allows the fraction of time to be estimated that the Sun spends in grand minima of activity. … about 6% or 430 years after 5000 BC with 320 of these years occurring during the last millennium. For grand maxima, hyper-active episodes (similar to the modern episode) remain very rare … being between about 1% and 3% of all the time during the last 7000 years. It appears that the Sun has been both atypically active and inactive, respectively, during the past century and the preceding series of Little Ice Age coolings. The last millennium was unusual. (The Grand Maximum of the 20th Century can be seen in the top LH graph of my Figure 12. My Figure 45 shows just how unusual the 20th Century was cf. the immediate past centuries.) An essentially observation-based paper is Lockwood, Stamper and Wild 1999, “A doubling of the Sun’s coronal magnetic field during the past 100 years”, Nature 399, pp. 437-9. Their abstract begins: The solar wind is an extended ionised gas of very high electrical conductivity and therefore drags some magnetic flux out of the Sun to fill the heliosphere with a weak interplanetary magnetic field. Magnetic reconnection – the merging of oppositely directed magnetic fields – between the interplanetary magnetic field and the Earth’s magnetic field allows energy from the solar wind to enter the near-Earth environment. … Here we show that measurements of the near-Earth interplanetary magnetic field reveal that the total magnetic flux leaving the Sun has risen by a factor of 1.4 since 1964 … Forget the early part of the 20th Century; their direct satellite-based observations are for 1964-96, and the peak year for solar magnetic flux was 1992 (see my Figure 44). Similarly, new observations indicate a distinct decline since 2001. Henrik Svensmark 2006, “The Antarctic climate anomaly and galactic cosmic rays”, arXiv:physics/0612145v1, makes the point that clouds provide a net cooling effect on Earth of some 15 Wm-2; and that a reduction in cloud cover of only 8% would warm the globe by almost 2 0C. He continues: … a chain of evidence appears to be complete, which links low-level clouds to the well-known modulation of galactic cosmic-ray intensity by solar magnetic activity, to the detected influence of galactic cosmic rays on cloudiness, and also to experimental evidence that electrons set free by passing muons help to make aerosols the pre-cursor to cloud condensation nuclei at low altitudes. The roles of cosmic rays and clouds as active players in climate change therefore merit closer attention The implications of solar magnetic variability are many, and only now becoming recognised. For instance, Svensmark and Calder 2007, “The chilling stars: a new theory of climate change”, Icon Books, 246 p., say on the outside of their back cover: … an interplay of the clouds, the Sun and cosmic rays – sub-atomic particles from exploded stars – seems to have more effect on the climate than man-made carbon dioxide. This conclusion stems from Svensmark’s research at the Danish National Space Centre which has recently shown that cosmic rays play an unsuspected role in making our everyday clouds. And during the last 100 years cosmic rays became scarcer because unusually vigorous action by the Sun batted many of them away. Fewer cosmic rays meant fewer clouds and a warmer world.

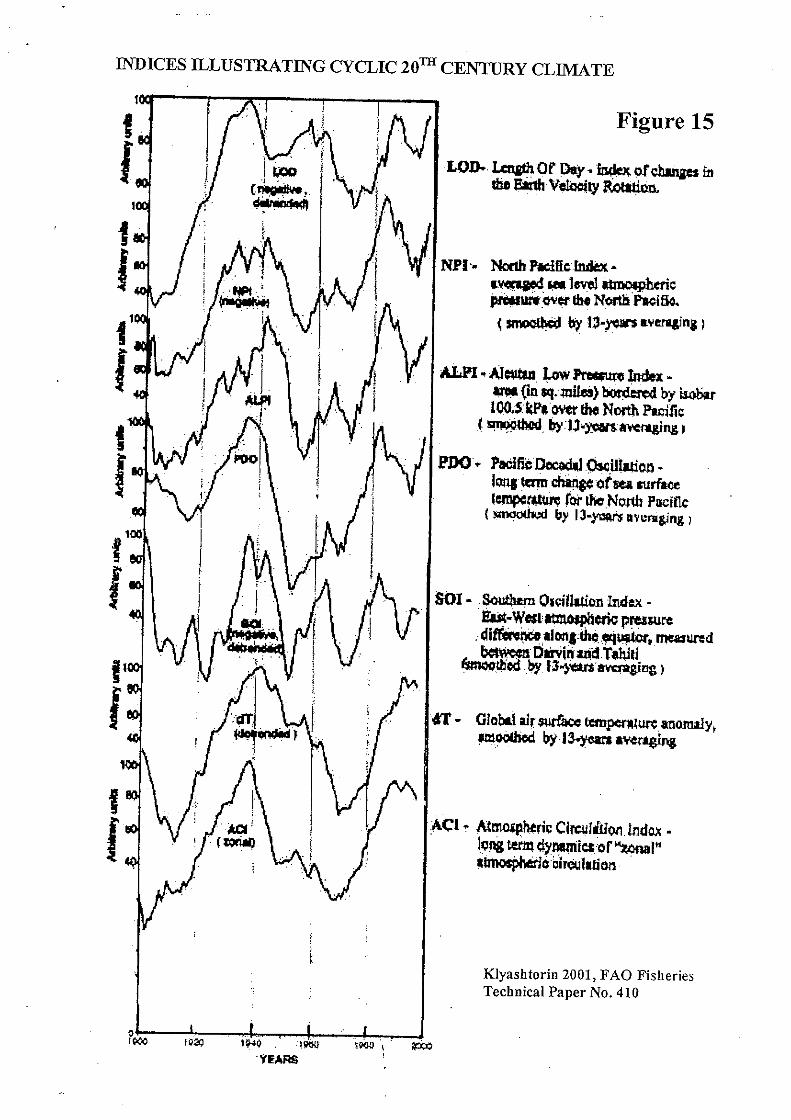
BOB FOSTER page 10 6. DOES AN INERTIALLY-RELATED EXTERNAL DRIVER INFLUENCE EARTH? There are climatically-influential external factors at a more-fundamental level. As Newton recognised in 1687, the giant outer planets orbit the centre of mass (barycentre) of the solar system; and their ever-varying collective angular momentum drives the Sun’s irregular orbit about that centre. Because the orbits of the outer giants can be predicted, so can the variable torque they apply to the Sun; and hence the timing of reversals in the ever-changing radius of the Sun’s orbit can also be predicted. (See my Figure 38 for a solar-orbit inflection point about now.) Solar eruptive activity - and intensity of the solar wind - has a predictable inertial driver. If this reasoning is correct, we are in for another period of ‘quiet Sun’; and the next Little Ice Age cold period will be fully developed by 2030 – and discernible much earlier. My Figure 15 is interesting at three levels. First, it shows how Earth’s length-of-day fluctuates; and how inflection points in LOD match inflection points for several climate-related indices. (Not included here is another graph from the same FAO paper showing a similar correspondence with fish-catches for several commercial species in the Eastern Pacific.) Second, FAO is a UN-affiliated body based in Rome – and IPCC is a UN-affiliated body based in Geneva. But this Klyashtorin (2001) graph doesn’t appear to have been given any weight by IPCC. Third, LOD inflection-points appear to correlate with inflection-points in rate-of-change of the Sun’s variable orbit (Figure 13). Perhaps this latter correlation should not be surprising. While the giant outer planets orbit the barycentre of the solar system, the small inner planets orbit the Sun – hence Earth may well suffer inertial forcing from the outer giants to the same timing as does the Sun. With a lag of six years, LOD change appears to influence global climate (Figure 14). Landscheidt formalised these considerations in a 2003 paper12. The next Little Ice Age cold period may be already on the way. It is interesting to note (pers. com.) that Landscheidt sent his draft first to Nature, who rejected it – without peer-review – as being “of insufficient general interest”. Amazing! 7. AN INERTIAL CAUSE FOR THE GREAT PACIFIC CLIMATE SHIFT OF 1976/7? One can forgive CSIRO – but not for everything. It would not have known of Landscheidt’s paper when it distributed free of charge to schools, libraries and me a wall-chart Future climate change in Australia giving the December – February days over 35 0C for 10 localities “now”, in 2030, and again in 2070. In 2030, not even one locality has the low-end of its range lower than now. At my birthplace (Darwin), there is one such day now; I promise I am not making this up: the top of the range for 2070 is 79 days! There are only 90 days in the quarter, remember. I attended13 an address by Australia’s Chief Scientist (he is from CSIRO) in Melbourne on 13 September 2007. His handout distributed on the night said, near the beginning: The evolution of argument, discussion and data acquisition has established the reality of climate change, removing it from disbelief, debate, at least among rationally thinking people. ______________________________________________________________________________ 12. See Theodor Landscheidt 2003, “New Little Ice Age instead of global warming?”, Energy & Environment, v.14 no.2&3, pp.327-50. 13. Dr Jim Peacock AC FRS “The Climate Challenge” at a joint meeting of the Royal Society of Victoria and the Australian Academy of Technological Sciences and Engineering,

BOB FOSTER page 11 Having thus disposed of us sceptics, it then proceeded to the issues. Of particular importance, and also discussed in the verbal presentation, it concluded (his emboldening): In the last 100 years the average surface temperature in Australia has increased by about one degree. Australia can expect average surface temperatures to rise by a further two to three degrees by the end of the century even if the world holds CO2 emissions. We must reduce the steep rise of emissions. Mitigation measures and the introduction of new low carbon energy and fuel systems take time – not overnight happenings. We need urgent action to begin to reduce emissions and we need to prepare for the impact of the emission driven climate consequences that are already inevitable and with us whilst Australia attempts to reduce our footprint. Surprisingly, in view of how trenchant are those statements, the presentation (both written and verbal) contained a notable flaw. He neglected to tells us listeners that the larger part of the “about one degree” increase in Australia’s average surface temperature over the past 100 years was in the form of a single step-change coincident with the Great Pacific Climate Shift of 1976/7 (see my Figure 43). This Shift in the Pacific Decadal Oscillation reversed a (less-abrupt) shift to PDO cool-phase at the turn of the 1940s. As shown in Figure 42, the 1976/7 Shift was a massive inertial event. The crosses on that graph represent estimates of the quantity of upwelling of cold, deep, water in the equatorial Pacific at that time. Over about two decades, upwelling quantity continued to decline – from about 27 Sv in 1973 to 14 Sv by 1995 (one Sverdrup = one million cubic metres/second). In my opinion, the PDO Shift is more likely related in its timing to a planets-driven ‘kink” in the Sun’s orbital motion - than to increased burning of fossil fuels (see Figure 13). PDO changes have a less- immediate and less precise impact on global temperature than on that in Australia. Figure 41 shows how slowly the PDO Shift (here shown as an increased preponderance of El Niño, vis a vis La Niña, conditions in the Pacific) influences the global average. Figure 14, from the Klyashtorin FAO paper already mentioned, suggests an average lag of about 6 years between the LOD trend-reversal and its impact on global temperature. If LOD does reverse in 2008 as expected (Figure 38), the global result should be discernible by about 2012/15. Cooling would be the outcome in the decades immediately ahead. Indeed, 1998 may be the warmest year for the next several decades. 8. WHAT MIGHT SOLAR CYCLES MEAN? There is a cyclicity in solar activity at many longer time-scales of no immediate relevance to this debate. But the Gleissberg Cycle at the century- level (see Figures 7, 39, 45 – and top RH graph in Figure 12) may be important to people alive today. The series of Little Ice Age cold periods, which succeeded the Mediaeval Warm Period, are manifestations of this cycle; and Landscheidt predicts that the next such cold period will be fully developed by 2030. But for Australia, CSIRO projects only warming in 2030 compared to now. There are two solar cycles involved at the decadal level. The Schwabe (ca.11-year) sunspot cycle seems influential in terms of energy reaching Earth. The Hale cycle (ca.22 –year) solar magnetic cycle appears to be climatically- influential in a qualitatively-different way.

BOB FOSTER page 12 The outflow of magnetised plasma comprising the solar wind increases between the inter-cycle trough and the peak of an individual sunspot cycle. In addition, coronal mass ejections (CMEs) are less numerous during troughs (196 CME events in 1992) than nearer the peaks in sunspot abundance (1535 events in 2000). When Earth is in the path of a CME, high- latitude Joule heating of the ionosphere-thermosphere system is an important solar-energy deposition process The power in a CME-related geomagnetic substorm is only now appreciated. A NASA release of 11 December 2007 tells us: On March 23, 2007, a substorm erupted over Alaska and Canada producing vivid auroras for more than two hours. And Even more impressive was the substorm’s power. Angelopoulos estimates the total energy of the two-hour event at five hundred thousand billion (5 x 10¹⁴) Joules. That’s approximately equivalent to the energy of a magnitude 5.5 earthquake. “The satellites have found evidence for magnetic ropes connecting Earth’s upper atmosphere directly to the Sun”, says Dave Sibeck, project scientist for the mission at the Goddard Space Flight Centre. “We believe that solar wind particles flow in along these ropes, providing energy for geomagnetic storms and auroras.” And finally Powerful substorms, giant magnetic ropes, explosions that stop the solar wind in its tracks: “We have much more to learn about all these things,” says Angelopoulos. “I can’t wait to see what comes next.” Satellite observations will be crucial to an ultimate (in my opinion, almost inevitable) overthrow of the self-contained-climate paradigm favoured by the scientific consensus. Time reveals Truth, remember. It has been found that an unusually- long sunspot cycle tends to be followed by a weak cycle. Schwabe Cycle 23 has lingered on and, despite NASA’s prediction that Cycle 24 will be unusually-strong, the auguries are suggesting otherwise14. The wide range of forecasts for the magnitude of Cycle 24 is presented in my Figure 40. There is no ‘consensus’ here! But the outcome will have implications for global temperature in the decade ahead. (NASA claims to have seen the first sunspot of Solar Cycle 24 on 4 January 2004 - 1½ years later than expected.) Not illogically, Schwabe cycles are identified trough to trough. But solar magnetic polarity reverses shortly after each peak. Thus the Hale solar magnetic cycle is the length of two sunspot cycles (ca. 22-yr) - but almost peak to peak. The Hale cycle is climatically influential (Figure 6) – perhaps because there is no similar reversal of magnetic polarity on Earth; hence one half-cycle influences our planet differently from the other. For instance15, in South Africa one Hale half-cycle is found to include a small flood and a big drought, and the other half-cycle a big flood and a small drought. Is it likewise in some parts of Australia? I don’t know. ______________________________________________________________________________ 14. David C. Archibald 2006, “Solar cycles 24 and 25 and predicted climate response”, Energy & Environment v.17 no.1, pp.29-35, has a Dalton Minimum (1800-20) look-alike coming. 15. William J.R. Alexander 2005, “Linkages between solar activity and climatic responses”, Energy & Environment v.16 no.2, pp.239-53.
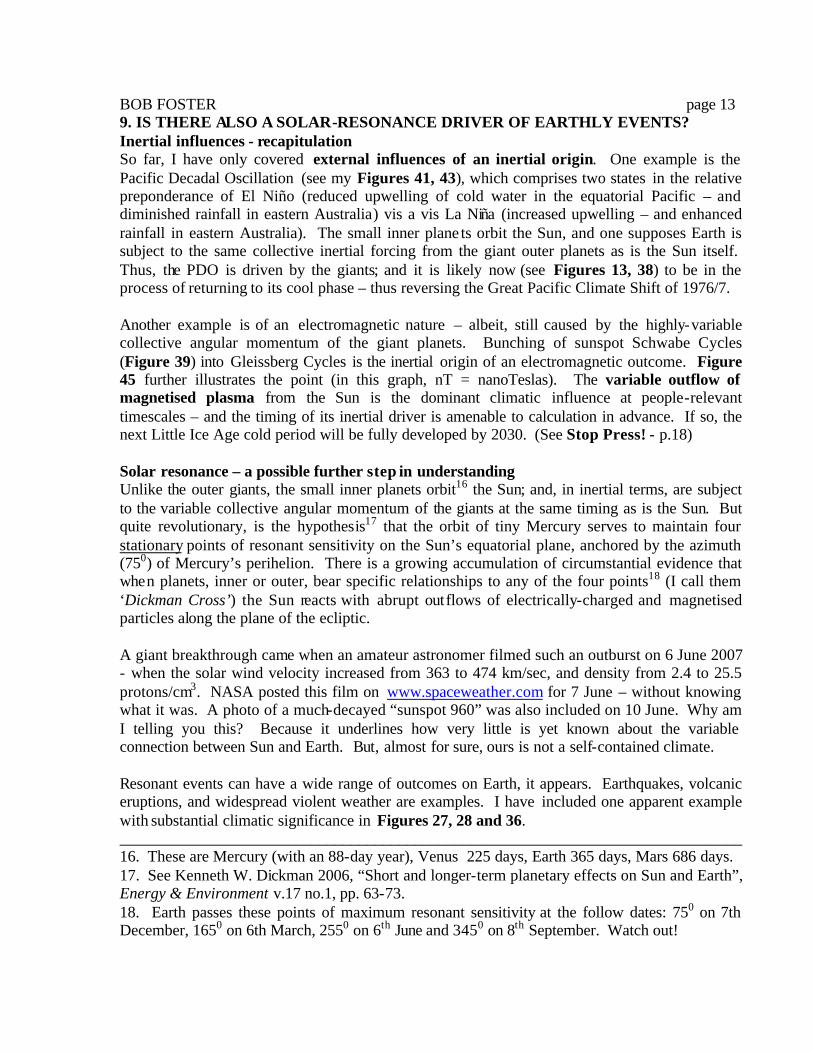
BOB FOSTER page 13 9. IS THERE ALSO A SOLAR-RESONANCE DRIVER OF EARTHLY EVENTS? Inertial influences - recapitulation So far, I have only covered external influences of an inertial origin. One example is the Pacific Decadal Oscillation (see my Figures 41, 43), which comprises two states in the relative preponderance of El Niño (reduced upwelling of cold water in the equatorial Pacific – and diminished rainfall in eastern Australia) vis a vis La Niña (increased upwelling – and enhanced rainfall in eastern Australia). The small inner plane ts orbit the Sun, and one supposes Earth is subject to the same collective inertial forcing from the giant outer planets as is the Sun itself. Thus, the PDO is driven by the giants; and it is likely now (see Figures 13, 38) to be in the process of returning to its cool phase – thus reversing the Great Pacific Climate Shift of 1976/7. Another example is of an electromagnetic nature – albeit, still caused by the highly-variable collective angular momentum of the giant planets. Bunching of sunspot Schwabe Cycles (Figure 39) into Gleissberg Cycles is the inertial origin of an electromagnetic outcome. Figure 45 further illustrates the point (in this graph, nT = nanoTeslas). The variable outflow of magnetised plasma from the Sun is the dominant climatic influence at people-relevant timescales – and the timing of its inertial driver is amenable to calculation in advance. If so, the next Little Ice Age cold period will be fully developed by 2030. (See Stop Press! - p.18) Solar resonance – a possible further step in understanding Unlike the outer giants, the small inner planets orbit16 the Sun; and, in inertial terms, are subject to the variable collective angular momentum of the giants at the same timing as is the Sun. But quite revolutionary, is the hypothesis17 that the orbit of tiny Mercury serves to maintain four stationary points of resonant sensitivity on the Sun’s equatorial plane, anchored by the azimuth (750) of Mercury’s perihelion. There is a growing accumulation of circumstantial evidence that when planets, inner or outer, bear specific relationships to any of the four points18 (I call them ‘Dickman Cross’) the Sun reacts with abrupt outflows of electrically-charged and magnetised particles along the plane of the ecliptic. A giant breakthrough came when an amateur astronomer filmed such an outburst on 6 June 2007 - when the solar wind velocity increased from 363 to 474 km/sec, and density from 2.4 to 25.5 protons/cm3. NASA posted this film on www.spaceweather.com for 7 June – without knowing what it was. A photo of a much-decayed “sunspot 960” was also included on 10 June. Why am I telling you this? Because it underlines how very little is yet known about the variable connection between Sun and Earth. But, almost for sure, ours is not a self-contained climate. Resonant events can have a wide range of outcomes on Earth, it appears. Earthquakes, volcanic eruptions, and widespread violent weather are examples. I have included one apparent example with substantial climatic significance in Figures 27, 28 and 36. ______________________________________________________________________________ 16. These are Mercury (with an 88-day year), Venus 225 days, Earth 365 days, Mars 686 days. 17. See Kenneth W. Dickman 2006, “Short and longer-term planetary effects on Sun and Earth”, Energy & Environment v.17 no.1, pp. 63-73. 18. Earth passes these points of maximum resonant sensitivity at the follow dates: 750 on 7th December, 1650 on 6th March, 2550 on 6th June and 3450 on 8th September. Watch out!

BOB FOSTER page 14 10. SCIENCE IS CRUCIAL – BUT ECONOMICS MATTERS TOO Dr Rajendra Pachauri, current head of IPCC, was some-time president of the International Association for Energy Economics. I was a member of IAEE for several decades; and will use energy economics to demonstrate partisan analysis. IPCC is not presenting a balanced view – it is supporting the case for people-driven future warming. Ian Castles19 criticised the Special Report on Economic Scenarios (SRES) “storylines”, as used by IPCC in its Third Assessment Report of 2001, because economic growth projected for the Third World was “implausibly high” in the low-end (B1) case and “unimaginably high” in the high-end (A1) case. IPCC proffered up NO case projecting plausible Third World economic growth – hence, it chose to offer no genuine low-end case. In its Fourth Assessment Report of 2007, IPCC didn’t revise its economics – despite the best efforts of Castles and Henderson20.
These same self-serving cases underpin Table SPM. 1 on page 7 of the new Synthesis Report21 – where “projected carbon dioxide equivalent concentrations”, and their corresponding warming, are presented for “six SRES marker scenarios”. In 2100, low-end and high-end concentrations (B1 and A1FI) will be about 600 and 1550 ppm respectively. From 1980-1999 to the end of the 21st Century, the best estimate of warming for those end-cases is 1.8 and 4.0 0C, respectively. (IPCC’s most-extreme model-sensitivities yield a warming-range of 1.1 to 6.4 0C.) IPCC’s high-end “storyline” puts average whole-world real-terms per-capita growth in goods and services at x35 between 1990 and 2100 – including an unimaginable x140 in developing Asia (excluding Japan, Iran and Former Soviet Union). It then builds a scenario (A1FI) where growth is largely powered by coal - to achieve its 1550 ppm CO2 concentration by 2100. My Attachment 2 shows selected individual countries. South Africa had a very coal- intensive economy in the last quarter of the 20th century – because of oil- from-coal at Sasol. By giving South Africa such unimaginably high economic growth, IPCC “builds in” extra CO2 emissions in both end-cases during the 21st century. Can this be an even-handed analysis? The low-end storyline invokes only modest economic growth in OECD, but real- terms per-capita GDP still grows an implausible x70 in developing Asia. Even for the balance of the developing world (Latin America, Africa and Middle East), it will average x30. High-end or low-end makes no difference; because IPCC tells us that EVERYONE will be rich by 2100. The mother of all economic miracles gives us a real- life yard-stick for this amazing nonsense: Japan’s 20th century growth was x20. ______________________________________________________________________________ 19. Visiting Fellow, Asia Pacific School of Economics and Government at Australian National University in Canberra, and former head of the Australian Bureau of Statistics. 20. Visiting Professor at Westminster Business School, and former Head of the Economics and Statistics Department of OECD. 21. Released in Valencia on 17 November 2007 was a Synthesis Report of the IPCC Fourth Assessment Report - of which I have so far only seen the Summary for Policymakers.

BOB FOSTER page 15 BP Statistical Review of World Energy (www.bp.com/statisticalreview ) provides an internally-consistent set of annual data – which I have been collecting ever since 1971. BP’s Group Chief Economist, Christof Rühl, provides a review of the 2006 data-set, saying: The growth in world carbon emissions from hydrocarbon consumption has increased to 3.4% pa since 2001, three times the rate in the previous five-year period. North America was the only region or grouping where emissions growth slowed. Energy consumption has become more carbon intensive; that is, carbon emissions have risen more rapidly than energy consumption. And: Despite the fact that energy intensity has declined for all regions, carbon intensity has not. The weight of coal in carbon intensive non-OECD economies has been growing so fast that their addition to carbon emissions outpaces the increased energy efficiency. Coal is king for anthropogenic GHG emissions. During 1990-2006, world coal use was up by a massive 40% - and 90% was in electricity-starved China and India. South Africa and China had the world’s most coal- intensive economies in 1990 (almost 80% of primary energy); but South Africa’s coal use grew only 32% to 2006, and that of China by 123% - from a very much larger base. India’s use grew at the same rate as China’s, but it used only 20% as much. Reducing global GHG emissions would mean restricting China’s electricity consumption. Since I and others were taken for a month- long tour of China in the 1980s by the Ministry of Petroleum Industry, I have had an interest in China. I learned that some Chinese factories were limited to 4 hours per day of electricity. When I retired from BHP, I worked in China during 1992/3 as a consultant for Asian Development Bank. Electricity availability had improved but little in the intervening decade. (I was based in the Nuclear Department of Tsing Hua University in Beijing, because its PRC energy-data-base was the best available22.) Several conclusions can be drawn: AYE. If the oft-quoted objective of reducing GHG emissions in 2050 to 50% of the 1990 level is to be attained, China’s coal consumption must shrink – not grow. BEE. China’s substitution of electricity for coal-burning in homes has enormous human-health advantages. In winter, the micro-climate in coal-heated dwellings is a severe health risk. CEE. South China (Sichuan) coal is high-sulphur. Australia needs to make available our low-sulphur NSW/Queensland coal without constraint. The less Sichuan coal burned, the better. DEE. China’s nuclear power program should be encouraged – not because CO2 is “global warming pollution”, but because the off-gas from burning South China coal is such a pollutant. Finally, economic and energy-consumption projections are only a very small part of the range of climate-related unknowns now facing us. Indeed, disagreement on economic issues may well be trivial - compared to the scientific gulf which separates sceptics from the Establishment. ______________________________________________________________________________ 22. It was my surmise, that the coal production from province- level and county- level mines had been reasonably well captured in energy statistics. However, coal production at the village level had often not been included. Hence, there may be a substantial, albeit an unquantifiable, level of “catch-up” hidden in the reporting of coal-production; and, when we read today of growth in China’s coal consumption, some is not “real” growth – just more-comprehensive reporting
BOB FOSTER page 16 11. SHOULD WE TAKE THE STERN REVIEW SERIOUSLY? There is yet one more economic riddle to consider23. What should we make of the vast Stern Review? A quote from the first page (xv) of the Summary of Conclusions will have to here suffice (emboldening is from the Review): There is still time to avoid the worst impacts of climate change, if we take strong action now. The scientific evidence is now overwhelming: climate change is a serious global threat, and demands an urgent response. … if we don’t act, the overall costs and risks of climate change will be equivalent to losing at least 5% of global GDP, now and forever. In contrast, the costs of action - reducing greenhouse gas emissions to avoid the worst impacts of climate change – can be limited to around 1% of global GDP each year. But even 1% of GDP would be about $US 400 billion/year; and there is a good chance it would be wasted. Instead, we could better spend money on alleviating real- life human misery – rather than on the abstract “fighting global warming”. I say don’t “take strong action now”. Instead, wait until we know whether Earth is warming or cooling - and we should know that by 2015, if not earlier. In the interim, the well-wired West should not be pressing China to limit the access of its people to electricity. It is too early to impoverish the world in general, and China in particular, in the “fight to stop global warming”. By 2015, it should be obvious whether people, or the Sun, drives Earthly climate. If it be the latter, planning for adaptation will be essential. A cooling world would be far worse for human well-being than the warming of which we are now being warned. 12. CONCLUSIONS Centuries ago, the portentous words Pay no worship to the garish Sun were spoken by Juliet – a 14 year-old non-scientist from the Capulet family in Verona. Strange as it may seem, negative solar-sentiment prospers even today. Mainstream scientists treat the Sun as virtually irrelevant in relation to climate change. In their view, the debate is over; and contrarians supporting the Sun in the climatic context, are now not welcomed – and even vilified. The hypothesis favoured by the scientific consensus , is that our stable and benign climate is self-contained; and in the millennium just past, climate was disturbed only intermittently by internal variability and/or vulcanism. This Arcadian state of affairs must imply an autonomous Earth – travelling, of necessity, in an empty Universe. Arcady has been vandalised by people burning fossil fuels; and resultant global warming is the greatest threat now confronting humanity. There will be NO cold periods ahead; only more and more warming - with potentially-catastrophic consequences - is predicted. Unless immediate action is taken to cut back “global-warming pollution”, at least half the years beyond 2009 will be warmer then the previous record-warm year of 1998. The world’s most dangerous pollutant is anthropogenic CO2 - whose principal source is coal- fired electricity generation ______________________________________________________________________________ 23. Nicholas Stern 2007, “The Economics of Climate Change: The Stern Review”, Cambridge University Press, 692 p.

BOB FOSTER page 17 We know the combined angular momentum of the giant outer planets drives the Sun’s irregular orbit about the centre-of-mass of the solar system; and the resultant highly-variable outflow of magnetised plasma from the Sun could well be the principal cause of climatic variability – and its timing appears amenable to prediction. Furthermore, the inertial impact of the outer giants directly influences Earth; and its most-obvious manifestation is the El Niño/La Niña variability in the upwelling of cold water in the equatorial Pacific. Here again, timing may be predictable. Lastly, a new hypothesis is gaining observational support from satellites. Unlike the outer giants, which orbit the centre-of-mass of the solar system, the small inner planets orbit the Sun. It appears that the Sun is maintained in a state of incipient resonance anchored to the orbit of Mercury. It appears increasingly likely that an additional external influence will be confirmed. If so, earthquakes and tsunamis, volcanic eruptions, and short-duration extreme weather events all may be found to have an external driver. A plausible alternative hypothesis is that planets drive the variable Sun-climate connection at human-relevant time-scales - via a widely-variable electromagnetic outflow into the solar wind. Also likely is a direct inertial impact on Earth – to much the same timing. Because the timing of planetary influences on the Sun - and hence Earth - can be calculated in advance, the timing of climate-change can be predicted. Cooling may well have begun, should be discernible by 2015, and the next Little Ice Age cold period will be fully-developed by 2030. An important consequence is that CO2 could then be reinstated to its previous role as THE crucial plant- food – and no longer be branded as “global warming pollution”. Fossil fuels – at least those with a low sulphur-content - would be environmentally-acceptably again. Which of these hypotheses is correct? No-one knows. But by about 2015, it will be clear whether or not warming has continued since the 1998 peak-year. If indeed at least half the years after 2009 are warmer than 1998, the people-driven climate is confirmed. But if the previous peak-warmth is not yet matched by 2015 – despite ever- increasing anthropogenic CO2 emissions in the interim – it will confirm that Earth’s climate has an external driver. I urge the Review to defer making recommendations concerning the “fight to defeat climate change” which might have the unintended consequence of needlessly reducing the prosperity of Australians - until it becomes clear whether the world is cooling or warming. Also having lived and worked in Nigeria, as well as in several other third-world countries, I believe that the premature diversion of zeal and resources, to what may prove to be a spurious fight to defeat climate change, would be bad for humanity. Early alleviation of already-known causes of human misery should be today’s first priority. Instead of spending money on ever-bigger computer-based climate models, or on subsidised wind-farms in localities where good-quality coal is already abundant, spend it instead – for instance - on health services in regions without them, wider availability of clean drinking water and sewerage, universal education for girls, and on the world-wide provision of electric light in dwellings.

BOB FOSTER page 18 Stop Press! The Space and Science Research Centre, www.spaceandscience.net, is “an independent scientific research facility”. Its Press Release SSRC 1-2008 of 2 January is relevant to the issues discussed here. The first paragraphs of the release are:
Changes in the Sun’s Surface to Bring Next Climate Change Today, the Space and Science Research Centre in Orlando, Florida announces that it has confirmed the recent web announcement of NASA solar physicists that there are substantial changes occurring in the Sun’s surface. The SSRC has further researched these changes and has concluded they will bring about the next climate change to one of a long lasting cold era. Today, director of the SSRC, John Casey has reaffirmed earlier research he led that independently discovered the Sun’s changes are the result of a family of cycles that bring about climate shifts from cold climate to warm and back again. “We today confirm the recent announcement by NASA that there are historic and important changes taking place on the Sun’s surface. This will have only one outcome – a new climate change is coming that will bring an extended period of deep cold to the planet. This is not however a unique event for the planet although it is critically important news to this and the next generations. It is but the normal sequence of alternating climate changes that has been going on for thousands of years. Further according to our research, this series of solar cycles are so predictable that they can be used to roughly forecast the next series of climate changes many decades in advance. I have verified the accuracy of these cycles’ behaviour over the last 1,100 years relative to temperatures on Earth, to well over 90%”. And, later: When asked about what this will mean to the average person on the street, Casey was firm. “The last time this particular cycle regenerated was over 200 years ago. I call it the ‘Bi-Centennial Cycle’ solar cycle. It took place between 1793 and 1830, the so-called Dalton Minimum, a period of extreme cold that resulted in what historian John D. Post called the ’last great subsistence crisis’. With that cold came massive crops losses, food riots, famine and disease. I believe the next climate change will be much stronger and has the potential to once more cause widespread crop losses globally with the resultant ill effects. The key difference for this next Bi-Centennial Cycle’s impact versus the last is that we will have over 8 billion mouths to feed in the next coldest years where as we only had 1 billion the last time. Among other effects like social and economic disruption, we are facing the real prospect of the ‘perfect storm of global food shortages’ in the next climate change. In answer to the question, everyone on the street will be affected.” And it concludes: In the meantime we will do our best to spread the word along with NASA and others who can see what is about to take place for the Earth’s climate. Soon, I believe this will be recognized as the most important climate story of this century.”

BOB FOSTER page 19 List of Figures (Numbering is not here consecutive ; because these Figures are drawn from a larger document.) 1. Northern Hemisphere temperature reconstruction (‘Hockeystick’ from IPCC’s 2001 TAR). 6. Solar magnetic cycle length matches temperature change (Khilyuk & Chilingar 2006). 7. Solar variability explains the 300-year warming trend (Hathaway & Wilson 2004). 12. Four graphs illustrating different aspects of pre- industrial variability. 13. Zero phases in the Sun’s orbital motion about the solar system’s centre-of-mass – plotted against rate-of-change of length-of-day (Landscheidt 2004, unpublished). 14. Detrended global surface temperature anomaly plotted against detrended length of day anomaly (Klyashtorin 2001). 15. Indices illustrating cyclic 20th Century climate (Klyashtorin 2001). 27. Global lower atmosphere temperatures (derived from satellite microwave sounding units). 28. Sea surface temperature on the equator at 1250 W longitude (McPhaden 2002). 36. Solar resonance – eminently plausible driver of Earthly affairs (Dickman 2007). 38. Abrupt solar-motion asymmetry suggests a PDO reversal in 2008 (Ian Wilson 2007 in press). 39. Gleissberg Cycles of centennial-scale solar variability (plotting Wolf sunspot number). 40. Several predictions of amplitude for Solar Cycle 24 (David Archibald in press). 41. Changes in ENSO-state and global temperature at 76/7 PDO Shift (Clim. Diagnostic Centre). 42. Pacific upwelling cf. sea-surface temperature (McPhaden & Zhang 2002). 43 Australian mean-temperature anomalies – showing 1976/7 PDO shift (Meteorology Bureau). 44. Coronal-source magnetic flux cf. sunspot number (Lockwood & Stamper 1999). 45. Heliomagnetic field near Earth, 1428-2005 (McCracken 2007). The Australian Geologist Attachment 1 Newsletter Number 143, June 2007, p. 31 Bob Foster, 13 April 2007 Dear Editor
Will it be warmer or cooler? Andy Gleadow’s editorial (From the President, TAG March 2007) presents but one hypothesis for explaining observed changes in 20th Century climate: These changes are well outside the range of natural variability in the oscillating climate states that have prevailed throughout the Pleistocene. Debate amongst atmospheric and climate scientists about cause and effect in all of this is long-since over. Their clear consensus is that the principal culprit in global warming, added to all the normal forcing factors, is CO2 emissions from fossil fuel burning. He may be right, of course; but no-one knows at this stage. In the interim, the people-driven climate remains a hypothesis – because no amount of “clear consensus” can make it a fact. The advancement of scientific understanding is not a matter of voting. In my opinion, it is too early for planners to eliminate all other hypotheses from their consideration. Below, I make five points in support of keeping an open mind for now. Time reveals Truth, they say.

BOB FOSTER page 20 1. No-one knows the future . There are firmly-based, but mutually-exclusive, views on climate. The consensus supports the Royal Society’s dogma that observed correlation between events on Sun and Earth is “mere coincidence”. Thus, the Intergovernmental Panel on Climate Change is able to claim that people are driving a self-contained climate. But people like me accept the compelling observational evidence for a variable Sun-Earth connection as main climate-driver. 2. People-driven-climate hypothesis “projects” NO cool periods ahead. IPCC invokes a stable pre- industrial Arcadia – only now disturbed by humans burning fossil fuels. But a self-contained climate demands an autonomous Earth – traveling in an empty Universe! IPCC’s infamous ‘hockeystick’ has 900 years of gentle cooling, now abruptly reversed by human–caused warming. (The Mediaeval Warm Period, and subsequent Little Ice Age cold periods, didn’t happen.) Unless greenhouse gas emissions are much reduced, continued warming is inevitable. CSIRO foretells summer warming in 2030 for 10 regions of Australia. In every case, not even the bottom of the range foretells cooling. Can this be science? 3. Sun-climate-connection hypothesis predicts next cool period. The irregular orbit of the Sun about the centre-of-mass of the solar system is driven by the combined angular momentum of the giant outer planets. Thus, widely-variable solar eruptive activity is the electromagnetic outcome of an inertial driver. Predicted return of a “quiet Sun” means the next Little Ice Age cold period should be fully-developed by 2030. The small inner planets orbit the Sun; and it is Mercury’s 88-day year which orchestrates solar resonance. Thus, from the millennial to the quotidian, planets drive solar-wind blasts. The Pacific Decadal Oscillation is one outcome; and the next PDO cool-phase is due by 2008 – reversing the Great Pacific Climate Shift of 75/6. Change in cloudiness, and in Earth’s ability to reflect little-varying solar irradiance, is another. 4. Bad and good news about carbon dioxide . IPCC finds CO2 to be the main anthropogenic greenhouse gas, with an increased radiative forcing (warming effect) of 1.56 W/m2 since 1750. Methane is 0.48 W/m2; and CH4 concentration has stabilised since demise of the Soviet Union. (IPCC allows the Sun but a minuscule 0.12 W/m2 of extra forcing.) Coal is the main source of CO2 from fuel-burning; and use grew 29% from 1990 to 2005. In China it doubled - accounting for 80% of world growth. Back in the Eocene abundance, when many of our plant families evolved, atmospheric CO2 concentration was x5 that of today. This trace-gas is THE vital plant food; and plants also better utilise water – a limiting factor in growth –with more CO2 in the air. Happily, global warming potential of CO2 is logarithmic with concentration – a rise from 0.04 to 0.08% would have the same theoretical impact as did 0.02 to 0.04%. This is good news. 5. Bad and bad economics. For IPCC’s low/high (B1/FI) scenarios, warming from 1990 is 1.1-6.4 0C by 2099 - invoking implausible/unimaginable Third World economic growth. A genuine low-end is absent. The impact of exaggerated per-capita GDP growth, eg. South Africa - most coal-intensive nation – (in 1990 US$ ‘000s: 2.8 in 1990 and 364-470 in 2100), is compounded in the 2006 Stern Review. Sir Nicholas Stern’s base-case accepts 15 billion people in 2100! His proposal to spend 1% of world GDP (say, US$400 billion/yr) “fighting global warming” should be deferred. Until Time reveals Truth, we should plan for warming or cooling ahead. For now at least, (lesser) spending on health and education in deprived regions is the better way to go.

Attachment 2 GDP IN YEAR 2100 FOR IPCC’S HIGHEST & LOWEST EMISSIONS SCENARIOS
Thousands of 1990 US dollars per-capita (Market-exchange-rate basis - IPCC’s preferred measure for inter-country comparisons)
1990 base-year High-end (A1) Marker Low-end (B1) Marker South Korea 6.5 653 201 South Africa 2.8 470 364 Malaysia 2.6 208 64 Italy 20 177 110 Russian Federation NA 170 103 Germany 20 168 105 Thailand 1.8 165 51 Argent ina 5.8 152 90 Japan 27 132 93 United States 22 114 79 Brazil 2.7 112 68 Mexico 3.0 104 62 Canada 22 88 73 Zimbabwe 0.62 87 68 Cameroon 1.0 82 64 China 0.32 78 39 Afghanistan NA 78 69 Algeria 1.7 75 158 Venezuela 2.7 71 42 Indonesia 0.62 68 21 Philippines 0.71 66 20 Australia 17 61 55 Peru 1.0 38 23 India 0.29 36 32 Pakistan 0.37 25 23 Bangladesh 0.20 23 21 Turkey 1.9 12 87 Warning: The per-capita GDP data for individual countries (above) has been down-scaled by IPCC’s Special Report on Emissions Scenarios (SRES) from collective totals for the four regions comprising the world. However, it is only GDP for the regions which has IPCC approval; and therefore, the individual-country projections are without official standing. It seems obvious, though, that any country for which GDP (or indeed, the consequent coal consumption) might be revised down in future must then be matched by revising another country up. Otherwise the approved regional GDP totals (or the end-point of the analysis - GHG emissions) would change. Source: Down-loaded from the SRES website http://sres.ciesin.columbia.edu/tgcia/ by Ian Castles. The numbers remain available at www.ipa.org.au/pubs/special/climate/castlespaper although the IPCC Task Group on Climate Impacts Assessment has withdrawn public access to its site. (Note: IPCC did not revise its economics for the 2007 Fourth Assessment Report.) Per-capita GDP for 1991 has been adopted here as my surrogate for 1990. Values are from “World Resources 1994-95: a guide to the global environment”, A.L. Hammond (Ed), OUP 1994, 400 p.


Postscript: look out for (3) the Royal Society The Lord Kelvin and 1892 are long gone, but the Royal Society hasn’t changed. It still sees striking correlations between events on Sun and Earth as “mere coincidence”. Alert readers of this document will have already noted the correlation between zero phases in the (giant-planet imposed) solar torque cycle, length-of-day change on Earth, and global temperature (see Figures 13, 14 above). The last temperature-trend reversal on Earth was marked by the Great Pacific Climate Shift of 1976/7; and this curtailment in upwelling of cold, deep, water in the equatorial eastern Pacific is (Figures 25, 26) an externally-driven inertial event. Below is plot of El Niño/Southern Oscillation (Figure 41) which shows the greater incidence of La Niña (more upwelling) prior to the 76/7 Shift, and of El Niño (less upwelling) thereafter. Plotted on the same graph is global surface temperature. Can you see the Shift – and its impact? On 10 April 2007, the Royal Society issued a press release “Man made climate change: the real science”. It proffers up a simple guide to climate change controversies, as six ‘straw men’ in which it poses - and then demolishes - objections to its hypothesis of a primarily people-driven climate. The most-relevant here is: Argument 4: ‘Global warming is all to do with the Sun’, which is sub-headed “What does the science say? ” Its demolition-job is, inter alia: Changes in the Sun’s activity influence the Earth’s climate through small but significant variations in its intensity. When it is in a more ‘active’ phase … it emits more light and heat. While there is evidence of a link between solar activity and some of the warming in the early 20th Century, … there has been very little change in underlying solar activity in the last 30 years … and so this cannot account for the recent rise we have seen in global temperatures. Nelson-like, the Society has raised its spy-glass to its blind eye - choosing to see solar activity only in terms of little-varying solar irradiance. It has failed to acknowledge the existence of inertial/resonant drivers at many time-scales, and their inertial and/or electromagnetic outcomes - for example, very-widely-variable blasts of solar wind. Furthermore, blindness also seems also to be the only plausible explanation for the Society’s failure to see a correlation between the PDO regime-change in 76/7 and global temperature – see below.
Figure 41
CHANGES IN ENSO-STATE AND GLOBAL TEMPERATURE AT 76/7 PDO SHIFT