board shareholder confidence index (bsci) 2013 · board shareholder confidence index (bsci) 2013...
TRANSCRIPT

Board Shareholder Confidence Index (BSCI) 2013 Developed in spring 2003, the Board Shareholder Confidence Index comprises of factors often used by active shareholders to assess Boards of Directors*. While there are other variables not in our model that contribute to the effectiveness of Boards -- including elements that can only be observed from inside the boardroom -- we capture factors affecting shareholders’ confidence in the Boards’ abilities to fulfill their duties. These factors are different from the TSX Guidelines for effective corporate governance in that they take into account the shareholders’ perception of risk. Based on factors available to those outside the walls of the boardroom, we evaluate and rank Boards of Directors by their potential to act in an effective way and by their performance, as indicated by past practices. The score is developed using four linked steps. The result is a transparent, objective, and adaptable rating system that assigns companies listed on the S&P/TSX Composite Index a score out of 150. *We have updated the BSCI scoring criteria in 2013. Please see the BSCI 2013 Methodology for further details.
Sections in Report:: 1 - Totals (7 pages) 2 - Individual Potential (9 pages) 3 - Group Potential (6 pages) 4 - Board Decision Output (5 pages)
Joseph L. Rotman School of Management
105 St. George Street, Toronto, Ontario M5S 3E6 1/32Tel: (416) 978-8998
Email: [email protected]

TOTALS
Joseph L. Rotman School of Management
105 St. George Street, Toronto, Ontario M5S 3E6 2/32Tel: (416) 978-8998
Email: [email protected]

2013 Board Shareholder Confidence Index
Ticker Company
INDIVIDUAL
POTENTIAL GROUP POTENTIAL
BOARD DECISION
OUTPUT Total Deductions Score /150Maximum Deduction -29 -50 -71 -150
AAV Advantage Oil and Gas Ltd -13 -5 -39 -57 93
ABX Barrick Gold Corporation -10 -8 -8 -26 124
ACO.X ATCO Ltd. -11 -24 -27 -62 88
AEM Agnico-Eagle Mines Limited -8 -3 -16 -27 123
AGF.B AGF Management Ltd. -4 -17 -34 -55 95
AGI Alamos Gold Inc -8 -12 -20 -40 110
AGU Agrium Inc. -3 -4 -5 -12 138
AIM Aimia Inc. 0 0 -14 -14 136
ALA AltaGas Ltd -8 -6 -29 -43 107
AP.UN Allied Properties REIT 0 0 -21 -21 129
AQN Algonquin Power & Utilities Corp. -7 -20 -22 -49 101
AR Argonaut Gold Inc. -6 -5 -22 -33 117
ARE Aecon Group Inc. -6 -19 -22 -47 103
ARX ARC Resources Ltd. 0 0 -11 -11 139
ASR Alacer Gold Corp. -9 -14 -27 -50 100
ATD.B Alimentation Couche-Tard Inc. -4 -17 -27 -48 102
ATH Athabasca Oil Corp. -12 -25 -48 -85 65
ATP Atlantic Power Corporation 0 -15 -16 -31 119
AUQ AuRico Gold Inc. -8 -6 -11 -25 125
AX.UN Artis Real Estate Investment Trust -19 -34 -37 -90 60
BA Bell Aliant Inc. -15 -10 -12 -37 113
BAM.A Brookfield Asset Management Inc 0 -1 -16 -17 133
BB BlackBerry Limited -2 -2 -18 -22 128
BBD.B Bombardier Inc. -6 -18 -14 -38 112
BCB Cott Corporation -11 -4 -14 -29 121
BCE BCE Inc. -7 -12 -14 -33 117
BDI Black Diamond Group Limited -9 -10 -42 -61 89
BEI.UN Boardwalk Real Estate Investment Trust 0 -7 -12 -19 131
BIN Progressive Waste Solutions -2 -14 -14 -30 120
BIR Birchcliff Energy Ltd. -2 -16 -61 -79 71
BMO Bank of Montreal 0 0 -5 -5 145
BNE Bonterra Energy Corp. -3 -33 -35 -71 79
BNK Bankers Petroleum Ltd. -15 -5 -40 -60 90
BNP Bonavista Energy Corporation 0 -9 -35 -44 106
BNS Bank of Nova Scotia 0 0 -5 -5 145
BPO Brookfield Office Properties Inc -11 -12 -26 -49 101
BTE Baytex Energy Corporation -7 -18 -23 -48 102
TOTALSInformation on scoring can be found here: BSCI 2013 Methodology
Joseph L. Rotman School of Management
105 St. George Street, Toronto, Ontario M5S 3E6 3/32Tel: (416) 978-8998
Email: [email protected]

2013 Board Shareholder Confidence Index
Ticker Company
INDIVIDUAL
POTENTIAL GROUP POTENTIAL
BOARD DECISION
OUTPUT Total Deductions Score /150Maximum Deduction -29 -50 -71 -150
TOTALSInformation on scoring can be found here: BSCI 2013 Methodology
BTO B2Gold Corp. -2 -15 -28 -45 105
CAE CAE Inc. 0 0 -11 -11 139
CAR.UN Canadian Apartment Properties Real Estate Investment Trust -4 -5 -23 -32 118
CCA Cogeco Cable Inc. -3 -11 -15 -29 121
CCL.B CCL Industries Inc -1 -19 -15 -35 115
CCO Cameco Corporation -2 0 -5 -7 143
CCT Catamaran Corporation -5 -23 -33 -61 89
CFP Canfor Corporation -7 -9 -20 -36 114
CFW Calfrac Well Services Ltd -1 0 -25 -26 124
CG Centerra Gold Inc. -8 -5 -27 -40 110
CGG China Gold International Resources Corp. Ltd. -19 -17 -37 -73 77
CGX Cineplex Inc -11 -14 -21 -46 104
CIX CI Financial Corp -5 -9 -27 -41 109
CJR.B CORUS Entertainment Inc. 0 -18 -34 -52 98
CLC CML HealthCare Inc. -4 -29 -17 -50 100
CLS Celestica Inc. 0 -11 -11 -22 128
CM Canadian Imperial Bank of Commerce -6 0 -8 -14 136
CNQ Canadian Natural Resources Limited -6 -10 -28 -44 106
CNR Canadian National Railway Company -3 0 -14 -17 133
COS Canadian Oil Sands Limited -2 0 -17 -19 131
CP Canadian Pacific Railway Ltd. -1 -6 -5 -12 138
CPG Crescent Point Energy Corp -5 -5 -13 -23 127
CPX Capital Power Corporation -7 -12 -3 -22 128
CR Crew Energy Inc. -6 -26 -35 -67 83
CRR.UN Crombie Real Estate Investment Trust -10 -10 -15 -35 115
CS Capstone Mining Corp. -15 -15 -25 -55 95
CSH.UN Chartwell Retirement Residences -4 -4 -17 -25 125
CSU Constellation Software Inc. -12 -21 -19 -52 98
CTC.A Canadian Tire Corporation Limited -6 -23 -14 -43 107
CU Canadian Utilities Limited -15 -16 -24 -55 95
CUF.UN Cominar Real Estate Investment Trust -2 -13 -38 -53 97
CUS Canexus Corporation 0 0 -19 -19 131
CVE Cenovus Energy Inc. 0 -3 -14 -17 133
CWB Canadian Western Bank -3 -2 -22 -27 123
CWT.UN Calloway Real Estate Investment Trust -12 -18 -14 -44 106
D.UN Dundee Real Estate Investment Trust -9 -18 -22 -49 101
DC.A Dundee Corporation -7 -22 -30 -59 91
Joseph L. Rotman School of Management
105 St. George Street, Toronto, Ontario M5S 3E6 4/32Tel: (416) 978-8998
Email: [email protected]
2013 Board Shareholder Confidence Index
Ticker Company
INDIVIDUAL
POTENTIAL GROUP POTENTIAL
BOARD DECISION
OUTPUT Total Deductions Score /150Maximum Deduction -29 -50 -71 -150
TOTALSInformation on scoring can be found here: BSCI 2013 Methodology
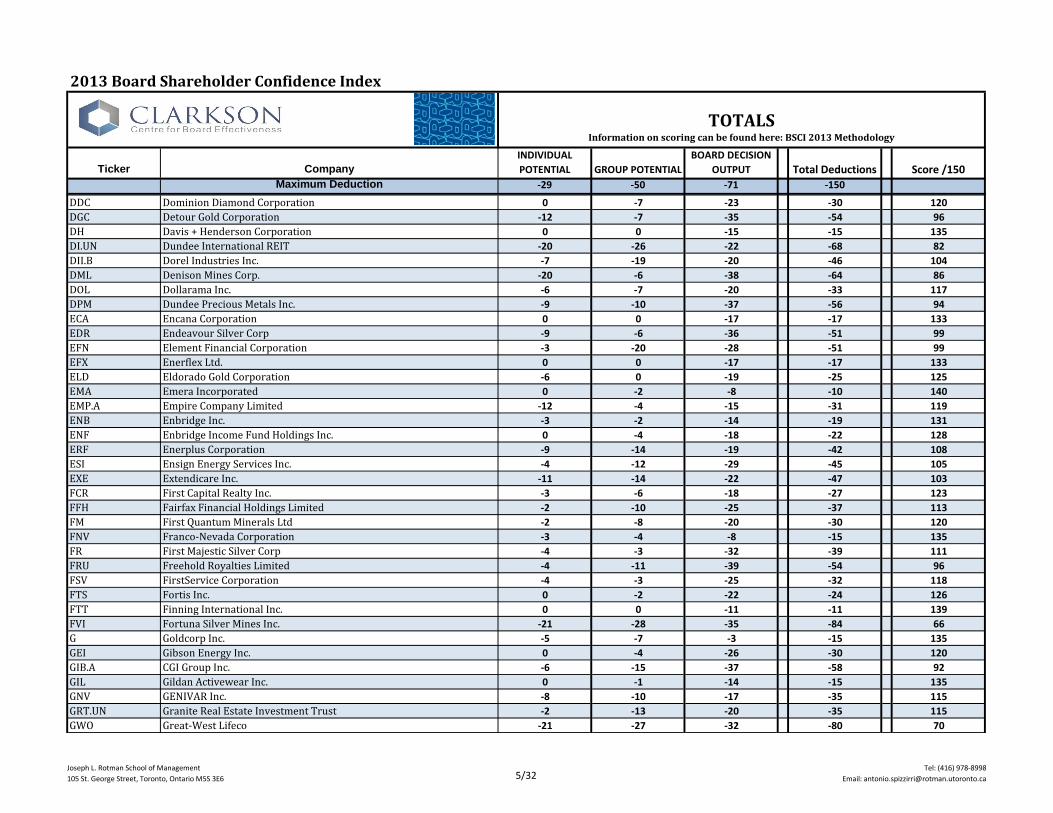
DDC Dominion Diamond Corporation 0 -7 -23 -30 120
DGC Detour Gold Corporation -12 -7 -35 -54 96
DH Davis + Henderson Corporation 0 0 -15 -15 135
DI.UN Dundee International REIT -20 -26 -22 -68 82
DII.B Dorel Industries Inc. -7 -19 -20 -46 104
DML Denison Mines Corp. -20 -6 -38 -64 86
DOL Dollarama Inc. -6 -7 -20 -33 117
DPM Dundee Precious Metals Inc. -9 -10 -37 -56 94
ECA Encana Corporation 0 0 -17 -17 133
EDR Endeavour Silver Corp -9 -6 -36 -51 99
EFN Element Financial Corporation -3 -20 -28 -51 99
EFX Enerflex Ltd. 0 0 -17 -17 133
ELD Eldorado Gold Corporation -6 0 -19 -25 125
EMA Emera Incorporated 0 -2 -8 -10 140
EMP.A Empire Company Limited -12 -4 -15 -31 119
ENB Enbridge Inc. -3 -2 -14 -19 131
ENF Enbridge Income Fund Holdings Inc. 0 -4 -18 -22 128
ERF Enerplus Corporation -9 -14 -19 -42 108
ESI Ensign Energy Services Inc. -4 -12 -29 -45 105
EXE Extendicare Inc. -11 -14 -22 -47 103
FCR First Capital Realty Inc. -3 -6 -18 -27 123
FFH Fairfax Financial Holdings Limited -2 -10 -25 -37 113
FM First Quantum Minerals Ltd -2 -8 -20 -30 120
FNV Franco-Nevada Corporation -3 -4 -8 -15 135
FR First Majestic Silver Corp -4 -3 -32 -39 111
FRU Freehold Royalties Limited -4 -11 -39 -54 96
FSV FirstService Corporation -4 -3 -25 -32 118
FTS Fortis Inc. 0 -2 -22 -24 126
FTT Finning International Inc. 0 0 -11 -11 139
FVI Fortuna Silver Mines Inc. -21 -28 -35 -84 66
G Goldcorp Inc. -5 -7 -3 -15 135
GEI Gibson Energy Inc. 0 -4 -26 -30 120
GIB.A CGI Group Inc. -6 -15 -37 -58 92
GIL Gildan Activewear Inc. 0 -1 -14 -15 135
GNV GENIVAR Inc. -8 -10 -17 -35 115
GRT.UN Granite Real Estate Investment Trust -2 -13 -20 -35 115
GWO Great-West Lifeco -21 -27 -32 -80 70
Joseph L. Rotman School of Management
105 St. George Street, Toronto, Ontario M5S 3E6 5/32Tel: (416) 978-8998
Email: [email protected]

2013 Board Shareholder Confidence Index
Ticker Company
INDIVIDUAL
POTENTIAL GROUP POTENTIAL
BOARD DECISION
OUTPUT Total Deductions Score /150Maximum Deduction -29 -50 -71 -150
TOTALSInformation on scoring can be found here: BSCI 2013 Methodology
HBM HudBay Minerals Inc. -4 -11 -26 -41 109
HCG Home Capital Group Inc. -4 0 -14 -18 132
HR.UN H&R Real Estate Investment Trust 0 -3 -27 -30 120
HSE Husky Energy Inc. -11 -14 -22 -47 103
IAG Industrial Alliance Insurance and Financial Services Inc. 0 -2 -8 -10 140
IFC Intact Financial Corporation 0 -1 -2 -3 147
IGM IGM Financial Inc -12 -23 -40 -75 75
IMG IAMGOLD Corporation -8 -3 -16 -27 123
IMO Imperial Oil Limited -2 -10 -11 -23 127
IPL.UN Inter Pipeline Fund -15 -8 -32 -55 95
JE Just Energy Group Inc. -18 -11 -18 -47 103
K Kinross Gold Corporation -8 0 -8 -16 134
KEY Keyera Corp 0 -2 -11 -13 137
L Loblaw Companies Limited -7 -14 -30 -51 99
LB Laurentian Bank of Canada -8 -2 -8 -18 132
LEG Legacy Oil + Gas Inc. 0 -19 -35 -54 96
LIF Labrador Iron Ore Royalty Corporation -11 -13 -32 -56 94
LNR Linamar Corporation -9 -10 -25 -44 106
LTS Lightstream Resources Ltd. -8 -16 -31 -55 95
LUN Lundin Mining Corporation -14 -8 -27 -49 101
MBT Manitoba Telecom Services Inc. 0 0 -9 -9 141
MDA MacDonald, Dettwiler and Associates Ltd. 0 0 -14 -14 136
MDI Major Drilling Group International Inc. -6 -11 -19 -36 114
MEG MEG Energy Corp. -5 -5 -23 -33 117
MFC Manulife Financial Corporation 0 -4 -8 -12 138
MFI Maple Leaf Foods Inc. -1 0 -14 -15 135
MG Magna International Inc. 0 -2 -12 -14 136
MIC Genworth MI Canada Inc. -10 -9 -20 -39 111
MRE Martinrea International -4 -9 -35 -48 102
MRU Metro Inc. 0 -7 -11 -18 132
MTL Mullen Group Ltd. -7 -6 -33 -46 104
MX Methanex Corporation 0 -1 -13 -14 136
NA National Bank of Canada 0 -5 -8 -13 137
NBD Norbord Inc. -7 -13 -27 -47 103
NG NovaGold Resources Inc -18 -17 -22 -57 93
NGD New Gold Inc. 0 -11 -15 -26 124
NPI Northland Power Inc. -4 -13 -20 -37 113
Joseph L. Rotman School of Management
105 St. George Street, Toronto, Ontario M5S 3E6 6/32Tel: (416) 978-8998
Email: [email protected]

2013 Board Shareholder Confidence Index
Ticker Company
INDIVIDUAL
POTENTIAL GROUP POTENTIAL
BOARD DECISION
OUTPUT Total Deductions Score /150Maximum Deduction -29 -50 -71 -150
TOTALSInformation on scoring can be found here: BSCI 2013 Methodology
NPR.UN Northern Property REIT -7 -18 -22 -47 103
NSU Nevsun Resources Ltd. -7 -15 -48 -70 80
NWC North West Company Inc -1 -4 -20 -25 125
OCX ONEX Corporation -3 -19 -32 -54 96
OGC OceanaGold Corp -15 -25 -44 -84 66
OSK Osisko Mining Corporation -4 -2 -21 -27 123
OTC Open Text Corporation -4 -10 -23 -37 113
PAA Pan American Silver Corporation -8 -4 -28 -40 110
PD Precision Drilling Corporation 0 0 -11 -11 139
PEY Peyto Exploration & Development Corp. -4 -3 -18 -25 125
PGF Pengrowth Energy Corporation -6 0 -9 -15 135
PJC.A Jean Coutu Group (PJC) Inc. -8 -15 -11 -34 116
PKI Parkland Fuel Corporation 0 -19 -19 -38 112
PMG Petrominerales Ltd. -16 -20 -26 -62 88
POT Potash Corporation of Saskatchewan Inc. 0 0 -3 -3 147
POU Paramount Resources Ltd -13 -6 -38 -57 93
POW Power Corporation of Canada -12 -35 -43 -90 60
PPL Pembina Pipeline Corporation -3 -2 -8 -13 137
PRE Pacific Rubiales Energy Corp. -11 -6 -38 -55 95
PSI Pason Systems Inc. -2 -11 -28 -41 109
PVG Pretium Resources Inc. -7 -23 -33 -63 87
PWF Power Financial Corporation -11 -27 -39 -77 73
PWT Penn West Petroleum Ltd. -8 -1 -33 -42 108
PXX BlackPearl Resources Inc. -3 -5 -46 -54 96
QBR.B Quebecor Inc. -3 -9 -27 -39 111
RBA Ritchie Bros. Auctioneers Incorporated -4 -4 -22 -30 120
RCI.B Rogers Communications Inc. -7 -23 -18 -48 102
REF.UN Canadian Real Estate Investment Trust 0 0 -6 -6 144
REI.UN Riocan Real Estate Invesment Trust -8 -1 -14 -23 127
RET.A Reitmans (Canada) Limited -9 -38 -31 -78 72
RIO Rio Alto Mining Limited -8 -14 -33 -55 95
RMX Rubicon Minerals Corporation -13 -18 -44 -75 75
RON RONA Inc. 0 -1 -8 -9 141
RUS Russel Metals Inc -5 -1 -25 -31 119
RY Royal Bank of Canada 0 0 -5 -5 145
S Sherritt International Corporation -8 -8 -18 -34 116
SAP Saputo Inc. -4 -9 -22 -35 115
Joseph L. Rotman School of Management
105 St. George Street, Toronto, Ontario M5S 3E6 7/32Tel: (416) 978-8998
Email: [email protected]

2013 Board Shareholder Confidence Index
Ticker Company
INDIVIDUAL
POTENTIAL GROUP POTENTIAL
BOARD DECISION
OUTPUT Total Deductions Score /150Maximum Deduction -29 -50 -71 -150
TOTALSInformation on scoring can be found here: BSCI 2013 Methodology
SC Shoppers Drug Mart Corporation -2 -2 -5 -9 141
SCL ShawCor Ltd. -2 -7 -20 -29 121
SES Secure Energy Services Inc. 0 -9 -28 -37 113
SJR.B Shaw Communications Inc -7 -20 -20 -47 103
SLF Sun Life Financial Inc. 0 -2 0 -2 148
SLW Silver Wheaton Corp. -15 -8 -11 -34 116
SMF SEMAFO Inc. -13 -17 -22 -52 98
SNC SNC-Lavalin Group Inc. -4 -12 -8 -24 126
SPB Superior Plus Corp. -4 -6 -17 -27 123
SSO Silver Standard Resources Inc. -2 -3 -22 -27 123
STN Stantec Inc. -1 0 -9 -10 140
SU Suncor Energy Inc 0 0 0 0 150
SVM Silvercorp Metals Inc. -4 -25 -31 -60 90
SVY Savanna Energy Services Corp. -1 -2 -27 -30 120
T TELUS Corporation -3 -1 -9 -13 137
TA TransAlta Corp. -3 -2 0 -5 145
TCK.B Teck Resources Limited -9 -15 -17 -41 109
TCL.A Transcontinental Inc. -8 -21 -20 -49 101
TCM Thompson Creek Metals Company Inc. -13 -7 -20 -40 110
TCW Trican Well Service Ltd. -3 -6 -30 -39 111
TD The Toronto-Dominion Bank -3 0 -5 -8 142
TDG Trinidad Drilling Ltd. 0 -10 -14 -24 126
TET Trilogy Energy Corporation -9 -6 -51 -66 84
TFI TransForce Inc 0 -12 -19 -31 119
TGL TransGlobe Energy Corporation -8 -4 -45 -57 93
THI Tim Hortons Inc. 0 -10 -14 -24 126
THO Tahoe Resources Inc. -3 -3 -29 -35 115
TIH Toromont Industries Ltd. 0 -8 -19 -27 123
TKO Taseko Mines Limited -19 -21 -37 -77 73
TLM Talisman Energy inc. -8 -3 -11 -22 128
TOU Tourmaline Oil Corp. -7 -20 -48 -75 75
TRI Thomson Reuters Corporation -14 -16 -14 -44 106
TRP TransCanada Corp. 0 0 -8 -8 142
TRQ Turquoise Hill Resources Ltd. -7 -1 -23 -31 119
TXG Torex Gold Resources Inc. -11 -12 -33 -56 94
VET Vermilion Energy Inc. 0 0 -8 -8 142
VRX Valeant Pharmaceuticals International, Inc. -4 -9 -14 -27 123
Joseph L. Rotman School of Management
105 St. George Street, Toronto, Ontario M5S 3E6 8/32Tel: (416) 978-8998
Email: [email protected]

2013 Board Shareholder Confidence Index
Ticker Company
INDIVIDUAL
POTENTIAL GROUP POTENTIAL
BOARD DECISION
OUTPUT Total Deductions Score /150Maximum Deduction -29 -50 -71 -150
TOTALSInformation on scoring can be found here: BSCI 2013 Methodology
VSN Veresen Inc -6 -6 -11 -23 127
WCP Whitecap Resources Inc. 0 -29 -44 -73 77
WFT West Fraser Timber Co. Ltd. -7 -10 -10 -27 123
WIN Wi-LAN Inc. -2 -14 -29 -45 105
WJA WestJet Airlines Ltd. -3 -26 -3 -32 118
WJX Wajax Corporation -2 -1 -17 -20 130
WN George Weston Limited -3 -14 -40 -57 93
WPT Westport Innovations Inc. -11 -9 -24 -44 106
WTE Westshore Terminals Investment Corporation -18 -38 -30 -86 64
X TMX Group Limited -7 0 -17 -24 126
YRI Yamana Gold Inc -5 -7 -17 -29 121
Joseph L. Rotman School of Management
105 St. George Street, Toronto, Ontario M5S 3E6 9/32Tel: (416) 978-8998
Email: [email protected]

INDIVIDUAL POTENTIAL
Joseph L. Rotman School of Management
105 St. George Street, Toronto, Ontario M5S 3E6 10/32Tel: (416) 978-8998
Email: [email protected]
2013 Board Shareholder Confidence Index
Ticker Company
Board
Independence
Director
Attendance
Director Share
Ownership
Group
Deductions
Score
/29Maximum Deduction -16 -5 -8 -29
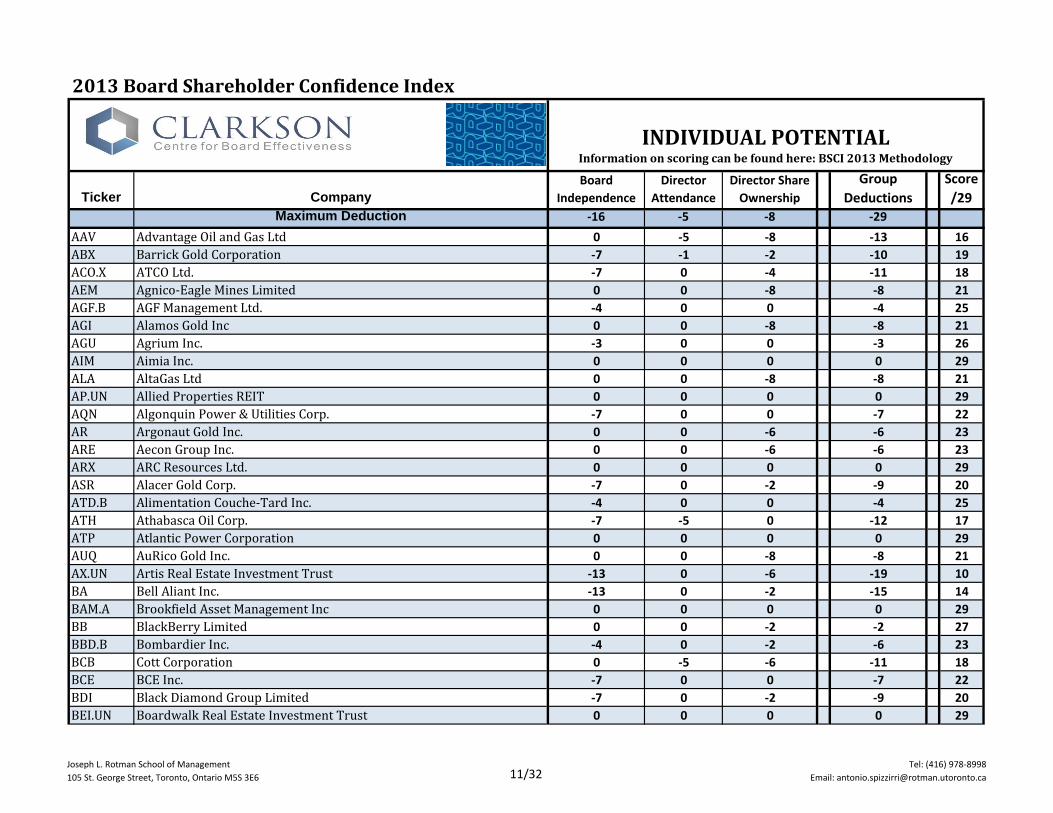
AAV Advantage Oil and Gas Ltd 0 -5 -8 -13 16
ABX Barrick Gold Corporation -7 -1 -2 -10 19
ACO.X ATCO Ltd. -7 0 -4 -11 18
AEM Agnico-Eagle Mines Limited 0 0 -8 -8 21
AGF.B AGF Management Ltd. -4 0 0 -4 25
AGI Alamos Gold Inc 0 0 -8 -8 21
AGU Agrium Inc. -3 0 0 -3 26
AIM Aimia Inc. 0 0 0 0 29
ALA AltaGas Ltd 0 0 -8 -8 21
AP.UN Allied Properties REIT 0 0 0 0 29
AQN Algonquin Power & Utilities Corp. -7 0 0 -7 22
AR Argonaut Gold Inc. 0 0 -6 -6 23
ARE Aecon Group Inc. 0 0 -6 -6 23
ARX ARC Resources Ltd. 0 0 0 0 29
ASR Alacer Gold Corp. -7 0 -2 -9 20
ATD.B Alimentation Couche-Tard Inc. -4 0 0 -4 25
ATH Athabasca Oil Corp. -7 -5 0 -12 17
ATP Atlantic Power Corporation 0 0 0 0 29
AUQ AuRico Gold Inc. 0 0 -8 -8 21
AX.UN Artis Real Estate Investment Trust -13 0 -6 -19 10
BA Bell Aliant Inc. -13 0 -2 -15 14
BAM.A Brookfield Asset Management Inc 0 0 0 0 29
BB BlackBerry Limited 0 0 -2 -2 27
BBD.B Bombardier Inc. -4 0 -2 -6 23
BCB Cott Corporation 0 -5 -6 -11 18
BCE BCE Inc. -7 0 0 -7 22
BDI Black Diamond Group Limited -7 0 -2 -9 20
BEI.UN Boardwalk Real Estate Investment Trust 0 0 0 0 29
INDIVIDUAL POTENTIALInformation on scoring can be found here: BSCI 2013 Methodology
Joseph L. Rotman School of Management
105 St. George Street, Toronto, Ontario M5S 3E6 11/32Tel: (416) 978-8998
Email: [email protected]

2013 Board Shareholder Confidence Index
Ticker Company
Board
Independence
Director
Attendance
Director Share
Ownership
Group
Deductions
Score
/29Maximum Deduction -16 -5 -8 -29
INDIVIDUAL POTENTIALInformation on scoring can be found here: BSCI 2013 Methodology
BIN Progressive Waste Solutions 0 0 -2 -2 27
BIR Birchcliff Energy Ltd. 0 0 -2 -2 27
BMO Bank of Montreal 0 0 0 0 29
BNE Bonterra Energy Corp. -3 0 0 -3 26
BNK Bankers Petroleum Ltd. -7 0 -8 -15 14
BNP Bonavista Energy Corporation 0 0 0 0 29
BNS Bank of Nova Scotia 0 0 0 0 29
BPO Brookfield Office Properties Inc -7 0 -4 -11 18
BTE Baytex Energy Corporation -7 0 0 -7 22
BTO B2Gold Corp. 0 0 -2 -2 27
CAE CAE Inc. 0 0 0 0 29
CAR.UN Canadian Apartment Properties Real Estate Investment Trust -4 0 0 -4 25
CCA Cogeco Cable Inc. -3 0 0 -3 26
CCL.B CCL Industries Inc 0 -1 0 -1 28
CCO Cameco Corporation 0 0 -2 -2 27
CCT Catamaran Corporation 0 -5 0 -5 24
CFP Canfor Corporation -3 0 -4 -7 22
CFW Calfrac Well Services Ltd 0 -1 0 -1 28
CG Centerra Gold Inc. 0 0 -8 -8 21
CGG China Gold International Resources Corp. Ltd. -13 0 -6 -19 10
CGX Cineplex Inc -7 0 -4 -11 18
CIX CI Financial Corp 0 -5 0 -5 24
CJR.B CORUS Entertainment Inc. 0 0 0 0 29
CLC CML HealthCare Inc. 0 0 -4 -4 25
CLS Celestica Inc. 0 0 0 0 29
CM Canadian Imperial Bank of Commerce -6 0 0 -6 23
CNQ Canadian Natural Resources Limited -6 0 0 -6 23
CNR Canadian National Railway Company -3 0 0 -3 26
Joseph L. Rotman School of Management
105 St. George Street, Toronto, Ontario M5S 3E6 12/32Tel: (416) 978-8998
Email: [email protected]

2013 Board Shareholder Confidence Index
Ticker Company
Board
Independence
Director
Attendance
Director Share
Ownership
Group
Deductions
Score
/29Maximum Deduction -16 -5 -8 -29
INDIVIDUAL POTENTIALInformation on scoring can be found here: BSCI 2013 Methodology
COS Canadian Oil Sands Limited 0 0 -2 -2 27
CP Canadian Pacific Railway Ltd. 0 -1 0 -1 28
CPG Crescent Point Energy Corp -3 0 -2 -5 24
CPX Capital Power Corporation -3 0 -4 -7 22
CR Crew Energy Inc. -4 0 -2 -6 23
CRR.UN Crombie Real Estate Investment Trust -10 0 0 -10 19
CS Capstone Mining Corp. -7 0 -8 -15 14
CSH.UN Chartwell Retirement Residences -4 0 0 -4 25
CSU Constellation Software Inc. -7 -5 0 -12 17
CTC.A Canadian Tire Corporation Limited -4 0 -2 -6 23
CU Canadian Utilities Limited -7 0 -8 -15 14
CUF.UN Cominar Real Estate Investment Trust 0 0 -2 -2 27
CUS Canexus Corporation 0 0 0 0 29
CVE Cenovus Energy Inc. 0 0 0 0 29
CWB Canadian Western Bank -3 0 0 -3 26
CWT.UN Calloway Real Estate Investment Trust -10 0 -2 -12 17
D.UN Dundee Real Estate Investment Trust -3 0 -6 -9 20
DC.A Dundee Corporation -7 0 0 -7 22
DDC Dominion Diamond Corporation 0 0 0 0 29
DGC Detour Gold Corporation -3 -1 -8 -12 17
DH Davis + Henderson Corporation 0 0 0 0 29
DI.UN Dundee International REIT -13 -5 -2 -20 9
DII.B Dorel Industries Inc. -7 0 0 -7 22
DML Denison Mines Corp. -10 -2 -8 -20 9
DOL Dollarama Inc. 0 0 -6 -6 23
DPM Dundee Precious Metals Inc. -3 0 -6 -9 20
ECA Encana Corporation 0 0 0 0 29
EDR Endeavour Silver Corp -3 0 -6 -9 20
Joseph L. Rotman School of Management
105 St. George Street, Toronto, Ontario M5S 3E6 13/32Tel: (416) 978-8998
Email: [email protected]

2013 Board Shareholder Confidence Index
Ticker Company
Board
Independence
Director
Attendance
Director Share
Ownership
Group
Deductions
Score
/29Maximum Deduction -16 -5 -8 -29
INDIVIDUAL POTENTIALInformation on scoring can be found here: BSCI 2013 Methodology
EFN Element Financial Corporation -3 0 0 -3 26
EFX Enerflex Ltd. 0 0 0 0 29
ELD Eldorado Gold Corporation 0 0 -6 -6 23
EMA Emera Incorporated 0 0 0 0 29
EMP.A Empire Company Limited -10 0 -2 -12 17
ENB Enbridge Inc. -3 0 0 -3 26
ENF Enbridge Income Fund Holdings Inc. 0 0 0 0 29
ERF Enerplus Corporation 0 -1 -8 -9 20
ESI Ensign Energy Services Inc. 0 0 -4 -4 25
EXE Extendicare Inc. 0 -5 -6 -11 18
FCR First Capital Realty Inc. -3 0 0 -3 26
FFH Fairfax Financial Holdings Limited 0 0 -2 -2 27
FM First Quantum Minerals Ltd 0 0 -2 -2 27
FNV Franco-Nevada Corporation -3 0 0 -3 26
FR First Majestic Silver Corp 0 0 -4 -4 25
FRU Freehold Royalties Limited -4 0 0 -4 25
FSV FirstService Corporation 0 0 -4 -4 25
FTS Fortis Inc. 0 0 0 0 29
FTT Finning International Inc. 0 0 0 0 29
FVI Fortuna Silver Mines Inc. -10 -5 -6 -21 8
G Goldcorp Inc. -3 0 -2 -5 24
GEI Gibson Energy Inc. 0 0 0 0 29
GIB.A CGI Group Inc. -3 -1 -2 -6 23
GIL Gildan Activewear Inc. 0 0 0 0 29
GNV GENIVAR Inc. 0 0 -8 -8 21
GRT.UN Granite Real Estate Investment Trust 0 0 -2 -2 27
GWO Great-West Lifeco -10 -5 -6 -21 8
HBM HudBay Minerals Inc. -4 0 0 -4 25
Joseph L. Rotman School of Management
105 St. George Street, Toronto, Ontario M5S 3E6 14/32Tel: (416) 978-8998
Email: [email protected]

2013 Board Shareholder Confidence Index
Ticker Company
Board
Independence
Director
Attendance
Director Share
Ownership
Group
Deductions
Score
/29Maximum Deduction -16 -5 -8 -29
INDIVIDUAL POTENTIALInformation on scoring can be found here: BSCI 2013 Methodology
HCG Home Capital Group Inc. 0 0 -4 -4 25
HR.UN H&R Real Estate Investment Trust 0 0 0 0 29
HSE Husky Energy Inc. -7 0 -4 -11 18
IAG Industrial Alliance Insurance and Financial Services Inc. 0 0 0 0 29
IFC Intact Financial Corporation 0 0 0 0 29
IGM IGM Financial Inc -10 -2 0 -12 17
IMG IAMGOLD Corporation 0 0 -8 -8 21
IMO Imperial Oil Limited 0 0 -2 -2 27
IPL.UN Inter Pipeline Fund -7 0 -8 -15 14
JE Just Energy Group Inc. -10 0 -8 -18 11
K Kinross Gold Corporation 0 0 -8 -8 21
KEY Keyera Corp 0 0 0 0 29
L Loblaw Companies Limited -7 0 0 -7 22
LB Laurentian Bank of Canada 0 0 -8 -8 21
LEG Legacy Oil + Gas Inc. 0 0 0 0 29
LIF Labrador Iron Ore Royalty Corporation -7 0 -4 -11 18
LNR Linamar Corporation -7 0 -2 -9 20
LTS Lightstream Resources Ltd. -7 -1 0 -8 21
LUN Lundin Mining Corporation -7 -1 -6 -14 15
MBT Manitoba Telecom Services Inc. 0 0 0 0 29
MDA MacDonald, Dettwiler and Associates Ltd. 0 0 0 0 29
MDI Major Drilling Group International Inc. 0 0 -6 -6 23
MEG MEG Energy Corp. 0 -1 -4 -5 24
MFC Manulife Financial Corporation 0 0 0 0 29
MFI Maple Leaf Foods Inc. 0 -1 0 -1 28
MG Magna International Inc. 0 0 0 0 29
MIC Genworth MI Canada Inc. -10 0 0 -10 19
MRE Martinrea International 0 0 -4 -4 25
Joseph L. Rotman School of Management
105 St. George Street, Toronto, Ontario M5S 3E6 15/32Tel: (416) 978-8998
Email: [email protected]

2013 Board Shareholder Confidence Index
Ticker Company
Board
Independence
Director
Attendance
Director Share
Ownership
Group
Deductions
Score
/29Maximum Deduction -16 -5 -8 -29
INDIVIDUAL POTENTIALInformation on scoring can be found here: BSCI 2013 Methodology
MRU Metro Inc. 0 0 0 0 29
MTL Mullen Group Ltd. -7 0 0 -7 22
MX Methanex Corporation 0 0 0 0 29
NA National Bank of Canada 0 0 0 0 29
NBD Norbord Inc. -7 0 0 -7 22
NG NovaGold Resources Inc -10 0 -8 -18 11
NGD New Gold Inc. 0 0 0 0 29
NPI Northland Power Inc. 0 0 -4 -4 25
NPR.UN Northern Property REIT -7 0 0 -7 22
NSU Nevsun Resources Ltd. 0 -5 -2 -7 22
NWC North West Company Inc 0 -1 0 -1 28
OCX ONEX Corporation -3 0 0 -3 26
OGC OceanaGold Corp -7 0 -8 -15 14
OSK Osisko Mining Corporation 0 0 -4 -4 25
OTC Open Text Corporation 0 0 -4 -4 25
PAA Pan American Silver Corporation 0 0 -8 -8 21
PD Precision Drilling Corporation 0 0 0 0 29
PEY Peyto Exploration & Development Corp. -4 0 0 -4 25
PGF Pengrowth Energy Corporation 0 0 -6 -6 23
PJC.A Jean Coutu Group (PJC) Inc. -7 -1 0 -8 21
PKI Parkland Fuel Corporation 0 0 0 0 29
PMG Petrominerales Ltd. -3 -5 -8 -16 13
POT Potash Corporation of Saskatchewan Inc. 0 0 0 0 29
POU Paramount Resources Ltd -7 0 -6 -13 16
POW Power Corporation of Canada -10 -2 0 -12 17
PPL Pembina Pipeline Corporation -3 0 0 -3 26
PRE Pacific Rubiales Energy Corp. -3 0 -8 -11 18
PSI Pason Systems Inc. 0 0 -2 -2 27
Joseph L. Rotman School of Management
105 St. George Street, Toronto, Ontario M5S 3E6 16/32Tel: (416) 978-8998
Email: [email protected]
2013 Board Shareholder Confidence Index
Ticker Company
Board
Independence
Director
Attendance
Director Share
Ownership
Group
Deductions
Score
/29Maximum Deduction -16 -5 -8 -29
INDIVIDUAL POTENTIALInformation on scoring can be found here: BSCI 2013 Methodology
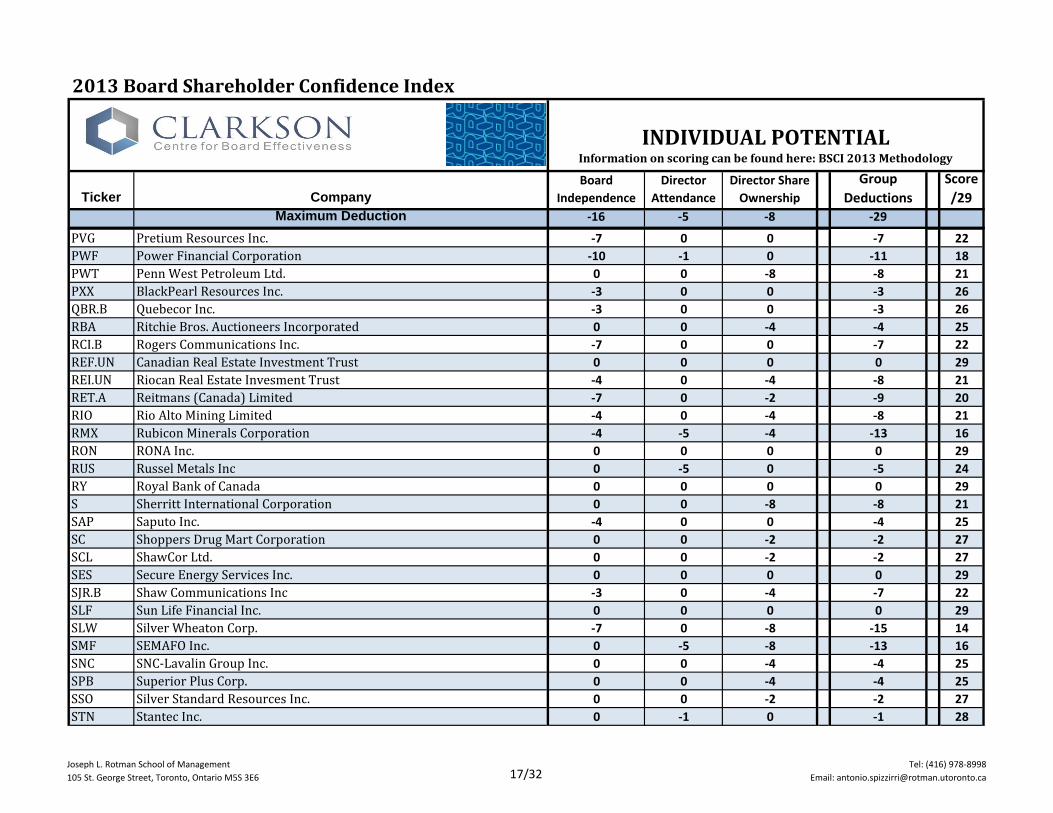
PVG Pretium Resources Inc. -7 0 0 -7 22
PWF Power Financial Corporation -10 -1 0 -11 18
PWT Penn West Petroleum Ltd. 0 0 -8 -8 21
PXX BlackPearl Resources Inc. -3 0 0 -3 26
QBR.B Quebecor Inc. -3 0 0 -3 26
RBA Ritchie Bros. Auctioneers Incorporated 0 0 -4 -4 25
RCI.B Rogers Communications Inc. -7 0 0 -7 22
REF.UN Canadian Real Estate Investment Trust 0 0 0 0 29
REI.UN Riocan Real Estate Invesment Trust -4 0 -4 -8 21
RET.A Reitmans (Canada) Limited -7 0 -2 -9 20
RIO Rio Alto Mining Limited -4 0 -4 -8 21
RMX Rubicon Minerals Corporation -4 -5 -4 -13 16
RON RONA Inc. 0 0 0 0 29
RUS Russel Metals Inc 0 -5 0 -5 24
RY Royal Bank of Canada 0 0 0 0 29
S Sherritt International Corporation 0 0 -8 -8 21
SAP Saputo Inc. -4 0 0 -4 25
SC Shoppers Drug Mart Corporation 0 0 -2 -2 27
SCL ShawCor Ltd. 0 0 -2 -2 27
SES Secure Energy Services Inc. 0 0 0 0 29
SJR.B Shaw Communications Inc -3 0 -4 -7 22
SLF Sun Life Financial Inc. 0 0 0 0 29
SLW Silver Wheaton Corp. -7 0 -8 -15 14
SMF SEMAFO Inc. 0 -5 -8 -13 16
SNC SNC-Lavalin Group Inc. 0 0 -4 -4 25
SPB Superior Plus Corp. 0 0 -4 -4 25
SSO Silver Standard Resources Inc. 0 0 -2 -2 27
STN Stantec Inc. 0 -1 0 -1 28
Joseph L. Rotman School of Management
105 St. George Street, Toronto, Ontario M5S 3E6 17/32Tel: (416) 978-8998
Email: [email protected]

2013 Board Shareholder Confidence Index
Ticker Company
Board
Independence
Director
Attendance
Director Share
Ownership
Group
Deductions
Score
/29Maximum Deduction -16 -5 -8 -29
INDIVIDUAL POTENTIALInformation on scoring can be found here: BSCI 2013 Methodology
SU Suncor Energy Inc 0 0 0 0 29
SVM Silvercorp Metals Inc. 0 0 -4 -4 25
SVY Savanna Energy Services Corp. 0 -1 0 -1 28
T TELUS Corporation -3 0 0 -3 26
TA TransAlta Corp. -3 0 0 -3 26
TCK.B Teck Resources Limited -4 -5 0 -9 20
TCL.A Transcontinental Inc. -4 0 -4 -8 21
TCM Thompson Creek Metals Company Inc. 0 -5 -8 -13 16
TCW Trican Well Service Ltd. -3 0 0 -3 26
TD The Toronto-Dominion Bank -3 0 0 -3 26
TDG Trinidad Drilling Ltd. 0 0 0 0 29
TET Trilogy Energy Corporation -7 0 -2 -9 20
TFI TransForce Inc 0 0 0 0 29
TGL TransGlobe Energy Corporation 0 0 -8 -8 21
THI Tim Hortons Inc. 0 0 0 0 29
THO Tahoe Resources Inc. -3 0 0 -3 26
TIH Toromont Industries Ltd. 0 0 0 0 29
TKO Taseko Mines Limited -10 -1 -8 -19 10
TLM Talisman Energy inc. 0 0 -8 -8 21
TOU Tourmaline Oil Corp. -7 0 0 -7 22
TRI Thomson Reuters Corporation -4 -2 -8 -14 15
TRP TransCanada Corp. 0 0 0 0 29
TRQ Turquoise Hill Resources Ltd. -7 0 0 -7 22
TXG Torex Gold Resources Inc. -3 0 -8 -11 18
VET Vermilion Energy Inc. 0 0 0 0 29
VRX Valeant Pharmaceuticals International, Inc. 0 0 -4 -4 25
VSN Veresen Inc 0 0 -6 -6 23
WCP Whitecap Resources Inc. 0 0 0 0 29
Joseph L. Rotman School of Management
105 St. George Street, Toronto, Ontario M5S 3E6 18/32Tel: (416) 978-8998
Email: [email protected]

2013 Board Shareholder Confidence Index
Ticker Company
Board
Independence
Director
Attendance
Director Share
Ownership
Group
Deductions
Score
/29Maximum Deduction -16 -5 -8 -29
INDIVIDUAL POTENTIALInformation on scoring can be found here: BSCI 2013 Methodology
WFT West Fraser Timber Co. Ltd. -7 0 0 -7 22
WIN Wi-LAN Inc. 0 0 -2 -2 27
WJA WestJet Airlines Ltd. -3 0 0 -3 26
WJX Wajax Corporation 0 0 -2 -2 27
WN George Weston Limited -3 0 0 -3 26
WPT Westport Innovations Inc. 0 -5 -6 -11 18
WTE Westshore Terminals Investment Corporation -13 -5 0 -18 11
X TMX Group Limited -4 -3 0 -7 22
YRI Yamana Gold Inc -3 0 -2 -5 24
Joseph L. Rotman School of Management
105 St. George Street, Toronto, Ontario M5S 3E6 19/32Tel: (416) 978-8998
Email: [email protected]

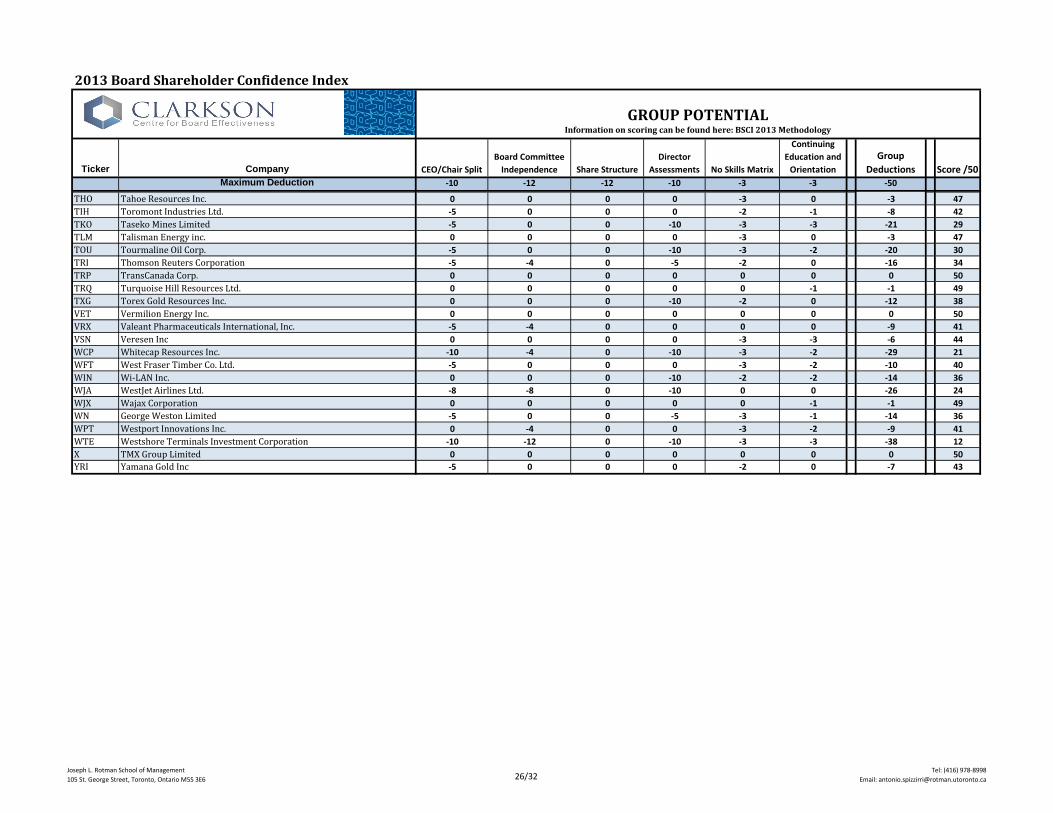
GROUP POTENTIAL
Joseph L. Rotman School of Management
105 St. George Street, Toronto, Ontario M5S 3E6 20/32Tel: (416) 978-8998
Email: [email protected]

2013 Board Shareholder Confidence Index
Ticker Company CEO/Chair Split
Board Committee
Independence Share Structure
Director
Assessments No Skills Matrix
Continuing
Education and
Orientation
Group
Deductions Score /50Maximum Deduction -10 -12 -12 -10 -3 -3 -50
AAV Advantage Oil and Gas Ltd 0 0 0 0 -3 -2 -5 45
ABX Barrick Gold Corporation -5 0 0 0 -2 -1 -8 42
ACO.X ATCO Ltd. -5 -4 -12 0 -2 -1 -24 26
AEM Agnico-Eagle Mines Limited 0 0 0 0 -2 -1 -3 47
AGF.B AGF Management Ltd. -5 0 -12 0 0 0 -17 33
AGI Alamos Gold Inc 0 0 0 -10 0 -2 -12 38
AGU Agrium Inc. 0 -4 0 0 0 0 -4 46
AIM Aimia Inc. 0 0 0 0 0 0 0 50
ALA AltaGas Ltd -5 0 0 0 0 -1 -6 44
AP.UN Allied Properties REIT 0 0 0 0 0 0 0 50
AQN Algonquin Power & Utilities Corp. 0 -4 0 -10 -3 -3 -20 30
AR Argonaut Gold Inc. 0 0 0 0 -3 -2 -5 45
ARE Aecon Group Inc. -10 -8 0 0 0 -1 -19 31
ARX ARC Resources Ltd. 0 0 0 0 0 0 0 50
ASR Alacer Gold Corp. 0 0 0 -10 -2 -2 -14 36
ATD.B Alimentation Couche-Tard Inc. -5 0 -9 0 -2 -1 -17 33
ATH Athabasca Oil Corp. -8 -12 0 0 -3 -2 -25 25
ATP Atlantic Power Corporation 0 0 0 -10 -2 -3 -15 35
AUQ AuRico Gold Inc. -5 0 0 0 0 -1 -6 44
AX.UN Artis Real Estate Investment Trust -8 -12 0 -10 -2 -2 -34 16
BA Bell Aliant Inc. -5 -4 0 0 0 -1 -10 40
BAM.A Brookfield Asset Management Inc 0 0 0 0 0 -1 -1 49
BB BlackBerry Limited 0 0 0 0 -2 0 -2 48
BBD.B Bombardier Inc. -5 0 -9 0 -3 -1 -18 32
BCB Cott Corporation 0 0 0 0 -2 -2 -4 46
BCE BCE Inc. 0 -12 0 0 0 0 -12 38
BDI Black Diamond Group Limited -5 0 0 0 -3 -2 -10 40
BEI.UN Boardwalk Real Estate Investment Trust -5 0 0 0 -2 0 -7 43
BIN Progressive Waste Solutions 0 0 0 -10 -2 -2 -14 36
BIR Birchcliff Energy Ltd. 0 0 0 -10 -3 -3 -16 34
BMO Bank of Montreal 0 0 0 0 0 0 0 50
BNE Bonterra Energy Corp. -10 -8 0 -10 -3 -2 -33 17
BNK Bankers Petroleum Ltd. 0 0 0 0 -3 -2 -5 45
BNP Bonavista Energy Corporation -5 0 0 0 -3 -1 -9 41
BNS Bank of Nova Scotia 0 0 0 0 0 0 0 50
BPO Brookfield Office Properties Inc -5 0 0 -5 0 -2 -12 38
BTE Baytex Energy Corporation -5 -4 0 -5 -2 -2 -18 32
BTO B2Gold Corp. 0 0 0 -10 -3 -2 -15 35
CAE CAE Inc. 0 0 0 0 0 0 0 50
CAR.UN Canadian Apartment Properties Real Estate Investment Trust -5 0 0 0 0 0 -5 45
CCA Cogeco Cable Inc. 0 0 -9 0 -1 -1 -11 39
CCL.B CCL Industries Inc -5 0 -12 0 -2 0 -19 31
CCO Cameco Corporation 0 0 0 0 0 0 0 50
GROUP POTENTIALInformation on scoring can be found here: BSCI 2013 Methodology
Joseph L. Rotman School of Management
105 St. George Street, Toronto, Ontario M5S 3E6 21/32Tel: (416) 978-8998
Email: [email protected]

2013 Board Shareholder Confidence Index
Ticker Company CEO/Chair Split
Board Committee
Independence Share Structure
Director
Assessments No Skills Matrix
Continuing
Education and
Orientation
Group
Deductions Score /50Maximum Deduction -10 -12 -12 -10 -3 -3 -50
GROUP POTENTIALInformation on scoring can be found here: BSCI 2013 Methodology
CCT Catamaran Corporation -5 -4 0 -10 -2 -2 -23 27
CFP Canfor Corporation 0 0 0 -5 -2 -2 -9 41
CFW Calfrac Well Services Ltd 0 0 0 0 0 0 0 50
CG Centerra Gold Inc. -5 0 0 0 0 0 -5 45
CGG China Gold International Resources Corp. Ltd. -5 -8 0 0 -3 -1 -17 33
CGX Cineplex Inc 0 -12 0 0 -2 0 -14 36
CIX CI Financial Corp -5 0 0 0 -2 -2 -9 41
CJR.B CORUS Entertainment Inc. -5 0 -12 0 -1 0 -18 32
CLC CML HealthCare Inc. -8 -12 0 -5 -2 -2 -29 21
CLS Celestica Inc. 0 0 -9 0 -2 0 -11 39
CM Canadian Imperial Bank of Commerce 0 0 0 0 0 0 0 50
CNQ Canadian Natural Resources Limited -5 -4 0 0 -1 0 -10 40
CNR Canadian National Railway Company 0 0 0 0 0 0 0 50
COS Canadian Oil Sands Limited 0 0 0 0 0 0 0 50
CP Canadian Pacific Railway Ltd. 0 -4 0 0 -2 0 -6 44
CPG Crescent Point Energy Corp 0 -4 0 0 0 -1 -5 45
CPX Capital Power Corporation -8 -4 0 0 0 0 -12 38
CR Crew Energy Inc. -8 -4 0 -10 -2 -2 -26 24
CRR.UN Crombie Real Estate Investment Trust -5 0 0 0 -3 -2 -10 40
CS Capstone Mining Corp. 0 0 0 -10 -3 -2 -15 35
CSH.UN Chartwell Retirement Residences 0 -4 0 0 0 0 -4 46
CSU Constellation Software Inc. -5 0 0 -10 -3 -3 -21 29
CTC.A Canadian Tire Corporation Limited 0 -8 -12 0 -3 0 -23 27
CU Canadian Utilities Limited -5 0 -9 0 -2 0 -16 34
CUF.UN Cominar Real Estate Investment Trust 0 0 0 -10 -2 -1 -13 37
CUS Canexus Corporation 0 0 0 0 0 0 0 50
CVE Cenovus Energy Inc. 0 0 0 0 -3 0 -3 47
CWB Canadian Western Bank 0 0 0 0 -2 0 -2 48
CWT.UN Calloway Real Estate Investment Trust -10 -8 0 0 0 0 -18 32
D.UN Dundee Real Estate Investment Trust -5 0 0 -10 -2 -1 -18 32
DC.A Dundee Corporation -5 0 -12 0 -3 -2 -22 28
DDC Dominion Diamond Corporation -5 0 0 0 -2 0 -7 43
DGC Detour Gold Corporation -5 0 0 0 -2 0 -7 43
DH Davis + Henderson Corporation 0 0 0 0 0 0 0 50
DI.UN Dundee International REIT 0 -12 0 -10 -2 -2 -26 24
DII.B Dorel Industries Inc. -5 0 -9 0 -3 -2 -19 31
DML Denison Mines Corp. -5 0 0 0 0 -1 -6 44
DOL Dollarama Inc. -5 0 0 0 -1 -1 -7 43
DPM Dundee Precious Metals Inc. -5 0 0 -5 0 0 -10 40
ECA Encana Corporation 0 0 0 0 0 0 0 50
EDR Endeavour Silver Corp 0 0 0 0 -3 -3 -6 44
EFN Element Financial Corporation -5 0 0 -10 -3 -2 -20 30
Joseph L. Rotman School of Management
105 St. George Street, Toronto, Ontario M5S 3E6 22/32Tel: (416) 978-8998
Email: [email protected]

2013 Board Shareholder Confidence Index
Ticker Company CEO/Chair Split
Board Committee
Independence Share Structure
Director
Assessments No Skills Matrix
Continuing
Education and
Orientation
Group
Deductions Score /50Maximum Deduction -10 -12 -12 -10 -3 -3 -50
GROUP POTENTIALInformation on scoring can be found here: BSCI 2013 Methodology
EFX Enerflex Ltd. 0 0 0 0 0 0 0 50
ELD Eldorado Gold Corporation 0 0 0 0 0 0 0 50
EMA Emera Incorporated 0 0 0 0 -2 0 -2 48
EMP.A Empire Company Limited 0 -4 0 0 0 0 -4 46
ENB Enbridge Inc. 0 0 0 0 -2 0 -2 48
ENF Enbridge Income Fund Holdings Inc. 0 0 0 0 -3 -1 -4 46
ERF Enerplus Corporation 0 0 0 -10 -3 -1 -14 36
ESI Ensign Energy Services Inc. -8 0 0 0 -3 -1 -12 38
EXE Extendicare Inc. 0 0 0 -10 -3 -1 -14 36
FCR First Capital Realty Inc. -5 0 0 0 0 -1 -6 44
FFH Fairfax Financial Holdings Limited -5 0 0 0 -3 -2 -10 40
FM First Quantum Minerals Ltd -5 0 0 0 -3 0 -8 42
FNV Franco-Nevada Corporation 0 -4 0 0 0 0 -4 46
FR First Majestic Silver Corp 0 0 0 0 -3 0 -3 47
FRU Freehold Royalties Limited 0 0 0 -10 0 -1 -11 39
FSV FirstService Corporation 0 0 0 0 -2 -1 -3 47
FTS Fortis Inc. 0 0 0 0 -2 0 -2 48
FTT Finning International Inc. 0 0 0 0 0 0 0 50
FVI Fortuna Silver Mines Inc. -8 -4 0 -10 -3 -3 -28 22
G Goldcorp Inc. -5 0 0 0 -2 0 -7 43
GEI Gibson Energy Inc. 0 0 0 0 -3 -1 -4 46
GIB.A CGI Group Inc. -5 0 -6 0 -3 -1 -15 35
GIL Gildan Activewear Inc. 0 0 0 0 0 -1 -1 49
GNV GENIVAR Inc. -5 0 0 0 -3 -2 -10 40
GRT.UN Granite Real Estate Investment Trust -8 0 0 0 -3 -2 -13 37
GWO Great-West Lifeco -8 -4 0 -10 -3 -2 -27 23
HBM HudBay Minerals Inc. 0 -8 0 0 -3 0 -11 39
HCG Home Capital Group Inc. 0 0 0 0 0 0 0 50
HR.UN H&R Real Estate Investment Trust 0 0 0 0 -2 -1 -3 47
HSE Husky Energy Inc. -8 0 0 -5 -1 0 -14 36
IAG Industrial Alliance Insurance and Financial Services Inc. 0 0 0 0 -2 0 -2 48
IFC Intact Financial Corporation 0 0 0 0 -1 0 -1 49
IGM IGM Financial Inc -8 0 0 -10 -3 -2 -23 27
IMG IAMGOLD Corporation 0 0 0 0 -1 -2 -3 47
IMO Imperial Oil Limited -5 0 0 -5 0 0 -10 40
IPL.UN Inter Pipeline Fund -5 0 0 0 -3 0 -8 42
JE Just Energy Group Inc. -5 -4 0 0 -2 0 -11 39
K Kinross Gold Corporation 0 0 0 0 0 0 0 50
KEY Keyera Corp 0 0 0 0 -2 0 -2 48
L Loblaw Companies Limited -5 0 0 -5 -3 -1 -14 36
LB Laurentian Bank of Canada 0 0 0 0 -2 0 -2 48
LEG Legacy Oil + Gas Inc. 0 -4 0 -10 -3 -2 -19 31
Joseph L. Rotman School of Management
105 St. George Street, Toronto, Ontario M5S 3E6 23/32Tel: (416) 978-8998
Email: [email protected]

2013 Board Shareholder Confidence Index
Ticker Company CEO/Chair Split
Board Committee
Independence Share Structure
Director
Assessments No Skills Matrix
Continuing
Education and
Orientation
Group
Deductions Score /50Maximum Deduction -10 -12 -12 -10 -3 -3 -50
GROUP POTENTIALInformation on scoring can be found here: BSCI 2013 Methodology
LIF Labrador Iron Ore Royalty Corporation 0 0 0 -10 -1 -2 -13 37
LNR Linamar Corporation -8 0 0 0 -2 0 -10 40
LTS Lightstream Resources Ltd. 0 0 0 -10 -3 -3 -16 34
LUN Lundin Mining Corporation -5 0 0 0 -3 0 -8 42
MBT Manitoba Telecom Services Inc. 0 0 0 0 0 0 0 50
MDA MacDonald, Dettwiler and Associates Ltd. 0 0 0 0 0 0 0 50
MDI Major Drilling Group International Inc. -8 0 0 0 0 -3 -11 39
MEG MEG Energy Corp. -5 0 0 0 0 0 -5 45
MFC Manulife Financial Corporation 0 -4 0 0 0 0 -4 46
MFI Maple Leaf Foods Inc. 0 0 0 0 0 0 0 50
MG Magna International Inc. 0 0 0 0 -2 0 -2 48
MIC Genworth MI Canada Inc. -5 0 0 0 -3 -1 -9 41
MRE Martinrea International -5 0 0 0 -3 -1 -9 41
MRU Metro Inc. -5 0 0 0 -2 0 -7 43
MTL Mullen Group Ltd. -5 0 0 0 -1 0 -6 44
MX Methanex Corporation 0 0 0 0 -1 0 -1 49
NA National Bank of Canada 0 -4 0 0 0 -1 -5 45
NBD Norbord Inc. -8 -4 0 0 0 -1 -13 37
NG NovaGold Resources Inc -5 0 0 -10 -2 0 -17 33
NGD New Gold Inc. -8 0 0 0 -2 -1 -11 39
NPI Northland Power Inc. -5 -4 0 0 -3 -1 -13 37
NPR.UN Northern Property REIT -5 -8 0 0 -3 -2 -18 32
NSU Nevsun Resources Ltd. 0 0 0 -10 -3 -2 -15 35
NWC North West Company Inc 0 0 0 0 -3 -1 -4 46
OCX ONEX Corporation -5 0 -9 0 -3 -2 -19 31
OGC OceanaGold Corp -5 -4 0 -10 -3 -3 -25 25
OSK Osisko Mining Corporation 0 0 0 0 -2 0 -2 48
OTC Open Text Corporation -5 0 0 0 -3 -2 -10 40
PAA Pan American Silver Corporation 0 0 0 0 -3 -1 -4 46
PD Precision Drilling Corporation 0 0 0 0 0 0 0 50
PEY Peyto Exploration & Development Corp. 0 0 0 0 -2 -1 -3 47
PGF Pengrowth Energy Corporation 0 0 0 0 0 0 0 50
PJC.A Jean Coutu Group (PJC) Inc. -8 -4 0 0 -3 0 -15 35
PKI Parkland Fuel Corporation 0 -4 0 -10 -3 -2 -19 31
PMG Petrominerales Ltd. -5 0 0 -10 -3 -2 -20 30
POT Potash Corporation of Saskatchewan Inc. 0 0 0 0 0 0 0 50
POU Paramount Resources Ltd -5 0 0 0 0 -1 -6 44
POW Power Corporation of Canada -10 -4 -6 -10 -3 -2 -35 15
PPL Pembina Pipeline Corporation 0 0 0 0 -2 0 -2 48
PRE Pacific Rubiales Energy Corp. -5 0 0 0 -1 0 -6 44
PSI Pason Systems Inc. -5 0 0 -5 0 -1 -11 39
PVG Pretium Resources Inc. -5 -4 0 -10 -2 -2 -23 27
Joseph L. Rotman School of Management
105 St. George Street, Toronto, Ontario M5S 3E6 24/32Tel: (416) 978-8998
Email: [email protected]
2013 Board Shareholder Confidence Index
Ticker Company CEO/Chair Split
Board Committee
Independence Share Structure
Director
Assessments No Skills Matrix
Continuing
Education and
Orientation
Group
Deductions Score /50Maximum Deduction -10 -12 -12 -10 -3 -3 -50
GROUP POTENTIALInformation on scoring can be found here: BSCI 2013 Methodology
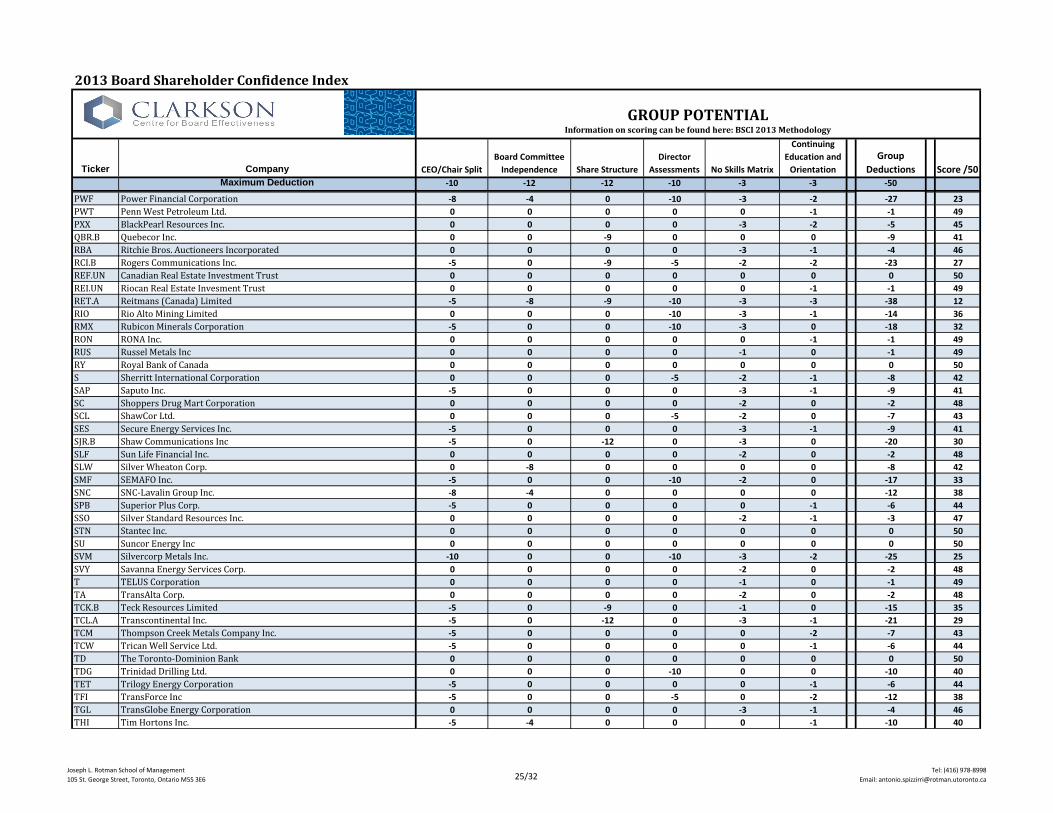
PWF Power Financial Corporation -8 -4 0 -10 -3 -2 -27 23
PWT Penn West Petroleum Ltd. 0 0 0 0 0 -1 -1 49
PXX BlackPearl Resources Inc. 0 0 0 0 -3 -2 -5 45
QBR.B Quebecor Inc. 0 0 -9 0 0 0 -9 41
RBA Ritchie Bros. Auctioneers Incorporated 0 0 0 0 -3 -1 -4 46
RCI.B Rogers Communications Inc. -5 0 -9 -5 -2 -2 -23 27
REF.UN Canadian Real Estate Investment Trust 0 0 0 0 0 0 0 50
REI.UN Riocan Real Estate Invesment Trust 0 0 0 0 0 -1 -1 49
RET.A Reitmans (Canada) Limited -5 -8 -9 -10 -3 -3 -38 12
RIO Rio Alto Mining Limited 0 0 0 -10 -3 -1 -14 36
RMX Rubicon Minerals Corporation -5 0 0 -10 -3 0 -18 32
RON RONA Inc. 0 0 0 0 0 -1 -1 49
RUS Russel Metals Inc 0 0 0 0 -1 0 -1 49
RY Royal Bank of Canada 0 0 0 0 0 0 0 50
S Sherritt International Corporation 0 0 0 -5 -2 -1 -8 42
SAP Saputo Inc. -5 0 0 0 -3 -1 -9 41
SC Shoppers Drug Mart Corporation 0 0 0 0 -2 0 -2 48
SCL ShawCor Ltd. 0 0 0 -5 -2 0 -7 43
SES Secure Energy Services Inc. -5 0 0 0 -3 -1 -9 41
SJR.B Shaw Communications Inc -5 0 -12 0 -3 0 -20 30
SLF Sun Life Financial Inc. 0 0 0 0 -2 0 -2 48
SLW Silver Wheaton Corp. 0 -8 0 0 0 0 -8 42
SMF SEMAFO Inc. -5 0 0 -10 -2 0 -17 33
SNC SNC-Lavalin Group Inc. -8 -4 0 0 0 0 -12 38
SPB Superior Plus Corp. -5 0 0 0 0 -1 -6 44
SSO Silver Standard Resources Inc. 0 0 0 0 -2 -1 -3 47
STN Stantec Inc. 0 0 0 0 0 0 0 50
SU Suncor Energy Inc 0 0 0 0 0 0 0 50
SVM Silvercorp Metals Inc. -10 0 0 -10 -3 -2 -25 25
SVY Savanna Energy Services Corp. 0 0 0 0 -2 0 -2 48
T TELUS Corporation 0 0 0 0 -1 0 -1 49
TA TransAlta Corp. 0 0 0 0 -2 0 -2 48
TCK.B Teck Resources Limited -5 0 -9 0 -1 0 -15 35
TCL.A Transcontinental Inc. -5 0 -12 0 -3 -1 -21 29
TCM Thompson Creek Metals Company Inc. -5 0 0 0 0 -2 -7 43
TCW Trican Well Service Ltd. -5 0 0 0 0 -1 -6 44
TD The Toronto-Dominion Bank 0 0 0 0 0 0 0 50
TDG Trinidad Drilling Ltd. 0 0 0 -10 0 0 -10 40
TET Trilogy Energy Corporation -5 0 0 0 0 -1 -6 44
TFI TransForce Inc -5 0 0 -5 0 -2 -12 38
TGL TransGlobe Energy Corporation 0 0 0 0 -3 -1 -4 46
THI Tim Hortons Inc. -5 -4 0 0 0 -1 -10 40
Joseph L. Rotman School of Management
105 St. George Street, Toronto, Ontario M5S 3E6 25/32Tel: (416) 978-8998
Email: [email protected]
2013 Board Shareholder Confidence Index
Ticker Company CEO/Chair Split
Board Committee
Independence Share Structure
Director
Assessments No Skills Matrix
Continuing
Education and
Orientation
Group
Deductions Score /50Maximum Deduction -10 -12 -12 -10 -3 -3 -50
GROUP POTENTIALInformation on scoring can be found here: BSCI 2013 Methodology
THO Tahoe Resources Inc. 0 0 0 0 -3 0 -3 47
TIH Toromont Industries Ltd. -5 0 0 0 -2 -1 -8 42
TKO Taseko Mines Limited -5 0 0 -10 -3 -3 -21 29
TLM Talisman Energy inc. 0 0 0 0 -3 0 -3 47
TOU Tourmaline Oil Corp. -5 0 0 -10 -3 -2 -20 30
TRI Thomson Reuters Corporation -5 -4 0 -5 -2 0 -16 34
TRP TransCanada Corp. 0 0 0 0 0 0 0 50
TRQ Turquoise Hill Resources Ltd. 0 0 0 0 0 -1 -1 49
TXG Torex Gold Resources Inc. 0 0 0 -10 -2 0 -12 38
VET Vermilion Energy Inc. 0 0 0 0 0 0 0 50
VRX Valeant Pharmaceuticals International, Inc. -5 -4 0 0 0 0 -9 41
VSN Veresen Inc 0 0 0 0 -3 -3 -6 44
WCP Whitecap Resources Inc. -10 -4 0 -10 -3 -2 -29 21
WFT West Fraser Timber Co. Ltd. -5 0 0 0 -3 -2 -10 40
WIN Wi-LAN Inc. 0 0 0 -10 -2 -2 -14 36
WJA WestJet Airlines Ltd. -8 -8 0 -10 0 0 -26 24
WJX Wajax Corporation 0 0 0 0 0 -1 -1 49
WN George Weston Limited -5 0 0 -5 -3 -1 -14 36
WPT Westport Innovations Inc. 0 -4 0 0 -3 -2 -9 41
WTE Westshore Terminals Investment Corporation -10 -12 0 -10 -3 -3 -38 12
X TMX Group Limited 0 0 0 0 0 0 0 50
YRI Yamana Gold Inc -5 0 0 0 -2 0 -7 43
Joseph L. Rotman School of Management
105 St. George Street, Toronto, Ontario M5S 3E6 26/32Tel: (416) 978-8998
Email: [email protected]

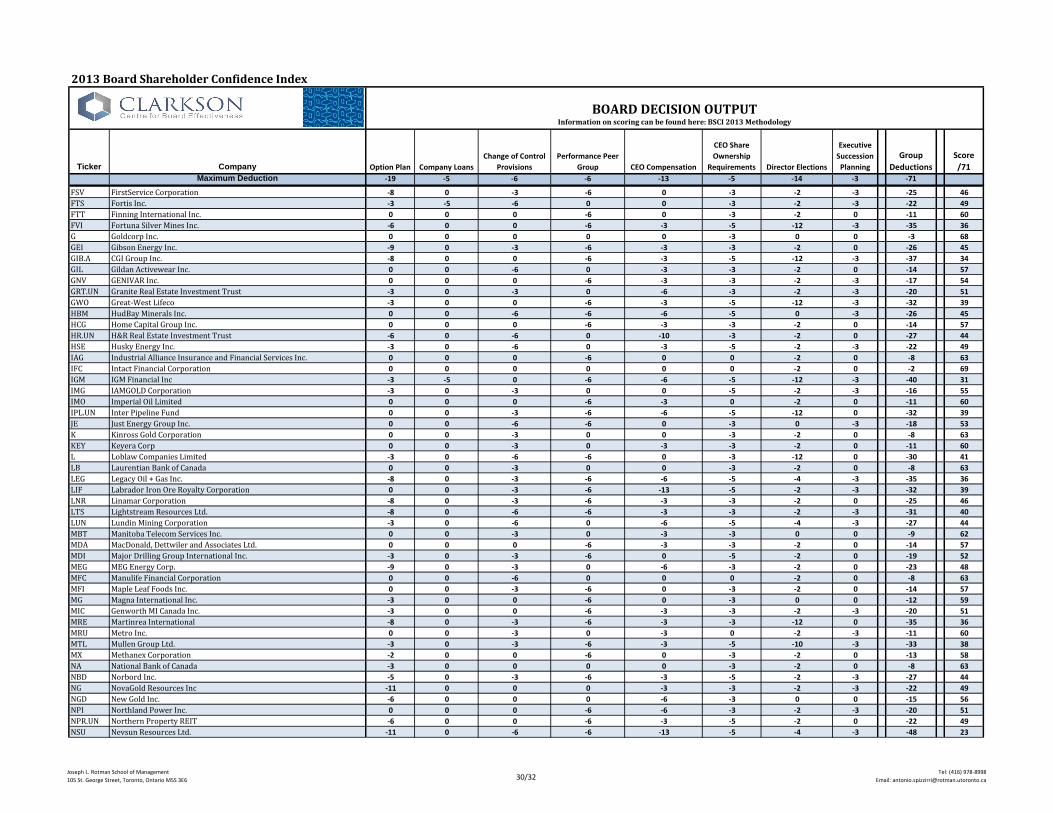
BOARD DECISION OUTPUT
Joseph L. Rotman School of Management
105 St. George Street, Toronto, Ontario M5S 3E6 27/32Tel: (416) 978-8998
Email: [email protected]

2013 Board Shareholder Confidence Index
Ticker Company Option Plan Company Loans
Change of Control
Provisions
Performance Peer
Group CEO Compensation
CEO Share
Ownership
Requirements Director Elections
Executive
Succession
Planning
Group
Deductions
Score
/71Maximum Deduction -19 -5 -6 -6 -13 -5 -14 -3 -71
AAV Advantage Oil and Gas Ltd -11 0 -3 0 -13 -5 -4 -3 -39 32
ABX Barrick Gold Corporation 0 0 0 0 -3 -3 -2 0 -8 63
ACO.X ATCO Ltd. 0 0 -3 -6 -3 -3 -12 0 -27 44
AEM Agnico-Eagle Mines Limited -5 0 -3 0 -3 -3 -2 0 -16 55
AGF.B AGF Management Ltd. -2 0 -3 -6 -3 -3 -14 -3 -34 37
AGI Alamos Gold Inc -6 0 0 -6 -3 -3 -2 0 -20 51
AGU Agrium Inc. 0 0 0 0 0 -3 -2 0 -5 66
AIM Aimia Inc. 0 0 -3 -6 0 -3 -2 0 -14 57
ALA AltaGas Ltd -8 -3 -6 -6 -3 -3 0 0 -29 42
AP.UN Allied Properties REIT -6 -1 -3 -6 0 -3 -2 0 -21 50
AQN Algonquin Power & Utilities Corp. -6 0 0 -6 -3 -5 -2 0 -22 49
AR Argonaut Gold Inc. -9 0 0 -3 -3 -5 -2 0 -22 49
ARE Aecon Group Inc. -3 0 -6 -6 0 -3 -4 0 -22 49
ARX ARC Resources Ltd. -5 0 0 0 -3 -3 0 0 -11 60
ASR Alacer Gold Corp. -3 0 -3 -6 -10 -3 -2 0 -27 44
ATD.B Alimentation Couche-Tard Inc. -3 0 0 -6 0 -3 -12 -3 -27 44
ATH Athabasca Oil Corp. -9 0 -3 -6 -10 -5 -12 -3 -48 23
ATP Atlantic Power Corporation 0 0 0 -3 -3 -3 -4 -3 -16 55
AUQ AuRico Gold Inc. -3 0 -3 0 0 -3 -2 0 -11 60
AX.UN Artis Real Estate Investment Trust -9 -3 -3 -6 -6 -5 -2 -3 -37 34
BA Bell Aliant Inc. 0 0 0 -6 -3 -3 0 0 -12 59
BAM.A Brookfield Asset Management Inc -2 0 0 -6 -3 -3 -2 0 -16 55
BB BlackBerry Limited -3 0 -6 -6 0 -3 0 0 -18 53
BBD.B Bombardier Inc. 0 0 0 -6 -3 -3 -2 0 -14 57
BCB Cott Corporation 0 0 0 -6 0 -3 -2 -3 -14 57
BCE BCE Inc. -3 0 0 -6 0 -3 -2 0 -14 57
BDI Black Diamond Group Limited -14 0 -6 -6 -6 -5 -2 -3 -42 29
BEI.UN Boardwalk Real Estate Investment Trust 0 0 0 0 -7 -3 -2 0 -12 59
BIN Progressive Waste Solutions -3 0 0 -6 0 -3 -2 0 -14 57
BIR Birchcliff Energy Ltd. -14 0 -6 -6 -13 -5 -14 -3 -61 10
BMO Bank of Montreal -3 0 0 0 0 0 -2 0 -5 66
BNE Bonterra Energy Corp. -11 0 -3 -6 -3 -5 -4 -3 -35 36
BNK Bankers Petroleum Ltd. -14 0 -6 -6 -6 -3 -2 -3 -40 31
BNP Bonavista Energy Corporation -8 0 -6 -6 -10 -3 -2 0 -35 36
BNS Bank of Nova Scotia -3 0 0 0 0 0 -2 0 -5 66
BPO Brookfield Office Properties Inc 0 -1 -3 -6 -6 -5 -2 -3 -26 45
BTE Baytex Energy Corporation -3 0 -6 0 -6 -3 -2 -3 -23 48
BTO B2Gold Corp. -6 0 -3 -3 -6 -5 -2 -3 -28 43
CAE CAE Inc. -3 0 -3 0 0 -3 -2 0 -11 60
CAR.UN Canadian Apartment Properties Real Estate Investment Trust 0 -3 -6 -6 -3 -3 -2 0 -23 48
CCA Cogeco Cable Inc. -3 0 0 -6 -3 -3 0 0 -15 56
CCL.B CCL Industries Inc 0 -1 0 -6 -3 -3 -2 0 -15 56
CCO Cameco Corporation 0 0 0 0 0 -3 -2 0 -5 66
CCT Catamaran Corporation 0 0 -6 -6 -3 -3 -12 -3 -33 38
CFP Canfor Corporation -3 0 0 -6 -3 -3 -2 -3 -20 51
CFW Calfrac Well Services Ltd -5 -3 -3 -6 -3 -3 -2 0 -25 46
CG Centerra Gold Inc. -3 0 -6 0 0 -3 -12 -3 -27 44
CGG China Gold International Resources Corp. Ltd. -9 0 0 0 -10 -3 -12 -3 -37 34
CGX Cineplex Inc -3 0 -6 -6 -3 -3 0 0 -21 50
CIX CI Financial Corp -3 -1 -6 -6 -3 -3 -2 -3 -27 44
BOARD DECISION OUTPUTInformation on scoring can be found here: BSCI 2013 Methodology
Joseph L. Rotman School of Management
105 St. George Street, Toronto, Ontario M5S 3E6 28/32Tel: (416) 978-8998
Email: [email protected]

2013 Board Shareholder Confidence Index
Ticker Company Option Plan Company Loans
Change of Control
Provisions
Performance Peer
Group CEO Compensation
CEO Share
Ownership
Requirements Director Elections
Executive
Succession
Planning
Group
Deductions
Score
/71Maximum Deduction -19 -5 -6 -6 -13 -5 -14 -3 -71
BOARD DECISION OUTPUTInformation on scoring can be found here: BSCI 2013 Methodology
CJR.B CORUS Entertainment Inc. -6 -1 -3 -6 -3 -3 -12 0 -34 37
CLC CML HealthCare Inc. 0 0 0 -6 -3 -3 -2 -3 -17 54
CLS Celestica Inc. 0 0 -6 0 0 -3 -2 0 -11 60
CM Canadian Imperial Bank of Commerce 0 0 -6 0 0 0 -2 0 -8 63
CNQ Canadian Natural Resources Limited -8 0 -3 -6 -6 -3 -2 0 -28 43
CNR Canadian National Railway Company -3 0 -3 -6 0 0 -2 0 -14 57
COS Canadian Oil Sands Limited -11 0 0 0 0 -3 0 -3 -17 54
CP Canadian Pacific Railway Ltd. 0 0 0 0 0 -3 -2 0 -5 66
CPG Crescent Point Energy Corp 0 0 0 0 -3 -3 -4 -3 -13 58
CPX Capital Power Corporation 0 0 0 0 0 -3 0 0 -3 68
CR Crew Energy Inc. -11 0 -6 0 -6 -5 -4 -3 -35 36
CRR.UN Crombie Real Estate Investment Trust 0 -3 0 0 0 -5 -4 -3 -15 56
CS Capstone Mining Corp. -9 0 0 0 -6 -5 -2 -3 -25 46
CSH.UN Chartwell Retirement Residences 0 -3 -3 -3 -3 -3 -2 0 -17 54
CSU Constellation Software Inc. 0 0 0 -6 -3 -5 -2 -3 -19 52
CTC.A Canadian Tire Corporation Limited -3 0 0 -6 0 -3 -2 0 -14 57
CU Canadian Utilities Limited 0 0 -3 -6 0 -3 -12 0 -24 47
CUF.UN Cominar Real Estate Investment Trust -3 0 -6 -6 -13 -5 -2 -3 -38 33
CUS Canexus Corporation -3 0 -6 0 -3 -5 -2 0 -19 52
CVE Cenovus Energy Inc. -3 0 -3 0 -3 -3 -2 0 -14 57
CWB Canadian Western Bank -5 -3 -3 -6 0 -3 -2 0 -22 49
CWT.UN Calloway Real Estate Investment Trust 0 0 0 -6 -3 -3 -2 0 -14 57
D.UN Dundee Real Estate Investment Trust 0 0 0 -6 -6 -5 -2 -3 -22 49
DC.A Dundee Corporation -3 0 0 -6 -13 -3 -2 -3 -30 41
DDC Dominion Diamond Corporation -3 0 -6 -6 -3 -3 -2 0 -23 48
DGC Detour Gold Corporation -8 0 -6 -6 -10 -3 -2 0 -35 36
DH Davis + Henderson Corporation -3 0 0 -6 -3 -3 0 0 -15 56
DI.UN Dundee International REIT 0 0 0 -6 -6 -5 -2 -3 -22 49
DII.B Dorel Industries Inc. -3 0 0 -6 -3 -3 -2 -3 -20 51
DML Denison Mines Corp. -6 0 -6 -6 0 -5 -12 -3 -38 33
DOL Dollarama Inc. -6 0 -3 -6 0 -3 -2 0 -20 51
DPM Dundee Precious Metals Inc. -8 0 -6 -6 -10 -5 -2 0 -37 34
ECA Encana Corporation -3 0 0 -6 0 -3 -2 -3 -17 54
EDR Endeavour Silver Corp -14 0 -3 -6 -3 -5 -2 -3 -36 35
EFN Element Financial Corporation -6 0 -3 -6 -3 -5 -2 -3 -28 43
EFX Enerflex Ltd. -3 0 0 -6 -3 -3 -2 0 -17 54
ELD Eldorado Gold Corporation -6 0 0 0 -3 -5 -2 -3 -19 52
EMA Emera Incorporated 0 0 0 0 -3 -3 -2 0 -8 63
EMP.A Empire Company Limited -3 -1 0 -6 -3 0 -2 0 -15 56
ENB Enbridge Inc. -3 0 -3 0 -3 -3 -2 0 -14 57
ENF Enbridge Income Fund Holdings Inc. 0 0 0 0 -10 -3 -2 -3 -18 53
ERF Enerplus Corporation -8 0 0 0 -6 -3 -2 0 -19 52
ESI Ensign Energy Services Inc. -2 0 -3 -6 -13 -3 -2 0 -29 42
EXE Extendicare Inc. 0 0 -3 -6 -3 -5 -2 -3 -22 49
FCR First Capital Realty Inc. 0 -3 -6 -6 -3 0 0 0 -18 53
FFH Fairfax Financial Holdings Limited -6 -1 0 0 -10 -3 -2 -3 -25 46
FM First Quantum Minerals Ltd 0 0 0 0 -10 -5 -2 -3 -20 51
FNV Franco-Nevada Corporation 0 0 -3 0 -3 0 -2 0 -8 63
FR First Majestic Silver Corp -9 0 -3 -6 -6 -5 0 -3 -32 39
FRU Freehold Royalties Limited 0 0 0 -6 -13 -5 -12 -3 -39 32
Joseph L. Rotman School of Management
105 St. George Street, Toronto, Ontario M5S 3E6 29/32Tel: (416) 978-8998
Email: [email protected]
2013 Board Shareholder Confidence Index
Ticker Company Option Plan Company Loans
Change of Control
Provisions
Performance Peer
Group CEO Compensation
CEO Share
Ownership
Requirements Director Elections
Executive
Succession
Planning
Group
Deductions
Score
/71Maximum Deduction -19 -5 -6 -6 -13 -5 -14 -3 -71
BOARD DECISION OUTPUTInformation on scoring can be found here: BSCI 2013 Methodology
FSV FirstService Corporation -8 0 -3 -6 0 -3 -2 -3 -25 46
FTS Fortis Inc. -3 -5 -6 0 0 -3 -2 -3 -22 49
FTT Finning International Inc. 0 0 0 -6 0 -3 -2 0 -11 60
FVI Fortuna Silver Mines Inc. -6 0 0 -6 -3 -5 -12 -3 -35 36
G Goldcorp Inc. 0 0 0 0 0 -3 0 0 -3 68
GEI Gibson Energy Inc. -9 0 -3 -6 -3 -3 -2 0 -26 45
GIB.A CGI Group Inc. -8 0 0 -6 -3 -5 -12 -3 -37 34
GIL Gildan Activewear Inc. 0 0 -6 0 -3 -3 -2 0 -14 57
GNV GENIVAR Inc. 0 0 0 -6 -3 -3 -2 -3 -17 54
GRT.UN Granite Real Estate Investment Trust -3 0 -3 0 -6 -3 -2 -3 -20 51
GWO Great-West Lifeco -3 0 0 -6 -3 -5 -12 -3 -32 39
HBM HudBay Minerals Inc. 0 0 -6 -6 -6 -5 0 -3 -26 45
HCG Home Capital Group Inc. 0 0 0 -6 -3 -3 -2 0 -14 57
HR.UN H&R Real Estate Investment Trust -6 0 -6 0 -10 -3 -2 0 -27 44
HSE Husky Energy Inc. -3 0 -6 0 -3 -5 -2 -3 -22 49
IAG Industrial Alliance Insurance and Financial Services Inc. 0 0 0 -6 0 0 -2 0 -8 63
IFC Intact Financial Corporation 0 0 0 0 0 0 -2 0 -2 69
IGM IGM Financial Inc -3 -5 0 -6 -6 -5 -12 -3 -40 31
IMG IAMGOLD Corporation -3 0 -3 0 0 -5 -2 -3 -16 55
IMO Imperial Oil Limited 0 0 0 -6 -3 0 -2 0 -11 60
IPL.UN Inter Pipeline Fund 0 0 -3 -6 -6 -5 -12 0 -32 39
JE Just Energy Group Inc. 0 0 -6 -6 0 -3 0 -3 -18 53
K Kinross Gold Corporation 0 0 -3 0 0 -3 -2 0 -8 63
KEY Keyera Corp 0 0 -3 0 -3 -3 -2 0 -11 60
L Loblaw Companies Limited -3 0 -6 -6 0 -3 -12 0 -30 41
LB Laurentian Bank of Canada 0 0 -3 0 0 -3 -2 0 -8 63
LEG Legacy Oil + Gas Inc. -8 0 -3 -6 -6 -5 -4 -3 -35 36
LIF Labrador Iron Ore Royalty Corporation 0 0 -3 -6 -13 -5 -2 -3 -32 39
LNR Linamar Corporation -8 0 -3 -6 -3 -3 -2 0 -25 46
LTS Lightstream Resources Ltd. -8 0 -6 -6 -3 -3 -2 -3 -31 40
LUN Lundin Mining Corporation -3 0 -6 0 -6 -5 -4 -3 -27 44
MBT Manitoba Telecom Services Inc. 0 0 -3 0 -3 -3 0 0 -9 62
MDA MacDonald, Dettwiler and Associates Ltd. 0 0 0 -6 -3 -3 -2 0 -14 57
MDI Major Drilling Group International Inc. -3 0 -3 -6 0 -5 -2 0 -19 52
MEG MEG Energy Corp. -9 0 -3 0 -6 -3 -2 0 -23 48
MFC Manulife Financial Corporation 0 0 -6 0 0 0 -2 0 -8 63
MFI Maple Leaf Foods Inc. 0 0 -3 -6 0 -3 -2 0 -14 57
MG Magna International Inc. -3 0 0 -6 0 -3 0 0 -12 59
MIC Genworth MI Canada Inc. -3 0 0 -6 -3 -3 -2 -3 -20 51
MRE Martinrea International -8 0 -3 -6 -3 -3 -12 0 -35 36
MRU Metro Inc. 0 0 -3 0 -3 0 -2 -3 -11 60
MTL Mullen Group Ltd. -3 0 -3 -6 -3 -5 -10 -3 -33 38
MX Methanex Corporation -2 0 0 -6 0 -3 -2 0 -13 58
NA National Bank of Canada -3 0 0 0 0 -3 -2 0 -8 63
NBD Norbord Inc. -5 0 -3 -6 -3 -5 -2 -3 -27 44
NG NovaGold Resources Inc -11 0 0 0 -3 -3 -2 -3 -22 49
NGD New Gold Inc. -6 0 0 0 -6 -3 0 0 -15 56
NPI Northland Power Inc. 0 0 0 -6 -6 -3 -2 -3 -20 51
NPR.UN Northern Property REIT -6 0 0 -6 -3 -5 -2 0 -22 49
NSU Nevsun Resources Ltd. -11 0 -6 -6 -13 -5 -4 -3 -48 23
Joseph L. Rotman School of Management
105 St. George Street, Toronto, Ontario M5S 3E6 30/32Tel: (416) 978-8998
Email: [email protected]

2013 Board Shareholder Confidence Index
Ticker Company Option Plan Company Loans
Change of Control
Provisions
Performance Peer
Group CEO Compensation
CEO Share
Ownership
Requirements Director Elections
Executive
Succession
Planning
Group
Deductions
Score
/71Maximum Deduction -19 -5 -6 -6 -13 -5 -14 -3 -71
BOARD DECISION OUTPUTInformation on scoring can be found here: BSCI 2013 Methodology
NWC North West Company Inc -8 -1 -6 0 0 -3 -2 0 -20 51
OCX ONEX Corporation -8 0 0 -6 -10 -3 -2 -3 -32 39
OGC OceanaGold Corp -6 0 -3 0 -13 -5 -14 -3 -44 27
OSK Osisko Mining Corporation -3 0 -6 -6 -3 -3 0 0 -21 50
OTC Open Text Corporation -3 0 -3 -6 -3 -3 -2 -3 -23 48
PAA Pan American Silver Corporation -6 0 -6 -6 0 -5 -2 -3 -28 43
PD Precision Drilling Corporation -3 0 0 0 -3 -3 -2 0 -11 60
PEY Peyto Exploration & Development Corp. 0 0 0 -6 -3 -5 -4 0 -18 53
PGF Pengrowth Energy Corporation -3 0 -3 0 0 -3 0 0 -9 62
PJC.A Jean Coutu Group (PJC) Inc. 0 0 0 0 -3 -3 -2 -3 -11 60
PKI Parkland Fuel Corporation -6 0 -3 0 0 -5 -2 -3 -19 52
PMG Petrominerales Ltd. -9 0 -6 0 -3 -3 -2 -3 -26 45
POT Potash Corporation of Saskatchewan Inc. 0 0 0 0 0 -3 0 0 -3 68
POU Paramount Resources Ltd -11 0 -3 -6 -10 -3 -2 -3 -38 33
POW Power Corporation of Canada -3 0 -3 -6 -13 -3 -12 -3 -43 28
PPL Pembina Pipeline Corporation 0 0 0 0 -3 -3 -2 0 -8 63
PRE Pacific Rubiales Energy Corp. -11 0 0 -6 -6 -3 -12 0 -38 33
PSI Pason Systems Inc. -5 0 -6 -6 -3 -3 -2 -3 -28 43
PVG Pretium Resources Inc. -14 0 0 -6 -3 -5 -2 -3 -33 38
PWF Power Financial Corporation -3 0 0 -6 -10 -5 -12 -3 -39 32
PWT Penn West Petroleum Ltd. -13 0 -6 -3 -3 -3 -2 -3 -33 38
PXX BlackPearl Resources Inc. -11 0 -6 -6 -13 -5 -2 -3 -46 25
QBR.B Quebecor Inc. -3 0 0 -6 -3 -3 -12 0 -27 44
RBA Ritchie Bros. Auctioneers Incorporated -3 0 0 -6 -3 -5 -2 -3 -22 49
RCI.B Rogers Communications Inc. -3 0 -6 -6 0 -3 0 0 -18 53
REF.UN Canadian Real Estate Investment Trust 0 0 -3 0 0 0 0 -3 -6 65
REI.UN Riocan Real Estate Invesment Trust 0 0 -3 -6 0 -3 -2 0 -14 57
RET.A Reitmans (Canada) Limited -9 -5 0 -6 -3 -3 -2 -3 -31 40
RIO Rio Alto Mining Limited -9 0 -3 -6 -3 -5 -4 -3 -33 38
RMX Rubicon Minerals Corporation -9 0 -6 -6 -13 -5 -2 -3 -44 27
RON RONA Inc. 0 0 -3 0 0 -3 -2 0 -8 63
RUS Russel Metals Inc -5 0 -6 -6 0 -3 -2 -3 -25 46
RY Royal Bank of Canada -3 0 0 0 0 0 -2 0 -5 66
S Sherritt International Corporation 0 0 -6 0 -6 -3 0 -3 -18 53
SAP Saputo Inc. -5 0 0 -6 -3 -3 -2 -3 -22 49
SC Shoppers Drug Mart Corporation 0 -5 0 0 0 0 0 0 -5 66
SCL ShawCor Ltd. -3 0 0 -6 -6 -3 -2 0 -20 51
SES Secure Energy Services Inc. -8 0 -6 0 -6 -3 -2 -3 -28 43
SJR.B Shaw Communications Inc -6 0 0 -6 -3 -3 -2 0 -20 51
SLF Sun Life Financial Inc. 0 0 0 0 0 0 0 0 0 71
SLW Silver Wheaton Corp. 0 0 -3 0 -3 -3 -2 0 -11 60
SMF SEMAFO Inc. -3 0 0 -6 -3 -5 -2 -3 -22 49
SNC SNC-Lavalin Group Inc. 0 0 0 -6 0 0 -2 0 -8 63
SPB Superior Plus Corp. 0 0 0 -6 -3 -3 -2 -3 -17 54
SSO Silver Standard Resources Inc. -6 0 -3 0 -3 -5 -2 -3 -22 49
STN Stantec Inc. 0 0 0 -6 0 -3 0 0 -9 62
SU Suncor Energy Inc 0 0 0 0 0 0 0 0 0 71
SVM Silvercorp Metals Inc. -9 0 0 -6 -6 -5 -2 -3 -31 40
SVY Savanna Energy Services Corp. -5 0 -6 -6 -3 -3 -4 0 -27 44
T TELUS Corporation -3 0 0 -6 0 0 0 0 -9 62
Joseph L. Rotman School of Management
105 St. George Street, Toronto, Ontario M5S 3E6 31/32Tel: (416) 978-8998
Email: [email protected]

2013 Board Shareholder Confidence Index
Ticker Company Option Plan Company Loans
Change of Control
Provisions
Performance Peer
Group CEO Compensation
CEO Share
Ownership
Requirements Director Elections
Executive
Succession
Planning
Group
Deductions
Score
/71Maximum Deduction -19 -5 -6 -6 -13 -5 -14 -3 -71
BOARD DECISION OUTPUTInformation on scoring can be found here: BSCI 2013 Methodology
TA TransAlta Corp. 0 0 0 0 0 0 0 0 0 71
TCK.B Teck Resources Limited -3 0 0 -6 0 -3 -2 -3 -17 54
TCL.A Transcontinental Inc. -3 0 0 -6 -3 -3 -2 -3 -20 51
TCM Thompson Creek Metals Company Inc. -3 0 -6 0 -3 -3 -2 -3 -20 51
TCW Trican Well Service Ltd. -8 0 -6 -3 -3 -5 -2 -3 -30 41
TD The Toronto-Dominion Bank -3 0 0 0 0 0 -2 0 -5 66
TDG Trinidad Drilling Ltd. -3 0 -3 0 -3 -3 -2 0 -14 57
TET Trilogy Energy Corporation -11 0 -3 -6 -13 -3 -12 -3 -51 20
TFI TransForce Inc 0 0 0 -6 -3 -3 -4 -3 -19 52
TGL TransGlobe Energy Corporation -14 0 -6 0 -3 -5 -14 -3 -45 26
THI Tim Hortons Inc. -3 0 0 -6 0 -3 -2 0 -14 57
THO Tahoe Resources Inc. -6 0 0 -6 -10 -5 -2 0 -29 42
TIH Toromont Industries Ltd. -5 0 0 -6 -3 -3 -2 0 -19 52
TKO Taseko Mines Limited -11 0 -6 -6 -6 -5 0 -3 -37 34
TLM Talisman Energy inc. -2 0 0 -6 -3 0 0 0 -11 60
TOU Tourmaline Oil Corp. -14 0 -3 -6 -13 -5 -4 -3 -48 23
TRI Thomson Reuters Corporation 0 0 -3 -6 0 -3 -2 0 -14 57
TRP TransCanada Corp. 0 0 -3 0 0 -3 -2 0 -8 63
TRQ Turquoise Hill Resources Ltd. -9 0 0 0 -6 -3 -2 -3 -23 48
TXG Torex Gold Resources Inc. -6 0 -3 -6 -10 -3 -2 -3 -33 38
VET Vermilion Energy Inc. 0 0 -3 0 -3 0 -2 0 -8 63
VRX Valeant Pharmaceuticals International, Inc. 0 0 0 -6 -3 -3 -2 0 -14 57
VSN Veresen Inc 0 0 0 0 -3 -3 -2 -3 -11 60
WCP Whitecap Resources Inc. -9 -5 -6 -6 -6 -5 -4 -3 -44 27
WFT West Fraser Timber Co. Ltd. 0 0 0 0 -3 -5 -2 0 -10 61
WIN Wi-LAN Inc. -11 0 -3 -6 -3 -3 0 -3 -29 42
WJA WestJet Airlines Ltd. 0 0 0 0 0 -3 0 0 -3 68
WJX Wajax Corporation 0 0 -3 -6 0 -3 -2 -3 -17 54
WN George Weston Limited -3 0 -6 -6 -10 -3 -12 0 -40 31
WPT Westport Innovations Inc. -3 0 -6 0 -3 -5 -4 -3 -24 47
WTE Westshore Terminals Investment Corporation 0 0 0 0 -10 -5 -12 -3 -30 41
X TMX Group Limited 0 0 0 -6 -3 -3 -2 -3 -17 54
YRI Yamana Gold Inc -3 0 -6 0 -3 -3 -2 0 -17 54
Joseph L. Rotman School of Management
105 St. George Street, Toronto, Ontario M5S 3E6 32/32Tel: (416) 978-8998
Email: [email protected]