board of trustees agenda - utah.gov · above, within the meanings accorded by utah law. in...
TRANSCRIPT

Board of Trustees Agenda
Tuesday, March 24, 2020
1. Call Meeting to Order (Start time 12:00 pm)
2. Administrative a. Approval of Minutes – January 28, 2020
Attached, Exhibit (A) page 2 - 3 b. Fund Cash Flows
Attached, Exhibit (B) pages 4-9 c. Board Meeting Schedule FY21
Attached, Exhibit (C) page 10 d. Confidentiality Review
Attached, Exhibit (D) pages 11-14 e. Securities Brokerage
Attached, Exhibit (E) pages 15-16 f. Protection & Advocacy Office Update
3. Investment Review
a. January 2020 Monthly Flash Report Attached, Exhibit (F) pages 17-18
4. Investment Consultant Presentations
a. RVK b. Albourne
5. Research Update
a. Income i. The Transport Fund
Attached, Exhibit (G) pages 19-21 b. Real Assets
i. Global Upstream Natural Resource ETF Attached, Exhibit (H) pages 22-58
6. Adjourn
One or more members of the Board may participate via electronic conference originated by the Chair, and the meeting may be an electronic meeting, and the anchor location shall be as set forth above, within the meanings accorded by Utah law. In compliance with the Americans with Disabilities Act, individuals requiring special accommodations during the meeting may notify SITFO in advance 801-355-3070 or [email protected].

Board of Trustees Minutes Tuesday, January 28, 2020
Board Members Attending: Jason Gull, David Damschen, Kent Misener, David Nixon, and John Lunt (phone in)
Others Attending: Johnny Lodder, SITFO; Peter Madsen, SITFO; Ryan Kulig, SITFO; Michael Aluise, FEG; Nolan Bean, FEG; Justin Atwater, LTPAO; AliEmme Binns, SITFO; Chris Ogren, SITFO; Anna Davenport, SITFO; Brittany Griffin, USTO; Kirt Slaugh, USTO; Allen Rollo, USTO; & Paula Plant, School Children’s Trust
1. Call Meeting to Order – Chair Damschen called the meeting to order.
2. Administrativea. Approval of Minutes – December 10, 2019
The Board reviewed minutes from the Board Meeting on December 10th, 2019. Mr.Misener made the motion to approve the minutes, Mr. Nixon seconded, and themotion passed unanimously.
Record of vote:
Mr. Damschen: YesMr. Gull: YesMr. Misener: YesMr. Lunt: YesMr. Nixon: Yes
b. Fund Cash Flows – Mr. Kulig reviewed fund cash flow documents and highlightedspecific sources of incoming and outgoing cash flows since the December BoardMeeting. He noted some draw downs in December for capital calls.
c. Quarterly Budget Review – Mr. Kulig reviewed the quarterly budget and noted thatSITFO is expected to remain under budget for the fiscal year.
d. Organizational Review Update – Mr. Ogren updated the Board on the classification &compensation study process. Interviews with consultants had been conducted andMr. Ogren noted he hoped to have a decision with the Board subcommitteeformalized by early February.
e. Protection & Advocacy Office Update – Mr. Atwater walked the Board throughLTPAO’s annual report. He highlighted how the document should be read and
Exhibit A
2
explained that individual beneficiaries have customized pages specifically geared towards their organizations.
3. Investment Reviewa. December 2019 Monthly Flash Report & Q3 2019 Quarterly Report – Mr. Aluise & Mr.
Bean addressed fund performance and contextualized the returns against thebroader market.
4. Research Updatea. Income
i. Ares Pathfinder – Mr. Lodder provided an overview of Ares Pathfinder fund, anew allocation in private debt.
b. Growthi. Biotech Educational Review – Mr. Bean introduced the Board to the biotech
space and explained the market dynamics. He noted that biotech issomething that funds with a long investment horizon could considerincluding in their portfolio.
5. Character and Competence of Staff (Closed Session) –Mr. Gull made the motion to close thesession to discuss the character and competence of staff, Mr. Nixon seconded the motion,and it passed unanimously. No Board action was taken during the meeting. The meeting wasthen reopened.
Record of vote:
Mr. Damschen: YesMr. Gull: YesMr. Misener: YesMr. Lunt: YesMr. Nixon: Yes
6. Adjourn – Mr. Misener made a motion to adjourn the meeting, Mr. Nixon seconded, and themotion passed unanimously.
Record of vote:
Mr. Damschen: YesMr. Gull: YesMr. Misener: YesMr. Lunt: YesMr. Nixon: Yes
3

Cash Inflows Category Asset Class February March April May June July
Cash Accounts
Beginning Cash Balance 11,065,090$ 3,132,763$ 23,682,980$ 29,432,980$ 38,282,980$ 19,132,980$
SITLA Contributions 5,000,524$ 2,940,554$ 5,700,000$ 8,800,000$ 4,800,000$ 8,800,000$
Securities Lending Income 50,357$ 38,718$ 50,000$ 50,000$ 50,000$ 50,000$
Additional Income 166,970$ 1,429,263$
Redemptions
Parametric International Growth International Developed Equity 5,000,000$
Parametric US VMP Small Cap Growth US Small Cap 5,000,000$ Parametric US VMP Large Cap Growth US Large Cap 5,000,000$ Parametric Emerging Markets Growth US Small Cap 5,000,000$ Vanguard ST Inflation-Protected Sec. Real Assets TIPS 10,000,000$ Loomis Full Spectrum SMA Income Credit 5,000,000$ Putnam Mortgage Opportunity Income Securitized 5,000,000$ PIMCO EM Local Income Non-US 5,000,000$ Man FRM Defensive Systematic Convexity 10,000,000$ Ryan Labs DRP Defensive Long US Treasury 5,000,000$
Total Cash and Redemptions 16,282,941$ 67,541,299$ 29,432,980$ 38,282,980$ 43,132,980$ 27,982,980$
Cash Outflows Category Asset Class February March April May June July
Distributions
Quarterly Distribution & Expense Draw (24,000,000)$ (24,000,000.00)$
SubscriptionsFlexShares Global Natural Resources Real Assets Public Real Assets (7,499,988)$ (2,501,016)$
Total Dists. and Subs. (7,499,988)$ (26,501,016)$ -$ -$ (24,000,000)$ -$
Capital Activity Category Asset Class February March April May June July
Growth Private Equity (1,862,448)$ (6,367,828)$ -$ -$ -$ -$
Real Assets Private Real Estate (4,078,574)$ (3,803,117)$ -$ -$ -$ 2,174,749$
Real Assets Private Real Assets (5,543,944)$ (7,110,923)$ -$ -$ -$ -$
Income ILS 5,834,776$ 256,422$ -$ -$ -$ -$ Income Private Debt -$ (331,857)$ -$ -$ -$ -$
Net Capital Activity (5,650,190)$ (17,357,302)$ -$ -$ -$ 2,174,749$
End NET Cash Balance 3,132,763$ 23,682,980$ 29,432,980$ 38,282,980$ 19,132,980$ 30,157,729$
Cash Balance as % of AA 0.12% 0.92% 1.15% 1.49% 0.75% 1.17%
SITFO Pro-Forma Cash Flows as of 02/29/2020
Exhibit B
4

Pro-Forma Called & Distributed Capital
Fund Category Asset Class Sub-Asset Class Geography Commitment % Called Distributed Capital Market ValuePrivate Equity
Douglas Bay Capital Fund III Growth Private Equity Buyout Non-U.S. Developed 20,000,000$ 57% 506,513$ 10,618,649$ Gladius Venator Growth Private Equity Opportunistic Global 35,000,000$ 97% -$ 32,047,780$ Hollyport Secondary Opportunities VII Growth Private Equity Secondaries U.S. 15,000,000$ 15% -$ 3,801,540$ Huron Fund V Growth Private Equity Buyout U.S. 22,000,000$ 26% -$ 6,541,527$ Kickstart Seed IV Growth Private Equity VC (Seed / Early Stage) U.S. 15,000,000$ 67% -$ 11,767,997$ Summit Growth Equity IX Growth Private Equity Growth Equity U.S. 22,000,000$ 86% 4,917,559$ 21,415,513$ TR Capital IV Growth Private Equity Secondaries Asia 20,000,000$ 24% -$ 4,780,951$ Unicorn Capital Partners Fund II Growth Private Equity Venture (Fund-of-Funds) Emerging 15,000,000$ 53% -$ 8,328,527$ Unicorn Capital Partners Fund III Growth Private Equity Venture (Fund-of-Funds) Emerging 15,000,000$ 6% -$ 745,621$ Varsity Healthcare Partners II Growth Private Equity Buyout (Healthcare) U.S. 15,000,000$ 81% 573,586$ 13,294,575$ Varsity Healthcare Partners III Growth Private Equity Buyout (Healthcare) U.S. 15,000,000$ 13% -$ 1,792,558$ WCP NewCold Growth Private Equity Opportunistic Global 15,000,000$ 89% 3,727,256$ 18,723,288$
Total Private Equity Growth Private Equity 224,000,000$ 55% 9,724,914$ 133,858,526$ Private Real Estate
Colony Realty Partners III Real Assets Private Real Estate Value-Added Real Estate U.S. 15,000,000$ 100% 23,314,402$ 1,690,338$ Colony Realty Partners IV Real Assets Private Real Estate Value-Added Real Estate U.S. 45,000,000$ 100% 63,475,282$ 484,411$ Edge Principal IV Real Assets Private Real Estate Opportunistic U.S. 15,000,000$ 28% -$ 3,172,058$ Fundamental Partners III Real Assets Private Real Estate Distressed Real Estate / Infrastructure U.S. 25,000,000$ 82% 6,859,207$ 19,712,061$ LaSalle Asia Opportunity V Real Assets Private Real Estate Opportunistic Real Estate Non-U.S. Developed / Emerging 25,000,000$ 35% 1,355,217$ 9,025,357$ LaSalle Income & Growth Fund VI Real Assets Private Real Estate Value-Added Real Estate U.S. 35,000,000$ 95% 37,987,134$ 11,800,626$ LaSalle Income & Growth Fund VIII Real Assets Private Real Estate Value-Added Real Estate U.S. 15,000,000$ 15% -$ 1,995,185$ Long Wharf Real Estate Partners IV Real Assets Private Real Estate Value-Added Real Estate U.S. 45,000,000$ 100% 60,828,566$ 6,889,877$ Long Wharf Real Estate Partners V Real Assets Private Real Estate Value-Added Real Estate U.S. 25,000,000$ 100% 9,881,672$ 21,111,139$ Long Wharf Real Estate Partners VI Real Assets Private Real Estate Value-Added Real Estate U.S. 20,000,000$ 13% 315,207$ 1,540,376$ Palatine Real Estate Fund III Real Assets Private Real Estate Opportunistic Real Estate U.S. 25,000,000$ 11% -$ 2,686,159$ Varde Eur. RE Real Assets Private Real Estate Opportunistic Real Estate Non-U.S. Developed 35,000,000$ 96% 7,341,480$ 20,573,150$
Total Private Real Estate Real Assets Private Real Estate 325,000,000$ 73% 211,358,167$ 100,680,737$ Private Real Assets
Cordillera Investment Fund I Real Assets Private Real Assets Diversified / Opportunistic U.S. 29,000,000$ 88% 4,107,167$ 21,720,949$ Cordillera Investment Fund II Real Assets Private Real Assets Diversified / Opportunistic U.S. 20,000,000$ 11% -$ 1,706,614$ EQT Infrastructure IV Real Assets Private Real Assets Infrastructure Global 40,000,000$ 35% -$ 12,711,598$ Red Reef Farmland Opportunities I Real Assets Private Real Assets Farmland U.S. 25,000,000$ 29.8% -$ 6,486,402$ Rockland Power Partners III Real Assets Private Real Assets Infrastructure / Power Generation U.S. 25,000,000$ 29% 12,109,911$ 6,580,209$
Total Private Real Assets Real Assets Private Real Assets 139,000,000$ 41% 16,217,078$ 49,205,772$ Insurance Linked Securities
Credit Suisse ILS Income ILS Run-off Global 50,000,000$ 32% 2,632,116$ 8,559,947$ Hampden Cayman ILS Fund Income ILS Insurance/Reinsurance Global 45,000,000$ 29% -$ 12,756,368$ Hudson ILS Fund Income ILS Diversified Global 40,000,000$ 93% 2,426,087$ 44,011,612$ Hudson Alt Cat I Income ILS Diversified Global 15,000,000$ 100% 5,834,776$ 7,975,913$ Hudson Alt Cat II Income ILS Diversified Global 15,000,000$ 100% -$ 15,004,050$ Securis Event Fund Income ILS Natural Catastrophe Global 25,000,000$ 100% 17,733,992$ 3,548,769$
Total Insurance Linked Securities Income ILS 190,000,000$ 64% 28,626,971$ 91,856,659$ Private Debt
Ares ICOF III Income Private Debt Private Securitized U.S / Non-U.S. Developed 25,000,000$ 87% 2,954,214$ 23,254,702$ BPC Opportunities III Income Private Debt Opportunistic / Special Situations U.S. 25,000,000$ 100% -$ 29,019,081$ BPC Tactical Income Private Debt Opportunistic / Special Situations U.S. 25,000,000$ 8% -$ 2,075,423$ Clearwater Capital Partners Fund V Income Private Debt Opportunistic / Special Situations Non-U.S. Developed / Emerging 25,000,000$ 100% 35,609$ 27,063,514$ Crestline Credit Opp III Income Private Debt Opportunistic / Special Situations U.S / Non-U.S. Developed 35,000,000$ 63% 3,482,036$ 24,042,199$ Crestline Credit Opp III Europe Income Private Debt Opportunistic / Special Situations U.S / Non-U.S. Developed 10,000,000$ 7% -$ 1,282,252$ Crestline Credit Opp IV Income Private Debt Opportunistic / Special Situations U.S / Non-U.S. Developed 20,000,000$ 51% 5,772,650$ 4,429,712$ SVP Special Situations Fund IV Income Private Debt Opportunistic / Special Situations U.S / Non-U.S. Developed 25,000,000$ 29% -$ 7,807,176$
Total Private Debt Income Private Debt 190,000,000$ 60% 12,244,509$ 118,974,059$
SITFO Private Investments as of 02/29/2020
5

As of Pro-Forma
2/29/2020 March-June
SITFO Curent Allocation vs. Target Min Target Max Market Value Weight (%) Market Value Weight (%)
Growth 25 37 50 1,017,834,178$ 39.7 1,004,202,006$ 39.4
US Equity 9 15 21 374,501,546$ 14.6 364,501,546$ 14.3
US Large Cap 4.5 7.5 10.5 232,985,506$ 9.1 227,985,506$ 8.9
Parametric US VMP Large Cap 232,985,506$ 9.1 227,985,506$ 8.9
US Small Cap 4.5 7.5 10.5 141,516,040$ 5.5 136,516,040$ 5.4
BMO US Micro Cap 44,329,260$ 1.7 44,329,260$ 1.7
Parametric US VMP Small Cap 97,186,780$ 3.8 92,186,780$ 3.6
International Equity 9 15 21 509,474,106$ 19.8 499,474,106$ 19.6
International Developed Equity 4.5 7.5 10.5 245,155,741$ 9.6 240,155,741$ 9.4
Parametric International 245,155,741$ 9.6 240,155,741$ 9.4
Emerging Markets Equity 4.5 7.5 10.5 264,318,365$ 10.3 259,318,365$ 10.2
Parametric Emerging Markets 162,672,499$ 6.3 157,672,499$ 6.2
SR Global Fund 53,762,217$ 2.1 53,762,217$ 2.1
Taiyo India 47,883,649$ 1.9 47,883,649$ 1.9
Private Equity 4.0 7.0 10.0 133,858,526$ 5.2 140,226,354$ 5.5
Douglas Bay Capital Fund III 10,618,649$ 0.4 10,618,649$ 0.4
Gladius Venator 32,047,780$ 1.2 32,160,125$ 1.3
Hollyport Secondary Opportunities VII 3,801,540$ 0.1 4,551,540$ 0.2
Huron Fund V 6,541,527$ 0.3 8,973,510$ 0.4
Kickstart Seed IV 11,767,997$ 0.5 11,767,997$ 0.5
Kickstart Seed V -$ 0.0 910,000$ 0.0
Summit Growth Equity IX 21,415,513$ 0.8 22,416,513$ 0.9
Summit Growth Equity X -$ 0.0 487,500$ 0.0
Unicorn Capital Partners Fund II 8,328,527$ 0.3 8,553,527$ 0.3
Unicorn Capital Partners Fund III 745,621$ 0.0 745,621$ 0.0
TR Capital IV 4,780,951$ 0.2 4,780,951$ 0.2
Varsity Healthcare Partners II 13,294,575$ 0.5 13,294,575$ 0.5
Varsity Healthcare Partners III 1,792,558$ 0.1 1,792,558$ 0.1
WCP NewCold 18,723,288$ 0.7 19,173,288$ 0.8
Total Fund 2,566,948,999$ 2,551,657,535$ 6

As of Pro-Forma
2/29/2020 March-June
SITFO Curent Allocation vs. Target Min Target Max Market Value Weight (%) Market Value Weight (%)
Real Assets 15 20 25 460,633,256$ 17.9 461,873,563$ 17.7
TIPS 0 3 6 73,723,838$ 2.9 63,723,838$ 2.5
Vanguard ST Inflation-Protected Sec. 73,723,838$ 2.9 63,723,838$ 2.5
Public Real Assets 1 4 7 137,015,067$ 5.3 139,516,083$ 5.1
Salient MLP SMA 130,048,637$ 5.1 130,048,637$ 5.1
FlexShares Global Natural Resources 6,966,430$ 0.3 9,467,446$ 0.4
Private Real Estate 6 9 12 200,688,579$ 7.8 202,316,947$ 7.9
Colony Realty Partners III 1,690,338$ 0.1 -$ 0.0
Colony Realty Partners IV 484,411$ 0.0 -$ 0.0
Edge Principal IV 3,172,058$ 0.1 3,650,793$ 0.1
Fundamental Partners III 19,712,061$ 0.8 22,229,684$ 0.9
LaSalle Asia Opportunity V 9,025,357$ 0.4 12,375,029$ 0.5
LaSalle Income & Growth Fund VI 11,800,626$ 0.5 11,800,626$ 0.5
LaSalle Income & Growth Fund VIII 1,995,185$ 0.1 1,995,185$ 0.1
Long Wharf Real Estate Partners IV 6,889,877$ 0.3 6,889,877$ 0.3
Long Wharf Real Estate Partners V 21,111,139$ 0.8 18,283,537$ 0.7
Long Wharf Real Estate Partners VI 1,540,376$ 0.1 1,825,065$ 0.1
UBS Trumbull Property Income Fund 100,007,842$ 3.9 100,007,842$ 3.9
Varde Eur. RE 20,573,150$ 0.8 20,573,150$ 0.8
Palatine Real Estate Fund III 2,686,159$ 0.1 2,686,159$ 0.1
Private Real Assets 1 4 7 49,205,772$ 1.9 56,316,694$ 2.2
Cordillera Investment Fund I 21,720,949$ 0.8 22,217,329$ 0.9
Cordillera Investment Fund II 1,706,614$ 0.1 4,564,909$ 0.2
Red Reef Farmland Opportunities I 6,486,402$ 0.3 6,486,402$ 0.3
Rockland Power Partners III 6,580,209$ 0.3 6,104,438$ 0.2
EQT Infrastructure IV 12,711,598$ 0.5 16,943,616$ 0.7
Total Fund 2,566,948,999$ 2,551,657,535$
7

As of Pro-Forma
2/29/2020 March-June
SITFO Curent Allocation vs. Target Min Target Max Market Value Weight (%) Market Value Weight (%)
Income 20 31 40 813,437,697$ 31.7 798,513,132$ 31.3
Credit 4 7 10 174,580,329$ 6.8 169,580,329$ 6.6
Loomis Full Spectrum SMA 76,720,603$ 3.0 71,720,603$ 2.8
Bramshill Tactical Fixed Income Fund 82,780,999$ 3.2 82,780,999$ 3.2
DW Value Fund 15,078,727$ 0.6 15,078,727$ 0.6
Securitized 5 8 11 285,023,559$ 11.1 280,023,559$ 11.0
Putnam Mortgage Opportunity 23,795,065$ 0.9 18,795,065$ 0.7
37 Capital Securitized Long/Short Fund 106,567,000$ 4.2 106,567,000$ 4.2
Waterfall Eden 67,042,721$ 2.6 67,042,721$ 2.6
East Lodge Structured Opportunities Fund 54,066,781$ 2.1 54,066,781$ 2.1
LibreMax Value Fund 33,551,991$ 1.3 33,551,991$ 1.3
Insurance Linked Securities 0 4 6 91,856,659$ 3.6 91,600,237$ 3.6
Securis Event Fund 3,548,769$ 0.1 3,292,347$ 0.1
Credit Suisse ILS 8,559,947$ 0.3 8,559,947$ 0.3
Hampden Cayman ILS Fund 12,756,368$ 0.5 12,756,368$ 0.5
Hudson ILS Fund 44,011,612$ 1.7 44,011,612$ 1.7
Hudson Alt Cat I 7,975,913$ 0.3 7,975,913$ 0.3
Hudson Alt Cat II 15,004,050$ 0.6 15,004,050$ 0.6
Non-US 2 5 8 143,003,091$ 5.6 138,003,091$ 5.4
PIMCO EM Local 84,904,982$ 3.3 79,904,982$ 3.1
Franklin Templeton Global Macro 58,098,109$ 2.3 58,098,109$ 2.3
Private Debt 4 7 10 118,974,059$ 4.6 119,305,916$ 4.7
Ares ICOF III 23,254,702$ 0.9 23,254,702$ 0.9
BPC Opportunities III 29,019,081$ 1.1 29,019,081$ 1.1
BPC Tactical 2,075,423$ 0.1 2,075,423$ 0.1
Clearwater Capital Partners Fund V 27,063,514$ 1.1 27,063,514$ 1.1
Crestline Credit Opp III 24,042,199$ 0.9 24,042,199$ 0.9
Crestline Credit Opp III Europe 1,282,252$ 0.0 1,614,109$ 0.1
Crestline Credit Opp IV 4,429,712$ 0.2 4,429,712$ 0.2
SVP Special Situations Fund IV 7,807,176$ 0.3 7,807,176$ 0.3
Total Fund 2,566,948,999$ 2,551,657,535$ 8

As of Pro-Forma
2/29/2020 March-June
SITFO Curent Allocation vs. Target Min Target Max Market Value Weight (%) Market Value Weight (%)
Defensive 10 12 20 275,043,869$ 10.7 287,068,834$ 11.3
Long US Treasury 3 5 15 85,063,440$ 3.3 80,063,440$ 3.1
Ryan Labs DRP 85,063,440$ 3.3 80,063,440$ 3.1
Systematic Convexity 3 7 15 186,847,665$ 7.3 176,847,665$ 6.9
Man FRM 186,847,665$ 7.3 176,847,665$ 6.9
Cash 0 0 5 3,132,763$ 0.1 30,157,729$ 1.2
Total Fund 2,566,948,999$ 2,551,657,535$
9

Fiscal Year 2021 Board Meeting Schedule Board meetings will be held on the fourth Tuesday of every month. The dates listed below are
placeholders and meeting dates may be changed or cancelled per discussion and consideration by the Board.
Tuesday, July 28, 2020 at 12PM
Tuesday, September 22, 2020 at 12PM
Tuesday, December 1st or 8th, 2020 at 12PM
Tuesday, January 26, 2021 at 12PM
Tuesday, February 23, 2021 at 12PM
Tuesday, March 23, 2021 at 12PM
Tuesday, April 27, 2021 at 12PM
Tuesday, May 25, 2021 at 12PM
Tuesday, June 22, 2021 at 12PM
Exhibit C
10

MEMORANDUM OF UNDERSTANDING
THIS MEMORANDUM OF UNDERSTANDING (this “Memorandum”), is made and
entered into effective as of January ___, 2020, by and between The State of Utah Land Trusts
Protection and Advocacy Office (the “Protection & Advocacy Office”) and the Utah School and
Institutional Trust Funds Office (“SITFO”). The Protection & Advocacy Office and SITFO are
sometimes collectively referred to herein as the “parties”, and individually as a “party”.
RECITALS
A. WHEREAS, pursuant to Utah Code Annotated Title 53D, School and Institutional
Trust Fund Management Act; SITFO is directed and entrusted with the management of school
and institutional trust fund, as defined in Utah Code Annotated Section 53D-1-102; and
B. WHEREAS, pursuant to Utah Code Annotated Section 53D-1-202 SITFO shall
provide the Protection & Advocacy Office access to all office records and personnel in
accordance with state and federal law and as necessary for the Protection & Advocacy Office
Director to fulfill their responsibilities to ensure full compliance with applicable law and
policies; and
C. WHEREAS, the Parties desire to clarify certain rights and responsibilities of
SITFO and the Protection & Advocacy Office relative to the above and enter into the agreements
set forth herein.
NOW, THEREFORE, the Parties agree as follows:
1. General; Non-waiver. Notwithstanding anything set forth in this Memorandum to
the contrary, SITFO and the Protection & Advocacy Office acknowledge and agree this
Memorandum does not limit, modify, replace or otherwise waive any statutory or contractual
rights and/or obligations of either SITFO or the Protection and Advocacy Office. Any conflicts
between this Memorandum and any contracts or statutory provision shall be resolved in favor of
the contract or statute(s).
2. Meetings of SITFO. Section 53D-2-203(4) provides the Director of the Protection
&Advocacy Office, in accordance with state and federal law, has the right to attend any
presentation, discussion, meeting or other gathering related to the school and institutional trust.
In furtherance of the foregoing, SITFO and the Protection & Advocacy Office agree as follows:
(a) Public Meetings. For all public meetings of the SITFO Board of Trustees
and/or any other presentation by SITFO staff at a public forum, SITFO and the Protection &
Advocacy Office agree as follows:
(i) SITFO shall provide e-mail notice to the Protection & Advocacy
Office as soon as practicable and in no event later than notice is provided to the SITFO Board of
Trustees to such meeting. At the same time provided to the SITFO Board of Trustees, SITFO
shall provide the Protection & Advocacy Office an identification of the matters to be discussed at
such meeting and copies of materials to be presented. If additional materials not subject to
contractual confidentiality provisions become available prior to such meeting SITFO will e-mail
Formatted: Not Highlight
Formatted: Not Highlight
Commented [BM1]:
Deleted: in
Exhibit D
11

the materials to the Protection & Advocacy Office at the same time such additional materials are
provided to the SITFO Board of Trustees.
(ii) For public meetings of the SITFO Board of Trustees, SITFO, at the
discretion of the presiding member pursuant to Section 52-4-202(6)(b), shall provide the
Protection & Advocacy Office reasonable opportunity to address the SITFO Board of Trustees
on all matters before the Board and any additional information relevant to the school and
institutional trust system. The Protection & Advocacy Office shall provide notice to SITFO as to
the content and duration of any comments to be presented by the Protection & Advocacy Office
at any public meeting. Notice and related materials are to be provided to SITFO for distribution 8
days in advance of the scheduled public meeting.
(b) Non-Public Meetings. For all closed sessions of the SITFO Board of
Trustees, SITFO Board of Trustee Sub-Committee Meetings and/or any other similar meetings,
gatherings, or presentations, SITFO and the Protection & Advocacy Office agree as follows:
(i) SITFO shall provide e-mail notice to the Protection & Advocacy
Office as soon as practicable and in no event later than notice is provided to the SITFO Board of
Trustees to such meeting. At the same time provided to the SITFO Board of Trustees, SITFO
shall provide the Protection & Advocacy Office an identification of the matters to be discussed at
such meeting and copies of materials to be presented unless said materials are subject to a
confidentiality provision. If additional materials not subject to contractual confidentiality
provisions become available prior to such meeting SITFO will e-mail the materials to the
Protection & Advocacy Office at the same time such additional materials are provided to the
SITFO Board of Trustees.
(ii) The Protection & Advocacy Office Director shall be permitted to
attend any of the meetings, presentations and/or gatherings described in this Section 2(b) and
provide reasonable and relevant input at the discretion of the presiding member of the SITFO
board. No other beneficiary contact persons will be permitted to attend unless expressly invited
to attend by the SITFO Board of Trustees.
(iii) For the avoidance of doubt, the provisions of this Section 2(b) shall
not apply to internal meetings involving only the SITFO staff. The foregoing notwithstanding,
the SITFO staff, may, at its discretion, invite the Protection & Advocacy Office Director to
attend and participate in such meetings and/or gatherings.
3. Public Notices; Requests for Proposal, Auctions. Prior to publishing and/or
soliciting, as applicable, public notices, requests for proposals as defined by statute, and SITFO
shall notify the Protection & Advocacy Office.
4. Duration; Expiration. This Memorandum shall expire automatically on the 3-year
anniversary of the Effective Date unless renewed in writing by SITFO and the Protection &
Advocacy Office.
5. Governing Law. The construction and interpretation of this Memorandum shall
be governed by the laws of the State of Utah.
6. This MOU may be amended by a written document signed by all of the parties hereto
or by their authorized agents.
12

[SIGNATURES TO FOLLOW]
13

IN WITNESS WHEREOF, the parties have executed this Memorandum of
Understanding effective as of the date first written above.
SITFO:
Utah School and Institutional Trust Fund
Office
By:
Name: Peter Madsen
Title: Director
PROTECTION & ADVOCACY
OFFICE:
Utah Land Trusts Protection and Advocacy
Office
By:
Name: Justin Atwater
Title: Director
14

SCHOOL & INSTITUTIONALTRUST FUNDS OFFICE
200 E SOUTH TEMPLE, SUITE 100SALT LAKE CITY, UT 84111
801-364-0821SITFO.UTAH.GOV
Securities Brokerage Purpose To allow SITFO and select investment or transition managers to utilize exchange traded securities on behalf of the trusts. The intent is to provide efficient and inexpensive solutions during manager transitions as well as general exposure management.
Background In order to maximize efficiency in exposure management, SITFO intends to avail ourselves of brokers and transition managers in order to buy and sell exchange traded securities such as ETFs or to facilitate transitions from one manager to another. Examples include gaining exposure to an asset class in anticipation of hiring a given manager, to assist in rebalancing, or general exposure management such as adding to an asset class alongside an existing mandate, but not to add active risk. We may also utilize a transition manager in the event of replacing an investment manager on a given mandate. The transition manager may want to utilize futures or ETFs to gain market exposure while transitioning the underlying securities from one portfolio strategy to another.
SITFO staff has reviewed several brokers with an eye to organizational stability, trade execution capabilities, trading costs, as well as interaction with Northern Trust and consultants. SITFO staff will seek to obtain best execution of trade orders at the most favorable prices reasonably obtainable through third-party brokers. SITFO expects to pay on average 1¢ per share per trade for execution.
Brokers SITFO evaluated the following:
Organization Stability Execution Cost Interaction Northern Trust Global agency-only
brokerage with over 1600 US institutional clients and over $250B in equities and fixed income traded in 2019.
Trading desks and operational teams in five global hubs operating on a 24/6 operating model. Consulting approach to trade execution. Provides extensive pre- and post-trade analytics.
1¢ per share on all ETF orders. SITFO would also receive a relationship-based servicing discount on investment fees.
Trade securities directly through the Northern Trust platform or via phone and email. Securities are settled directly into custody account.
CAPIS – Capital Institutional Services
Institutional trading since 1977. Privately women-owned by senior management. Global trading desk with 16 traders averaging 21 years of trading experience.
Will seek liquidity in the open market via a variety of algorithmic and electronic venues. Will call on multiple authorized participants for competitive bids/offers.
1¢ per share for execution services.
Ability to send orders though any FIX connection, email, phone or IM/IB service. Trades will settle directly into the custodial account with
Exhibit E
15

Institutional quality clearing through Merrill Lynch.
dedicated operations staff.
Abel Noser Global agency only brokerage founded in 1975 with 57 full time employees. In 2019, they traded over $50B in notional value of securities.
Ability to execute trades directly in the marketplace or source liquidity through a variety of market making desks. Deploy quantitative transaction cost analysis (TCA) to minimize transaction costs using $11T in historical trade data to inform analysis.
1¢ per share for US equities and ETF orders.
Trades are initiated via Bloomberg, phone, email or FIX connections. Trades are cleared through NFS and settle directly at the custodian. Dedicated settlements team to handle any settlement mismatches.
Wallachbeth Founded in 2009, with all original founders still in place. Institutional quality clearing relationship with Merrill Lynch. Over 400 institutional clients. Agency-only brokerage that avoids any perceived banking conflicts.
Specialization in ETFs, equities, and derivatives trading execution. Agency firm that employs competition between market makers and algorithmic providers to achieve best execution. Provides pre-trade and 3rd party post trade analysis to determine best strategy for trade execution.
1¢ per share on all ETF and equity orders.
Trades directed either through voice, email, chat or direct connection. Trades clear through Merrill Lynch and settle at custodian. Dedicated middle and back-office personnel.
Conclusion SITFO staff plans to utilize the services of these securities brokers for the portfolio. As we seek out best execution and low-cost trades, we plan to evaluate ongoing relationships based on pre and post trade analysis and trade execution abilities.
16

--- Annualized ---1 Mon. 1 Yr. 3 Yr. 5 Yr. 10 Yr.(0.6) 6.9 5.1 5.1 8.3 Growth(0.8) 7.0 4.8 4.8 8.4
CPI + 5% 0.4 7.4 7.1 6.2 6.8Policy Index 0.0 10.0 6.7 5.6 8.4
Real Assets
IncomeCreditSecuritizedInsurance LinkedEmerging Market DebtPrivate DebtDefensiveLong U.S. TreasuriesSystematic ConvexityCash
3 YearActual $ Actual % Range Target Sharpe
Total Fund 2,634 100% 0.7Growth 1,075 41% 25-50% 37.0% 0.5
412 16% 9-21% 15.0% 0.6531 20% 9-21% 15.0% 0.3133 5% 4-10% 7.0% 0.6
Real Assets 459 17% 15-25% 20.0% 0.273 3% 0-6% 3.0% 0.4
141 5% 1-7% 4.0% -0.3207 8% 6-12% 9.0% 1.4
38 1% 1-7% 4.0% 0.5Income 824 31% 20-40% 31.0% 0.9Credit 175 7% 4-10% 7.0% 0.7Securitized 286 11% 5-11% 8.0% 2.6Insurance Linked 98 4% 0-6% 4.0% ---Emerging Market Debt 146 6% 2-8% 5.0% ---Private Debt 119 5% 4-10% 7.0% 1.0Defensive 276 10% 10-20% 12.0% 0.2Long U.S. Treasuries 78 3% 3-15% 5.0% 0.6Systematic Convexity 187 7% 3-15% 7.0% -0.6Cash 11 0%
Monthly Snapshot preliminary returns without all Q4 2019 Private Capital31-Jan-20
MARKET VALUE
INVESTMENT RETURNS2,634,152,103$ Total Portfolio Value
Total Fund
ASSET ALLOCATION
Public Real Assets
Private Natural ResourcesPrivate Real Estate
TIPS
U.S. EquityInternational EquityPrivate Equity
Actual Allocation vs. Policy Ranges
Liquid Composite
Private Natural Resources
0.0-0.30.0
Month
-0.3-0.20.0
0.0
U.S. EquityInternational EquityPrivate Equity
TIPSPublic Real AssetsPrivate Real Estate
0.00.10.0-0.1
0.00.0
0.00.1
-0.30.0
0.0-0.3
0.00.00.0
Contribution to Returns by Asset ClassYear to Date
0.0-0.10.0
0.3
0.0
0.30.0
-0.3
0%
10%
20%
30%
40%
50%
60%
Growth Real Assets Income Defensive
Position within Policy Ranges
(0.6)
6.9
5.1 5.1
8.3
0.4
7.4 7.1 6.2
6.8
0.0
10.0
6.7 5.6
8.4
(2.0)
0.0
2.0
4.0
6.0
8.0
10.0
12.0
1 Mon. 1 Yr. 3 Yr. 5 Yr. 10 Yr.
Investment Performance
Total Fund CPI + 5% Policy Index
Exhibit F
17
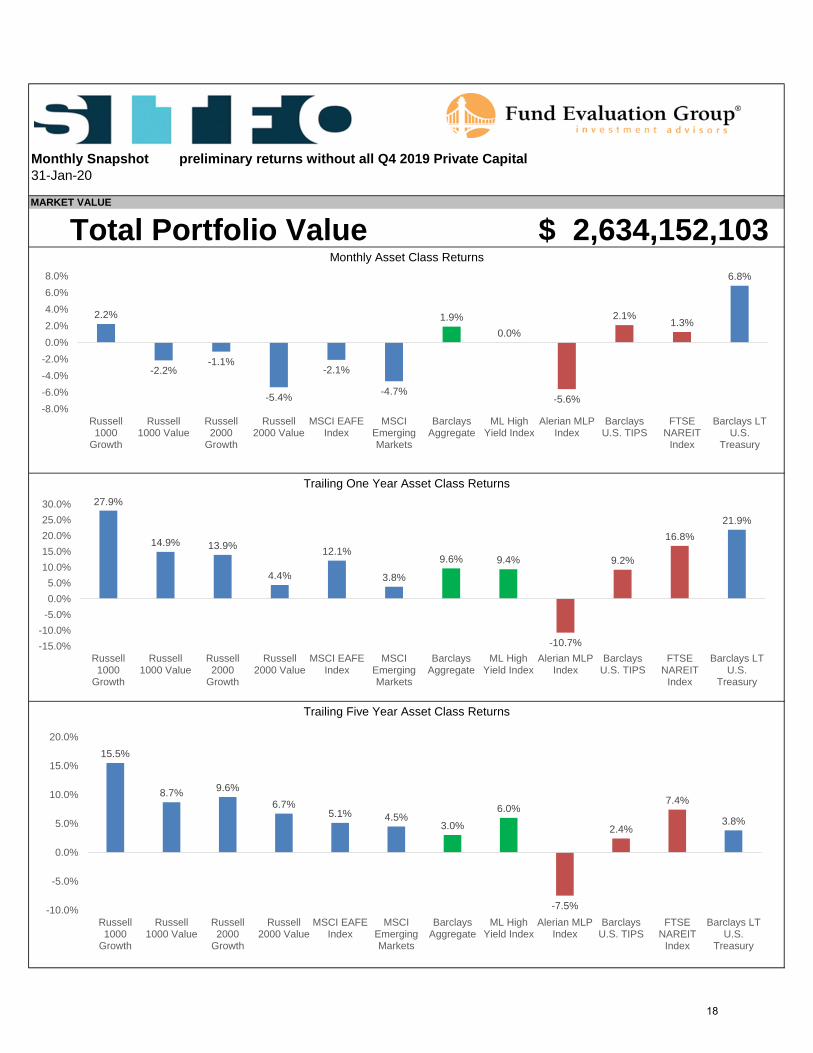
Monthly Snapshot preliminary returns without all Q4 2019 Private Capital31-Jan-20
MARKET VALUE
2,634,152,103$ Total Portfolio ValueMonthly Asset Class Returns
Trailing Five Year Asset Class Returns
Trailing One Year Asset Class Returns
2.2%
-2.2%-1.1%
-5.4%
-2.1%
-4.7%
1.9%0.0%
-5.6%
2.1% 1.3%
6.8%
-8.0%-6.0%-4.0%-2.0%0.0%2.0%4.0%6.0%8.0%
Russell1000
Growth
Russell1000 Value
Russell2000
Growth
Russell2000 Value
MSCI EAFEIndex
MSCIEmergingMarkets
BarclaysAggregate
ML HighYield Index
Alerian MLPIndex
BarclaysU.S. TIPS
FTSENAREIT
Index
Barclays LTU.S.
Treasury
15.5%
8.7% 9.6%6.7%
5.1% 4.5%3.0%
6.0%
-7.5%
2.4%
7.4%
3.8%
-10.0%
-5.0%
0.0%
5.0%
10.0%
15.0%
20.0%
Russell1000
Growth
Russell1000 Value
Russell2000
Growth
Russell2000 Value
MSCI EAFEIndex
MSCIEmergingMarkets
BarclaysAggregate
ML HighYield Index
Alerian MLPIndex
BarclaysU.S. TIPS
FTSENAREIT
Index
Barclays LTU.S.
Treasury
27.9%
14.9% 13.9%
4.4%
12.1%
3.8%
9.6% 9.4%
-10.7%
9.2%
16.8%21.9%
-15.0%-10.0%
-5.0%0.0%5.0%
10.0%15.0%20.0%25.0%30.0%
Russell1000
Growth
Russell1000 Value
Russell2000
Growth
Russell2000 Value
MSCI EAFEIndex
MSCIEmergingMarkets
BarclaysAggregate
ML HighYield Index
Alerian MLPIndex
BarclaysU.S. TIPS
FTSENAREIT
Index
Barclays LTU.S.
Treasury
18

Investment Thesis Memo The Transport Fund
Investment Transport Fund Target Fund Size
($MM) $5,000
Category Income Inception Date September 2017
Sub-Asset Class Credit Target Portfolio
Weight 1% / $25MM
Sub-Strategy Transportation Target IRR/Yield
(net) 10-12% / 8-10%
Benchmark
Blended (75% Barclays US Corporate
Total Return Index / 25% Dow Jones
Transportation Index)
Investment Period Open-end fund structure
Management Fee 1% (on invested capital only) Investment Term Open-end fund structure
Incentive Fee 15% on excess of 7% hurdle rate
(measurement period of 3 years) Analyst Johnny Lodder
Investment Thesis & Opportunity
• The Transport Fund presents an opportunity for SITFO to diversify away from traditional corporatecredit exposure by leasing a spectrum of capital-intensive transport assets to investment grade
counterparties at a premium of 400 to 600 basis points over the corporate bonds issued by the samecounterparties. Further, the strategy addresses a gap in transportation exposure within the portfolio.
• The Transport Fund emphasizes downside protection and returns are backed by a hard asset,
providing the strategy with a level of collateral not generally found within traditional corporate creditstrategies.
• The market for maritime and energy logistics transport assets provides an attractive opportunity set
at present. Regulatory pressure has pushed traditional bank lessors away from capital intensiveassets.1 At the same time, debt and equity issuance for US-listed shipping companies experienced
record lows in 2019 as capital markets have pulled back from the industry over trade tensions and
concerns around recently approved emissions standards.2
Rationale for Hiring Manager
• The investment manager is a large, well-established, and successful alternatives firm withapproximately 700 employees across 20 global offices. Further, the investment manager is a
subsidiary of a large publicly traded investment bank, which the investment manager leverages foradditional sourcing and investment due diligence support. The large profile of the investment
1 Petrofin 2 FreightWaves
Exhibit G
19

manager is not a hindrance to generating return as the strategy will benefit from scale and associated investment platform.
• The team has significant experience and implements a consistent investment approach, with thecore team members having fixed 550 leases across approximately 100 energy logistics and transport
assets since 2011 (valued at $4 billion). The team remains stable, with no significant departures sincestrategy inception.
• The investment manager will retain internal capital at approximately 3% of the Global TransportFund, exhibiting conviction in the strategy and an alignment of interests with external LPs.
Rationale for Firing Manager
• SITFO is unable to terminate the relationship prior to the initial three-year lock-up period.
Nonetheless, key person provisions are in place should core investment team members leave priorto the end of this period.
• SITFO would consider terminating the relationship upon the three-year lock-up period should the
strategy deviate from its current portfolio targets, including target sector weightings, target lease
duration lengths and target counterparty credit quality.
• The manager is planning to substantially grow the strategy’s asset base. To fully invest this capital,the manager may feel pressured to move into sectors which do not appear overly attractive at
present. Capacity doesn’t appear to be a concern for this strategy at present, nonetheless, SITFO will
monitor AUM growth and would consider terminating the relationship upon the three-year lock-up
period should returns appear to suffer from the increasing AUM.
Favorable Aspects of Strategy
• The strategy follows a “core-plus” approach, targeting long-term lease durations via an open-end
fund structure. As such, the strategy limits the number of times the underlying transport assets cometo market, thus reducing market cycle risk and volatility, and emphasizing the yield component of
return (8-10% net levered yield projection).
• Asset leasing platforms often focus within a specific sector, leading to outperformance during
periods of favorable conditions but also resulting in a lack of flexibility as sectors move out of favor.
The strategy remains flexible in its ability to deploy capital across multiple sectors, includingmaritime, energy logistics, aviation, rail, vehicles and heavy equipment.
• The strategy positions itself as both the lessor and operator of maritime and energy logistics assets
via robust operating and servicing capabilities provided though a wholly owned fund entity. The fundis currently establishing a similar entity to oversee servicing of the fund’s aviation assets.
• Assets are built to suit the intended lessee or acquired early in the asset’s useful life, resulting in anaverage age of assets of approximately 2.9 years. The portfolio’s young and relatively efficient fleetof assets provides a hedge against regulatory initiatives such as the new emissions standards
referred to as IMO 2020.
Unfavorable Aspects of Strategy
20

• The Transport Fund will be the team’s first core-plus product, as well as their first allocation to theaviation, rail, vehicles and equipment sectors. As such, there is a certain element of first-time fund
risk.
• Although the open-end structure of the fund allows for increased lease durations and a greater
alignment with lessees, it catalyzes potential valuation and liquidity concerns. Nonetheless, this is
not altogether uncommon as open-end structures are utilized within various other illiquidinfrastructure and real estate strategies.
• The team’s track record is mixed, with their first fund (2011) performing in the bottom quartile of itspeer group in terms of both IRR and TVPI.3 Their second fund (2017) is performing in the top quartile
in terms of both IRR and TVPI. These funds followed a close-end opportunistic strategy whichinvested in distressed maritime assets leased at short durations, as opposed to the Transport Fund’s
long-term and core-plus approach.
• The strategy is complex and reliant on a network of both affiliated and unaffiliated servicing and
operating counterparties to meet return objectives and retain positioning within the competitive
landscape.
Rationale for Sizing
• SITFO is committing $25 million for a 1% position. Due to the fund’s three-year lock-up period, SITFOis unable to modify the amount once committed.
• Overweighting and underweighting would primarily be a function of the expected returns relative to
other portfolio strategies and asset classes. The strategy is a candidate for overweighting given itslow volatility.
3 Preqin Global Infrastructure (Logistics and Transportation), 2010 – 2012, 2016 - 2018
21

SCHOOL & INSTITUTIONALTRUST FUNDS OFFICE
200 EAST SOUTH TEMPLE STE 100SALT LAKE CITY, UT 84111
801-355-3070SITFO.UTAH.GOV
Investment Thesis Memo GUNR
Firm Northern Trust Asset Management (FlexShares ETF Family)
Firm AUM ($MM) $1,000,000
Investment Global Upstream Natural Resources Index Fund
Strategy AUM ($MM) $5,518
Category Real Assets Inception Date 2011
Sub-Asset Class Public Real Assets Target Portfolio Weight 1%
Sub-Strategy Global Natural Resources Risks Equity, commodity risk
Benchmark Morningstar Global Upstream Natural Resources Index
Liquidity Daily (ETF)
Management Fee 0.46%; Service credit of 5% >$10MM, 2.5% <$10MM
Analyst Ryan Kulig
Target Date 2/26/2020
Investment Thesis/Opportunity
• Globally diversified, rules-based natural resource fund to assist with broad exposure to andliquidity management within real assets.
• Corporate exposure where there is both a strong tie to commodity prices but unlike futuresexposure there are earnings for shareholders.
• Low overlap with current portfolio as it excludes REITS (includes timber and water REITS),infrastructure and midstream.
• The correlation between natural resource equities and broad market equities is expected to behigh over the short term but declines when measured over the longer term.
• Given the cyclical nature and long term uncorrelation to the broader market of natural resourceequites, it provides an attractive portfolio diversifier.
Rationale for Hiring Manager
• Large asset manager with strong operational infrastructure capabilities under the Northern Trustumbrella.
• Discounted fees due to relationship pricing.
Rationale for Firing Manager
Exhibit H
22
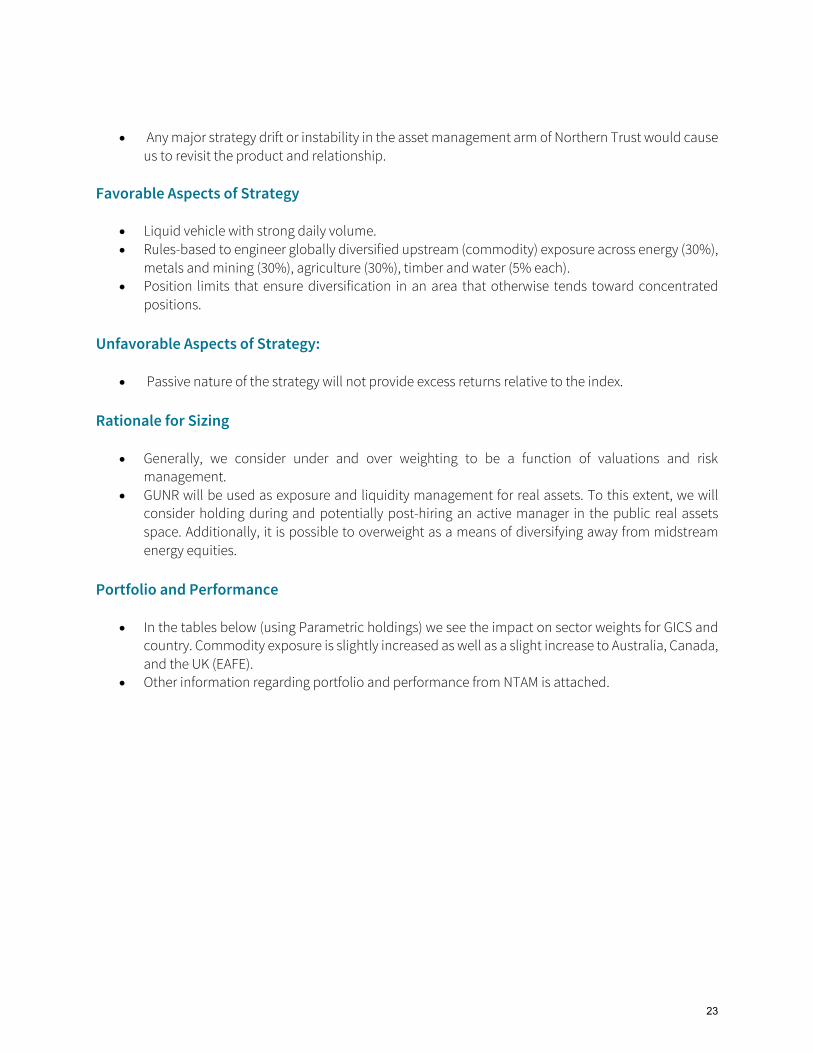
• Any major strategy drift or instability in the asset management arm of Northern Trust would causeus to revisit the product and relationship.
Favorable Aspects of Strategy
• Liquid vehicle with strong daily volume.• Rules-based to engineer globally diversified upstream (commodity) exposure across energy (30%),
metals and mining (30%), agriculture (30%), timber and water (5% each).• Position limits that ensure diversification in an area that otherwise tends toward concentrated
positions.
Unfavorable Aspects of Strategy:
• Passive nature of the strategy will not provide excess returns relative to the index.
Rationale for Sizing
• Generally, we consider under and over weighting to be a function of valuations and riskmanagement.
• GUNR will be used as exposure and liquidity management for real assets. To this extent, we willconsider holding during and potentially post-hiring an active manager in the public real assetsspace. Additionally, it is possible to overweight as a means of diversifying away from midstreamenergy equities.
Portfolio and Performance
• In the tables below (using Parametric holdings) we see the impact on sector weights for GICS andcountry. Commodity exposure is slightly increased as well as a slight increase to Australia, Canada,and the UK (EAFE).
• Other information regarding portfolio and performance from NTAM is attached.
23

Utah Schools Composite vs. FlexShares Morningstar Global Upstream Natural Resources Index
Total Growth Composite GUNR Weights Combined
Weights Difference GICS as % of Total Portfolio
Communication Services 7.82 -- 7.04 -0.78 2.11Consumer Discretionary 11.90 -- 10.71 -1.19 3.21Consumer Staples 9.26 15.88 9.93 0.66 2.98Energy 6.19 28.92 8.47 2.27 2.54Financials 16.54 0.07 14.89 -1.65 4.47Health Care 10.77 -- 9.69 -1.08 2.91Industrials 9.09 2.45 8.43 -0.66 2.53Information Technology 12.95 -- 11.65 -1.29 3.50Materials 6.02 45.82 10.00 3.98 3.00Real Estate 5.18 1.53 4.81 -0.36 1.44Utilities 4.28 5.33 4.39 0.10 1.32
Total 100.00 100.00 100.00 -- 30.00
24
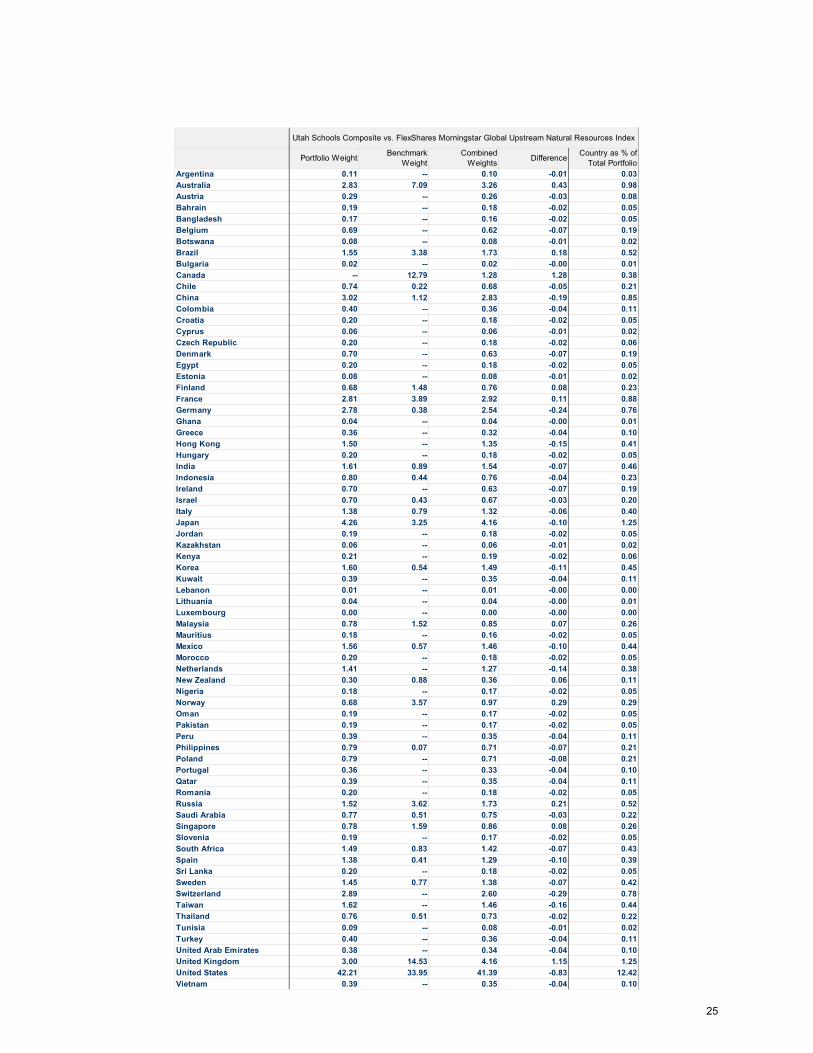
Utah Schools Composite vs. FlexShares Morningstar Global Upstream Natural Resources Index
Portfolio Weight Benchmark Weight
Combined Weights Difference Country as % of
Total Portfolio Argentina 0.11 -- 0.10 -0.01 0.03Australia 2.83 7.09 3.26 0.43 0.98Austria 0.29 -- 0.26 -0.03 0.08Bahrain 0.19 -- 0.18 -0.02 0.05Bangladesh 0.17 -- 0.16 -0.02 0.05Belgium 0.69 -- 0.62 -0.07 0.19Botswana 0.08 -- 0.08 -0.01 0.02Brazil 1.55 3.38 1.73 0.18 0.52Bulgaria 0.02 -- 0.02 -0.00 0.01Canada -- 12.79 1.28 1.28 0.38Chile 0.74 0.22 0.68 -0.05 0.21China 3.02 1.12 2.83 -0.19 0.85Colombia 0.40 -- 0.36 -0.04 0.11Croatia 0.20 -- 0.18 -0.02 0.05Cyprus 0.06 -- 0.06 -0.01 0.02Czech Republic 0.20 -- 0.18 -0.02 0.06Denmark 0.70 -- 0.63 -0.07 0.19Egypt 0.20 -- 0.18 -0.02 0.05Estonia 0.08 -- 0.08 -0.01 0.02Finland 0.68 1.48 0.76 0.08 0.23France 2.81 3.89 2.92 0.11 0.88Germany 2.78 0.38 2.54 -0.24 0.76Ghana 0.04 -- 0.04 -0.00 0.01Greece 0.36 -- 0.32 -0.04 0.10Hong Kong 1.50 -- 1.35 -0.15 0.41Hungary 0.20 -- 0.18 -0.02 0.05India 1.61 0.89 1.54 -0.07 0.46Indonesia 0.80 0.44 0.76 -0.04 0.23Ireland 0.70 -- 0.63 -0.07 0.19Israel 0.70 0.43 0.67 -0.03 0.20Italy 1.38 0.79 1.32 -0.06 0.40Japan 4.26 3.25 4.16 -0.10 1.25Jordan 0.19 -- 0.18 -0.02 0.05Kazakhstan 0.06 -- 0.06 -0.01 0.02Kenya 0.21 -- 0.19 -0.02 0.06Korea 1.60 0.54 1.49 -0.11 0.45Kuwait 0.39 -- 0.35 -0.04 0.11Lebanon 0.01 -- 0.01 -0.00 0.00Lithuania 0.04 -- 0.04 -0.00 0.01Luxembourg 0.00 -- 0.00 -0.00 0.00Malaysia 0.78 1.52 0.85 0.07 0.26Mauritius 0.18 -- 0.16 -0.02 0.05Mexico 1.56 0.57 1.46 -0.10 0.44Morocco 0.20 -- 0.18 -0.02 0.05Netherlands 1.41 -- 1.27 -0.14 0.38New Zealand 0.30 0.88 0.36 0.06 0.11Nigeria 0.18 -- 0.17 -0.02 0.05Norway 0.68 3.57 0.97 0.29 0.29Oman 0.19 -- 0.17 -0.02 0.05Pakistan 0.19 -- 0.17 -0.02 0.05Peru 0.39 -- 0.35 -0.04 0.11Philippines 0.79 0.07 0.71 -0.07 0.21Poland 0.79 -- 0.71 -0.08 0.21Portugal 0.36 -- 0.33 -0.04 0.10Qatar 0.39 -- 0.35 -0.04 0.11Romania 0.20 -- 0.18 -0.02 0.05Russia 1.52 3.62 1.73 0.21 0.52Saudi Arabia 0.77 0.51 0.75 -0.03 0.22Singapore 0.78 1.59 0.86 0.08 0.26Slovenia 0.19 -- 0.17 -0.02 0.05South Africa 1.49 0.83 1.42 -0.07 0.43Spain 1.38 0.41 1.29 -0.10 0.39Sri Lanka 0.20 -- 0.18 -0.02 0.05Sweden 1.45 0.77 1.38 -0.07 0.42Switzerland 2.89 -- 2.60 -0.29 0.78Taiwan 1.62 -- 1.46 -0.16 0.44Thailand 0.76 0.51 0.73 -0.02 0.22Tunisia 0.09 -- 0.08 -0.01 0.02Turkey 0.40 -- 0.36 -0.04 0.11United Arab Emirates 0.38 -- 0.34 -0.04 0.10United Kingdom 3.00 14.53 4.16 1.15 1.25United States 42.21 33.95 41.39 -0.83 12.42Vietnam 0.39 -- 0.35 -0.04 0.10
25

Prepared for:
UTAH STIFO
-vs-
GNR
GUNR
1/10/2020
26

Page 1 of 15
Source: Morningstar Direct27

Equity Sector
Sector Exposure
Portfolio Date: 12/31/2019
Materials
Communication
Services
Consumer
Discretionary
Consumer
Staples Healthcare Industrials
Real
Estate
Information
Technology Energy Financials Utilities
FlexShares Mstar Glbl Upstrm Nat Res ETF
SPDR® S&P Global Natural Resources ETF
S&P Global Natural Resources TR USD
48.75% 0.00% 0.00% 15.12% 0.00% 0.72% 1.39% 0.00% 29.08% 0.00% 4.94%
60.90% 0.00% 0.00% 4.34% 0.00% 0.00% 1.88% 0.00% 32.89% 0.00% 0.00%
61.25% 0.00% 0.00% 4.30% 0.00% 0.00% 1.86% 0.00% 32.60% 0.00% 0.00%
Equity Sector Exposure
0.0
10.0
20.0
30.0
40.0
50.0
60.0
70.0
Materials Consumer Staples Industrials Real Estate Energy Utilities
FlexShares Mstar Glbl Upstrm Nat Res ETF SPDR® S&P Global Natural Resources ETF S&P Global Natural Resources TR USD
Page 2 of 15
Source: Morningstar Direct28

Equity Sector Historical Allocation
FlexShares Mstar Glbl Upstrm Nat Res ETF - Equity Sectors (GICS)
Time Period: 10/1/2011 to 12/31/2019
0.0
10.0
20.0
30.0
40.0
50.0
60.0
70.0
80.0
90.0
100.0
2012 2013 2014 2015 2016 2017 2018 2019
Energy % Materials % Industrials %
Consumer Discretionary % Consumer Staples % Healthcare %
Financials % Information Technology % Communication Services %
Utilities % Real Estate %
SPDR® S&P Global Natural Resources ETF - Equity Sectors (GICS)
Time Period: 10/1/2011 to 12/31/2019
0.0
10.0
20.0
30.0
40.0
50.0
60.0
70.0
80.0
90.0
100.0
2012 2013 2014 2015 2016 2017 2018 2019
Energy % Materials % Industrials %
Consumer Discretionary % Consumer Staples % Healthcare %
Financials % Information Technology % Communication Services %
Utilities % Real Estate %
S&P Global Natural Resources TR USD - Equity Sectors (GICS)
Time Period: 10/1/2011 to 12/31/2019
0.0
10.0
20.0
30.0
40.0
50.0
60.0
70.0
80.0
90.0
100.0
2012 2013 2014 2015 2016 2017 2018 2019
Energy % Materials % Industrials %
Consumer Discretionary % Consumer Staples % Healthcare %
Financials % Information Technology % Communication Services %
Utilities % Real Estate %
Page 4 of 15
Source: Morningstar Direct29

Style Analysis
Style Box Exposure
Portfolio Date: 12/31/2019
Large Cap Mid Cap Small Cap Value Core Growth Factor Div Yld
FlexShares Mstar Glbl Upstrm Nat Res ETF
SPDR® S&P Global Natural Resources ETF
S&P Global Natural Resources TR USD
75.54% 23.01% 1.46% 44.74% 43.23% 12.03% 3.69%
75.63% 23.97% 0.40% 46.24% 45.53% 8.23% 4.20%
75.84% 23.78% 0.39% 45.83% 46.01% 8.16% 4.19%
Style Box Exposure
Mic
roS
ma
llM
idL
arg
eG
ian
t
Deep-Val Core-Val Core Core-Grth High-Grth
FlexShares Mstar Glbl Upstrm Nat Res ETF 12/31/2019
SPDR® S&P Global Natural Resources ETF 12/31/2019
S&P Global Natural Resources TR USD 12/31/2019
Page 5 of 15
Source: Morningstar Direct30
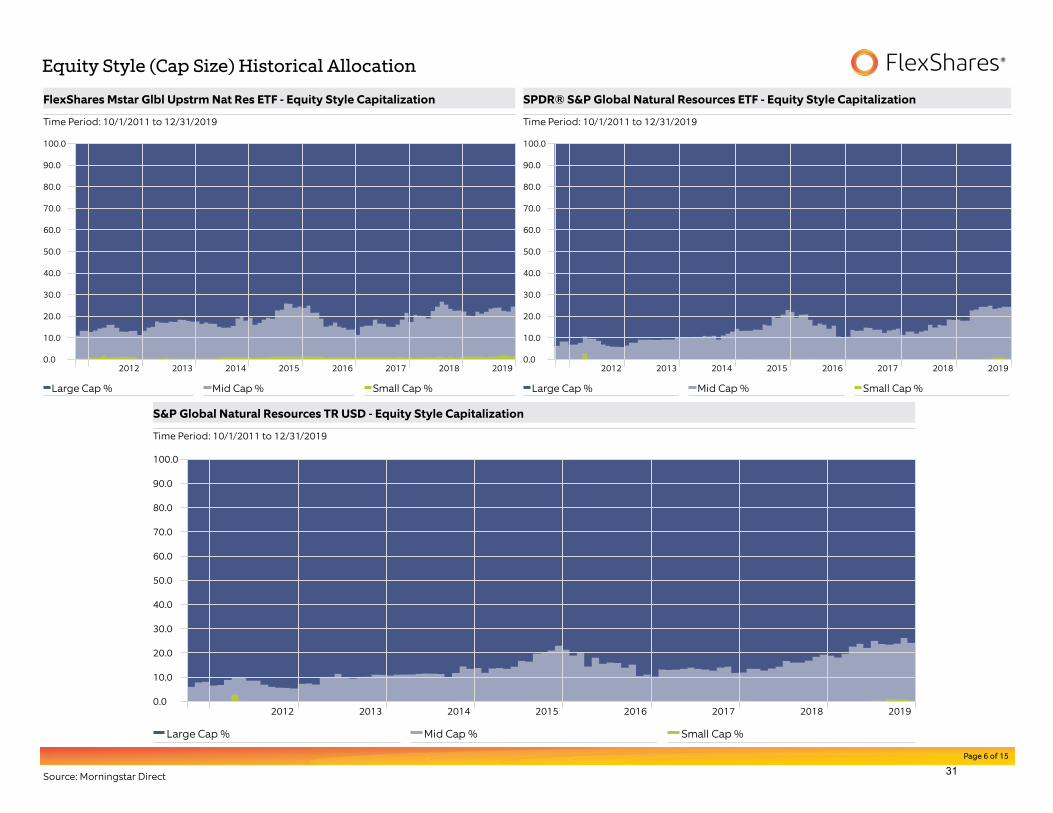
Equity Style (Cap Size) Historical Allocation
FlexShares Mstar Glbl Upstrm Nat Res ETF - Equity Style Capitalization
Time Period: 10/1/2011 to 12/31/2019
0.0
10.0
20.0
30.0
40.0
50.0
60.0
70.0
80.0
90.0
100.0
2012 2013 2014 2015 2016 2017 2018 2019
Large Cap % Mid Cap % Small Cap %
SPDR® S&P Global Natural Resources ETF - Equity Style Capitalization
Time Period: 10/1/2011 to 12/31/2019
0.0
10.0
20.0
30.0
40.0
50.0
60.0
70.0
80.0
90.0
100.0
2012 2013 2014 2015 2016 2017 2018 2019
Large Cap % Mid Cap % Small Cap %
S&P Global Natural Resources TR USD - Equity Style Capitalization
Time Period: 10/1/2011 to 12/31/2019
0.0
10.0
20.0
30.0
40.0
50.0
60.0
70.0
80.0
90.0
100.0
2012 2013 2014 2015 2016 2017 2018 2019
Large Cap % Mid Cap % Small Cap %
Page 6 of 15
Source: Morningstar Direct31

Equity Style (Valuation) Historical Allocation
FlexShares Mstar Glbl Upstrm Nat Res ETF - Equity Style Valuation
Time Period: 10/1/2011 to 12/31/2019
0.0
10.0
20.0
30.0
40.0
50.0
60.0
70.0
80.0
90.0
100.0
2012 2013 2014 2015 2016 2017 2018 2019
Value % Core % Growth %
SPDR® S&P Global Natural Resources ETF - Equity Style Valuation
Time Period: 10/1/2011 to 12/31/2019
0.0
10.0
20.0
30.0
40.0
50.0
60.0
70.0
80.0
90.0
100.0
2012 2013 2014 2015 2016 2017 2018 2019
Value % Core % Growth %
S&P Global Natural Resources TR USD - Equity Style Valuation
Time Period: 10/1/2011 to 12/31/2019
0.0
10.0
20.0
30.0
40.0
50.0
60.0
70.0
80.0
90.0
100.0
2012 2013 2014 2015 2016 2017 2018 2019
Value % Core % Growth %
Page 7 of 15
Source: Morningstar Direct32

Country Risk Exposure
FlexShares Mstar Glbl Upstrm Nat Res ETF - Equity Regional Exposure
Portfolio Date: 12/31/2019
%
North America 47.5
Latin America 4.0
United Kingdom 11.7
Europe dev 13.6
Europe emrg 3.7
Africa/Middle East 2.8
Australasia 8.1
Japan 1.9
Asia dev 0.3
Asia emrg 6.3
Total 100.0
SPDR® S&P Global Natural Resources ETF - Equity Regional Exposure
Portfolio Date: 12/31/2019
%
North America 43.5
Latin America 3.8
United Kingdom 13.4
Europe dev 17.5
Europe emrg 4.8
Africa/Middle East 0.5
Australasia 9.9
Japan 2.9
Asia dev 1.2
Asia emrg 2.5
Total 100.0
FlexShares Mstar Glbl Upstrm Nat Res ETF - Equity Country Exposure
Portfolio Date: 12/31/2019
%
Australia 7.3
Brazil 3.5
Canada 11.9
China 2.6
Finland 1.4
France 3.7
Japan 1.9
Malaysia 2.0
Norway 4.0
Russia 3.7
South Africa 1.5
Sweden 0.9
Switzerland 2.0
United Kingdom 11.7
United States 35.6
Other 6.2
Total 100.0
SPDR® S&P Global Natural Resources ETF - Equity Country Exposure
Portfolio Date: 12/31/2019
%
Australia 9.9
Brazil 3.2
Canada 13.1
China 2.5
Finland 4.8
France 3.4
Germany 2.2
Japan 2.9
Norway 2.1
Russia 4.8
South Korea 1.2
Sweden 1.0
Switzerland 2.2
United Kingdom 13.4
United States 30.4
Other 2.9
Total 100.0
Page 8 of 15
Source: Morningstar Direct33
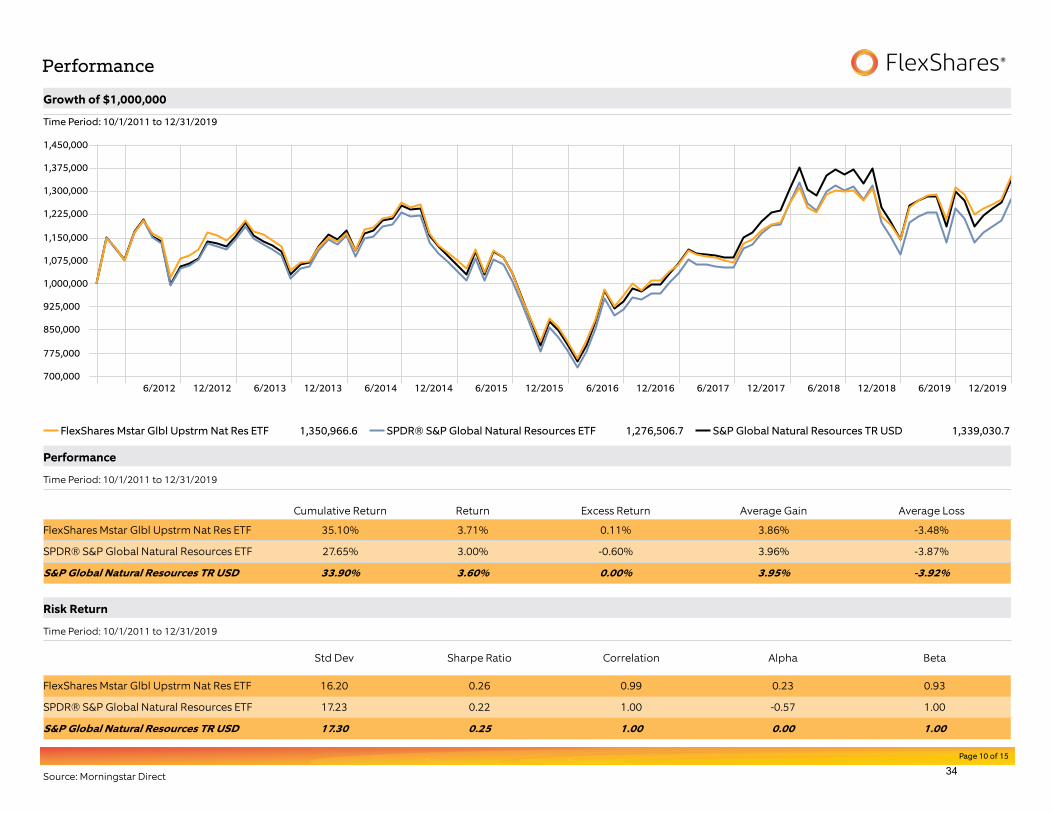
Performance
Growth of $1,000,000
Time Period: 10/1/2011 to 12/31/2019
6/2012 12/2012 6/2013 12/2013 6/2014 12/2014 6/2015 12/2015 6/2016 12/2016 6/2017 12/2017 6/2018 12/2018 6/2019 12/2019700,000
775,000
850,000
925,000
1,000,000
1,075,000
1,150,000
1,225,000
1,300,000
1,375,000
1,450,000
FlexShares Mstar Glbl Upstrm Nat Res ETF 1,350,966.6 SPDR® S&P Global Natural Resources ETF 1,276,506.7 S&P Global Natural Resources TR USD 1,339,030.7
Performance
Time Period: 10/1/2011 to 12/31/2019
Cumulative Return Return Excess Return Average Gain Average Loss
FlexShares Mstar Glbl Upstrm Nat Res ETF
SPDR® S&P Global Natural Resources ETF
S&P Global Natural Resources TR USD
35.10% 3.71% 0.11% 3.86% -3.48%
27.65% 3.00% -0.60% 3.96% -3.87%
33.90% 3.60% 0.00% 3.95% -3.92%
Risk Return
Time Period: 10/1/2011 to 12/31/2019
Std Dev Sharpe Ratio Correlation Alpha Beta
FlexShares Mstar Glbl Upstrm Nat Res ETF
SPDR® S&P Global Natural Resources ETF
S&P Global Natural Resources TR USD
16.20 0.26 0.99 0.23 0.93
17.23 0.22 1.00 -0.57 1.00
17.30 0.25 1.00 0.00 1.00
Page 10 of 15
Source: Morningstar Direct34

Calendar / Trailing Returns
Calendar Year Returns
Calculation Benchmark: S&P Global Natural Resources TR USD
YTD 2019 2018 2017 2016-15.0%
-10.0%
-5.0%
0.0%
5.0%
10.0%
15.0%
20.0%
25.0%
30.0%
35.0%
FlexShares Mstar Glbl Upstrm Nat Res ETF SPDR® S&P Global Natural Resources ETF S&P Global Natural Resources TR USD
Re
turn
Trailing Returns
Calculation Benchmark: S&P Global Natural Resources TR USD
YTD 1 Year 3 Years 5 Years0.0%
2.0%
4.0%
6.0%
8.0%
10.0%
12.0%
14.0%
16.0%
18.0%
20.0%
FlexShares Mstar Glbl Upstrm Nat Res ETF SPDR® S&P Global Natural Resources ETF S&P Global Natural Resources TR USD
Re
turn
Calendar Year Returns
Data Point: Return Calculation Benchmark: S&P Global Natural Resources TR USD
YTD 2019 2018 2017 2016
FlexShares Mstar Glbl Upstrm Nat Res ETF
SPDR® S&P Global Natural Resources ETF
S&P Global Natural Resources TR USD
18.07% 18.07% -9.22% 18.45% 30.91%
16.45% 16.45% -13.11% 22.16% 31.35%
17.20% 17.20% -12.57% 22.66% 32.28%
Trailing Returns
Data Point: Return Calculation Benchmark: S&P Global Natural Resources TR USD
1 Year 3 Years 5 Years 10 Years
FlexShares Mstar Glbl Upstrm Nat Res ETF
SPDR® S&P Global Natural Resources ETF
S&P Global Natural Resources TR USD
18.07 26.97 25.54
16.45 23.60 22.88
17.20 25.68 26.36 17.36
Page 11 of 15
Source: Morningstar Direct35

Upside Downside Capture
Upside Downside Capture
Time Period: 10/1/2011 to 12/31/2019
Up Number Down Number Up Capture Ratio Down Capture Ratio Up Capture Return Down Capture Return
FlexShares Mstar Glbl Upstrm Nat Res ETF
SPDR® S&P Global Natural Resources ETF
S&P Global Natural Resources TR USD
52 47 93.58 92.33 3.70 -3.62
53 46 98.39 100.80 3.89 -3.95
54 45 100.00 100.00 3.95 -3.92
Drawdown
Time Period: 10/1/2011 to 12/31/2019
Max Drawdown Max Drawdown # of Periods Max Drawdown Peak Date Max Drawdown Valley Date
FlexShares Mstar Glbl Upstrm Nat Res ETF
SPDR® S&P Global Natural Resources ETF
S&P Global Natural Resources TR USD
-39.89% 19 7/1/2014 1/31/2016
-40.73% 19 7/1/2014 1/31/2016
-40.33% 19 7/1/2014 1/31/2016
Upside Downside Capture
Time Period: 10/1/2011 to 12/31/2019
Down Capture Ratio
0.0 20.0 40.0 60.0 80.0 100.0 120.0
0.0
20.0
40.0
60.0
80.0
100.0
120.0 FlexShares Mstar Glbl Upstrm Nat Res ETF
SPDR® S&P Global Natural Resources ETF
S&P Global Natural Resources TR USD
Up
Ca
ptu
re R
ati
o
Drawdown
Time Period: 10/1/2011 to 12/31/2019
2013 2015 2017 2019-45.0%
-40.0%
-35.0%
-30.0%
-25.0%
-20.0%
-15.0%
-10.0%
-5.0%
0.0%
FlexShares Mstar Glbl Upstrm Nat Res ETF SPDR® S&P Global Natural Resources ETF S&P Global Natural Resources TR USD
Page 12 of 15
Source: Morningstar Direct36

Top Holdings and Funds Overview
FlexShares Mstar Glbl Upstrm Nat Res ETF - Top Holdings
Portfolio Date: 12/31/2019
Market Value (mil) Weight
Exxon Mobil Corp
Chevron Corp
BHP Group Ltd
Nutrien Ltd
Tyson Foods Inc Class A
Archer-Daniels Midland Co
Rio Tinto PLC
Corteva Inc
Total SA
BP PLC
Royal Dutch Shell PLC Class A
Vale SA
Anglo American PLC
Glencore PLC
Newmont Goldcorp Corp
Barrick Gold Corp
FMC Corp
Mowi ASA
CF Industries Holdings Inc
ConocoPhillips
Weyerhaeuser Co
The Mosaic Co
Wilmar International Ltd
American Water Works Co Inc
Franco-Nevada Corp
$ 266.16 4.83%
$ 236.76 4.30%
$ 235.36 4.27%
$ 211.58 3.84%
$ 185.46 3.36%
$ 181.52 3.29%
£ 169.23 3.07%
$ 165.77 3.01%
145.22 € 2.63%
£ 136.40 2.47%
£ 133.30 2.42%
R$ 122.09 2.22%
£ 115.86 2.10%
£ 111.22 2.02%
$ 107.96 1.96%
$ 101.72 1.85%
$ 89.68 1.63%
kr 84.61 1.54%
$ 78.71 1.43%
$ 66.99 1.22%
$ 65.99 1.20%
$ 62.24 1.13%
$ 61.51 1.12%
$ 60.64 1.10%
$ 59.21 1.07%
3,255.20 59.06%
SPDR® S&P Global Natural Resources ETF - Top Holdings
Portfolio Date: 12/31/2019
Market Value (mil) Weight
BHP Group Ltd
Nutrien Ltd
Exxon Mobil Corp
Total SA
Chevron Corp
Royal Dutch Shell PLC Class A
BP PLC
UPM-Kymmene Oyj
Vale SA ADR
Anglo American PLC
Glencore PLC
Barrick Gold Corp
Mondi PLC
Archer-Daniels Midland Co
Rio Tinto Ltd
Weyerhaeuser Co
Corteva Inc
Wilmar International Ltd
Smurfit Kappa Group PLC
Stora Enso Oyj Class R
Newmont Goldcorp Corp
International Paper Co
Franco-Nevada Corp
Suncor Energy Inc
Freeport-McMoRan Inc
$ 58.91 5.10%
$ 51.14 4.43%
$ 49.07 4.25%
38.75 € 3.35%
$ 38.03 3.29%
£ 35.20 3.05%
£ 35.11 3.04%
34.41 € 2.98%
$ 30.81 2.67%
£ 29.33 2.54%
£ 25.11 2.17%
$ 24.32 2.11%
£ 21.26 1.84%
$ 20.66 1.79%
$ 19.30 1.67%
$ 18.01 1.56%
$ 17.72 1.53%
$ 17.35 1.50%
16.95 € 1.47%
16.62 € 1.44%
$ 15.96 1.38%
$ 14.49 1.25%
$ 14.26 1.23%
$ 14.20 1.23%
$ 13.98 1.21%
670.97 58.09%
Snapshot
Inception Date Ticker Net Expense Ratio # of Holdings % Asset in Top 10 Holdings 12 Mo Yield P/E Ratio (TTM)
FlexShares Mstar Glbl Upstrm Nat Res ETF
SPDR® S&P Global Natural Resources ETF
S&P Global Natural Resources TR USD
9/16/2011 GUNR 0.46 163 34.96 3.25% 16.29
9/13/2010 GNR 0.40 108 34.47 3.84% 14.86
5/27/2008 90 34.80 14.90
Page 13 of 15
Source: Morningstar Direct37

FlexShares Mstar Glbl Upstrm Nat Res ETF
Investment Strategy
The investment seeks investment results that correspond generally to the price and
yield performance, before fees and expenses, of the Morningstar® Global Upstream
Natural Resources IndexSM. The fund will invest at least 80% of its total assets (exclusive
of collateral held from securities lending) in the securities of the index and in ADRs and
GDRs based on the securities in the index. The index reflects the performance of a
selection of equity securities that are traded in or are issued by companies domiciled in
global developed or emerging markets, as determined by the index provider pursuant
to its index methodology. It is non-diversified.
SPDR® S&P Global Natural Resources ETF
Investment Strategy
The investment seeks investment results that, before fees and expenses, correspond
generally to the total return performance of the S&P Global Natural Resources Index.
The fund generally invests substantially all, but at least 80%, of its total assets in the
securities comprising the index and in depositary receipts based on securities
comprising the index. The index is comprised of 90 of the largest U.S. and foreign
publicly traded companies, based on market capitalization, in natural resources and
commodities businesses that meet certain investability requirements. The fund is non-
diversified.
Page 14 of 15
Source: Morningstar Direct38

Disclaimer
The purpose of this material is to provide financial professionals with a means to evaluate the investment methodology of the Funds as compared to various other
funds. It is the opinion of Northern Trust, the Fund's investment adviser, that all funds are managed differently and do not react the same to economic or marketevents.
Mutual fund investing involves risk including the possible loss of principal. The investment objectives, strategies, policies or restrictions of other funds may differ and
more information can be found in their respective prospectuses. Therefore, we generally do not believe it is possible to make direct fund to fund comparisons in an
effort to highlight the benefits of a fund versus another similarly managed fund. The information included in this material is based upon data obtained from sources
believed to be reliable. This material is not considered as an offer to sell or a solicitation to buy shares of any other funds mentioned herein.
The information in this communication has been obtained from sources considered reliable, but we do not guarantee that it is accurate or complete.
Returns quoted represent past performance, which does not guarantee future results. Investment return and principal value will fluctuate so that shares, when
redeemed, may be worth more or less than their original cost. Current performance may be higher or lower. For the most recent month-end performance, please
visit the Fund's website at: www.flexshares.com
An investment in FlexShares is subject to investment risk, including the possible loss of principal amount invested. Funds’ returns may not match the returns of their
respective Indexes. The Funds may invest in emerging and foreign markets, derivatives and concentrated sectors. In addition, the Funds may be subject to asset class
risk, small cap stock risk, value investing risk, non-diversification risk, fluctuation of yield, income risk, interest rate/maturity risk, currency risk, passive investment risk,
inflation protected security risk, market risk and manager risk. For a complete description of risks associated with each Fund please refer to the prospectus.
Before investing carefully consider the FlexShares investment objectives, risks, charges and expenses. This and other information is in the prospectus, a copy of which
may be obtained by visiting www.flexshares.com. Read the prospectus carefully before you invest. FlexShares ETFs are distributed by Foreside Fund Services, LLC, not
affiliated with Northern Trust.
The preceding information is confidential and may not be duplicated in any form or disseminated without the prior consent of Northern Trust. The information does not
constitute investment advice or a recommendation to buy or sell any security and is subject to change without notice. Northern Trust and its affiliates may have positions
in, and may effect transactions in, the markets, contracts and related investments described herein, which positions and transactions may be in addition to, or different
from, those taken in connection with the investments described herein. All material has been obtained from sources believed to be reliable, but the accuracy,
completeness and interpretation cannot be guaranteed. Information contained herein is current as of the date appearing in this material only and is subject to change
without notice.
Past performance is not a guide to the future. There are risks involved with investing, including possible loss of principal. There is no guarantee that the investment
objectives of any fund or strategy will be met. Risk controls and asset allocation models do not promise any level of performance or guarantee against loss of principal.
Index returns do not assume the deduction of any management fees, trading costs or expenses. Direct investment in an index is not possible. Indices and trademarks
are the property of their respective owners. All rights reserved.
FOR FINANCIAL PROFESSIONAL USE ONLY. NOT FOR USE WITH THE GENERAL PUBLIC.
Page 15 of 15
Source: Morningstar Direct39

SITFOInvestment Manager SearchEquityUniverse: Global Natural Resources Custom UniversePerformance Data as of: December 2019
40

Table of Contents
Section 1 ..................................................Summary of Investment Managers
Section 2 ..................................................Investment Manager Profiles
Aberdeen Standard World Resources Equity
KBIGI: GRS
Wellington GNR
State Street GNR Stock Index
FlexShares Global Upstream Natural Resources Index Fund
GMO: GMO Resources Strategy
41

-5
0
5
10
15
20
25
30
Tota
l Ann
ualiz
ed R
etur
n, %
QTD YTD 1 year 3 years 5 years 7 years 10 years
KBIGI: GRS Mellon GNR Equity Wellington GNR NT FlexShares Morningstar Natural Resources State Street GNR Stock Index
GMO: GMO Resources Strategy
Annualized Performance QTD YTD 1 Year 3 Years 5 Years 7 Years 10 YearsReturn Rank Return Rank Return Rank Return Rank Return Rank Return Rank Return Rank
KBIGI: GRS 8.9 0 27.2 0 27.2 0 11.8 0 --- --- --- --- --- ---Mellon GNR Equity 9.0 0 17.7 25 17.7 25 4.0 77 2.6 52 2.6 18 3.0 58Wellington GNR 9.7 0 20.4 15 20.4 15 6.1 31 4.3 20 1.3 62 0.6 96NT FlexShares Morningstar Natural Resources 8.4 0 18.2 23 18.2 23 8.4 9 4.8 15 1.9 38 --- ---State Street GNR Stock Index 6.7 8 14.3 60 14.3 60 2.3 98 1.0 97 0.3 78 1.1 78GMO: GMO Resources Strategy 13.8 0 21.2 13 21.2 13 13.5 0 10.8 0 5.7 8 --- ---S&P Global Natural Resources Total Return Index 9.5 0 17.2 26 17.2 26 7.9 10 4.8 15 2.1 25 1.6 73eA Liquid Real Assets Median 3.6 50 16.0 50 16.0 50 5.3 50 2.6 50 1.6 50 3.2 50
Trailing Period Returns and RankingsAs of December 2019 Benchmark: S&P Global Natural Resources Total Return Index Universe: eA Liquid Real Assets Universe Size: 36
42

-30
-20
-10
0
10
20
30
40
50
Tota
l Ann
ualiz
ed R
etur
n, %
2019 2018 2017 2016 2015 2014 2013 2012 2011 2010
KBIGI: GRS Mellon GNR Equity Wellington GNR NT FlexShares Morningstar Natural Resources State Street GNR Stock Index
GMO: GMO Resources Strategy S&P Global Natural Resources Total Return Index
Calendar Year Performance 2019 2018 2017 2016 2015 2014 2013 2012 2011 2010Return Rank Return Rank Return Rank Return Rank Return Rank Return Rank Return Rank Return Rank Return Rank Return Rank
KBIGI: GRS 27.2 0 -13.3 100 26.6 0 6.3 75 --- --- --- --- --- --- --- --- --- --- --- ---Mellon GNR Equity 17.7 25 -17.0 100 15.2 8 29.2 2 -21.9 100 -4.7 75 10.9 0 7.0 63 -15.0 100 23.0 0Wellington GNR 20.4 15 -14.5 100 16.0 3 30.7 2 -20.9 100 -17.5 98 7.4 5 3.9 96 -18.9 100 15.7 57NT FlexShares Morningstar Natural Resources 18.2 23 -9.3 83 18.7 0 31.2 2 -24.3 100 -8.1 80 -1.6 51 9.0 29 --- --- --- ---State Street GNR Stock Index 14.3 60 -15.4 100 10.7 32 30.8 2 -24.9 100 -12.2 93 10.8 0 2.3 100 -7.8 89 15.4 61GMO: GMO Resources Strategy 21.2 13 -6.5 43 29.2 0 45.7 1 -21.6 100 -16.2 97 5.2 19 10.1 25 --- --- --- ---S&P Global Natural Resources Total Return Index 17.2 26 -12.6 100 22.7 0 32.3 2 -24.0 100 -9.7 84 1.5 29 7.2 62 -14.9 100 11.0 82eA Liquid Real Assets Median 16.0 50 -7.0 50 9.1 50 9.3 50 -9.6 50 0.3 50 -1.6 50 7.6 50 -0.2 50 16.1 50
Calendar Year Returns and RankingsAs of December 2019 Benchmark: S&P Global Natural Resources Total Return Index Universe: eA Liquid Real Assets Universe Size: 36
43
-15
-10
-5
0
5
10
15
20
25
Tota
l Ann
ualiz
ed R
etur
n, %
Dec-19 Dec-18 Dec-17 Dec-16 Dec-15 Dec-14 Dec-13 Dec-12 Dec-11 Dec-10
KBIGI: GRS Mellon GNR Equity Wellington GNR NT FlexShares Morningstar Natural Resources State Street GNR Stock Index
GMO: GMO Resources Strategy S&P Global Natural Resources Total Return Index
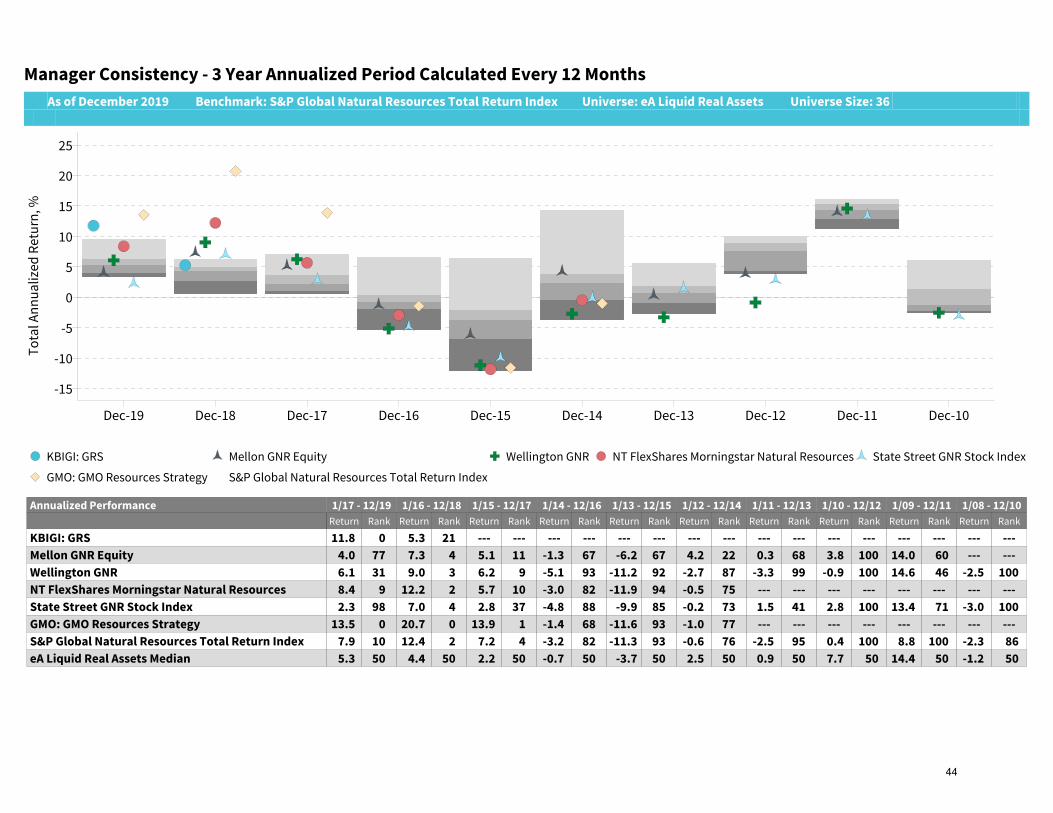
Annualized Performance 1/17 - 12/19 1/16 - 12/18 1/15 - 12/17 1/14 - 12/16 1/13 - 12/15 1/12 - 12/14 1/11 - 12/13 1/10 - 12/12 1/09 - 12/11 1/08 - 12/10Return Rank Return Rank Return Rank Return Rank Return Rank Return Rank Return Rank Return Rank Return Rank Return Rank
KBIGI: GRS 11.8 0 5.3 21 --- --- --- --- --- --- --- --- --- --- --- --- --- --- --- ---Mellon GNR Equity 4.0 77 7.3 4 5.1 11 -1.3 67 -6.2 67 4.2 22 0.3 68 3.8 100 14.0 60 --- ---Wellington GNR 6.1 31 9.0 3 6.2 9 -5.1 93 -11.2 92 -2.7 87 -3.3 99 -0.9 100 14.6 46 -2.5 100NT FlexShares Morningstar Natural Resources 8.4 9 12.2 2 5.7 10 -3.0 82 -11.9 94 -0.5 75 --- --- --- --- --- --- --- ---State Street GNR Stock Index 2.3 98 7.0 4 2.8 37 -4.8 88 -9.9 85 -0.2 73 1.5 41 2.8 100 13.4 71 -3.0 100GMO: GMO Resources Strategy 13.5 0 20.7 0 13.9 1 -1.4 68 -11.6 93 -1.0 77 --- --- --- --- --- --- --- ---S&P Global Natural Resources Total Return Index 7.9 10 12.4 2 7.2 4 -3.2 82 -11.3 93 -0.6 76 -2.5 95 0.4 100 8.8 100 -2.3 86eA Liquid Real Assets Median 5.3 50 4.4 50 2.2 50 -0.7 50 -3.7 50 2.5 50 0.9 50 7.7 50 14.4 50 -1.2 50
Manager Consistency - 3 Year Annualized Period Calculated Every 12 MonthsAs of December 2019 Benchmark: S&P Global Natural Resources Total Return Index Universe: eA Liquid Real Assets Universe Size: 36
44

-10
-5
0
5
10
15
Tota
l Ann
ualiz
ed R
etur
n, %
Dec-19 Dec-18 Dec-17 Dec-16 Dec-15 Dec-14 Dec-13 Dec-12 Dec-11 Dec-10
KBIGI: GRS Mellon GNR Equity Wellington GNR NT FlexShares Morningstar Natural Resources State Street GNR Stock Index
GMO: GMO Resources Strategy S&P Global Natural Resources Total Return Index
Annualized Performance 1/15 - 12/19 1/14 - 12/18 1/13 - 12/17 1/12 - 12/16 1/11 - 12/15 1/10 - 12/14 1/09 - 12/13 1/08 - 12/12 1/07 - 12/11 1/06 - 12/10Return Rank Return Rank Return Rank Return Rank Return Rank Return Rank Return Rank Return Rank Return Rank Return Rank
KBIGI: GRS --- --- --- --- --- --- --- --- --- --- --- --- --- --- --- --- --- --- --- ---Mellon GNR Equity 2.6 52 -1.7 84 4.2 9 2.7 12 -5.6 73 3.4 49 12.0 0 --- --- --- --- --- ---Wellington GNR 4.3 20 -3.3 87 1.2 46 -1.0 75 -10.0 100 -2.9 100 10.9 0 -4.9 100 1.3 88 10.2 0NT FlexShares Morningstar Natural Resources 4.8 15 -0.3 49 1.3 43 -0.4 72 --- --- --- --- --- --- --- --- --- --- --- ---State Street GNR Stock Index 1.0 97 -4.2 98 1.1 53 -0.5 73 -7.2 85 1.1 62 10.6 0 -3.0 100 2.1 64 7.9 13GMO: GMO Resources Strategy 10.8 0 2.9 8 5.4 8 2.1 16 --- --- --- --- --- --- --- --- --- --- --- ---S&P Global Natural Resources Total Return Index 4.8 15 -0.5 58 2.5 13 -0.2 72 -8.7 98 -1.5 98 7.0 100 -3.2 100 2.4 45 11.4 0eA Liquid Real Assets Median 2.6 50 -0.4 50 1.1 50 1.4 50 -1.6 50 3.4 50 8.8 50 -0.3 50 2.3 50 7.1 50
Manager Consistency - 5 Year Annualized Period Calculated Every 12 MonthsAs of December 2019 Benchmark: S&P Global Natural Resources Total Return Index Universe: eA Liquid Real Assets Universe Size: 36
45

Rolling 3 Year Excess Return
Excess Returns: 3 Year Rolling
-30
-25
-20
-15
-10
-5
0
5
10
15
20
Exce
ss A
nnua
lized
Ret
urn,
%
Dec 14 Mar 15 Jun 15 Sep 15 Dec 15 Mar 16 Jun 16 Sep 16
eA Liquid Real Assets Median
KBIGI: GRS Mellon GNR Equity Wellington GNR NT FlexShares Morningstar Natural ResourcesState Street GNR Stock Index GMO: GMO Resources Strategy
S&P Global Natural Resources Total Return Index
As of December 2019 Benchmark: S&P Global Natural Resources Total Return Index Universe: eA Liquid Real Assets Universe Size: 36
46
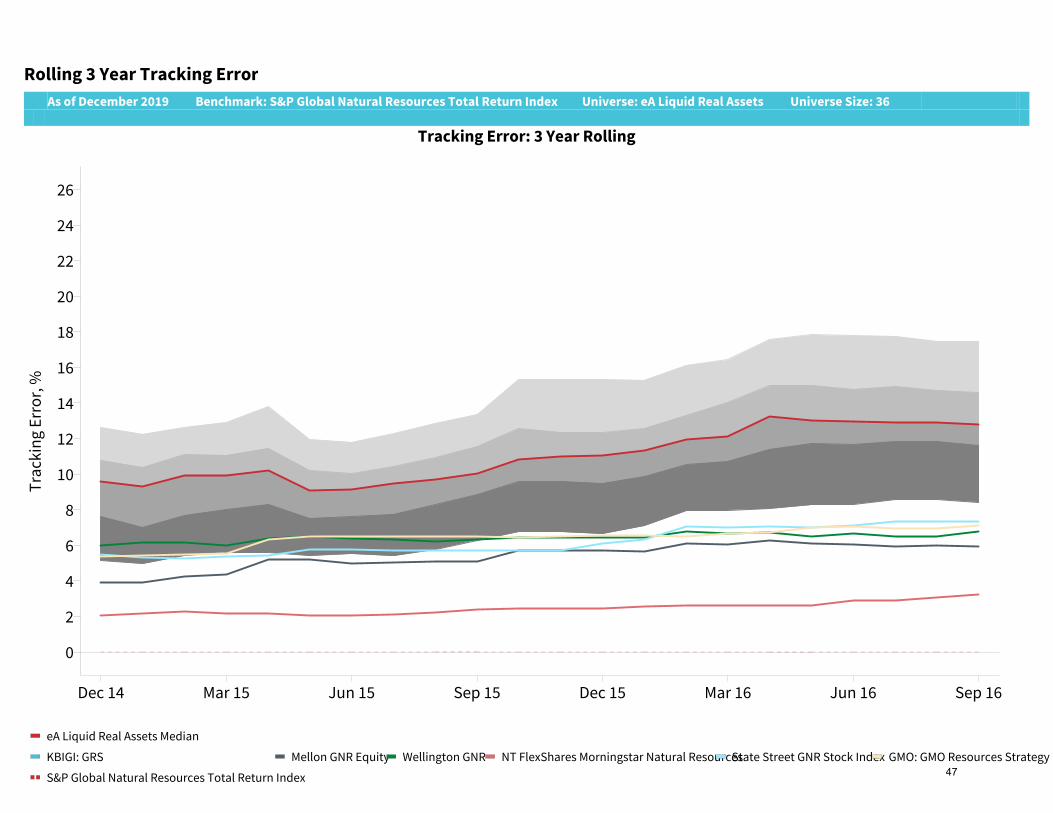
Rolling 3 Year Tracking Error
Tracking Error: 3 Year Rolling
0
2
4
6
8
10
12
14
16
18
20
22
24
26
Trac
king
Err
or, %
Dec 14 Mar 15 Jun 15 Sep 15 Dec 15 Mar 16 Jun 16 Sep 16
eA Liquid Real Assets Median
KBIGI: GRS Mellon GNR Equity Wellington GNR NT FlexShares Morningstar Natural ResourcesState Street GNR Stock Index GMO: GMO Resources Strategy
S&P Global Natural Resources Total Return Index
As of December 2019 Benchmark: S&P Global Natural Resources Total Return Index Universe: eA Liquid Real Assets Universe Size: 36
47

Up MktCap
Ratio, %
UpMkt
Months
Down MktCap
Ratio, %
DownMkt
MonthsKBIGI: GRS 76.80 22 49.65 14Mellon GNR Equity 96.30 22 116.02 14Wellington GNR 113.22 22 124.72 14NT FlexShares Morningstar Natural Resources87.10 22 81.70 14State Street GNR Stock Index 89.06 22 116.52 14GMO: GMO Resources Strategy 125.01 22 100.75 14S&P Global Natural Resources Total Return Index100.00 22 100.00 14eA Liquid Real Assets Median 37.57 22 25.74 14
Up MktCap
Ratio, %
UpMkt
Months
Down MktCap
Ratio, %
DownMkt
MonthsKBIGI: GRS --- --- --- ---Mellon GNR Equity 87.74 34 96.72 26Wellington GNR 112.60 34 113.27 26NT FlexShares Morningstar Natural Resources90.58 34 90.90 26State Street GNR Stock Index 90.50 34 105.35 26GMO: GMO Resources Strategy 130.98 34 106.04 26S&P Global Natural Resources Total Return Index100.00 34 100.00 26eA Liquid Real Assets Median 31.30 34 30.48 26
Up/Down Market Capture - Three and Five Year
Three Year Up/Down Market Capture Ratio
50
75
100
125
150
Up
Mkt
Cap
ture
Rat
io, %
50 75 100 125 150
Down Mkt Capture Ratio, %
Five Year Up/Down Market Capture Ratio
50
75
100
125
150
Up
Mkt
Cap
ture
Rat
io, %
50 75 100 125 150
Down Mkt Capture Ratio, %
eA Liquid Real Assets KBIGI: GRS Mellon GNR Equity Wellington GNR NT FlexShares Morningstar Natural Resources
State Street GNR Stock Index GMO: GMO Resources Strategy S&P Global Natural Resources Total Return Index
As of December 2019 Benchmark: S&P Global Natural Resources Total Return Index Universe: eA Liquid Real Assets Universe Size: 36
48

Up MktCap
Ratio, %
UpMkt
Months
Down MktCap
Ratio, %
DownMkt
MonthsKBIGI: GRS --- --- --- ---Mellon GNR Equity 92.90 46 91.64 38Wellington GNR 114.29 46 115.36 38NT FlexShares Morningstar Natural Resources90.66 46 92.48 38State Street GNR Stock Index 97.13 46 104.78 38GMO: GMO Resources Strategy 130.64 46 111.69 38S&P Global Natural Resources Total Return Index100.00 46 100.00 38eA Liquid Real Assets Median 36.87 46 35.77 38
Up/Down Market Capture - Seven and Ten Year
Up MktCap
Ratio, %
UpMkt
Months
Down MktCap
Ratio, %
DownMkt
MonthsKBIGI: GRS --- --- --- ---Mellon GNR Equity 94.69 65 90.48 55Wellington GNR 111.52 65 112.74 55NT FlexShares Morningstar Natural Resources--- --- --- ---State Street GNR Stock Index 99.75 65 101.75 55GMO: GMO Resources Strategy --- --- --- ---S&P Global Natural Resources Total Return Index100.00 65 100.00 55eA Liquid Real Assets Median 44.29 65 39.79 55
Seven Year Up/Down Market Capture Ratio
50
75
100
125
150
Up
Mkt
Cap
ture
Rat
io, %
50 75 100 125 150
Down Mkt Capture Ratio, %
Ten Year Up/Down Market Capture Ratio
50
75
100
125
150
Up
Mkt
Cap
ture
Rat
io, %
50 75 100 125 150
Down Mkt Capture Ratio, %
eA Liquid Real Assets KBIGI: GRS Mellon GNR Equity Wellington GNR NT FlexShares Morningstar Natural Resources
State Street GNR Stock Index GMO: GMO Resources Strategy S&P Global Natural Resources Total Return Index
As of December 2019 Benchmark: S&P Global Natural Resources Total Return Index Universe: eA Liquid Real Assets Universe Size: 36
49

AnnualizedReturn
AnnualizedStd. Dev.
KBIGI: GRS 11.77 13.02Mellon GNR Equity 4.01 16.73Wellington GNR 6.08 17.63NT FlexShares Morningstar Natural Resources 8.37 13.23State Street GNR Stock Index 2.30 16.66GMO: GMO Resources Strategy 13.52 17.01S&P Global Natural Resources Total Return Index 7.92 15.11eA Liquid Real Assets Median 5.33 7.01
AnnualizedReturn
AnnualizedStd. Dev.
KBIGI: GRS --- ---Mellon GNR Equity 2.56 17.02Wellington GNR 4.30 19.68NT FlexShares Morningstar Natural Resources 4.80 16.51State Street GNR Stock Index 1.01 18.48GMO: GMO Resources Strategy 10.83 20.71S&P Global Natural Resources Total Return Index 4.79 17.97eA Liquid Real Assets Median 2.58 7.80
Risk/Return - Three and Five Year
Three Year Risk/Return
0
2
4
6
8
10
12
14
Tota
l Ann
ualiz
ed R
etur
n, %
0 2 4 6 8 10 12 14 16 18
Total Annualized StdDev, %
Five Year Risk/Return
0
1
2
3
4
5
6
7
8
9
10
11
Tota
l Ann
ualiz
ed R
etur
n, %
0 2 4 6 8 10 12 14 16 18 20 22
Total Annualized StdDev, %
eA Liquid Real Assets KBIGI: GRS Mellon GNR Equity Wellington GNR NT FlexShares Morningstar Natural Resources
State Street GNR Stock Index GMO: GMO Resources Strategy S&P Global Natural Resources Total Return Index
As of December 2019 Benchmark: S&P Global Natural Resources Total Return Index Universe: eA Liquid Real Assets Universe Size: 36
50

AnnualizedReturn
AnnualizedStd. Dev.
KBIGI: GRS --- ---Mellon GNR Equity 2.64 15.62Wellington GNR 1.29 18.62NT FlexShares Morningstar Natural Resources 1.94 15.30State Street GNR Stock Index 0.32 17.31GMO: GMO Resources Strategy 5.69 19.39S&P Global Natural Resources Total Return Index 2.13 16.50eA Liquid Real Assets Median 1.60 7.73
AnnualizedReturn
AnnualizedStd. Dev.
KBIGI: GRS --- ---Mellon GNR Equity 3.00 17.74Wellington GNR 0.64 20.48NT FlexShares Morningstar Natural Resources --- ---State Street GNR Stock Index 1.07 19.09GMO: GMO Resources Strategy --- ---S&P Global Natural Resources Total Return Index 1.61 18.52eA Liquid Real Assets Median 3.20 9.69
Risk/Return - Seven and Ten Year
Seven Year Risk/Return
-2
0
2
4
6
8
10
Tota
l Ann
ualiz
ed R
etur
n, %
0 2 4 6 8 10 12 14 16 18 20
Total Annualized StdDev, %
Ten Year Risk/Return
0
2
4
6
Tota
l Ann
ualiz
ed R
etur
n, %
0 2 4 6 8 10 12 14 16 18 20 22
Total Annualized StdDev, %
eA Liquid Real Assets KBIGI: GRS Mellon GNR Equity Wellington GNR NT FlexShares Morningstar Natural Resources
State Street GNR Stock Index GMO: GMO Resources Strategy S&P Global Natural Resources Total Return Index
As of December 2019 Benchmark: S&P Global Natural Resources Total Return Index Universe: eA Liquid Real Assets Universe Size: 36
51

Sharpe Ratio
0.00.10.20.30.40.50.60.70.80.91.01.11.21.31.41.51.61.71.81.9
Information Ratio
-1.0
-0.5
0.0
0.5
1.0Tracking Error
0.0
2.0
4.0
6.0
8.0
10.0
12.0
14.0Excess Return
-6.0
-5.0
-4.0
-3.0
-2.0
-1.0
0.0
1.0
2.0
3.0
4.0
5.0
6.0Beta
0.0
2.0
KBIGI: GRS Mellon GNR Equity Wellington GNR NT FlexShares Morningstar Natural Resources State Street GNR Stock Index
GMO: GMO Resources Strategy S&P Global Natural Resources Total Return Index
Firm/Product SharpeRatio Rank Excess
Return % Rank TrackingError Rank Information
Ratio Rank Beta Rank
KBIGI: GRS 0.92 31 3.85 0 8.75 89 0.44 0 0.70 0Mellon GNR Equity 0.32 98 -3.90 77 4.01 100 -0.97 100 1.08 0Wellington GNR 0.42 95 -1.84 31 4.71 100 -0.39 82 1.13 0NT FlexShares Morningstar Natural Resources 0.67 57 0.45 9 2.88 100 0.16 4 0.86 0State Street GNR Stock Index 0.22 100 -5.62 98 5.63 100 -1.00 100 1.04 0GMO: GMO Resources Strategy 0.83 33 5.61 0 6.40 98 0.88 0 1.04 0S&P Global Natural Resources Total Return Index 0.58 81 0.00 10 0.00 100 --- --- 1.00 0eA Liquid Real Assets Median 0.71 50 -2.59 50 11.18 50 -0.28 50 0.35 50
Modern Portfolio Theory Statistics - Three YearAs of December 2019 Benchmark: S&P Global Natural Resources Total Return Index Universe: eA Liquid Real Assets Universe Size: 36
52

Sharpe Ratio
0.0
0.1
0.2
0.3
0.4
0.5
0.6
0.7
0.8Information Ratio
-1.0
-0.5
0.0
0.5
1.0Tracking Error
0.0
2.0
4.0
6.0
8.0
10.0
12.0
14.0
16.0
18.0Excess Return
-4.0
-3.0
-2.0
-1.0
0.0
1.0
2.0
3.0
4.0
5.0
6.0
7.0Beta
0.0
2.0
KBIGI: GRS Mellon GNR Equity Wellington GNR NT FlexShares Morningstar Natural Resources State Street GNR Stock Index
GMO: GMO Resources Strategy S&P Global Natural Resources Total Return Index
Firm/Product SharpeRatio Rank Excess
Return % Rank TrackingError Rank Information
Ratio Rank Beta Rank
KBIGI: GRS --- --- --- --- --- --- --- --- --- ---Mellon GNR Equity 0.23 78 -2.23 52 5.68 100 -0.39 97 0.90 0Wellington GNR 0.31 64 -0.49 20 5.53 100 -0.09 32 1.05 0NT FlexShares Morningstar Natural Resources 0.37 48 0.01 15 3.28 100 0.00 15 0.91 0State Street GNR Stock Index 0.14 98 -3.78 97 6.59 100 -0.57 100 0.96 0GMO: GMO Resources Strategy 0.60 19 6.04 0 6.56 100 0.92 0 1.10 0S&P Global Natural Resources Total Return Index 0.35 51 0.00 15 0.00 100 --- --- 1.00 0eA Liquid Real Assets Median 0.35 50 -2.21 50 12.64 50 -0.17 50 0.38 50
Modern Portfolio Theory Statistics - Five YearAs of December 2019 Benchmark: S&P Global Natural Resources Total Return Index Universe: eA Liquid Real Assets Universe Size: 36
53

Sharpe Ratio
0.0
0.1
0.2
0.3
0.4
0.5
0.6
0.7
0.8
Information Ratio
-0.5
0.0
0.5
1.0Tracking Error
0.0
2.0
4.0
6.0
8.0
10.0
12.0
14.0
16.0Excess Return
-3.0
-2.0
-1.0
0.0
1.0
2.0
3.0
4.0
5.0
6.0
7.0Beta
0.0
2.0
KBIGI: GRS Mellon GNR Equity Wellington GNR NT FlexShares Morningstar Natural Resources State Street GNR Stock Index
GMO: GMO Resources Strategy S&P Global Natural Resources Total Return Index
Firm/Product SharpeRatio Rank Excess
Return % Rank TrackingError Rank Information
Ratio Rank Beta Rank
KBIGI: GRS --- --- --- --- --- --- --- --- --- ---Mellon GNR Equity 0.24 54 0.51 18 5.35 100 0.10 11 0.90 0Wellington GNR 0.16 68 -0.84 62 5.76 100 -0.15 77 1.08 0NT FlexShares Morningstar Natural Resources 0.20 60 -0.19 38 3.00 100 -0.06 63 0.91 0State Street GNR Stock Index 0.10 76 -1.81 78 6.38 100 -0.28 87 0.98 0GMO: GMO Resources Strategy 0.38 24 3.56 8 6.46 100 0.55 0 1.11 0S&P Global Natural Resources Total Return Index 0.21 57 0.00 25 0.00 100 --- --- 1.00 0eA Liquid Real Assets Median 0.25 50 -0.53 50 11.66 50 -0.04 50 0.36 50
Modern Portfolio Theory Statistics - Seven YearAs of December 2019 Benchmark: S&P Global Natural Resources Total Return Index Universe: eA Liquid Real Assets Universe Size: 36
54

Returns Based Style Analysis and Excess Returns Correlation
Style Analysis - 3 Year Average
S&P GSCI Agricultural Index S&P GSCI Energy Index
S&P GSCI Industrial Metals Index
S&P GSCI Livestock Index
S&P GSCI Precious Metals Index
S&P GSCI Commodity Sub-IndexesKBIGI: GRSMellon GNR EquityWellington GNRNT FlexShares Morningstar Natural ResourcesState Street GNR Stock IndexGMO: GMO Resources Strategy
ExcessCorrelation: Jan-17
-Dec-19
KBIGI:GRS
MellonGNR
Equity
WellingtonGNR
NT FlexSharesMorningstar
NaturalResources
StateStreet
GNR StockIndex
GMO:GMO
ResourcesStrategy
KBIGI: GRS 1.00 -0.05 -0.38 0.44 0.03 -0.24Mellon GNR Equity -0.05 1.00 0.48 -0.06 0.21 -0.07Wellington GNR -0.38 0.48 1.00 -0.06 0.56 0.12NT FlexShares Morningstar Natural Resources 0.44 -0.06 -0.06 1.00 -0.06 0.04State Street GNR Stock Index 0.03 0.21 0.56 -0.06 1.00 -0.37GMO: GMO Resources Strategy -0.24 -0.07 0.12 0.04 -0.37 1.00
As of December 2019 Benchmark: S&P Global Natural Resources Total Return Index Universe: eA Liquid Real Assets Universe Size: 36
55

Returns Based Style Analysis and Excess Returns Correlation
Style Analysis - 5 Year Average
S&P GSCI Agricultural Index S&P GSCI Energy Index
S&P GSCI Industrial Metals Index
S&P GSCI Livestock Index
S&P GSCI Precious Metals Index
S&P GSCI Commodity Sub-IndexesKBIGI: GRSMellon GNR EquityWellington GNRNT FlexShares Morningstar Natural ResourcesState Street GNR Stock IndexGMO: GMO Resources Strategy
ExcessCorrelation: Jan-15
-Dec-19
KBIGI:GRS
MellonGNR
Equity
WellingtonGNR
NT FlexSharesMorningstar
NaturalResources
StateStreet
GNR StockIndex
GMO:GMO
ResourcesStrategy
KBIGI: GRS --- --- --- --- --- ---Mellon GNR Equity --- 1.00 0.20 0.25 0.21 -0.12Wellington GNR --- 0.20 1.00 0.16 0.63 0.36NT FlexShares Morningstar Natural Resources --- 0.25 0.16 1.00 0.18 0.06State Street GNR Stock Index --- 0.21 0.63 0.18 1.00 -0.01GMO: GMO Resources Strategy --- -0.12 0.36 0.06 -0.01 1.00
As of December 2019 Benchmark: S&P Global Natural Resources Total Return Index Universe: eA Liquid Real Assets Universe Size: 36
56

3 Year Distribution of Returns
0
5
10
Freq
uenc
y
0
5
10
Freq
uenc
y
0
5
10
Freq
uenc
y
0
5
10
Freq
uenc
y
0
5
10
Freq
uenc
y
0
5
10
Freq
uenc
y
-11.00 -8.00 -6.00 -4.00 -2.00 0.00 2.00 4.00 6.00 8.00 10.00 12.00
Monthly Returns
KBIGI: GRS Mellon GNR Equity Wellington GNR NT FlexShares Morningstar Natural Resources State Street GNR Stock Index
GMO: GMO Resources Strategy
As of December 2019 Benchmark: S&P Global Natural Resources Total Return Index Universe: eA Liquid Real Assets Universe Size: 36
57

5 Year Distribution of Returns
0
5
10
Freq
uenc
y
0
5
10
Freq
uenc
y
0
5
10
Freq
uenc
y
0
5
10
Freq
uenc
y
0
5
10
Freq
uenc
y
0
5
10
Freq
uenc
y
-11.00 -8.00 -6.00 -4.00 -2.00 0.00 2.00 4.00 6.00 8.00 10.00 12.00 14.00
Monthly Returns
KBIGI: GRS Mellon GNR Equity Wellington GNR NT FlexShares Morningstar Natural Resources State Street GNR Stock Index
GMO: GMO Resources Strategy
As of December 2019 Benchmark: S&P Global Natural Resources Total Return Index Universe: eA Liquid Real Assets Universe Size: 36
58