board increases dividend for 38th consecutive year key€¦ · 19 financial review management...
TRANSCRIPT

KeyKeyBOARD INCREASES DIVIDEND FOR 38TH CONSECUTIVE YEAR
2002 KeyCorp Annual Report
AlignedtoWINKEY FOCUSES ON BECOMING CLIENTS’ TRUSTED ADVISOR
Also�
Solid ProgressThree reasons why investors should be confident about Key’s future
THE ‘WHO, WHAT& WHY’ OF UNDERSTANDING CLIENTS BETTER
NEXT PAGE

Key, whose roots date to 1825, has become one of
America’s largest banks. The company’s strong
relationship orientation is expressed best by its
mission, “to be our clients’ trusted advisor.”
In 2002, Key delivered solid financial results, due
largely to strategic actions taken since May 2001
to sharpen its business focus and strengthen its
financial performance. Despite a difficult year for
the economy and financial markets, the total return
on Key’s shares was more than 8 percent. In contrast,
the total return on shares of companies making up
the Standard & Poor’s 500 Index was approximately
negative 22 percent.
In January 2003, Key’s Board of Directors increased
the company’s dividend for the 38th consecutive
year, a record few other companies can match.
dollars in millions, except per share amounts 2002 2001 2000
YEAR ENDED DECEMBER 31,
Total revenue $ 4,518 $ 4,550 $ 4,924
Noninterest expense 2,653 2,941 2,917
Provision for loan losses 553 1,350 490
Net income 976 132 1,002
PER COMMON SHARE
Net income $ 2.29 $ .31 $ 2.32
Net income – assuming dilution 2.27 .31 2.30
Cash dividends paid 1.20 1.18 1.12
Book value at year end 16.12 14.52 15.65
Market price at year end 25.14 24.34 28.00
Weighted average common shares (000) 425,451 424,275 432,617
Weighted average common shares
and potential common shares (000) 430,703 429,573 435,573
AT DECEMBER 31,
Loans $62,457 $63,309 $66,905
Earning assets 73,635 71,672 77,316
Total assets 85,202 80,938 87,270
Deposits 49,346 44,795 48,649
Total shareholders’ equity 6,835 6,155 6,623
Common shares outstanding (000) 423,944 424,005 423,254
PERFORMANCE RATIOS
Return on average total assets 1.19% .16% 1.19%
Return on average equity 14.96 2.01 15.39
Net interest margin (taxable equivalent) 3.97 3.81 3.69
The Solution is Key
FINANCIAL HIGHLIGHTS
What do you think of this Annual Report? Through May 31, 2003, visit Key.com/IR
or call (800) 539-4164 to share your opinion.
Keys to the solution: a diverse pool of talented employees.
NEXT PAGEPREVIOUS PAGE SEARCH

NEXT PAGEPREVIOUS PAGE SEARCH
CONTENTS
9 Bucking the TrendUnlike many other investors in 2002, thoseholding Key’s shares enjoyed a positivereturn and a high dividend.
10 Key In PerspectiveAn easy-to-read guide that describes Key’slines of business.
12 Work of ArtEmployees line upbehind a shared goal:helping Key becomeclients’ trusted advisor.
13 Getting to Know YouAn advance in its segmenta-tion abilities is helping Keydevelop a comprehensiveunderstanding of clients so itcan serve them better.
16 No Stone UnturnedContinuous improvement has become a way of life at Key.
17 Having Their SayEmployees share how they feel aboutworking at Key.
18 Causing a Good EffectThe adoption of a balancedscorecard should help Keybetter execute its strategy.
19 Financial ReviewManagement discusses and analyzes Key’sfinancial condition and the results of itsoperations.
2 Comment from the Chairman and CEO Henry Meyer describes the importance of alignment to Key’s mission of becoming clients’ trusted advisor.
4 Solid Progress In 2002, Key continued its turnaround. Looking ahead: three valuable qualities that will give the company a competitive edge.
Key discusses its future performance throughout this report.While management strives to be as accurate as possible,its projections may prove to be inaccurate. Please refer toKey’s forward-looking statement disclosure on page 21.It identifies factors that could cause actual results to differmaterially from those discussed.
On the cover: Ducks in a row is an apt metaphor for the “alignment” theme of this year’s annual report. This image also conveys the deliberate, caring and patient craftsmanship that defines Key’s ongoing efforts to enhance the value it delivers to clients. The ducks weremade by world-class carver Mark Costilow of Amherst, Ohio, pictured on page 12.
Unwavering confidence: Meyer believes Key’s future is bright.
GOGO GO
GO
GO
GO
GOGO
GO
GO

KEYCORP BOARD OF DIRECTORS
CECIL D. ANDRUSChairman, Andrus Center for Public Policy
WILLIAM G. BARES Chairman and Chief Executive Officer, The Lubrizol Corporation
EDWARD P. CAMPBELL President and Chief Executive Officer, Nordson Corporation
DR. CAROL A. CARTWRIGHTPresident, Kent State University
ALEXANDER M. CUTLER Chairman and Chief Executive Officer, Eaton Corporation
HENRY S. HEMINGWAY President, Hemingway Enterprises, Inc.
CHARLES R. HOGAN President, Citation Management Group, Inc.
SHIRLEY A. JACKSON, PH.D. President, Rensselaer Polytechnic Institute
DOUGLAS J. MCGREGOR Senior Advisor, Blue Point Capital
EDUARDO R. MENASCÉ President, Verizon Enterprise Solutions Group
HENRY L. MEYER III Chairman and Chief Executive Officer, KeyCorp
STEVEN A. MINTER President and Executive Director, The Cleveland Foundation
BILL R. SANFORD Chairman, SYMARK LLC
THOMAS C. STEVENS Vice Chairman, Chief Administrative Officer and Secretary, KeyCorp
DENNIS W. SULLIVAN Executive Vice President, Parker Hannifin Corporation
PETER G. TEN EYCK, II President, Indian Ladder Farms
Key welcomed Eduardo R. Menascé toits Board of Directors in July 2002.President of Verizon EnterpriseSolutions, a division of VerizonCommunications, Mr. Menascé has along and distinguished record of makingsignificant operational and financialimprovements to several consumer- and
technology-oriented businesses. Key will benefit from hisproven track record in highly competitive environments.
Key
Two thousand two was not a greatyear for the financial servicesindustry. Credit costs were high.
Interest rates were the lowest in decades.Uncertainty about the economy andfinancial markets kept investors on thesidelines. Stock prices treaded water.
The bright side? Short-term, it’sthat the economy will recover even-tually, restoring the industry’s financial luster, particularlyfor stronger, well-capitalized banks such as Key.
Yet there’s a longer-term opportunity that excitesme – one associated with the industry’s extended marchtoward modernization. It’s a movement away from anobsession with selling products to one that emphasizesmeeting client needs.
I want Key to be at the forefront of this movement bybecoming a trusted advisor that anticipates clients’ needsand delivers comprehensive solutions.
To achieve this goal, Key needs to operate differently,a process that’s been under way since I became chairmanand CEO nearly two years ago. I think of the changeswe’re making in terms of alignment. Alignment mattersbecause it simplifies everything we do, making it easierfor us to fulfill our trusted advisor mission.
Alignment means that employees share the samepriorities. That they consistently create value using com-mon business tactics, such as knowing our clients andmarkets better than competitors do theirs, and providingexcellent service. And that every employee is held account-able for honoring Key’s commitments.
Our theme for this report, then, is alignment. Thereport is written once again in a magazine-style format.We believe that style makes it easier to learn more aboutKey, particularly for our retail investors, who constituteabout half of our shareholder base. We invite all readersof the report to share their opinions about it. To doso, visit Key.com/IR or call (800) 539-4164 throughMay 31, 2003.
I’m optimistic that Key is headed in the right direction;the articles that follow describe the reasons.
COMMENTfrom the Chairman and CEOHenry L. Meyer III Key
2002 KeyCorp Annual Report
Aligning Key
KeyCorp, Corporate Headquarters: 127 Public Square, Cleveland, OH44114-1306; (216) 689-6300. KeyCorp Investor Relations: 127 PublicSquare, Cleveland, OH 44114-1306; (216) 689-4221. Online:www.key.com for product, corporate and financial information and newsreleases. Transfer Agent/Registrar and Shareholder Services:Computershare Investor Services, Attn: Shareholder Communications,P.O. Box A3504, Chicago, IL 60690-3504; (800) 539-7216.
2 NEXT PAGEPREVIOUS PAGE SEARCH BACK TO CONTENTS

NEXT PAGEPREVIOUS PAGE SEARCH BACK TO CONTENTS
To evaluate the risk-return potential and credit worthiness of
bonds, you need to dive deep into fixed income analysis and
fundamental research. Fortunately, we've done it for you. Guided
by disciplined investment management, the Victory Intermediate
Income portfolio seeks to control risk and deliver steady,
competitive returns. For a high-quality bond portfolio that
invests only in investment grade bonds and securities issued
by the U.S. government, don't look any further.
The value of a fixed income portfolio isn’t clearuntil you look below the surface.
Victory Intermediate Income –discover in-depth risk control.
To learn more about our Intermediate Fixed Income management, contact Victory Capital Management at 1-877-660-4400 or VictoryConnect.com.
Victory Capital Management Inc. is a member of the Key financial network.
• NOT FDIC INSURED • NO BANK GUARANTEE • INVESTMENTS MAY LOSE VALUE

Three valuable qualities give Key a competitive edge:
INTEGRITY, CLIENT FOCUS, ALIGNMENT
Solid Solid
4 NEXT PAGEPREVIOUS PAGE SEARCH BACK TO CONTENTS

5 NEXT PAGEPREVIOUS PAGE SEARCH BACK TO CONTENTS
Key is solidly on the road to recov-ery,” says CEO Henry Meyer. “Ibelieve our future is bright.”
The total return on the company’sshares, which includes price apprecia-tion and dividend payments, was morethan 8 percent in 2002. In contrast,the total return on shares making upthe Standard & Poor’s 500 Banks Indexwas negative 1 percent, while that onshares making up the Standard &Poor’s 500 Index was approximatelynegative 22 percent (see “Bucking theTrend,” page 9).
In 2002, Key earned $976 million,or $2.27 per diluted common share.Much of that performance was drivenby strong expense control, long a Keypriority. In fact, the company’s 2002
expenses were at their lowest level since1998 (see chart below).
“But, like banks everywhere, Keysuffered the ongoing effects of prolongedeconomic sluggishness,” says Meyer.“Our top priority continues to begrowing revenues, but it’s very difficultunder such conditions.”
Industry-wide, commercial loans fell7 percent in 2002. Consumer borrow-ing fared better, buoyed by the lowestinterest rates in decades. Key’s netinterest margin of 3.97 percent isnotable, the result of efforts begun in2001 to prune low-return loans andin 2002 to reduce funding costs (seecharts below).
Banks also experienced light clientdemand for capital markets-based prod-
ucts and services, especially brokerageand asset management.
Moreover, Key continued to focusintensely on credit quality. The com-pany’s net loan charge-offs to averageloans in 2002 was 1.23 percent, whichis high by Key’s standards.
“Fortunately, that performance isboth atypical for Key and temporary,”notes Kevin Blakely, the company’schief risk management officer. “We’remaking good progress in restoring thequality of our loan book.”
Blakely refers specifically to Key’scommercial run-off portfolio, whichwas established in May 2001 to house$2.7 billion in commitments that Keywanted to exit. Most were non-rela-tionship, credit-only accounts that were
1998 1999 2000 2001 2002
$2,508
$3,070$2,917 $2,941
$2,653
STRONG COST CONTROL
Noninterest Expense
in millions
6/30/0150
$70
12/31/01 12/31/02
55
60
65
HIGHER-RETURN LOAN MIX
Total Loans
in billions
12/31/000%
20%
40%
60%
80%
100%
12/31/01 12/31/02$38.0
$39.5
$41.0
IMPROVED FUNDING POSITION
Core Deposit Mix and Growth
dollars in billions
■ Time Deposits Under $100,000■ Interest Bearing Deposits ■ Noninterest Bearing Deposits
–Deposit Growth (right-hand scale)
Total loans, excluding Key’s de-emphasized autoand run-off portfolios, grew more than 1 percentin 2002, after shrinking approximately 7 percent(annualized) in the second half of 2001. Higher netinterest spread assets, principally home equityloans, have grown nearly 20 percent (annualized)since June 30, 2001.
Core deposits grew nearly 6 percent in 2002,compared with a slight drop in 2001. Importantly,the mix shifted from more expensive timedeposits, which fell to 29 percent of core depositsin 2002. They were 39 percent of core depositsin 2000.
■ De-emphasized Automobile Leasing Portfolio■ Commercial Run-Off Portfolio ■ Core Loan Portfolio
Noninterest expense declined 14 percentbetween 1999 and 2002, a result of a corpo-ratewide initiative designed to improve Key’scompetitiveness. Begun in November 1999 andcompleted in March 2002, the initiative alsogave rise to Key’s ongoing culture of continuousimprovement.
“
PROGRESSPROGRESS

6 NEXT PAGEPREVIOUS PAGE SEARCH BACK TO CONTENTS
deemed excessively risky or low-return.As of December 31, 2002, managershad whittled the portfolio to $940million in commitments (including$599 million in outstandings).
Also in May 2001, Key announcedthat it would exit the automobile leasingbusiness and scale back automobilelending to its franchise markets; sincethen, the company has reduced the size ofits automobile portfolio by $2.3 billion.
Both moves reflect the company’sdesire to focus less on transactionalbusiness and more on building deeperrelationships with clients.
“We’re not out of the woods yet,”cautions Blakely. “Many of our corpo-rate clients and small-business borrowerscontinue to struggle with an unforgivingeconomy.”
Meyer, a 30-year veteran of thebanking industry, has seen economiccycles before. “The economy willrebound,” he says. “When it does, Keywill benefit from improving creditquality. Key also will be there to serveclients, particularly companies, whichare becoming leaner and more compet-itive in these tough times.”
But an improvement in Key’s per-formance does not depend exclusivelyon an improving economy. Thecompany also has valuable qualitiesthat will give it a competitive edge.One is unshakable integrity–an absoluterequirement for success. The second isa clear mission to serve clients bybecoming their trusted advisor. The thirdis the growing ability of the entire organ-ization to rally behind that mission.
Integrity – A Business ImperativeShortly after the 1994 merger of
Albany-based KeyCorp with Cleveland-based Society Corporation, the com-pany’s leaders hammered out corevalues for the newly combined company.They debated all but one choice. Thenas now, integrity was recognized imme-diately and unanimously as essential.
That integrity matters has becomepainfully obvious in light of the recent
string of corporate scandals that has sodamaged investor confidence, compro-mised the stock market and slowed theeconomy’s recovery. Sobering statisticsabound.• A January 2002 Business Week/Harris
poll noted that nearly 80 percent ofthose surveyed said that the CEOs oflarge companies put their own interestsahead of workers’ and shareholders’.
• More than 80 percent of those sur-veyed in May 2002 by the Galluporganization rated the state of moralvalues in the U.S. today as fair or poor.Two-thirds said it was getting worse.
• And two-thirds of wealthy Americansstated that they don’t trust the man-agement of publicly traded corpora-tions. That from a survey released inJune 2002 by U.S. Trust, an investmentmanagement and trust company.
Fortunately, Key’s integrity is strong.This past summer, for instance,Prudential Financial conducted a studyon corporate governance. It examinedboard independence, board accounta-bility and external audit practices at33 of the nation’s large-cap banks.Key’s rank? Number one.
Key also upholds integrity inaccounting (see box below) and con-tinues to enhance its financial reportingpractices. “We keep at it because webelieve that the more investors knowabout Key, the more they will valuethe company,” says Chief FinancialOfficer Jeff Weeden, who joined thecompany in September.
“Bank financial statements can becomplex, and we recognize that theydon’t always make for light reading.But we continually work to provideshareholders with more informationand analysis that also is easy to under-stand.
“Two years ago, we adopted a ‘plainEnglish’ format for our Annual Report;that’s an example of such work. So isour introduction in 2002 of financialreporting on our 10 lines of business.”
In addition, Key’s CompensationCommittee recognizes the importanceof aligning management’s interests withthose of the company’s shareholders.Starting in 2002, long-term incentivecompensation for the company’sexecutives is payable in restricted stock,instead of cash. In addition, stock own-ership requirements for Meyer wereincreased to six times his base salaryfrom five, even though the latter iscustomary for Fortune 500 CEOs.Requirements for other senior execu-tives were increased as well; plus,Meyer and those reporting directly tohim must retain for at least one year100 percent of the net proceeds – aftertaxes and exercise price – of any stockoptions exercised.
Moreover, the Board continued torefine its corporate governance practices,acting in many cases ahead of require-ments arising from the Sarbanes-Oxley
“Our company will:
• comply with Generally Accepted Accounting Principles,
• emphasize the substance of economic transactions, not just be ‘technically correct,’
• use accounting techniques that reflect prevailing practices in our industry,*
• make conservative assumptions,
• apply accounting principles consistentlythroughout Key,
• disclose all material information, even if it’s bad, and
• never change our accounting practices to ‘make our numbers.’
…integrity is the cornerstone of our reputation.”
*Key announced on October 17 that it would begin
expensing stock options starting in 2003.
NON-NEGOTIABLEExcerpt from a memo by Meyer to Key’s
Executive Council in August 2002
Key’s rock-solid integrity should appeal
to clients as well.

7 NEXT PAGEPREVIOUS PAGE SEARCH BACK TO CONTENTS
Act and new New York Stock Exchangelisting standards.
So what’s integrity worth? Statisticsare hard to come by, but surveys con-ducted a few years ago by consultingfirm McKinsey & Company and theInstitutional Investor Institute foundthat investors were willing to pay anaverage premium of 13 percent forgood governance. Today’s scandal-waryinvestors may consider that a bargain.
Key’s rock-solid integrity shouldappeal to clients as well. So Key isbuilding on its reputation and offeringclients a better way to achieve theirgoals. That way is the second of thecompany’s valuable qualities. It involvesbeing clients’ trusted advisor.
Trusted Advisor – A Better WayFor decades, financial services in
the U.S. were delivered primarily byproduct-oriented firms such as banks,brokerage houses and insurers. Clientsshuttled among them, assembling solu-tions that met their financial needs.Doing so was the result of Depression-era laws that divided the financialservices industry into a series of separateproduct suppliers.
Those laws, long outdated, finallygave way to regulatory reform in 2000.Now, financial services companies canprovide clients with multiple productsoffered through sophisticated distribu-tion channels.
The task for such companies is toalign their resources around clientsrather than products, and to commu-nicate that they’re in “the financialsolutions business,” as Key calls it.
That’s precisely how Key spent muchof 2002.
Alignment – Pulling It All TogetherOne of Meyer’s important moves
was to revamp his senior leadershipteam (see box at right).
Another was to work with all of thecompany’s leaders to identify the busi-ness tactics needed to fulfill Key’strusted advisor mission, and deliver on
them through consistent execution.The tactics:• Know our clients and markets,• develop profitable relationships,• achieve service excellence,• manage business risks,• leverage technology,• continuously improve and• build human capital.
While all are common sense, mostpeople struggle to identify a singlefinancial services company that todaydoes even half of them well. “Peoplehave to think long and hard to come upwith a name – a good indication that theopportunity we see is large,” says Meyer.
Some of the tactics, such as providingexcellent service, benefit clients directly.Others, such as managing businessrisks, ensure that Key is run safely andefficiently; they provide an indirectclient benefit. All of them, done well,will lead to improved financial results.
Having agreed on the “how to’s,”Key’s leaders have begun workingwithin and across their organizations toalign what they do – the third of Key’svaluable qualities – with Key’s trustedadvisor mission.
Organization realignments wereamong the more immediate and visibleimprovements. For instance, to betterserve institutional clients, Key’s corpo-rate bankers and investment bankersare being united in one organization,under the direction of Tom Bunn.Similarly, affluent clients will benefitfrom Key’s union of private bankersand stockbrokers under Bob Jones. Both
KEY’S NEWEST SENIOR LEADERSTHOMAS W. BUNN joined Key in March 2002 to lead its Corporate Finance group. He drawson extensive experience in corporate and invest-ment banking, most recently at Bank of America.
RICHARD J. BUONCORE and ROBERT G. JONESbegan reporting directly to Meyer in 2002.Buoncore, head of Victory Capital Management,is a veteran of the asset management business.Jones, head of McDonald Financial Group, hassuccessfully led multiple large-scale changeprograms at Key.
JEFFREY B. WEEDEN joined Key in September2002 as its chief financial officer. His conservativeaccounting philosophy is consistent with Key’sand he has a deep knowledge of the financialservices industry.
Different jobs, same mission:newcomers Weeden (left)and Bunn are focused onaligning Key around clients.

8 NEXT PAGEPREVIOUS PAGE SEARCH BACK TO CONTENTS
moves represent a desire to continuefocusing and simplifying the business tobetter serve clients and increaseaccountability.
Equally important was Key’s decisionto focus acquisition activity on its corebusinesses. For instance, Key purchasedUnion Bankshares, Ltd. in Denver, itsfirst bank acquisition in seven years.
The transaction signaled Key’s intentionto invest in deposit-rich franchises thatbuild market share. The company alsobought Conning Asset Management ofHartford, CT, to expand the solutionsKey provides to selected commercialreal estate clients.
(To learn more about Key’s businesstactics and alignment actions, see“Work of Art,” page 12.)
In addition, Key introduced a toolcalled a balanced scorecard to ensurethat managers follow through on theirefforts to align around clients (see“Causing a Good Effect,” page 18).“The scorecard is how we will measurethe company’s performance from nowon,” Meyer notes.
Finally, Key unveiled in September amarketing campaign, “The Solution isKey,” to help clients begin viewing thecompany as their trusted advisor.
Key – Committed to InvestorsKey made progress in 2002 to restore
its credibility with the investmentcommunity.
On January 1, 2002, only four secu-rities firms had “buy” recommendationson the company’s stock. By year’s end,that number had doubled.
Meyer recognizes that to continuethis progress Key must demonstrate anongoing ability to grow revenues,deliver on its financial commitments,maintain its focus on its core relationshipbusinesses and tightly control expenses.
Looking ahead, Key’s near-termpriorities are clear. “The company iscommitted to maintaining tight controlof expenses,” Meyer explains. “Whilealways important, it is especially sowhile the economy remains challenged,which is my expectation for 2003. Wealso will continue to restore the com-pany’s historically sound credit quality.
“Revenue growth is essential toachieve the bright future we aspire to,”says Meyer.
To ensure continued progress, Keyexpects to make ongoing investments inits 12-state franchise, which is servedby the company’s six “footprint”businesses, and in its four nationalbusinesses, to the extent that they haveopportunities for scale and competi-tiveness. (Key In Perspective, on pages10-11, describes the company’s 10 busi-nesses.) Investments will center onhelping Key establish or expandprofitable relationships with clients – bybecoming their trusted advisor. �
“An early-stage turnaround story, Key has:
• renewed its strategic focus on relationship banking;
• returned to a more conservative credit culture;
• strong national lending franchises, i.e.,Key Equipment Finance and Key Commercial Real Estate, which should help fuel revenuegrowth when the economy rebounds;
• an appetite for acquisitions that improve the company’s deposit-taking ability andexpand its presence in attractive markets;
• streamlined its organization and proven it can contain costs and
• a new executive management team.”
AN ANALYST’S VIEW OF KEYExcerpt of report from Dennis Klaeser,
of securities firm Robert W. Baird, which initiated coverage of Key on October 10

–35
0
+25
12/31/01 12/31/02
Key
S&P 500Banks
S&P 500
The year just past was dreadful forinvestors. A prolonged economic slump,a slew of corporate misdeeds and talkof war exacted a heavy toll; the totalreturn on shares of companies makingup the Standard & Poor’s 500 Index was approximately negative 22 percent.
Banking industry fundamentals, such as strong capital levels and a tradition of paying dividends, provided someprotection to investors in bank shares.In fact, the industry earned record profits of more than $105 billion in 2002.Still, the total return on shares of banksmaking up the Standard & Poor’s 500Banks Index finished the year in negativeterritory.
Key, whose turnaround continued in2002, bucked the negative-returnstrend. The total return on Key’s shareswas more than 8 percent. �
2002 TOTAL RETURN
Key’s dividend has risen for each of the last 38 years. The company’sdividend yield was 4.77 percent as of year end, which ranks amongthe banking industry’s leaders.
TRENDBucking the
TRENDBucking the
Key posts positive returns in sobering times
$0.56$0.64
$0.72 $0.76$0.84
$0.94$1.04
$1.12$1.18 $1.20 $1.22
93 94 95 96 97 98 99 00 01 02 03T
KEY’S STRONG DIVIDEND RECORD
9 NEXT PAGEPREVIOUS PAGE SEARCH BACK TO CONTENTS

10 NEXT PAGEPREVIOUS PAGE SEARCH BACK TO CONTENTS
HIGH NET WORTH professionals offer banking; estate, financial and retirement planning; brokerage;trust services; asset management; insurance services and charitable giving counsel to affluent familiesand individuals. Line does business as McDonald Financial Group.
• Third among regional peers in productivity (revenue generated on investment products and services per sales professional)
CAPITAL MARKETS professionals offer investment banking, capital raising, hedging strategies, trading and financial strategies to public and privately held companies, institutions and governmentorganizations.
• Third largest mergers and acquisitions advisor to the U.S. banking and thrift industries (number of transactions)
VICTORY CAPITAL MANAGEMENT professionals manage or advise investment portfolios, on a national basis, for corporations, labor unions, not-for-profit organizations, governments andindividuals – in separate accounts, commingled funds and the Victory family of mutual funds.
• Thirteenth largest investment manager affiliated with a U.S. bank (assets under management)
CORPORATE BANKING professionals provide financing, cash and investment management andbusiness advisory services to mid-sized public and privately held companies and large corporations.
• Nation’s 12th largest commercial and industrial lender (outstandings)
NATIONAL COMMERCIAL REAL ESTATE professionals advise commercial real estate developers,mortgage brokers and owner-investors who seek bank and capital markets financing, asset and cashmanagement, deposits, loan sales and syndications, and other financing and advisory services. They provide construction and interim lending, permanent debt placements and servicing, and equityand investment banking services through a single point of contact. Line does business as KeyBank Real Estate Capital.
• Nation’s 6th largest commercial real estate lender (annual financings)
NATIONAL EQUIPMENT FINANCE professionals meet the equipment financing needs of a wide rangeof companies nationally and provide equipment manufacturers, distributors and resellers globally withequipment financing options for their business clients. Line does business as Key Equipment Finance.
• Sixth largest equipment financing company affiliated with a U.S. bank (net assets)
RETAIL BANKING professionals serve as trusted advisors, providing individuals with comprehensivedeposit, investment and credit products, such as home equity loans, and personal finance solutionsthrough a multi-channel delivery network.
• Nation’s 10th largest ATM network and 12th largest branch network (number of ATMs and branches); nation’s 10th largest home equity lender (outstandings)
SMALL BUSINESS professionals build relationships with their small-business clients to understandtheir challenges and help them achieve their business goals by offering a complete range of products,services and solutions.
• Nation’s 10th largest lender to small businesses (loan balances)
INDIRECT LENDING professionals make automobile and marine loans to consumers through dealers,and finance dealer inventory of automobiles and water craft. For students and their parents, theyprovide federal and private education loans and interest-free payment plans.
• Nation’s largest marine lender (new and used boat sales); nation’s 5th largest holder of federal education loans and 5th largest provider and servicer of private education loans (outstandings)
NATIONAL HOME EQUITY professionals offer individuals prime and less-than-prime mortgage andhome equity loan products for a variety of reasons, including debt consolidation and purchasing or refinancing a home. They also work with mortgage brokers and home improvement contractors to provide home equity and home improvement solutions in more than 40 states.
KEYConsumer BankingJack L. Kopnisky, President
RETAIL BANKINGSMALL BUSINESSINDIRECT LENDINGNATIONAL HOME EQUITY
KEYCorporate FinanceThomas W. Bunn, President
CORPORATE BANKING
NATIONAL COMMERCIAL REAL ESTATE
NATIONAL EQUIPMENTFINANCE
KEYCapital Partners
HIGH NET WORTHCAPITAL MARKETSRobert G. Jones, President
VICTORY CAPITALMANAGEMENTRichard J. Buoncore, President
Key In Perspective Lines of Business

11 NEXT PAGEPREVIOUS PAGE SEARCH BACK TO CONTENTS
in millions
RevenueNet interest income (taxable equivalent) ...$ 1,805Noninterest income............................ 497Total revenue (taxable equivalent) ............. 2,302
Net Income ..........................................$ 422
Average BalancesLoans .................................................$27,806Total assets ........................................ 29,970Deposits............................................. 33,942
in millions
Total Trust and Brokerage Assets $126,600
RevenueNet interest income (taxable equivalent).....$ 235Noninterest income............................. 874Total revenue (taxable equivalent)............... 1,109
Net Income ...........................................$ 156
Average BalancesLoans ..................................................$ 4,904Total assets........................................... 8,382Deposits ............................................... 3,924
in millions
RevenueNet interest income (taxable equivalent) ...$ 1,123Noninterest income............................ 238Total revenue (taxable equivalent) ............. 1,361
Net Income ..........................................$ 394
Average BalancesLoans .................................................$29,278Total assets ........................................ 30,568Deposits............................................. 3,384
■ Retail Banking ■ Small Business ■ Indirect Lending ■ National Home Equity
54%
17%
29%
23%
38%
39%
18%
29% 53%
62%
7%
25%
6%
57%
11%
15%
17%
46%
14%
40%
REVENUE (TE)100% = $2,302 mm
NET INCOME100% = $422 mm
REVENUE (TE)100% = $1,361 mm
NET INCOME100% = $394 mm
■ Corporate Banking ■ National Commercial Real Estate ■ National Equipment Finance
REVENUE (TE)100% = $1,109 mm
NET INCOME100% = $156 mm
■ High Net Worth ■ Capital Markets ■ Victory Capital Management
2002 Financial Highlights

ArtEmployees skillfully apply a set of common business tactics designed to align the company around clients
Work of
12 NEXT PAGEPREVIOUS PAGE SEARCH BACK TO CONTENTS

Shortly after the Pentagon was struckby terrorists on September 11, 2001,Key helped the U.S. Department of
Defense upgrade the building’s newlyoverwhelmed e-mail system. KeyEquipment Finance’s (KEF) governmentteam, formed in 2000 as part of thecompany’s leasing arm, worked closelywith an equipment vendor and immedi-ately supplied financing for the equipmentneeded to provide the solution.
The team then prepared a customizedinvoice, which is required by manygovernment agencies and municipali-ties. Companies wishing to conductbusiness with them generally must meettheir unique requirements or risk losingopportunities to build relationshipswith these important and profitableclients.
As a small but rapidly growing unit,KEF found it increasingly difficult tokeep up with this demand, because ithad to prepare the invoices manually.
So its employees worked with Keytechnologists in 2002 to automate theinvoicing process. Among other bene-fits, their efforts will shrink the admin-istrative costs associated with eachinvoice by 73 percent.
Many Key employees felt similarlyempowered in 2002 to align the com-
pany further around clients by followingKey’s business tactics. Examples of theirsuccesses are discussed below.
Know Our Clients and MarketsKnowing clients means understand-
ing who they are, what they need and
which delivery channels they prefer(see “Getting to Know You,” below).Knowing markets means understandingthe local conditions under which Keyand its clients operate.• During the year, Retail Banking
implemented predictive modeling tobetter identify clients who were at
risk of scaling back their relation-ship with Key. With that informa-tion in hand, employees contactedthem to resolve problems andstrengthen relationships. During itsfirst trial in 2002, the company
KEY’S BUSINESS TACTICS
Know our clients and markets • Develop profitable relationships
Achieve service excellence • Manage business risks
Leverage technology • Continuously improve • Build human capital
As a company striving to become a trusted advisor to itsclients, Key grasps the importance of customizing solutions
to meet their needs. So it’s going the extra mile to understandthose needs. For instance, the company recently enriched itsknowledge of its consumer banking clients by learning abouttheir motivations.
“The development is significant,” says Karen Haefling, Key’schief marketing officer. “Generally, ‘who’ data, such as a person’sage, are of limited use in predicting what someone will need.After all, the need for sound financial advice and products spansall generations and lifestyles. The predictive value of ‘what’ data
GETTING TOKNOW YOUWhy a deeper understanding of clientsleads to better solutions
Continued
Continued
13 NEXT PAGEPREVIOUS PAGE SEARCH BACK TO CONTENTS

NEXT PAGEPREVIOUS PAGE SEARCH BACK TO CONTENTS
The Solution is Key.
Flying Fish Productions.Ben Bass, Executive Producer of Flying Fish Productions, deals with a lot of specialeffects in his line of work. Along with director Bob Egle, he’s taken the small screeninto the big league with memorable commercials for KeyBank, Goodyear, Big Lotsand DSW.
Why KeyBank?Ben and Bob have worked with Key since they launched Flying Fish 10 years agowith a single credit card and a business checking account. As the firm grew in size,Key helped by suggesting a business line of credit; sweep accounts that wouldmake better use of their money; as well as ways to finance their current building.
Whether he’s on location in L.A. or at an editing studio in Columbus, Ben’s always in control of his company’s finances, thanks to Key’s online banking service. “It’s soefficient,” he enthuses. “You can keep track of everything online – from paying thecrew to managing money market and business accounts. We’re on the road a lot,but it doesn’t matter because the office is our computer.” Ben sums up why Keyplays such a big role in his business: “At Key, they go the extra mile.”
“It gives me peace of mind to know I havemy accounts there.”
How did Ben Bass script his success?
Achieve anything.The Solution is Key is a federally registered service mark of KeyCorp.

retained $750 million in balances,helping trim client attrition.
• Key’s Marketing team analyzed thecompany’s geographic markets,examining factors such as popula-tion growth and Key’s competitiveposition. Markets were classified as“defend,” “grow” or “focus.” In2002, the analysis helped Key decidewhere to build eight new KeyCenters,and where to upgrade existing ones(the company refurbishes approxi-mately 10 percent of its retail bankingfacilities each year).
Develop Profitable RelationshipsDeveloping profitable relationships
means acting on an understanding ofclients’ financial needs in ways thatprovide lasting benefits for them.• KeyBank Real Estate Capital reor-
ganized around its major clientsegments, moving from a more tradi-tional focus on products. The line’s
2003 goal is to grow noninterestincome, a sign of deepened relation-ships.
• Victory Capital Management, rich inproduct but challenged by distributionissues, expanded its sales force by morethan 50 percent and aligned it aroundmajor client segments rather than itsproducts. In 2003, Victory expectsthat the changes will increase the rateof new business in both its retail andinstitutional distribution channels.
Achieve Service ExcellenceAchieving service excellence means
that clients seldom encounter mistakesand are rarely inconvenienced.
Service excellence also benefits share-holders. An analysis by financial servicesconsulting firm First ManhattanConsulting Group shows that the typ-ical regional bank holding companycan increase its stock price by 10 to 15percent through better service qualityin its retail franchise.
• Employees throughout Key partici-pated in service quality workshopsto learn about Key’s new corporate-wide service standards: showing acan-do spirit, putting clients first, act-ing like owners, providing speedyresponses and always following up.Units began measuring consistentlyhow well employees satisfy clientsand colleagues alike.
• New, sophisticated online coachingtechnology is helping the company’s700 call-center professionals provideenhanced service and sales to Key’sclients, who in 2002 placed 9 millioncalls to the company. In 2003, Keyexpects this technology to help Key’scall centers increase client satisfac-tion–and generate additional revenue.
Manage Business RisksManaging business risks reduces
losses typically associated with a finan-cial services company.• Key reduced client check fraud in
2002 by enhancing various fraud
is somewhat higher; customers who make deposits at regularintervals will probably keep at it. ‘Why’ data, which deal withmotivation, while tough to get, are more helpful still. But the realmagic occurs when the data are combined to form a compre-hensive view of each client.”
In 2002, Key developed a new Consumer Banking segmenta-tion scheme that incorporates all three types of data. The bank willuse it to deliver tailored offers that meet clients’ needs and honortheir preferences, an important element in building a trustedadvisor relationship.
Family Asset Builders is one of the company’s seven newsegments. These people represent approximately 7 percent ofKey’s 2.3 million client base. Their average age is 40. They’rerelatively affluent and have children at home – the “who.” They tendto buy home equity lines and carry credit card balances – the“what.” They’re preoccupied with saving for their children’seducation and are comfortable with technology – the “why.”Knowing this, Key can introduce them to several possible finan-cial solutions through Key.com.
The company expects to offer solutions tailored to the uniqueneeds of all seven segments in 2003. �
FACTS ABOUT KEY’S CONSUMER BANKING CLIENTS
“WHO” they are
• Male: 59 percent are men.
• Young: The average age of clients in our largest segment, Young Transactors, is 30.
• Homeowners: 72 percent have taken the plunge.
“WHAT” they do
• Bank electronically: Two-thirds of our clients use electronic channels such as ATMs, call centers and the internet, rather than branches.
• Bank early: Use of our Online Banking and Investing Service kicks into high gear around 9:00 a.m. and volume remains heavy for the next few hours.
“WHY” they do it
• Lack of time: Members of our Family Asset Builder segment, typically pressed for time, are more likely than any other to use convenience-oriented channels such as online banking.
• Lack of experience: Half of our clients say they want professional financial advice.
WORK OF ART(Continued from page 13)
GETTING TO KNOW YOU(Continued from page 13)
15 NEXT PAGEPREVIOUS PAGE SEARCH BACK TO CONTENTS

detection systems and by introducingclients, primarily commercial ones,to new and innovative products, suchas positive pay and a fraud hotline.The improvements saved sharehold-ers $2 million and prevented clientsfrom becoming crime victims.
• Corporate Banking tightened under-writing standards and adopted a moresophisticated approach to grading loans.
Leverage TechnologyKey has been designated one of the
nation’s largest and most innovativeusers of information technology byInformation Week, in its annual 500ranking, for four years running.
Leveraging technology increases produc-tivity and enriches clients’ interactionswith the company.• Key.com, Key’s award-winning internet
site, offered clients new features in2002, such as online account state-ments, additional electronic transferoptions and more in-depth investmentinformation. The site generated morethan $500 million in new loan bal-ances, and its penetration of Key’sretail checking-account householdshit 30 percent; the industry’s averageis 20 percent. Also, Key.com receiveda coveted “A” from DiversityInc.commagazine for excellence in diversity-related content and site placement.
• Key substantially expanded a programthat allows other financial institu-tions to offer their clients surcharge-free access to Key’s nationwidenetwork of ATMs. In 2002, thoseclients completed approximately375,000 transactions, worth nearly$1 million in incremental revenueto Key.
Continuous improvement (CI)has become a part of Key’s
culture, thanks largely to PEG–forPerform, Excel, Grow–the majorpart of the company’s highly suc-cessful competitiveness improve-ment initiative. During PEG,employees generated thousandsof cost-saving and revenue-enhancing ideas. The savings in2001 alone were enough to beatthe effects of inflation by approx-imately $180 million.
To keep the ball rolling afterPEG’s March 2002 completion, Keypermanently adopted CI as a
corporatewide priority and includedit on the company’s balancedscorecard (see “Causing a GoodEffect,” page 18). Employees wereasked to keep the ideas coming.
By December 31, they hadgenerated nearly 1,600 ideas forgrowing revenue and reducingcosts, more than 1,100 of whichbecame viable projects worth$96 million. Key completed 430projects in 2002, realizing aneconomic benef i t of near ly$50 million. And employees keepcoming up wi th new ideaseach day. �
Key’s CI process, shown above, relies on many of the same tools that made PEG successful. Online training materials acquaint employees withCI. A sophisticated database captures ideas and tracks those that become projects. Experienced “CI Champions” are available to lead problem-solving sessions. Results are shared on a regular basis with senior management to keep the momentum strong and ensure accountability.
Review current business practices
Identify “most wanted”improvements
Find and implementbetter ways
Measure results Interpret results in broader context,
using Key’s balanced scorecard
Continuous Improvement: Key Employees Leave No Stone Unturned
Key.com received a coveted “A” in 2002
from DiversityInc.com magazine for excellence in diversity-related
content and site placement.
16 NEXT PAGEPREVIOUS PAGE SEARCH BACK TO CONTENTS

9/99
3.50
2/01
3.59
11/02
3.86
Key’s Employee Opinion Survey Overall Opinion1
My job makes a difference at my company
I’m committed to my company’s success
Communications are good at my company
0% 100%60%40%20% 80%
4
6
5
Human Capital: Key Employees Have Their Say
Continuously ImproveContinuously improving means
assuming that every aspect of a businesscan be rendered “better, faster,cheaper”– and making sure that ithappens again and again.• Key unveiled in July 2002 a plan to
boost commercial deposit growth byasking credit-only clients, particu-larly cash-intensive businesses suchas title companies, to establish depositaccounts. The result by year end was$745 million in new deposits.
• Consumer Banking introduced itsKey Step Rate CD to help clientscounter the effects of a low ordeclining interest-rate environment.
The CD generated $2 billion in newdeposits.
Build Human CapitalThe building human capital tactic
recognizes that an organization is onlyas good as the individual and collectivetalents of its employees.
Building human capital makes adifference. Five-year total returns toshareholders averaged 64 percent(April 1996-April 2001) at companiesthat managed their human capitaleffectively, versus 21 percent at com-panies that did not, says humanresources consulting firm Watson WyattWorldwide.
• Small Business built customized reten-tion plans for its highest-performingsales and sales support employees.Managers reviewed the plans withemployees every 60 days. Result in2002: The line retained more than95 percent of targeted employees.
• McDonald Financial Group createdopportunity and incentive for Key’sprivate bankers and brokers to begintransforming their traditional rolesinto full-fledged financial advisors tohigh-net-worth families and individ-uals. Testing of this unique deliverymodel in selected markets began inlate 2002. �
■ Key ■ Index2
Key employees feel better about their companythan many other companies’ employees feel about theirs – and satisfied employees tend
to result in satisfied clients.
Key employees feel increasingly upbeat about the company, a reflection of the success
of its continuing turnaround.
1. Overall opinion is a composite score of responses by Key employees to 59 questions dealing with values, organizational effectiveness, communications, satisfaction, attachment and confidence, and commitment. Scale for the score ranges from 1 (Very Unfavorable) to 5 (Very Favorable).
2. Index data were compiled by human resources consulting firm Watson Wyatt Worldwide. The firm conducted surveys of a cross-section of 12,750 full-timeemployees at U.S. companies in all major industry sectors. Each index reflects employee responses to multiple questions, or items. The number of items included in each index appears in the blue bars.
Employee Opinions, 2002 Percentage Responding Agree/Favorable
17 NEXT PAGEPREVIOUS PAGE SEARCH BACK TO CONTENTS

If you can’t measure it, you can’tmanage it,” goes a popular busi-ness saying.
Companies have long measuredfinancial results, of course, but suchinformation focuses on the bottomline – after it’s too late to intervene.Hence the growing desire of companiesto understand prospectively what drivesspecific financial results.
Enter a tool called a balanced score-card. Like traditional scorekeepingsystems, it tracks financial results.The addition of nonfinancial results,such as employee satisfaction, ATMavailability (in the case of banking com-panies), products per client and clientsatisfaction is what makes the scorecard“balanced,” providing managers with amuch broader view of their businesses.
This additional perspective makesthe scorecards powerful. By revealingimportant cause-and-effect relation-ships, they allow managers to run theirbusinesses better. For instance, a dropin employee satisfaction, left unchecked,could cause employee turnover, whichcould disrupt client relationships and,ultimately, hurt the bottom line. Bypaying more attention to controllablefactors, such as providing ample train-ing for employees or selecting the rightsites for new offices, managers arebetter able to achieve the outcomes theircompanies want.
Scorecard development at Key beganin late 2001. By the end of 2002, score-cards existed for the company overalland most major line and staff areas. Allfollow the same logic, although measuresmay vary by area.
In 2003, the cascade will continue asemployees develop individual perform-ance objectives that are consistent withtheir units’ scorecards.
Balanced scorecards also benefitaccountability-minded firms like Key.That’s because they keep everyonefocused on a common goal. Theyuncover opportunities for improvement.They encourage problem solving. And
they emphasize performance relativeto peers.
Over time, managers will refine thescorecards as they are better able tosource both internal and externalinformation.
Will it be time well spent? Key’ssenior managers seem to think so – tothem, it’s “for a good cause.” �
“
� SAMPLE MEASURES
CONT
ROLL
ABLE
FAC
TORS
3. so that it can become a trustedadvisor to clients...
� CLIENT SATISFACTION
� MARKET SHARE
DESI
RED
OUTC
OMES
4. which will generate sustainablereturns for investors.
� REVENUE GROWTH COMPARED WITH PEERS
� EARNINGS PER SHARE GROWTHCOMPARED WITH PEERS
1. Key starts with motivated, trainedand focused employees...
� WORKFORCE DIVERSITY
� EMPLOYEE SATISFACTION
2. has them implement Key’s strategy flawlessly...
� CLIENT ACQUISITION
� UNDERWRITING STANDARDS
��
�
KEY’S
BALANCEDSCORECARD
CAUSING A
GOODEffect
A BROADER MEASUREMENT SYSTEM SHARPENS KEY’S FOCUS
18 NEXT PAGEPREVIOUS PAGE SEARCH BACK TO CONTENTS

FINANCIAL REVIEW
19 NEXT PAGEPREVIOUS PAGE SEARCH BACK TO CONTENTS
Management’s Discussion & Analysis of
Financial Condition & Results of Operations
Introduction 20
Highlights of Key’s 2002 Performance 21
Line of Business Results 24
Results of Operations
Net Interest Income 27
Market Risk Management 30
Noninterest Income 32
Noninterest Expense 34
Income Taxes 36
Financial Condition
Loans 36
Securities 40
Asset Quality 40
Deposits and Other Sources of Funds 46
Liquidity 46
Capital 48
Fourth Quarter Results 50
Report of Management 52
Report of Ernst & Young LLP,
Independent Auditors 52
Consolidated Financial Statements 53

20 NEXT PAGEPREVIOUS PAGE SEARCH BACK TO CONTENTS
INTRODUCTION
This section generally reviews the financial condition and results of
operations of KeyCorp and its subsidiaries for each of the past three
years. Some tables may cover a longer period to comply with disclosure
requirements or to illustrate trends in greater depth. When you read this
discussion, you should also refer to the consolidated financial statements
and related notes that appear on pages 53 through 88.
Significant accounting policies and estimatesKey’s business is dynamic and complex. Consequently, management must
exercise judgment in choosing and applying accounting policies and
methodologies in many areas. These choices are important; not only are
they necessary to comply with accounting principles generally accepted
in the United States, they also reflect management’s view of the most
appropriate manner in which to record and report Key’s overall financial
performance. All accounting policies are important, and all policies
described in Note 1 (“Summary of Significant Accounting Policies”),
which begins on page 57, should be reviewed for a greater understanding
of how Key’s financial performance is recorded and reported.
In management’s opinion, some accounting policies are more likely
than others to have a significant effect on Key’s financial results and to
expose those results to potentially greater volatility. These policies
apply to areas of relatively greater business importance or require
management to make assumptions and estimates that affect amounts
reported in the financial statements. Because these assumptions and
estimates are based on current circumstances, they may change over time
or prove to be inaccurate based on actual experience. For Key, the
areas that rely most heavily on the use of assumptions and estimates
include accounting for the allowance for loan losses, loan securitizations,
contingent obligations arising from litigation and tax exposures,
principal investments, goodwill, and pension and other postretirement
obligations. A brief discussion of each of these areas appears below.
Allowance for loan losses. Management determines probable losses
inherent in Key’s loan portfolio (which represents by far the largest
category of assets on Key’s balance sheet) and establishes an allowance
that is sufficient to absorb those losses by considering factors including
historical loss rates, expected cash flows and estimated collateral
values. In assessing these factors, management benefits from a lengthy
organizational history and experience with credit decisions and related
outcomes. Nonetheless, if management’s underlying assumptions prove
to be inaccurate, the allowance for loan losses would have to be adjusted.
Our accounting policy related to the allowance is disclosed in Note 1
under the heading “Allowance for Loan Losses” on page 58.
Loan securitizations. Key securitizes certain types of loans and accounts
for such transactions as sales when the criteria set forth in Statement of
Financial Accounting Standards (“SFAS”) No. 140, “Accounting for
Transfers and Servicing of Financial Assets and Extinguishment of
Liabilities” are met. If future events were to preclude accounting for such
transactions as sales, the loans would have to be placed back on Key’s
balance sheet. This could have a potentially adverse effect on Key’s
capital ratios and other unfavorable financial implications. In addition,
determining the gain or loss resulting from securitization transactions
and the subsequent carrying amount of retained interests is dependent
on underlying assumptions made by management, the most significant
of which are described in Note 8 (“Loan Securitizations and Variable
Interest Entities”), which begins on page 70. The use of alternative ranges
of possible outcomes for these assumptions would change the amount
of the initial gain or loss recognized. It could also result in changes in
the carrying amount of retained interests, with related effects on results
of operations. Our accounting policy related to loan securitizations is
disclosed in Note 1 under the heading “Loan Securitizations” on page 59.
Contingent obligations. A detailed description of contingent obligations
arising from litigation and their potential effects on Key’s results of
operations is contained in Note 19 (“Commitments, Contingent Liabilities
and Guarantees”), which begins on page 81.
In the normal course of business, Key is routinely subject to examinations
and challenges from tax authorities regarding the amount of taxes due in
connection with investments and business activities. Currently, the Internal
Revenue Service is challenging Key’s tax treatment of certain leveraged lease
investments. This and other challenges by tax authorities may result in
adjustments to the timing or amount of Key’s taxable income or deductions
or the allocation of income among tax jurisdictions. Management believes
these challenges will be resolved without having any material effect on
Key’s financial condition or results of operations.
Valuation methodologies. Valuation methodologies employed by
management often involve a significant degree of judgment, particularly
when there are no observable liquid markets for the items being valued.
The outcome of valuations performed by management have a direct bearing
on the carrying amounts of certain assets and liabilities, such as principal
investments, goodwill, and pension and other postretirement benefit
obligations. To determine the values of these assets and liabilities, as well
as the extent to which related assets may be impaired, management makes
assumptions and estimates related to discount rates, asset returns, repayment
rates and other factors. The use of different discount rates or other valuation
assumptions could produce significantly different results, which could
have material positive or negative effects on Key’s results of operations.
The valuation methodology management uses for principal investments is
summarized in Note 21 (“Fair Value Disclosures of Financial Instruments”)
on page 86 and the methodology used in the testing for goodwill
impairment is summarized in Note 1 under the heading “Goodwill and
Other Intangible Assets” on page 59. The primary assumptions used in
determining Key’s pension and other postretirement benefit obligations
and related expenses are presented in Note 16 (“Employee Benefits”), which
begins on page 78.
When a potential asset impairment is identified through testing, observable
changes in liquid markets or other means, management must also exercise
judgment in determining the nature of the potential impairment (i.e.,
whether the impairment is temporary or other than temporary) in order
to apply the appropriate accounting treatment. For example, unrealized
losses on securities available for sale that are deemed temporary are
recorded in shareholders’ equity, whereas those deemed “other than
temporary” are recorded in earnings.
Revenue recognitionIn recent months, corporate improprieties related to revenue recognition
have received a great deal of attention by regulatory authorities and the
news media. Although all companies face the risk of intentional or
MANAGEMENT’S DISCUSSION & ANALYSIS OF FINANCIAL CONDITION & RESULTS OF OPERATIONS KEYCORP AND SUBSIDIARIES

MANAGEMENT’S DISCUSSION & ANALYSIS OF FINANCIAL CONDITION & RESULTS OF OPERATIONS KEYCORP AND SUBSIDIARIES
unintentional misstatements, such misstatements are less likely in the
financial services industry because most of the revenue (i.e., interest
accruals) recorded is driven by nondiscretionary formulas based on
written contracts, such as loan agreements.
TerminologyThis report contains some shortened names and industry-specific terms.
We want to explain some of these terms at the outset so you can better
understand the discussion that follows.
• KeyCorp refers solely to the parent holding company.
• KBNA refers to Key’s lead bank, KeyBank National Association.
• Key refers to the consolidated entity consisting of KeyCorp and its
subsidiaries.
• A KeyCenter is one of Key’s full-service retail banking facilities or
branches.
• Key engages in capital markets activities. These activities encompass a
variety of products and services. Among other things, we trade securities
as a dealer, enter into derivative contracts (both to accommodate clients’
financing needs and for proprietary trading purposes), and conduct
transactions in foreign currencies (both to accommodate clients’ needs
and to benefit from fluctuations in exchange rates).
• All earnings per share data included in this discussion are presented
on a diluted basis, which takes into account all common shares
outstanding as well as potential common shares that could result from
the exercise of outstanding stock options. Some of the financial
information tables also include basic earnings per share, which takes
into account only common shares outstanding.
• For regulatory purposes, capital is divided into two classes. Federal
regulations prescribe that at least one-half of a bank or bank holding
company’s total risk-based capital must qualify as Tier 1. Both total
and Tier 1 capital serve as bases for several measures of capital
adequacy, which is an important indicator of financial stability and
condition. You will find a more detailed explanation of total and Tier
1 capital and how they are calculated in the section entitled “Capital,”
which begins on page 48.
• When we want to draw your attention to a particular item in Key’s
Notes to Consolidated Financial Statements, we refer to Note ___,
giving the particular number, name and starting page number.
Forward-looking statementsThis report may contain “forward-looking statements” about issues like
anticipated earnings, anticipated levels of net loan charge-offs and
nonperforming assets and anticipated improvement in profitability and
competitiveness. These statements usually can be identified by the use
of forward-looking language such as “our goal,” “our objective,” “our
plan,” “will likely result,” “will be,” “are expected to,” “as planned,” “is
anticipated,” “intends to,” “is projected,” or similar words. Forward-
looking statements by their nature are subject to assumptions, risks and
uncertainties. For a variety of reasons, including the following, actual
results could differ materially from those contained in or implied by the
forward-looking statements.
• Interest rates could change more quickly or more significantly than we
expect, which may have an adverse effect on our financial results.
• If the economy or segments of the economy fail to recover or, decline
further, the demand for new loans and the ability of borrowers to
repay outstanding loans may decline.
• The stock and bond markets could suffer additional declines or
disruptions, which may have adverse effects on our financial condition
and that of our borrowers, and on our ability to raise money by
issuing new securities.
• It could take us longer than we anticipate to implement strategic
initiatives designed to increase revenues or manage expenses; we
may be unable to implement certain initiatives; or the initiatives may
be unsuccessful.
• Acquisitions and dispositions of assets, business units or affiliates could
adversely affect us in ways that management has not anticipated.
• We may become subject to new legal obligations, or the resolution of
pending litigation may have an adverse effect on our financial results.
• Terrorist activities or military actions could further disrupt the
economy and the general business climate, which may have an adverse
effect on our financial results or condition and that of our borrowers.
• We may become subject to new accounting, tax, or regulatory
practices or requirements.
HIGHLIGHTS OF KEY’S 2002 PERFORMANCEFinancial performanceThe primary measures of Key’s financial performance for 2002, 2001 and
2000 are summarized below.
• Net income for 2002 was $976 million, or $2.27 per common share,
compared with $132 million, or $.31 per share for 2001, and $1.0
billion, or $2.30 per share, for 2000.
• Key’s return on average equity was 14.96% for 2002. This result
compares with a return of 2.01% for 2001 and a return of 15.39%
for 2000.
• Key’s 2002 return on average total assets was 1.19%. This result
compares with a return of .16% for 2001 and a return of 1.19% for
2000.
In the second and fourth quarters of 2001, we announced a series of
strategic initiatives designed to sharpen our business focus and strengthen
Key’s financial performance. These included:
• Accelerating Key’s revenue growth by delivering our products and
services to customers through a seamless, integrated sales process
called 1Key.
• Achieving 100% of the savings from our competitiveness initiative
discussed on page 22.
• Re-emphasizing our commitment to our relationship-based activities,
and committing to re-establish a conservative credit culture while de-
emphasizing high-risk, low-return businesses.
Specific actions related to these initiatives included exiting the automobile
leasing business, de-emphasizing indirect prime automobile lending,
discontinuing many credit-only relationships in the leveraged financing
and nationally syndicated lending businesses, and increasing the
allowance for loan losses.
21 NEXT PAGEPREVIOUS PAGE SEARCH BACK TO CONTENTS

MANAGEMENT’S DISCUSSION & ANALYSIS OF FINANCIAL CONDITION & RESULTS OF OPERATIONS KEYCORP AND SUBSIDIARIES
As a result of these actions, Key recorded 2001 charges aggregating $1.1
billion ($774 million after tax) that hinder a direct comparison of
financial results over the past three years. Specifically, in the second
quarter of 2001, we recorded a $150 million write-down of goodwill
associated with Key’s 1995 acquisition of AutoFinance Group, Inc.
This charge reflects our intention to significantly downsize the automobile
finance business. We also increased the provision for loan losses by $300
million ($189 million after tax) to facilitate the exiting of credits in the
leveraged financing and nationally syndicated lending businesses. Finally,
we recorded a $40 million ($25 million after tax) charge to establish a
reserve for losses incurred on the residual values of leased vehicles.
In the fourth quarter of 2001, we recorded an additional provision for
loan losses of $590 million ($372 million after tax) as a result of both
the rapid downturn in the economy and further erosion in credit quality
experienced after the events of September 11. In the same quarter, we
recorded a $45 million ($28 million after tax) write-down of our
principal investing portfolio and a $15 million ($9 million after tax)
charge to increase our reserve for customer derivative losses.
Results for 2001 also were adversely affected by a $39 million ($24
million after tax) charge resulting from a prescribed change in accounting
principles generally accepted in the United States applicable to retained
interests in securitized assets and a $20 million ($13 million after tax)
increase in litigation reserves.
The charges summarized above and the primary reasons that Key’s
specific revenue and expense components changed over the past three
years are reviewed in greater detail throughout the remainder of this
discussion.
Figure 1 summarizes Key’s financial performance for each of the past
six years.
Corporate strategyOur goal is to achieve revenue and earnings per share growth that is
consistently above the median for stocks that make up the Standard &
Poor’s 500 Banks Index. Our strategy for achieving this goal comprises
the following four primary elements:
• Focus on our core businesses. We intend to focus on businesses that
enable us to build relationships with our clients. We will focus on our
“footprint” businesses that serve individuals, small businesses and
middle market companies. In addition, we intend to focus nationwide
on our commercial real estate lending, asset management, home
equity lending and equipment leasing businesses. These are businesses
in which we believe we possess resources of the scale necessary to
compete nationally.
• Put our clients first. We will work to deepen our relationship with our
existing clients, and to build relationships with new clients who
have the potential to purchase multiple products and services or to
generate repeat business. One way in which we are pursuing this goal
is by emphasizing deposit growth across all of our lines of business.
We also want to ensure that our clients are receiving a distinctive level
of service, so we are putting considerable effort into enhancing our
service quality.
• Enhance our business. We intend to build on the success of our
competitiveness initiative by pursuing a continuous improvement
process. We will continue to focus on increasing revenues, controlling
expenses and better serving our clients, and we will also continue to
leverage technology — both to reduce costs and to enhance service
quality. Over time, we also intend to diversify our revenue mix by
emphasizing the growth of fee income while investing in higher-
growth and higher-return businesses.
• Cultivate a workforce that demonstrates Key’s values and works
together for a common purpose. Key intends to achieve this by:
— paying for performance, but only if achieved in ways that are
consistent with Key’s values;
— attracting, developing and retaining a quality, high-performing and
inclusive workforce;
— developing leadership at all levels in the company; and
— creating a positive, stimulating and entrepreneurial work environment.
Status of competitiveness initiativeKey launched a major initiative in November 1999, the first phase of
which was completed in 2000. This initiative was designed to improve
Key’s profitability by reducing the costs of doing business, focusing
on the most profitable growth businesses and enhancing revenues.
During the initial phase, we reduced our annual operating expenses by
approximately $100 million by outsourcing certain nonstrategic support
functions, consolidating sites in a number of our businesses and reducing
management layers.
During 2002, we completed the implementation of all projects related
to the second and final phase of the initiative, referred to as PEG
(Perform, Excel, Grow). In this phase, we reduced our annual operating
expenses by an additional $200 million by:
• consolidating 22 business lines into 10 to simplify Key’s business
structure;
• streamlining and automating business operations and processes;
• standardizing product offerings and internal processes;
• consolidating operating facilities and service centers; and
• outsourcing additional noncore activities.
Due primarily to the success of the overall initiative, noninterest expense
for 2002 was lower than it has been for any year since 1998.
Management expected the competitiveness initiative to reduce Key’s
workforce by approximately 4,000 positions (comprising both staffed
and vacant positions). During 2002, Key completed its workforce
reduction bringing the total number of positions eliminated in the
initiative to nearly 4,100.
Since the inception of the competitiveness initiative, we have recorded
related net charges of $270 million. The section entitled “Noninterest
expense,” which begins on page 34, and Note 18 (“Restructuring
Charges”) on page 81 provide more information about Key’s
restructuring charges.
22 NEXT PAGEPREVIOUS PAGE SEARCH BACK TO CONTENTS

23 NEXT PAGEPREVIOUS PAGE SEARCH BACK TO CONTENTS
MANAGEMENT’S DISCUSSION & ANALYSIS OF FINANCIAL CONDITION & RESULTS OF OPERATIONS KEYCORP AND SUBSIDIARIES
FIGURE 1 SELECTED FINANCIAL DATA
CompoundAnnual Rate
of Changedollars in millions, except per share amounts 2002 2001 2000 1999 1998 1997 (1997-2002)
YEAR ENDED DECEMBER 31,Interest income $4,366 $5,627 $6,277 $5,695 $5,525 $5,262 (3.7)%Interest expense 1,617 2,802 3,547 2,908 2,841 2,517 (8.5)Net interest income 2,749 2,825 2,730 2,787 2,684 2,745 —Provision for loan losses 553 1,350 490 348 297 320 11.6Noninterest income 1,769 1,725 2,194 2,315 1,600 1,315 6.1Noninterest expense 2,653 2,941 2,917 3,070 2,508 2,395 2.1Income before income taxes and cumulative
effect of accounting changes 1,312 259 1,517 1,684 1,479 1,345 (.5)Income before cumulative effect
of accounting changes 976 157 1,002 1,107 996 919 1.2Net income 976 132 1,002 1,107 996 919 1.2
PER COMMON SHAREIncome before cumulative effect
of accounting changes $ 2.29 $ .37 $ 2.32 $ 2.47 $ 2.25 $ 2.09 1.8%Income before cumulative effect
of accounting changes — assuming dilution 2.27 .37 2.30 2.45 2.23 2.07 1.9
Net income 2.29 .31 2.32 2.47 2.25 2.09 1.8Net income — assuming dilution 2.27 .31 2.30 2.45 2.23 2.07 1.9Cash dividends paid 1.20 1.18 1.12 1.04 .94 .84 7.4Book value at year end 16.12 14.52 15.65 14.41 13.63 11.83 6.4Market price at year end 25.14 24.34 28.00 22.13 32.00 35.41 (6.6)Dividend payout ratio 52.40% 380.65% 48.28% 42.11% 41.78% 40.19% 5.4Weighted average common shares (000) 425,451 424,275 432,617 448,168 441,895 439,042 (.6)Weighted average common shares and
potential common shares (000) 430,703 429,573 435,573 452,363 447,437 444,544 (.6)
AT DECEMBER 31,Loans $62,457 $63,309 $66,905 $64,222 $62,012 $53,380 3.2%Earning assets 73,635 71,672 77,316 73,733 70,240 64,246 2.8Total assets 85,202 80,938 87,270 83,395 80,020 73,699 2.9Deposits 49,346 44,795 48,649 43,233 42,583 45,073 1.8Long-term debt 15,605 14,554 14,161 15,881 12,967 7,446 15.9Shareholders’ equity 6,835 6,155 6,623 6,389 6,167 5,181 5.7
Full-time equivalent employees 20,437 21,230 22,142 24,568 25,862 24,595 (3.6)KeyCenters 910 911 922 936 968 1,015 (2.2)
PERFORMANCE RATIOSReturn on average total assets 1.19% .16% 1.19% 1.37% 1.32% 1.33% N/AReturn on average equity 14.96 2.01 15.39 17.68 17.97 18.89 N/ANet interest margin (taxable equivalent) 3.97 3.81 3.69 3.93 4.08 4.54 N/A
CAPITAL RATIOS AT DECEMBER 31,Equity to assets 8.02% 7.60% 7.59% 7.66% 7.71% 7.03% N/ATangible equity to tangible assets 6.73 6.29 6.12 6.03 5.93 5.52 N/ATier 1 risk-based capital 8.09 7.43 7.72 7.68 7.21 6.65 N/ATotal risk-based capital 12.51 11.41 11.48 11.66 11.69 10.83 N/ALeverage 8.15 7.65 7.71 7.77 6.95 6.40 N/A
Key completed several acquisitions and divestitures during the six-year period shown in this table. One or more of these transactions may have had a significant effect on Key’s results, making itdifficult to compare results from one year to the next. Note 3 (“Acquisitions and Divestitures”) on page 64 contains specific information about the acquisitions and divestitures that Key completedin the past three years to help you understand how those transactions may have impacted Key’s financial condition and results of operations.
N/A = Not Applicable

MANAGEMENT’S DISCUSSION & ANALYSIS OF FINANCIAL CONDITION & RESULTS OF OPERATIONS KEYCORP AND SUBSIDIARIES
LINE OF BUSINESS RESULTS
This section summarizes the financial performance and related strategic
developments of each of Key’s three major business groups: Key
Consumer Banking, Key Corporate Finance and Key Capital Partners.
To better understand this discussion, see Note 4 (“Line of Business
Results”), which begins on page 65. Note 4 includes a brief description
of the products and services offered by each of the three major business
groups, more detailed financial information pertaining to the groups and
their respective lines of business and brief descriptions of “Other
Segments” and “Reconciling Items” included in Figure 2.
Figure 2 summarizes the contribution made by each major business group
to Key’s taxable-equivalent revenue and net income for each of the past
three years.
24 NEXT PAGEPREVIOUS PAGE SEARCH BACK TO CONTENTS
Key Consumer BankingAs shown in Figure 3, net income for Key Consumer Banking was
$422 million for 2002, up from $358 million for 2001 and $356
million for 2000. The improvement in 2002 reflects the cumulative effect
of the 2001 accounting change presented in the figure, as well as an
increase in noninterest income and a reduction in noninterest expense.
These positive results were partially offset by a decrease in taxable-
equivalent net interest income. The provision for loan losses was
essentially unchanged.
Taxable-equivalent net interest income decreased by $13 million, or 1%,
from 2001 as a more favorable interest rate spread on average earning assets
and a 21% increase in average home equity loans were more than offset by
the adverse effects of a narrower spread on deposits and a decline in
average deposits outstanding. The decrease in deposits reflected declines in
time deposits resulting from reduced rates paid for those deposits, as well
as consumer preferences for alternative investments that provide higher
levels of liquidity. At the same time, savings deposits rose in response to
more aggressive pricing implemented in mid-2002, while noninterest-
bearing deposits grew significantly as a result of intensified cross-sell
efforts and the introduction of new products, including free checking.
Year ended December 31, Change 2002 vs 2001
dollars in millions 2002 2001 2000 Amount Percent
REVENUE (TAXABLE EQUIVALENT)Key Consumer Banking $2,302 $2,300 $2,232 $ 2 .1%Key Corporate Finance 1,361 1,351 1,264 10 .7Key Capital Partners 1,109 1,159 1,188 (50) (4.3)Other Segments (76) (73) 57 (3) (4.1)
Total segments 4,696 4,737 4,741 (41) (.9)Reconciling Items (58) (142)b 211b 84 59.2
Total $4,638 $4,595 $4,952 $ 43 .9%
NET INCOME (LOSS)Key Consumer Banking $422 $ 358a $ 356 $ 64 17.9%Key Corporate Finance 394 429 396 (35) (8.2)Key Capital Partners 156 129 142 27 20.9Other Segments (20) (20) 58 — —
Total segments 952 896 952 56 6.3Reconciling Items 24 (764)b 50b 788 N/M
Total $976 $ 132 $1,002 $844 639.4%
a Results for 2001 include a one-time cumulative charge of $39 million ($24 million after tax) resulting from a prescribed change, applicable to all companies, in the accounting for retainedinterests in securitized assets.
b Significant items included in Reconciling Items are as follows:
Year ended December 31, 2001
• Noninterest income includes a $40 million ($25 million after tax) charge taken to establish a reserve for losses incurred on the residual values of leased vehicles and a $15 million ($9 millionafter tax) increase in the reserve for customer derivative losses.
• The provision for loan losses includes an additional $400 million ($252 million after tax) taken to increase the allowance for loan losses for Key’s continuing loan portfolio and an additional$490 million ($309 million after tax) recorded primarily in connection with Key’s decision to discontinue certain credit-only commercial relationships.
• Noninterest expense includes a goodwill write-down of $150 million associated with the downsizing of the automobile finance business and charges of $20 million ($13 million after tax) taken to establish additional litigation reserves.
Year ended December 31, 2000
• Noninterest income includes a gain of $332 million ($207 million after tax) from the sale of Key’s credit card portfolio.
• The provision for loan losses includes an additional $121 million ($76 million after tax) recorded in connection with the implementation of an enhanced methodology for assessing credit risk,particularly in the commercial loan portfolio.
• Noninterest expense includes $127 million ($80 million after tax), primarily restructuring charges, recorded in connection with strategic actions taken to improve Key’s operating efficiency and profitability.
N/M = Not Meaningful
FIGURE 2 MAJOR BUSINESS GROUPS — TAXABLE-EQUIVALENT REVENUE AND NET INCOME

25 NEXT PAGEPREVIOUS PAGE SEARCH BACK TO CONTENTS
MANAGEMENT’S DISCUSSION & ANALYSIS OF FINANCIAL CONDITION & RESULTS OF OPERATIONS KEYCORP AND SUBSIDIARIES
Year ended December 31, Change 2002 vs 2001
dollars in millions 2002 2001 2000 Amount Percent
SUMMARY OF OPERATIONSNet interest income (TE) $1,805 $1,818 $1,757 $(13) (.7)%Noninterest income 497 482 475 15 3.1
Total revenue (TE) 2,302 2,300 2,232 2 .1Provision for loan losses 303 300 281 3 1.0Noninterest expense 1,324 1,366 1,356 (42) (3.1)
Income before income taxes (TE) and cumulative effect of accounting change 675 634 595 41 6.5
Allocated income taxes and TE adjustments 253 252 239 1 .4
Income before cumulative effect of accounting change 422 382 356 40 10.5
Cumulative effect of accounting change — (24)a — 24 100.0
Net income $ 422 $ 358 $ 356 $ 64 17.9%
Percent of consolidated net income 43% 271% 36% N/A N/A
AVERAGE BALANCESLoans $27,806 $27,673 $26,690 $ 133 .5%Total assets 29,970 30,398 29,637 (428) (1.4)Deposits 33,942 35,221 35,370 (1,279) (3.6)
a Results for 2001 include a one-time cumulative charge of $39 million ($24 million after tax) resulting from a prescribed change, applicable to all companies, in the accounting for retainedinterests in securitized assets.
TE = Taxable Equivalent, N/A = Not Applicable
FIGURE 3 KEY CONSUMER BANKING
Noninterest income grew by $15 million, or 3%, due primarily to a $15
million decrease in net losses from derivatives in the National Home
Equity line of business, an aggregate $7 million increase in service
charges on deposit accounts contributed by the Retail Banking and Small
Business lines and higher fees from mortgage lending and electronic
banking services. The growth in deposit service charges resulted from
new pricing implemented in mid-2001 in connection with Key’s
competitiveness improvement initiative, but was moderated by the
introduction of free checking products in the third quarter of 2002. These
favorable results more than offset a $19 million increase in losses
incurred on the residual values of leased vehicles in the Indirect Lending
line of business.
Noninterest expense decreased by $42 million, or 3%, from 2001.
The improvement reflects an approximate $38 million reduction in
goodwill amortization, which resulted from the adoption of new
accounting guidance, and lower costs for software amortization. These
reductions were partially offset by higher personnel expense and an
increase in marketing costs associated with the growth in the National
Home Equity line of business.
ADDITIONAL KEY CONSUMER BANKING DATAYear ended December 31, Change 2002 vs 2001
dollars in millions 2002 2001 2000 Amount Percent
AVERAGE DEPOSITS OUTSTANDINGNoninterest-bearing deposits $ 5,136 $ 4,802 $ 4,935 $ 334 7.0%MMDA and other savings deposits 13,054 12,832 13,154 222 1.7Time deposits 15,752 17,587 17,281 (1,835) (10.4)
Total deposits $33,942 $35,221 $35,370 $(1,279) (3.6)%
Retail National Key ConsumerBanking Home Equity Banking
HOME EQUITY LOANS (2002) OTHER DATA (2002)Average balance / % change from 2001 $6,619 / 28% $4,906 / 11% On-line clients / % penetration 575,894 / 32%Average loan-to-value ratio 71 80 KeyCenters 910Percent first lien positions 51 79 Automated teller machines 2,165

MANAGEMENT’S DISCUSSION & ANALYSIS OF FINANCIAL CONDITION & RESULTS OF OPERATIONS KEYCORP AND SUBSIDIARIES
In 2001, the increase in net income reflected a $61 million, or 3%,
increase in net interest income due to an improved interest rate spread
on earning assets and a favorable change in the composition of earning
assets resulting from Key’s decision to retain (rather than securitize and
sell) home equity loans starting in 2000. The growth in net interest
income was substantially offset by the effect of the 2001 accounting
change mentioned on page 25.
Key Corporate FinanceAs shown in Figure 4, net income for Key Corporate Finance was
$394 million for 2002, compared with $429 million for 2001 and
$396 million for 2000. The decrease from 2001 resulted from a
significantly higher provision for loan losses and lower noninterest
income. These adverse results were offset in part by moderate growth in
net interest income and improvement in noninterest expense.
26 NEXT PAGEPREVIOUS PAGE SEARCH BACK TO CONTENTS
Year ended December 31, Change 2002 vs 2001
dollars in millions 2002 2001 2000 Amount Percent
SUMMARY OF OPERATIONSNet interest income (TE) $1,123 $1,092 $1,011 $ 31 2.8%Noninterest income 238 259 253 (21) (8.1)
Total revenue (TE) 1,361 1,351 1,264 10 .7Provision for loan losses 236 140 125 96 68.6Noninterest expense 495 517 497 (22) (4.3)
Income before income taxes (TE) 630 694 642 (64) (9.2)Allocated income taxes and TE adjustments 236 265 246 (29) (10.9)
Net income $ 394 $ 429 $ 396 $(35) (8.2)%
Percent of consolidated net income 41% 325% 39% N/A N/A
AVERAGE BALANCESLoans $29,278 $31,098 $30,592 $(1,820) (5.9)%Total assets 30,568 32,593 32,086 (2,025) (6.2)Deposits 3,384 3,093 2,815 291 9.4
TE = Taxable Equivalent, N/A = Not Applicable
FIGURE 4 KEY CORPORATE FINANCE
During 2002, taxable-equivalent net interest income increased by $31
million, or 3%. The increase was due primarily to a higher taxable-
equivalent adjustment related to portions of the equipment leasing
portfolio, which became subject to a lower income tax rate in the
latter half of 2001. A more favorable interest rate spread on earning
assets and the growth in average deposits also contributed to the
improvement. These positive results were partially offset by the adverse
effect of a decline in average loans outstanding.
During the same time, noninterest income decreased by $21 million, or
8%. The decrease was due principally to losses from residual values of
leased equipment in the National Equipment Finance line of business in
2002, compared with gains in the prior year. Lower fees generated by
Corporate Banking also contributed to the decline. These adverse
results more than offset increases in nonyield-related loan fees and
loan sale gains in the National Commercial Real Estate line and growth
in service charges on deposit accounts in the Corporate Banking line.
Noninterest expense improved by $22 million, or 4%, reflecting a $16
million reduction in goodwill amortization following the adoption of a
new accounting standard. The provision for loan losses rose by $96
million, or 69%, due largely to higher levels of net charge-offs in the
Corporate Banking and National Equipment Finance lines.
In 2001, an $81 million, or 8%, improvement in net interest income
drove the increase in net income relative to the prior year. This growth
was attributable largely to a more favorable interest rate spread on
earning assets, as well as loan growth in both the National Commercial
Real Estate and National Equipment Finance lines of business.
Key Capital PartnersAs shown in Figure 5, Key Capital Partners’ net income was $156
million for 2002, compared with $129 million for 2001 and $142
million for 2000. The improvement in 2002 was attributable to a
substantial decrease in noninterest expense and growth in taxable-
equivalent net interest income. These positive results more than offset a
decline in noninterest income, while the provision for loan losses was
essentially unchanged.
Taxable-equivalent net interest income increased by $19 million, or 9%,
from 2001. The growth was due primarily to a more favorable interest
rate spread on earning assets.
Noninterest income decreased by $69 million, or 7%, as market-
sensitive businesses were adversely affected by the weak economy. The
reduction was attributable mainly to an aggregate decline of $51
million in trust and investment services income in the High Net
Worth and Victory Capital Management lines and lower income from
trading activities and derivatives in the Capital Markets line. In
addition, revenue for 2001 benefited from a net gain from the sale of
residential mortgage loans associated with the private banking business.
These factors more than offset an $18 million increase in investment
banking income.

MANAGEMENT’S DISCUSSION & ANALYSIS OF FINANCIAL CONDITION & RESULTS OF OPERATIONS KEYCORP AND SUBSIDIARIES
Noninterest expense decreased by $80 million, or 9%, in 2002, due
primarily to an approximate $25 million reduction in amortization
expense following the prescribed change in accounting for goodwill,
lower variable compensation expense associated with revenue generation
and reduced software amortization.
In 2001, net income decreased primarily as a result of a $31 million, or
3%, reduction in noninterest income. Weak conditions in the capital
markets led to a $39 million, or 6%, decline in income from trust and
investment services.
Other SegmentsOther Segments, which consists primarily of Treasury, Principal
Investing and the net effect of funds transfer pricing, generated net
losses of $20 million in both 2002 and 2001. In 2002, net losses from
principal investing activities decreased by $64 million ($40 million after
tax), or 81%. This improvement was offset by a $55 million ($34
million after tax), or 40%, decline in net interest income, due primarily
to the change in the net effect of funds transfer pricing, and a $23 million
($14 million after tax), or 75%, reduction in net securities gains recorded
by Treasury.
In 2001, Other Segments generated a $20 million net loss, compared with
net income of $58 million for the prior year. The decrease in results was
due primarily to net losses of $79 million ($50 million after tax) from
principal investing in 2001, compared with net gains of $70 million ($44
million after tax) in 2000. In addition, net interest income declined by
$54 million ($34 million after tax), or 64%, due largely to the change
27 NEXT PAGEPREVIOUS PAGE SEARCH BACK TO CONTENTS
Year ended December 31, Change 2002 vs 2001
dollars in millions 2002 2001 2000 Amount Percent
SUMMARY OF OPERATIONSNet interest income (TE) $ 235 $ 216 $ 214 $ 19 8.8%Noninterest income 874 943 974 (69) (7.3)
Total revenue (TE) 1,109 1,159 1,188 (50) (4.3)Provision for loan losses 14 13 4 1 7.7Noninterest expense 846 926 944 (80) (8.6)
Income before income taxes (TE) 249 220 240 29 13.2Allocated income taxes and TE adjustments 93 91 98 2 2.2
Net income $ 156 $ 129 $ 142 $ 27 20.9%
Percent of consolidated net income 16% 98% 14% N/A N/A
AVERAGE BALANCESLoans $4,904 $5,266 $5,439 $(362) (6.9)%Total assets 8,382 8,965 8,994 (583) (6.5)Deposits 3,924 3,679 3,480 245 6.7
TE = Taxable Equivalent, N/A = Not Applicable
FIGURE 5 KEY CAPITAL PARTNERS
ADDITIONAL KEY CAPITAL PARTNERS DATADecember 31, 2002dollars in millions
Assets under management $61,694Nonmanaged and brokerage assets 64,968High Net Worth sales personnel 807
in the net effect of funds transfer pricing. The adverse effects of these
factors were partially offset by net securities gains of $31 million ($19
million after tax) recorded by Treasury in 2001, compared with net
securities losses of $40 million ($25 million after tax) in 2000.
RESULTS OF OPERATIONSNet interest incomeKey’s principal source of earnings is net interest income, which includes
interest paid to Key on earning assets such as loans and securities, as
well as loan-related fee income; less interest expense paid on deposits
and borrowings. There are several factors that affect net interest
income, including:
• the volume, pricing, mix and maturity of earning assets and interest-
bearing liabilities;
• the use of derivative instruments to manage interest rate risk;
• market interest rate fluctuations; and
• asset quality.
To make it easier to compare results among several periods and the yields
on various types of earning assets, we present all net interest income on
a “taxable-equivalent basis.” In other words, if we earn $100 of tax-
exempt income, we present those earnings at a higher amount (specifically,
$154) that — if taxed at the statutory federal income tax rate of 35% —
would yield $100.
Figure 6 shows the various components of Key’s balance sheet that affect
interest income and expense, and their respective yields or rates over the
past six years. Net interest income for 2002 was $2.9 billion, essentially
unchanged from the prior year as the positive effect of an improved net
interest margin was offset by the effect of a decrease in average earning assets.
Key’s net interest margin rose 16 basis points to 3.97%. The net interest
margin is an indicator of the profitability of the earning asset portfolio and
is calculated by dividing net interest income by average earning assets.

28 NEXT PAGEPREVIOUS PAGE SEARCH BACK TO CONTENTS
MANAGEMENT’S DISCUSSION & ANALYSIS OF FINANCIAL CONDITION & RESULTS OF OPERATIONS KEYCORP AND SUBSIDIARIES
FIGURE 6 AVERAGE BALANCE SHEETS, NET INTEREST INCOME AND YIELDS/RATES
Year ended December 31,
2002 2001 2000
Average Yield/ Average Yield/ Average Yield/dollars in millions Balance Interest Rate Balance Interest Rate Balance Interest Rate
ASSETSLoansa,b
Commercial, financial and agricultural $17,767 $ 907 5.10% $19,459 $1,362 7.00% $19,369 $1,669 8.63%Real estate — commercial mortgage 6,345 373 5.87 6,821 511 7.50 6,911 628 9.10Real estate — construction 5,851 315 5.38 5,654 411 7.27 4,815 464 9.63Commercial lease financing 7,263 491 6.76 7,049 490 6.95 6,821 493 7.22
Total commercial loans 37,226 2,086 5.60 38,983 2,774 7.12 37,916 3,254 8.59Real estate — residential 2,126 149 7.00 3,607 275 7.64 4,274 325 7.61Home equity 13,028 889 6.82 10,595 906 8.55 8,857 822 9.29Credit card — — — — — — — — —Consumer — direct 2,206 183 8.29 2,427 232 9.55 2,592 265 10.19Consumer — indirect lease financing 1,405 126 8.96 2,618 217 8.27 3,089 249 8.03Consumer — indirect other 5,155 471 9.15 5,529 530 9.58 6,032 570 9.44
Total consumer loans 23,920 1,818 7.60 24,776 2,160 8.72 24,844 2,231 8.97Loans held for sale 2,247 123 5.52 2,217 169 7.64 2,534 230 9.05
Total loans 63,393 4,027 6.35 65,976 5,103 7.73 65,294 5,715 8.75Taxable investment securities 1 — 8.59 2 — 8.60 2 — 8.42Tax-exempt investment securitiesa 180 16 8.67 277 25 8.76 391 34 8.76
Total investment securities 181 16 8.67 279 25 8.76 393 34 8.75Securities available for salea,c 6,359 389 6.14 6,625 455 6.89 6,470 448 6.80Short-term investments 1,496 30 1.99 1,712 65 3.81 1,717 83 4.84Other investmentsc 871 24 2.57 849 24 2.86 701 25 3.74
Total earning assets 72,300 4,486 6.20 75,441 5,672 7.52 74,575 6,305 8.45Allowance for loan losses (1,553) (1,090) (959)Accrued income and other assets 11,034 10,552 10,419
$81,781 $84,903 $84,035
LIABILITIES AND SHAREHOLDERS’ EQUITYMoney market deposit accounts $13,197 125 .94 $12,323 254 2.06 $12,211 414 3.39Savings deposits 1,986 13 .67 1,952 21 1.05 2,206 32 1.47NOW accounts 564 6 1.02 619 9 1.43 612 10 1.59Certificates of deposit ($100,000 or more)d 4,741 218 4.63 5,284 301 5.71 5,511 340 6.15Other time deposits 12,859 496 3.86 14,208 786 5.53 13,974 805 5.76Deposits in foreign office 2,336 39 1.67 2,715 107 3.94 2,593 167 6.45
Total interest-bearing deposits 35,683 897 2.52 37,101 1,478 3.98 37,107 1,768 4.76Federal funds purchased and securities
sold under repurchase agreements 5,527 90 1.63 5,197 198 3.80 4,931 287 5.82Bank notes and other short-term borrowingsd 2,943 79 2.67 6,829 302 4.43 7,121 428 6.01Long-term debt, including capital securitiesd,e 16,961 551 3.29 15,911 824 5.20 15,707 1,064 6.78
Total interest-bearing liabilities 61,114 1,617 2.66 65,038 2,802 4.31 64,866 3,547 5.47Noninterest-bearing deposits 9,098 8,354 8,328Accrued expense and other liabilities 5,045 4,939 4,329Shareholders’ equity 6,524 6,572 6,512
$81,781 $84,903 $84,035
Interest rate spread (TE) 3.54% 3.21% 2.98%
Net interest income (TE) and netinterest margin (TE) $2,869 3.97% $2,870 3.81% $2,758 3.69%
Capital securities $1,254 $78 $1,309 $89 $1,243 $95TE adjustmenta 120 45 28a Interest income on tax-exempt securities and loans has been adjusted to a taxable-equivalent basis using the statutory federal income tax rate of 35%.b For purposes of these computations, nonaccrual loans are included in average loan balances.c Yield is calculated on the basis of amortized cost.d Rate calculation excludes basis adjustments related to fair value hedges. See Note 20 (“Derivatives and Hedging Activities”), which begins on page 84, for an explanation of fair value hedges.e Rate calculation excludes ESOP debt.TE = Taxable Equivalent, N/M = Not Meaningful

29 NEXT PAGEPREVIOUS PAGE SEARCH BACK TO CONTENTS
MANAGEMENT’S DISCUSSION & ANALYSIS OF FINANCIAL CONDITION & RESULTS OF OPERATIONS KEYCORP AND SUBSIDIARIES
Compound AnnualRate of Change
1999 1998 1997 (1997-2002)
Average Yield/ Average Yield/ Average Yield/ AverageBalance Interest Rate Balance Interest Rate Balance Interest Rate Balance Interest
$17,695 $1,350 7.63% $15,413 $1,251 8.12% $12,911 $1,126 8.72% 6.6% (4.2)%6,946 580 8.35 7,080 627 8.86 7,101 663 9.34 (2.2) (10.9)4,076 343 8.42 2,866 254 8.86 1,945 188 9.67 24.6 10.96,092 445 7.30 4,822 359 7.45 3,310 228 6.89 17.0 16.6
34,809 2,718 7.81 30,181 2,491 8.25 25,267 2,205 8.73 8.1 (1.1)4,479 338 7.55 5,440 422 7.76 6,192 524 8.46 (19.2) (22.2)7,548 645 8.55 6,353 557 8.77 5,180 469 9.05 20.3 13.6
997 152 15.25 1,438 212 14.74 1,710 256 14.97 N/M N/M2,457 238 9.69 2,139 228 10.66 2,238 246 10.99 (.3) (5.7)2,922 236 8.08 2,024 171 8.45 1,156 99 8.56 4.0 4.96,584 608 9.23 6,647 603 9.07 7,023 633 9.01 (6.0) (5.7)
24,987 2,217 8.87 24,041 2,193 9.12 23,499 2,227 9.48 .4 (4.0)2,605 228 8.75 3,200 262 8.19 2,649 198 7.47 (3.2) (9.1)
62,401 5,163 8.27 57,422 4,946 9.02 51,415 4,630 9.01 4.3 (2.8)2 — 12.73 3 — 7.61 4 — 7.86 (24.2) N/M
535 46 8.60 801 67 8.36 1,227 97 7.91 (31.9) (30.3)
537 46 8.57 804 67 8.33 1,231 97 7.87 (31.8) (30.3)6,403 425 6.68 6,610 450 6.84 7,629 527 6.69 (3.6) (5.9)1,873 78 4.16 1,563 84 5.37 782 40 5.12 13.9 (5.6)
442 15 3.46 279 12 4.36 243 12 4.55 29.1 14.9
71,656 5,727 7.99 66,678 5,559 8.34 61,300 5,306 8.66 3.4 (3.3)(911) (888) (875) 12.2
10,201 9,491 8,525 5.3
$80,946 $75,281 $68,950 3.5
$12,950 390 3.01 $11,650 382 3.28 $10,897 333 3.06 3.9 (17.8)2,716 44 1.62 3,225 59 1.83 4,319 94 2.18 (14.4) (32.7)
791 12 1.52 1,215 20 1.65 1,560 32 2.05 (18.4) (28.5)4,257 223 5.24 3,520 194 5.51 3,376 190 5.63 7.0 2.8
11,969 595 4.97 12,240 654 5.34 13,273 715 5.39 (.6) (7.1)823 41 4.98 913 50 5.48 1,812 98 5.41 5.2 (16.8)
33,506 1,305 3.89 32,763 1,359 4.15 35,237 1,462 4.15 .3 (9.3)
4,856 220 4.53 6,635 342 5.15 6,942 359 5.17 (4.5) (24.2)7,912 426 5.38 7,975 459 5.76 4,741 283 5.97 (9.1) (22.5)
16,473 957 6.09 11,175 681 6.30 6,554 413 6.38 20.9 5.9
62,747 2,908 4.63 58,548 2,841 4.85 53,474 2,517 4.71 2.7 (8.5)8,474 8,509 8,536 1.33,464 2,681 2,074 19.56,261 5,543 4,866 6.0
$80,946 $75,281 $68,950 3.5
3.36% 3.49% 3.95%
$2,819 3.93% $2,718 4.08% $2,789 4.54% .6%
$1,162 $85 $879 $65 $648 $49 14.1% 9.7%32 34 44 22.2

MANAGEMENT’S DISCUSSION & ANALYSIS OF FINANCIAL CONDITION & RESULTS OF OPERATIONS KEYCORP AND SUBSIDIARIES
Average earning assets decreased by 4% to $72.3 billion, due primarily to
declines in both commercial and consumer loans (other than home equity
loans). These declines reflected weak loan demand in a challenging economic
environment, as well as the effect of management’s decision to exit and/or
reduce certain lending activities. This decision is more fully discussed
below in the section entitled “Interest earning assets.”
In 2001, net interest income was $2.9 billion, representing a $112
million, or 4%, increase from 2000. This growth reflected an improved
net interest margin, which increased 12 basis points to 3.81%. Average
earning assets increased by 1% to $75.4 billion, as growth in the
commercial and home equity portfolios more than offset declines in other
portfolios (some of which declined due to the strategic decision
mentioned above).
Net interest margin. Key’s net interest margin improved over the past two
years, primarily because:
• we benefited from declining short-term interest rates;
• the interest rate spread on our total loan portfolio improved as we
continued to focus on those businesses, such as home equity lending,
that typically generate higher interest rate spreads;
• we sold loans with interest rate spreads that did not meet Key’s
internal profitability standards; and
• a greater proportion of Key’s earning assets was supported by
noninterest-bearing liabilities (such as demand deposits) and
shareholders’ equity.
Interest earning assets. Average earning assets for 2002 totaled $72.3
billion, which was $3.1 billion, or 4%, lower than the 2001 level.
This decrease came principally from the loan portfolio and was
attributable to a number of factors, including Key’s decision in May 2001
to exit or scale back certain types of lending. Another factor was loan
sales, including the September 2001 sale of $1.4 billion of residential
mortgage loans. Weak loan demand resulting from the general economic
slowdown has also contributed to the net decline in loans.
In 2001, average earning assets totaled $75.4 billion, representing an
$866 million, or 1%, increase from the prior year. This improvement was
driven by the growth of Key’s loan portfolio, with the largest increases
occurring in the commercial and home equity sectors. However, our
decision to scale back or exit certain types of lending, and slower
demand for loans in a weak economy, led to declines in Key’s commercial
and consumer loans during the second half of 2001. The September sale
of $1.4 billion of residential mortgage loans also contributed to the
decline in consumer loans.
Over the past two years, the growth and composition of Key’s loan
portfolio has been affected by several actions:
• During the third quarter of 2001, we sold $1.4 billion of residential
mortgage loans, which were generated by our private banking and
community development businesses. These loans are originated as a
customer and community accommodation and are sold periodically
because they have relatively low interest rate spreads that do not meet
Key’s internal profitability standards.
• During the second quarter of 2001, management announced that Key
would exit the automobile leasing business, de-emphasize indirect prime
automobile lending and discontinue certain credit-only commercial
relationships. These portfolios, in the aggregate, have declined by
approximately $3.3 billion since the date of the announcement through
December 31, 2002.
• We sold commercial mortgage loans of $1.4 billion during 2002
and $1.7 billion during 2001. Since some of these loans have been sold
with limited recourse, Key established a loss reserve of an amount
estimated by management to be appropriate to reflect the recourse risk.
More information about the related recourse agreement is provided
in Note 19 (“Commitments, Contingent Liabilities and Guarantees”)
under the section entitled “Recourse agreement with Federal National
Mortgage Association” on page 83. Our business of originating and
servicing commercial mortgage loans has grown, in part as a result of
acquiring Conning Asset Management in the second quarter of 2002
and both Newport Mortgage Company, L.P. and National Realty
Funding L.C. in 2000.
• We sold education loans of $1.1 billion ($750 million through
securitizations) during 2002 and $1.2 billion ($491 million through
securitizations) during 2001.
Figure 7 shows how the changes in yields or rates and average balances
from the prior year affected net interest income. The section entitled
“Financial Condition,” which begins on page 36, contains more discussion
about changes in earning assets and funding sources.
Market risk managementThe values of some financial instruments vary not only with changes in
market interest rates, but also with changes in foreign exchange rates,
factors influencing valuations in the equity securities markets, and
other market-driven rates or prices. For example, the value of a fixed-
rate bond will decline if market interest rates increase; the bond will
become a less attractive investment to the holder. Similarly, the value
of the U.S. dollar regularly fluctuates in relation to other currencies. The
exposure that instruments tied to such external factors present is
called “market risk.” Most of Key’s market risk is derived from interest
rate fluctuations.
Interest rate risk management
Key’s Asset/Liability Management Policy Committee has developed a
program to measure and manage interest rate risk. This committee is also
responsible for approving Key’s asset/liability management policies,
overseeing the formulation and implementation of strategies to improve
balance sheet positioning and earnings, and reviewing Key’s interest rate
sensitivity exposure.
Factors contributing to interest rate exposure. Key uses interest rate
exposure models to quantify the potential impact on earnings and
economic value of equity arising from a variety of possible future interest
rate scenarios. The many interest rate scenarios modeled estimate the level
of Key’s interest rate exposure arising from option risk, basis risk and
gap risk.
• A financial instrument presents “option risk” when one party to the
instrument can take advantage of changes in interest rates without
penalty. For example, when interest rates decline, borrowers may
choose to prepay fixed-rate loans by refinancing at a lower rate.
30 NEXT PAGEPREVIOUS PAGE SEARCH BACK TO CONTENTS

MANAGEMENT’S DISCUSSION & ANALYSIS OF FINANCIAL CONDITION & RESULTS OF OPERATIONS KEYCORP AND SUBSIDIARIES
Such a prepayment gives Key a return on its investment (the principal
plus some interest), but unless there is a prepayment penalty, that
return may not be as high as the return that would have been
generated had payments been received for the duration originally
scheduled. Floating-rate loans that are capped against potential
interest rate increases, and deposits that can be withdrawn on demand
also present option risk.
• One approach that Key follows to manage interest rate risk is to use
floating-rate liabilities (such as borrowings) to fund floating-rate
assets (such as loans). That way, as our interest expense increases, so
will our interest income. We face “basis risk” when our floating-rate
assets and floating-rate liabilities reprice in response to different
market factors or indices. Under those circumstances, even if equal
amounts of assets and liabilities are repricing at the same time, interest
expense and interest income may not change by the same amount.
• We often use an interest-bearing liability to fund an interest-earning
asset. For example, Key may sell certificates of deposit and use the
proceeds to make loans. That strategy presents “gap risk” if the
related liabilities and assets do not mature or reprice at the same time.
Measurement of short-term interest rate exposure. Key uses a net
interest income simulation model to measure interest rate risk over a
short time frame. These simulations estimate the impact that various
changes in the overall level of interest rates over one- and two-year time
horizons would have on net interest income. The results help Key
develop strategies for managing exposure to interest rate risk.
Like any forecasting technique, interest rate simulation modeling is based
on a large number of assumptions and judgments. In this case, the
assumptions relate primarily to loan and deposit growth, asset and liability
prepayments, interest rates, and on- and off-balance sheet management
strategies. Management believes that, both individually and in the aggregate,
the assumptions Key makes are reasonable. Nevertheless, the simulation
modeling process produces only a sophisticated estimate, not a precise
calculation of exposure.
Key’s guidelines for risk management call for preventive measures to
be taken if the simulation modeling demonstrates that a gradual 200
basis point increase or decrease in short-term rates over the next
twelve months would adversely affect net interest income over the same
period by more than 2%. Key is operating within these guidelines. Since
short-term interest rates were relatively low at December 31, 2002,
management modified Key’s standard rate scenario of a gradual
decrease of 200 basis points over twelve months to a gradual decrease
of 50 basis points over three months and no change over the following
nine months. As of December 31, 2002, based on the results of our
simulation model, and assuming that management does not take action
to alter the outcome, Key would expect net interest income to decrease
by approximately .43% if short-term interest rates gradually increase
by 200 basis points. Conversely, if short-term interest rates gradually
decrease by 50 basis points over the next three months, net interest
income would be expected to decrease by approximately .51% over the
next twelve months.
31 NEXT PAGEPREVIOUS PAGE SEARCH BACK TO CONTENTS
FIGURE 7 COMPONENTS OF NET INTEREST INCOME CHANGES
2002 vs 2001 2001 vs 2000
Average Yield/ Net Average Yield/ Netin millions Volume Rate Change Volume Rate Change
INTEREST INCOMELoans $(193) $ (883) $(1,076) $ 59 $(671) $(612)Tax-exempt investment securities (9) — (9) (10) 1 (9)Securities available for sale (18) (48) (66) 10 (3) 7Short-term investments (7) (28) (35) — (18) (18)Other investments 1 (1) — 5 (6) (1)
Total interest income (taxable equivalent) (226) (960) (1,186) 64 (697) (633)
INTEREST EXPENSEMoney market deposit accounts 17 (146) (129) 4 (164) (160)Savings deposits — (8) (8) (3) (8) (11)NOW accounts (1) (2) (3) — (1) (1)Certificates of deposit ($100,000 or more) (29) (54) (83) (14) (25) (39)Other time deposits (69) (221) (290) 13 (32) (19)Deposits in foreign office (13) (55) (68) 8 (68) (60)
Total interest-bearing deposits (95) (486) (581) 8 (298) (290)Federal funds purchased and securities sold
under repurchase agreements 12 (120) (108) 15 (104) (89)Bank notes and other short-term borrowings (132) (91) (223) (17) (109) (126)Long-term debt, including capital securities 51 (324) (273) 14 (254) (240)
Total interest expense (164) (1,021) (1,185) 20 (765) (745)
Net interest income (taxable equivalent) $ (62) $ 61 $ (1) $ 44 $ 68 $ 112
The change in interest not due solely to volume or rate has been allocated in proportion to the absolute dollar amounts of the change in each.

32 NEXT PAGEPREVIOUS PAGE SEARCH BACK TO CONTENTS
MANAGEMENT’S DISCUSSION & ANALYSIS OF FINANCIAL CONDITION & RESULTS OF OPERATIONS KEYCORP AND SUBSIDIARIES
The decline in net interest income under both of the preceding scenarios
reflects the fact that Key is currently in a liability sensitive position when
interest rates increase and an asset sensitive position when rates decrease.
Key’s asset sensitive position to a decrease in interest rates stems from
the fact that short-term rates are at historically low levels. Consequently,
the results of the simulation model reflect management’s assumption that
deposit rates will not decline from current levels, while interest rates on
earning assets will continue to do so. To mitigate the risk of a potentially
adverse effect on earnings, management is using interest rate contracts
while maintaining the flexibility to lower rates on deposits, if necessary.
Key has historically been in a liability sensitive position when interest
rates are rising. Management actively monitors the risk to higher rates
and would endeavor to take preventive actions to ensure that net interest
income at risk does not exceed guidelines established by the Asset/Liability
Management Policy Committee. Also, Key’s lines of business have the
ability to mitigate the negative effect on net interest income from rising
interest rates by growing loans and deposits with profitable interest
rate spreads.
Measurement of long-term interest rate exposure. Key uses an economic
value of equity model to complement short-term interest rate risk
analysis. The benefit of this model is that it measures exposure to
interest rate changes over time frames longer than two years. The
economic value of Key’s equity is determined by aggregating the present
value of projected future cash flows for asset, liability and derivative
positions based on the current yield curve. However, economic value does
not represent the fair values of asset, liability and derivative positions
since it does not consider factors like credit risk and liquidity.
Key’s guidelines for risk management call for preventive measures to be
taken if an immediate 200 basis point increase or decrease in interest
rates is estimated to reduce the economic value of equity by more than
15%. Key is operating within these guidelines. Certain short-term
interest rates were limited to reductions of less than 200 basis points since
interest rates cannot decrease below zero in Key’s economic value of
equity model.
Management of interest rate exposure. Management uses the results of
short-term and long-term interest rate exposure models to formulate
strategies to improve balance sheet positioning, earnings, or both,
within the bounds of Key’s interest rate risk, liquidity and capital
guidelines. We manage interest rate risk by using portfolio swaps and
caps, which modify the repricing or maturity characteristics of some of
our assets and liabilities. The decision to use these instruments rather
than securities, debt or other on-balance sheet alternatives depends on
many factors, including the mix and cost of funding sources, liquidity
and capital requirements, and interest rate implications.
A brief description of interest rate swaps and caps follows.
• Interest rate swaps are contracts in which two parties agree to
exchange interest payment streams that are calculated based on
agreed-upon amounts (known as “notional amounts”). For example,
party A will pay interest at a fixed rate to, and receive interest at a
variable rate from, party B. Key generally uses interest rate swaps to
mitigate its exposure to interest rate risk on certain loans, securities,
deposits, short-term borrowings and long-term debt.
• Interest rate caps are contracts under which the holder is compensated
based on an agreed-upon notional amount when a benchmark interest
rate exceeds a specified level (known as the “strike rate”). Caps
limit exposure to interest rate increases, but have no effect if interest
rates decline. Key has used interest rate caps to manage the risk of
adverse movements in interest rates on some of its debt.
For more information about how Key uses interest rate swaps and
caps to manage its balance sheet, see Note 20 (“Derivatives and Hedging
Activities”), which begins on page 84.
Trading portfolio risk management
Key’s trading portfolio includes interest rate swap contracts entered into
to accommodate the needs of clients, positions with third parties that are
intended to offset or mitigate the interest rate risk of client positions,
foreign exchange contracts entered into to accommodate the needs of
clients, and proprietary trading positions in financial assets and liabilities.
The fair values of these trading portfolio items are included in “accrued
income and other assets” or “accrued expense and other liabilities” on
the balance sheet. For more information about these items, see Note 20
(“Derivatives and Hedging Activities”), which begins on page 84.
Management uses a value at risk (“VAR”) model to estimate the
potential adverse effect of changes in interest and foreign exchange rates,
and equity prices on the fair value of Key’s trading portfolio. Using
statistical methods, this model estimates the maximum potential one-day
loss with 95% probability. At December 31, 2002, Key’s aggregate
daily VAR was $.9 million, compared with $1.4 million at December 31,
2001. Aggregate daily VAR averaged $1.4 million for 2002, compared
with an average of $1.3 million during 2001. VAR modeling augments
other controls that Key uses to mitigate the market risk exposure of the
trading portfolio. These controls include loss and portfolio size limits that
are based on market liquidity and the level of activity and volatility of
trading products.
Noninterest incomeNoninterest income for 2002 was $1.8 billion, representing a $44
million, or 3%, increase from the prior year. In 2001, noninterest
income of $1.7 billion was down $469 million, or 21%, from 2000.
The 2002 improvement in noninterest income was due primarily to an
$84 million increase in income from investment banking and capital
markets activities. This increase was attributable to strong growth in
investment banking fees, but also reflected two significant charges
recorded during the fourth quarter of 2001. These charges included a
$45 million write-down of the principal investing portfolio and a $15
million increase to the reserve for customer derivative losses. Also
contributing to the 2002 improvement was an $18 million increase in
service charges on deposit accounts and a $10 million rise in letter of
credit and nonyield-related loan fees. These positive results were offset
in part by a $42 million reduction in income from trust and investment
services and a $29 million decrease in net securities gains.
In 2001, Key’s noninterest income decreased principally because noninterest
income in 2000 included a $332 million gain from the sale of Key’s credit
card portfolio in January 2000. For more information on this transaction,
see Note 3 (“Acquisitions and Divestitures”) on page 64. In addition,

33 NEXT PAGEPREVIOUS PAGE SEARCH BACK TO CONTENTS
MANAGEMENT’S DISCUSSION & ANALYSIS OF FINANCIAL CONDITION & RESULTS OF OPERATIONS KEYCORP AND SUBSIDIARIES
capital markets-sensitive revenues, particularly those generated by the
asset management, principal investing and brokerage businesses, were
affected adversely by the recessionary economy. Income from investment
banking and capital markets activities decreased by $205 million (including
the $60 million of 2001 charges discussed on page 32), while income from
trust and investment services declined by $36 million. These reductions were
substantially offset by increases in net securities gains (up $63 million),
service charges on deposit accounts (up $46 million) and letter of credit and
nonyield-related loan fees (up $17 million).
Figure 8 shows the major components of Key’s noninterest income. The
discussion that follows provides additional information, such as the
composition of certain components and the factors that caused them to
change in 2002 and 2001.
FIGURE 8 NONINTEREST INCOME
Year ended December 31, Change 2002 vs 2001
dollars in millions 2002 2001 2000 Amount Percent
Trust and investment services income $ 609 $ 651 $ 687 $(42) (6.5)%Service charges on deposit accounts 405 387 341 18 4.7Investment banking and capital markets income 172 88 293 84 95.5Letter of credit and loan fees 134 124 107 10 8.1Corporate-owned life insurance income 108 114 109 (6) (5.3)Electronic banking fees 79 74 68 5 6.8Net securities gains (losses) 6 35 (28) (29) (82.9)Gain from sale of credit card portfolio — — 332 — —Other income:
Insurance income 57 56 62 1 1.8Net gains from loan securitizations and sales 56 49 31 7 14.3Loan securitization servicing fees 9 16 24 (7) (43.8)Credit card fees 9 7 11 2 28.6Miscellaneous income 125 124 157 1 .8
Total other income 256 252 285 4 1.6
Total noninterest income $1,769 $1,725 $2,194 $ 44 2.6%
FIGURE 9 TRUST AND INVESTMENT SERVICES INCOME
Year ended December 31, Change 2002 vs 2001
dollars in millions 2002 2001 2000 Amount Percent
Personal asset management and custody fees $162 $179 $189 $(17) (9.5)%Institutional asset management and custody fees 77 86 93 (9) (10.5)Bond services 36 41 42 (5) (12.2)Brokerage commission income 198 202 224 (4) (2.0)All other fees 136 143 139 (7) (4.9)
Total trust and investment services income $609 $651 $687 $(42) (6.5)%
Trust and investment services income. Trust and investment services
provide Key’s largest source of noninterest income. Its primary
components are shown in Figure 9. A significant portion of this income
is based on the value of assets under management. Thus, over the past two
years, the level of revenue derived from these services has been adversely
affected by continued declines in the equity and fixed income markets.
At December 31, 2002, Key’s bank, trust and registered investment
advisory subsidiaries had assets under management of $61.7 billion,
compared with $72.7 billion at the end of 2001. These assets are managed
on behalf of both institutions and individuals through a variety of equity,
fixed income and money market accounts. The composition of Key’s
assets under management is shown in Figure 10. In 2002, the value of
total assets under management decreased by a net 15%. This decrease
reflects a decline in the market value of assets under management, as
well as net asset outflows of approximately $4.1 billion during the year.
Approximately 60% of the outflows represent funds that have been
transferred to an outside vendor in connection with Key’s decision in 2002
to sell the 401(k) recordkeeping business. Another 20% of the outflows
are attributable to funds which clients have elected to move from money
market funds under management to an FDIC insured deposit account with
Key. As shown in Figure 10, 56% of the assets Key manages are invested
in more stable fixed income or money market funds. The performance of
the majority of Key’s investment products exceeded the performance
of their respective benchmarks.

34 NEXT PAGEPREVIOUS PAGE SEARCH BACK TO CONTENTS
MANAGEMENT’S DISCUSSION & ANALYSIS OF FINANCIAL CONDITION & RESULTS OF OPERATIONS KEYCORP AND SUBSIDIARIES
December 31,in millions 2002 2001 2000
Assets under management by investment type:
Equity $27,224 $35,798 $37,748Fixed income 16,133 16,919 14,579Money market 18,337 20,000 21,688
Total $61,694 $72,717 $74,015
Proprietary mutual funds included in assets under management:
Equity $ 2,878 $ 3,973 $ 4,405Fixed income 1,215 1,190 1,042Money market 11,457 13,801 15,307
Total $15,550 $18,964 $20,754
FIGURE 10 ASSETS UNDER MANAGEMENT Investment banking and capital markets income. As shown in Figure 11,
the 2002 increase in investment banking and capital markets income was
driven by improved results from investment banking activities and from
principal investing. The improvement in principal investing reflects the
$45 million charge taken for write-downs in the fourth quarter of 2001.
Key’s principal investing income is susceptible to volatility since it is
derived from investments in small to medium-sized businesses in various
stages of economic development and strategy implementation. While
most of Key’s principal investments are in their mid to late stages, those
that are in their early stages are more vulnerable to changes in general
economic conditions. Principal investments consist of direct and indirect
investments in predominantly privately-held companies and are carried on
the balance sheet at fair value ($677 million at December 31, 2002, and
$621 million at December 31, 2001). Thus, the net gains and losses
presented in Figure 11 stem from changes in estimated fair values, as well
as actual gains and losses on sales of principal investments. If the current
weakness in the economy continues, management anticipates there may
be a further decline in the fair value of the principal investing portfolio.
Year ended December 31, Change 2002 vs 2001
dollars in millions 2002 2001 2000 Amount Percent
Dealer trading and derivatives income $ 32 $ 25 $ 80 $ 7 28.0%Investment banking income 121 102 107 19 18.6Net gains (losses) from principal investing (14) (79) 71 65 82.3Foreign exchange income 33 40 35 (7) (17.5)
Total investment banking and capital markets income $172 $ 88 $293 $84 95.5%
FIGURE 11 INVESTMENT BANKING AND CAPITAL MARKETS INCOME
Service charges on deposit accounts. In 2002, service charges on deposit
accounts rose for the second consecutive year. These fees increased
over the past two years primarily because of strategies implemented in
connection with Key’s competitiveness initiative and higher levels of
noninterest-bearing deposits. The growth in these fees slowed during the
second half of 2002 as free checking products were introduced in the
third quarter and rolled out to all of Key’s markets by the end of the year.
Corporate-owned life insurance income. Income from corporate-owned
life insurance, representing a tax-deferred increase in cash surrender values
and tax-exempt death benefits, decreased by 5% in 2002, following a 5%
increase in the prior year.
Securities transactions. During 2002, Key realized net securities gains
of $6 million, compared with net gains of $35 million in 2001 and net
losses of $28 million in 2000. Since the 2001 sales involved primarily
equity securities, the sales did not have a significant adverse affect on
Key’s net interest income in subsequent periods. In 2000, Key’s securities
transactions included $50 million of net losses that resulted from the
reconfiguration of the fixed income securities portfolio.
Other income. Other income for 2002 increased by $4 million, or 2%,
from 2001. The $33 million decrease in 2001 compared with the prior
year was due largely to a $40 million charge (included in miscellaneous
income) taken in the second quarter to establish a reserve for losses
incurred on the residual values of leased vehicles. This charge was offset
in part by an increase in net gains from loan securitizations and sales, and
higher fees from electronic banking services. Also, traditional fee income
was supplemented in the fourth quarter of 2001 by $10 million of
additional revenue, representing the value of shares received as a result
of the demutualization of an insurance company in which Key is a
policyholder. Key contributed these shares to its charitable foundation,
which also increased miscellaneous expense by $10 million.
Noninterest expenseNoninterest expense for 2002 was $2.7 billion, representing a $288
million, or 10%, decrease from the prior year and Key’s lowest level of
expense for any year since 1998. In 2001, noninterest expense of $2.9
billion was essentially unchanged from 2000.
The 2002 reduction in noninterest expense reflected a $234 million
decrease in amortization expense related to intangibles, which resulted
from two significant events. In the second quarter of 2001, we recorded
a $150 million write-down of goodwill associated with Key’s decision to
downsize its automobile finance business. In addition, a 2002 prescribed
change in accounting for goodwill reduced amortization expense by
approximately $79 million. For more information pertaining to the
accounting change, see the section entitled “Amortization of intangibles”
on page 36. Other factors that contributed to the 2002 improvement in

35 NEXT PAGEPREVIOUS PAGE SEARCH BACK TO CONTENTS
MANAGEMENT’S DISCUSSION & ANALYSIS OF FINANCIAL CONDITION & RESULTS OF OPERATIONS KEYCORP AND SUBSIDIARIES
noninterest expense were a $60 million reduction in computer processing
expense, a $16 million decrease in equipment expense and a $20 million
charge (included in miscellaneous expense) taken in the second quarter
of 2001 to increase litigation reserves. These positive results were
partially offset by a $58 million rise in personnel expense.
Noninterest expense for both 2001 and 2000 included significant
items that hinder a comparison of results between those years. In
2001, these items included the write-down of goodwill and the
additional litigation reserves mentioned above. In 2000, these items
included $127 million of restructuring and other special charges
recorded in connection with strategic actions implemented to improve
operating efficiency and profitability. More information about these
charges can be found under the heading “Restructuring and other
special charges” on page 36. Excluding these items, noninterest expense
for 2001 decreased by $19 million, or 1%, from 2000. The decrease was
due primarily to a $67 million improvement in personnel expense
and a $21 million decline in equipment expense. These reductions
were partially offset by increases in a number of other expense
components. Included in miscellaneous expense for 2001 is the $10
million contribution to our charitable foundation discussed under the
heading “Other income” on page 34.
Figure 12 shows the components of Key’s noninterest expense. The
discussion that follows explains the composition of certain components
and the factors that caused them to change in 2002 and 2001.
Year ended December 31, Change 2002 vs 2001
dollars in millions 2002 2001 2000 Amount Percent
Personnel $1,436 $1,378 $1,445 $ 58 4.2%Net occupancy 226 232 223 (6) (2.6)Computer processing 192 252 240 (60) (23.8)Equipment 136 152 173 (16) (10.5)Marketing 122 112 110 10 8.9Professional fees 92 88 89 4 4.5Amortization of intangibles 11 245 101 (234) (95.5)Restructuring charges (credits) — (4) 102 4 100.0Other expense:
Postage and delivery 59 63 65 (4) (6.3)Telecommunications 35 44 51 (9) (20.5)Equity- and gross receipts-based taxes 26 29 33 (3) (10.3)OREO expense, net 7 6 7 1 16.7Miscellaneous expense 311 344 278 (33) (9.6)
Total other expense 438 486 434 (48) (9.9)
Total noninterest expense $2,653 $2,941 $2,917 $(288) (9.8)%
Full-time equivalent employees at year end 20,437 21,230 22,142 (793) (3.7)%
FIGURE 12 NONINTEREST EXPENSE
Personnel. Personnel expense, the largest category of Key’s noninterest
expense, rose by $58 million, or 4%, in 2002 following decreases in each
of the previous two years. The 2002 increase was due primarily to a rise
in the cost of benefits and the effect of annual merit increases, most of
which generally take effect during the second quarter. The level of
Key’s personnel expense continues to reflect the benefits derived from our
successful competitiveness initiative. Through this initiative we have
improved efficiency and reduced the level of personnel required to
conduct our business. At December 31, 2002, the number of full-time
equivalent employees was 20,437, compared with 21,230 at the end of
2001 and 22,142 at the end of 2000. Figure 13 shows the major
components of Key’s personnel expense.
Year ended December 31, Change 2002 vs 2001
dollars in millions 2002 2001 2000 Amount Percent
Salaries $ 867 $ 842 $ 875 $25 3.0%Employee benefits 218 188 192 30 16.0Incentive compensation 351 348 378 3 .9
Total personnel expense $1,436 $1,378 $1,445 $58 4.2%
FIGURE 13 PERSONNEL EXPENSE

MANAGEMENT’S DISCUSSION & ANALYSIS OF FINANCIAL CONDITION & RESULTS OF OPERATIONS KEYCORP AND SUBSIDIARIES
In September 2002, the Board of Directors approved management’s
recommendation to change Key’s method of accounting for stock options
granted to eligible employees and directors. Effective January 1, 2003, Key
will adopt the fair value method of accounting as outlined in SFAS No.
123, “Accounting for Stock-Based Compensation.” Additional information
pertaining to this accounting change is included in Note 1 (“Summary of
Significant Accounting Policies”) under the heading “Accounting
Pronouncements Pending Adoption” on page 62.
Computer processing. The decrease in computer processing expense
in 2002 was due primarily to a lower level of computer software
amortization. This reduction is attributable to a decline in the number of
capitalized software projects. Higher software amortization and expenses
related to software rental and maintenance accounted for the increase
in 2001.
Equipment. The decrease in equipment expense in 2002 and 2001 was
driven by reductions in depreciation and rental expense stemming from
cost management efforts and our competitiveness initiative.
Amortization of intangibles. On January 1, 2002, Key stopped amortizing
goodwill, consistent with the industry-wide adoption of new accounting
guidance. This change reduced the company’s noninterest expense by
approximately $79 million for 2002. In accordance with the new
guidance, Key completed its transitional goodwill impairment testing
during the first quarter of 2002, and determined that no impairment
existed as of January 1, 2002. Key performed its annual goodwill
impairment testing as of October 1, 2002, and determined that no
impairment existed at that date as well. Additional information pertaining
to the new accounting guidance is included in Note 1 (“Summary of
Significant Accounting Policies”) under the heading “Goodwill and
Other Intangible Assets” on page 59.
Restructuring and other special charges. Key recorded net charges of $127
million (including net restructuring charges of $104 million) in 2000 in
connection with strategic actions related to the competitiveness initiative.
For more information related to the actions taken, associated cost savings
and reductions to Key’s workforce, see the section entitled “Status of
competitiveness initiative” on page 22. Additional information related
to the restructuring charges can be found in Note 18 (“Restructuring
Charges”) on page 81. Cash generated by Key’s operations is expected to
fund the restructuring charge liability; none of the charges had a material
impact on Key’s liquidity.
Income taxesThe provision for income taxes was $336 million for 2002, compared
with $102 million for 2001 and $515 million for 2000. The effective tax
rate, which is the provision for income taxes as a percentage of income
before income taxes, was 25.6% for 2002, compared with 39.4% for
2001 and 33.9% for 2000. In 2001, the effective tax rate was significantly
distorted by the $150 million nondeductible write-down of goodwill
recorded in the second quarter in connection with Key’s decision to
downsize its automobile finance business. Excluding this charge, the
effective tax rate for 2001 was 24.9%.
The effective tax rate for 2002 and the effective tax rate for 2001
(excluding the goodwill charge) are substantially below Key’s combined
statutory federal and state rate of 37% primarily because portions of our
equipment leasing portfolio became subject to a lower income tax rate
in the latter half of 2001. Responsibility for the management of portions
of Key’s leasing portfolio was transferred to a subsidiary in a lower tax
jurisdiction. Since Key intends to permanently reinvest the earnings of
this subsidiary, no deferred income taxes have been recorded on those
earnings in accordance with SFAS No. 109, “Accounting for Income
Taxes.” Other factors that account for the difference between the
effective and statutory tax rates in each year include tax deductions
associated with dividends paid to Key’s 401(k) savings plan, income from
investments in tax-advantaged assets (such as tax-exempt securities
and corporate-owned life insurance) and credits associated with
investments in low-income housing projects.
In 2002, Key attained a higher level of pre-tax income, but proportionately
less income was derived from tax-advantaged assets. This resulted in an
increase from Key’s 2001 effective tax rate (excluding the goodwill
charge). However, the increase was moderated by the full-year effect of a
lower tax rate on our equipment leasing portfolio, as well as legislative
changes in 2002 that resulted in a higher tax deduction for dividends paid
on Key stock held in Key’s 401(k) savings plan. In addition, Key ceased
amortizing goodwill effective January 1, 2002, in accordance with new
accounting guidance specified by SFAS No. 142, “Goodwill and Other
Intangible Assets.”
In 2001, the effective tax rate (excluding the goodwill charge) decreased
significantly because tax-exempt interest income, nontaxable income
from corporate-owned life insurance and tax credits accounted for a
significantly higher portion of Key’s pre-tax income. Pre-tax income was
substantially lower in 2001 due to the effects of a weak economy and
significant charges recorded in the second and fourth quarters. In
addition, the charitable contribution of appreciated stock resulted in a
tax benefit.
FINANCIAL CONDITIONLoansAt December 31, 2002, total loans outstanding were $62.5 billion,
compared with $63.3 billion at the end of 2001 and $66.9 billion at the
end of 2000. Among the factors that contributed to the decrease in our
loans over the past two years are:
• loan sales completed to improve the profitability of the overall portfolio,
or to accommodate our funding needs;
• weakening loan demand due to the sluggish economy; and
• our efforts to exit the automobile leasing business, de-emphasize
indirect prime automobile lending and discontinue certain credit-only
commercial relationships.
Over the past several years, we have used alternative funding sources like
loan sales and securitizations to allow us to continue to capitalize on our
loan origination capabilities. In addition, Key has completed acquisitions
that have improved our ability to generate and securitize new loans,
especially in the area of commercial real estate. These acquisitions
include the purchase of Conning Asset Management in June 2002,
and both Newport Mortgage Company, L.P. and National Realty
Funding L.C. in 2000. Over the past two years, we have also sold
loans and referred new business to an asset-backed commercial paper
conduit. These sales and referrals were curtailed in 2002 to keep the
loans on Key’s balance sheet. For more information about the conduit,
36 NEXT PAGEPREVIOUS PAGE SEARCH BACK TO CONTENTS

MANAGEMENT’S DISCUSSION & ANALYSIS OF FINANCIAL CONDITION & RESULTS OF OPERATIONS KEYCORP AND SUBSIDIARIES
see Note 19 (“Commitments, Contingent Liabilities and Guarantees”)
under the heading “Guarantees” on page 83.
Figure 14 shows the composition of Key’s loan portfolio at December
31 for each of the past five years.
37 NEXT PAGEPREVIOUS PAGE SEARCH BACK TO CONTENTS
December 31, 2002 2001 2000
dollars in millions Amount % of Total Amount % of Total Amount % of Total
COMMERCIALCommercial, financial and agricultural $17,425 27.9% $18,159 28.7% $20,100 30.0%Commercial real estatea:
Commercial mortgage 6,015 9.6 6,669 10.5 6,876 10.3Construction 5,659 9.1 5,878 9.3 5,154 7.7
Total commercial real estate loans 11,674 18.7 12,547 19.8 12,030 18.0
Commercial lease financing 7,513 12.0 7,357 11.6 7,164 10.7
Total commercial loans 36,612 58.6 38,063 60.1 39,294 58.7
CONSUMERReal estate — residential mortgage 1,968 3.1 2,315 3.6 4,212 6.3Home equity 13,804 22.1 11,184 17.7 9,908 14.8Credit card — — — — — —Consumer — direct 2,161 3.5 2,342 3.7 2,539 3.8Consumer — indirect:
Automobile lease financing 873 1.4 2,036 3.2 3,005 4.5Automobile loans 2,181 3.5 2,497 4.0 2,809 4.2Marine 2,088 3.3 1,780 2.8 1,657 2.5Other 667 1.1 1,036 1.6 1,252 1.9
Total consumer — indirect loans 5,809 9.3 7,349 11.6 8,723 13.1
Total consumer loans 23,742 38.0 23,190 36.6 25,382 38.0
LOANS HELD FOR SALE 2,103 3.4 2,056 3.3 2,229 3.3
Total $62,457 100.0% $63,309 100.0% $66,905 100.0%
1999 1998
Amount % of Total Amount % of Total
COMMERCIALCommercial, financial and agricultural $18,497 28.8% $17,038 27.5%Commercial real estatea:
Commercial mortgage 6,836 10.6 7,309 11.8Construction 4,528 7.1 3,450 5.6
Total commercial real estate loans 11,364 17.7 10,759 17.4
Commercial lease financing 6,665 10.4 5,613 9.0
Total commercial loans 36,526 56.9 33,410 53.9
CONSUMERReal estate — residential mortgage 3,962 6.1 4,394 7.1Home equity 7,973 12.4 7,990 12.9Credit card — — 1,425 2.3Consumer — direct 2,565 4.0 2,342 3.8Consumer — indirect:
Automobile lease financing 3,195 5.0 2,580 4.2Automobile loans 3,082 4.8 See noteb See noteb
Marine 1,716 2.7 See noteb See noteb
Other 1,600 2.5 7,009 11.2
Total consumer — indirect loans 9,593 15.0 9,589 15.4
Total consumer loans 24,093 37.5 25,740 41.5
LOANS HELD FOR SALE 3,603 5.6 2,862 4.6
Total $64,222 100.0% $62,012 100.0%
a See Figure 15 for a more detailed breakdown of Key’s commercial real estate loan portfolio at December 31, 2002.b For 1998, indirect automobile and marine loans are included in other indirect loans.
FIGURE 14 COMPOSITION OF LOANS

MANAGEMENT’S DISCUSSION & ANALYSIS OF FINANCIAL CONDITION & RESULTS OF OPERATIONS KEYCORP AND SUBSIDIARIES
The level of Key’s total loans outstanding (excluding loans held for sale)
would have decreased by $402 million, or less than 1%, over the past
twelve months if we had not sold $741 million of loans and acquired
$244 million of loans during 2002. In the commercial loan portfolio,
growth in lease financing receivables was offset by a net decline in all
other commercial portfolios, reflecting continued weakness in the
economy and our decision to discontinue many credit-only relationships
in the leveraged financing and nationally syndicated lending businesses.
At December 31, 2002, Key’s commercial real estate portfolio included
mortgage loans of $6.0 billion and construction loans of $5.7 billion. The
average size of a mortgage loan was $.5 million and the largest mortgage
loan had a balance of $68 million. The average size of a construction
loan was $7 million. The largest construction loan commitment was $57
million; that loan had an outstanding balance of $31 million.
Key conducts its commercial real estate lending business through two
primary sources: a 12-state banking franchise and National Commercial Real
Estate (a national line of business that cultivates relationships both within
and beyond the branch system). This line of business deals exclusively with
nonowner-occupied properties (i.e., generally properties in which the owner
occupies less than 60% of the premises) and accounted for approximately
54% of Key’s total average commercial real estate loans during 2002. At
December 31, less than 1% of Key’s nonowner-occupied portfolio was
either nonperforming or delinquent in payments. Our commercial real
estate business as a whole focuses on larger real estate developers and, as
shown in Figure 15, is diversified by both industry type and geography.
Consumer loans would have increased (assuming no loan sales or
acquisitions) by $1.1 billion, or 5%, during 2002. Our home equity
portfolio grew by $3.0 billion, largely as a result of our focused efforts to
grow this business, facilitated by a period of lower interest rates. The
growth of the home equity portfolio more than offset declines of $418
million in installment loans, $1.2 billion in automobile lease financing
receivables and $347 million in residential real estate mortgage loans. The
declines in installment loans and automobile lease financing receivables reflect
our decision to de-emphasize indirect prime automobile lending and exit the
automobile leasing business.
Key’s home equity portfolio is derived from both our Retail Banking line
of business (64% of the home equity portfolio at December 31, 2002)
and our National Home Equity line of business.
The National Home Equity line of business has two components:
Champion Mortgage Company, a home equity finance company that Key
acquired in August 1997, and Key Home Equity Services, which acts as
a third-party purchaser of home equity loans. The average loan-to-value
ratio at origination for a loan generated by the National Home Equity
line of business is 80%. First lien positions comprised 79% of the
portfolio for this line of business at December 31, 2002.
Key Home Equity Services purchases individual loans from an extensive
network of correspondents and agents. Prior to the third quarter of 2002,
loans were also purchased through bulk portfolio acquisitions from home
equity loan companies.
Figure 16 summarizes Key’s home equity loan portfolio at December 31
for each of the last six years, as well as certain asset quality statistics and
the yields achieved on the portfolio as a whole.
Sales, securitizations and divestitures. During 2002, Key sold $1.4
billion of commercial real estate loans, $1.1 billion of education loans
($750 million through a securitization) and $835 million of other types
of loans. Since 1999, Key has securitized only education loans.
Among the factors that Key considers in determining which loans to
securitize are:
• whether the characteristics of a specific loan portfolio make it
conducive to securitization;
• the relative cost of funds;
• the level of credit risk; and
• capital requirements.
38 NEXT PAGEPREVIOUS PAGE SEARCH BACK TO CONTENTS
December 31, 2002 Geographic RegionTotal Percent of
dollars in millions East Midwest Central West Amount Total
Nonowner-occupied:Multi-family properties $ 594 $ 561 $ 629 $ 787 $ 2,571 22.0%Retail properties 324 565 150 226 1,265 10.8Office buildings 171 151 154 213 689 5.9Residential properties 46 108 135 425 714 6.1Warehouses 51 217 98 105 471 4.0Manufacturing facilities 36 28 6 6 76 .7Hotels/Motels 7 9 — 10 26 .2Other 247 404 79 261 991 8.5
1,476 2,043 1,251 2,033 6,803 58.2Owner-occupied 551 2,329 574 1,417 4,871 41.8
Total $2,027 $4,372 $1,825 $3,450 $11,674 100.0%
Nonowner-occupied:Nonperforming loans $6 $12 $2 $12 $32 N/MAccruing loans past due 90 days or more 6 1 — — 7 N/MAccruing loans past due 30 through 89 days 1 9 — 6 16 N/M
N/M = Not Meaningful
FIGURE 15 COMMERCIAL REAL ESTATE LOANS

39 NEXT PAGEPREVIOUS PAGE SEARCH BACK TO CONTENTS
MANAGEMENT’S DISCUSSION & ANALYSIS OF FINANCIAL CONDITION & RESULTS OF OPERATIONS KEYCORP AND SUBSIDIARIES
December 31,dollars in millions 2002 2001 2000 1999 1998 1997
SOURCES OF LOANS OUTSTANDING AT PERIOD ENDRetail KeyCenters and other sources $ 8,867 $ 6,431 $6,136 $5,740 $6,036 $5,210
Champion Mortgage Company 2,210 1,886 1,082 371 689 242Key Home Equity Services division 2,727 2,867 2,690 1,862 1,265 211
National Home Equity line of business 4,937 4,753 3,772 2,233 1,954 453
Total $13,804 $11,184 $9,908 $7,973 $7,990 $5,663
Nonperforming loans at year end $146 $60 $80 $50 $26 $15Net charge-offs for the year 52 98 17 9 5 4Yield for the year 6.82% 8.55% 9.29% 8.54% 8.77% 9.05%
FIGURE 16 HOME EQUITY LOANS
Figure 17 summarizes Key’s loan sales (including securitizations) for 2002 and 2001.
Commercial Commercial Residential Home Consumerin millions Commercial Real Estate Lease Financing Real Estate Equity — Indirect Education Total
2002
Fourth quarter $ 93 $ 603 — $ 65 $110 $177 $ 100 $1,148Third quarter 18 352 — 25 242 3 784 1,424Second quarter 31 159 $18 20 24 — 70 322First quarter — 319 — — 9 — 116 444
Total $142 $1,433 $18 $110 $385 $180 $1,070 $3,338
2001
Fourth quarter — $ 678 — — $145 — $ 23 $ 846Third quarter — 93 — $1,427 269 — 597 2,386Second quarter $44 577 — 20 59 — 144 844First quarter — 327 — 1 14 — 449 791
Total $44 $1,675 — $1,448 $487 — $1,213 $4,867
FIGURE 17 LOANS SOLD AND DIVESTED
Figure 18 shows loans that are either administered or serviced by Key, but
not recorded on the balance sheet. Included are loans that have been both
securitized and sold, or simply sold outright. In the event of default, Key
is subject to recourse with respect to approximately $227 million of the
$24.8 billion of loans administered or serviced at December 31, 2002.
Key derives income from two sources when we sell or securitize loans but
retain the right to administer or service them. We earn noninterest income
(recorded as “other income”) from servicing or administering the loans, and
we earn interest income from any securitized assets retained. Conning Asset
Management and National Realty Funding L.C. service the commercial real
estate loans shown in Figure 18, however, other financial institutions
originated most of these loans. Approximately $81 million of the assets held
in the asset-backed commercial paper conduit, for which Key serves as a
referral agent, are also included in Figure 18. For more information
regarding the conduit, see Note 19 (“Commitments, Contingent Liabilities
and Guarantees”) under the heading “Guarantees” on page 83.
December 31,in millions 2002 2001 2000
Education loans $ 4,605 $ 4,433 $ 4,113Automobile loans 54 131 422Home equity loans 456 768 1,176Commercial real
estate loans 19,508a 10,471 7,108Commercial loans 123 983 973Commercial lease
financing 13 — —
Total $24,759 $16,786 $13,792
a Includes $4.1 billion of serviced loans purchased in the June 28, 2002, acquisition of Conning Asset Management.
FIGURE 18 LOANS ADMINISTERED OR SERVICED

40 NEXT PAGEPREVIOUS PAGE SEARCH BACK TO CONTENTS
SecuritiesAt December 31, 2002, the securities portfolio totaled $9.5 billion
and included $8.5 billion of securities available for sale, $120 million of
investment securities and $919 million of other investments (primarily
principal investments). In comparison, the total portfolio at December
31, 2001, was $6.5 billion, including $5.4 billion of securities available
for sale, $225 million of investment securities and $832 million of
other investments.
The size and composition of Key’s securities portfolio are dependent
largely on our needs for liquidity and the extent to which we are required
or elect to hold these assets as collateral to secure public and trust
deposits. Although debt securities are generally used for this purpose,
other assets, such as securities purchased under resale agreements, may
be used temporarily when they provide more favorable yields.
Securities available for sale. The majority of Key’s securities available
for sale portfolio consists of collateralized mortgage obligations that
provide a source of interest income and serve as collateral in connection
with pledging requirements. A collateralized mortgage obligation
(sometimes called a “CMO”) is a debt security that is secured by a pool
of mortgages, mortgage-backed securities, U.S. government securities,
corporate debt obligations or other bonds. At December 31, 2002,
Key had $8.1 billion invested in collateralized mortgage obligations and
other mortgage-backed securities in the available-for-sale portfolio,
compared with $4.8 billion at December 31, 2001. Key invested more
heavily in these securities during 2002 as opportunities to originate loans
(Key’s preferred earning assets) have been adversely affected by the weak
economy. Substantially all of these securities were issued or backed by
federal agencies.
Figure 20 shows the composition, yields and remaining maturities of
Key’s securities available for sale. For more information about retained
interests in securitizations, gross unrealized gains and losses by type of
security and securities pledged, see Note 6 (“Securities”), which begins
on page 68.
Investment securities. Securities issued by states and political subdivisions
account for all of Key’s investment securities. Figure 21 shows the
composition, yields and remaining maturities of these securities.
Other investments. Principal investments — investments in equity and
mezzanine instruments made by Key’s Principal Investing unit — are
carried at fair value, which aggregated $677 million at December 31, 2002.
They represent approximately 75% of other investments and include direct
and indirect investments predominately in privately-held companies.
Direct investments are those made in a particular company, while indirect
investments are made through funds that include other investors.
In addition to principal investments, other investments include securities
that do not have readily determinable fair values. These securities
include certain real estate-related investments. Neither these securities
nor principal investments have stated maturities.
Asset qualityKey has a multi-faceted program to manage asset quality. Our professionals:
• evaluate and monitor credit quality and risk in credit-related assets;
• develop commercial and consumer credit policies and systems;
• monitor compliance with internal underwriting standards;
• establish credit-related concentration limits; and
• review the adequacy of the allowance for loan losses.
Allowance for loan losses. The allowance for loan losses at December
31, 2002, was $1.5 billion, or 2.32% of loans. This compares with $1.7
billion, or 2.65% of loans, at December 31, 2001. The allowance
includes $179 million that was specifically allocated for impaired loans
of $377 million at December 31, 2002, compared with $180 million that
was allocated for impaired loans of $417 million a year ago. For more
information about impaired loans, see Note 9 (“Impaired Loans and
Other Nonperforming Assets”) on page 72. At December 31, 2002, the
allowance for loan losses was 153.98% of nonperforming loans,
compared with 184.29% at December 31, 2001.
MANAGEMENT’S DISCUSSION & ANALYSIS OF FINANCIAL CONDITION & RESULTS OF OPERATIONS KEYCORP AND SUBSIDIARIES
Figure 19 shows the maturities of certain commercial and real estate
loans, and the sensitivity of those loans to changes in interest rates.
As indicated, at December 31, 2002, approximately 50% of these
outstanding loans were scheduled to mature within one year. Loans with
maturities greater than one year include $12.2 billion with floating or
adjustable rates and $3.2 billion with predetermined rates.
December 31, 2002 Within 1-5 Overin millions 1 Year Years 5 Years Total
Commercial, financial and agricultural $10,007 $4,982 $2,436 $17,425Real estate — construction 3,515 2,025 119 5,659Real estate — residential and commercial mortgage 2,131 2,139 3,713 7,983
$15,653 $9,146 $6,268 $31,067
Loans with floating or adjustable interest ratesa $7,833 $4,348Loans with predetermined interest ratesb 1,313 1,920
$9,146 $6,268
a “Floating” and “adjustable” rates vary in relation to other interest rates (such as the base lending rate) or a variable index that may change during the term of the loan.b “Predetermined” interest rates either are fixed or will change during the term of the loan according to a specific formula or schedule.
FIGURE 19 MATURITIES AND SENSITIVITY OF CERTAIN LOANS TO CHANGES IN INTEREST RATES

41 NEXT PAGEPREVIOUS PAGE SEARCH BACK TO CONTENTS
MANAGEMENT’S DISCUSSION & ANALYSIS OF FINANCIAL CONDITION & RESULTS OF OPERATIONS KEYCORP AND SUBSIDIARIES
Management estimates the appropriate level of the allowance for loan
losses on a quarterly (and at times more frequent) basis. The methodology
used is described in Note 1 (“Summary of Significant Accounting
Policies”) under the heading “Allowance for Loan Losses” on page 58.
Briefly, management assigns a specific allowance to an impaired loan
when the carrying amount of the loan exceeds the estimated present value
of related future cash flows and the fair value of any existing collateral.
OtherU.S. Treasury, States and Collateralized Mortgage- Retained WeightedAgencies and Political Mortgage Backed Interests in Other Average
dollars in millions Corporations Subdivisions Obligationsa Securitiesa Securitizationsa Securities Total Yieldb
DECEMBER 31, 2002Remaining maturity:
One year or less $ 3 $ 1 $ 852 $ 9 $ 8 $ 1 $ 874 5.65%After one through five years 8 6 6,018 644 201 12 6,889 5.56After five through ten years 5 11 185 12 — 5 218 8.53After ten years 7 17 152 187 — 163c 526 9.21
Fair value $23 $35 $7,207 $852 $209 $181 $8,507 —Amortized cost 22 35 7,143 815 166 208 8,389 5.76%Weighted average yield 5.29% 6.47% 5.26% 6.78% 22.16% 5.33%b 5.76% —Weighted average maturity 8.4 years 10.9 years 2.8 years 2.3 years 3.6 years 9.7 years 3.0 years —
DECEMBER 31, 2001Fair value $99 $21 $3,805 $1,032 $234 $217 $5,408 —Amortized cost 99 21 3,791 1,008 214 232 5,365 7.26%
DECEMBER 31, 2000Fair value $984 $33 $4,298 $1,355 $316 $398 $7,384 —Amortized cost 984 33 4,296 1,355 334 362 $7,364 7.16%
a Maturity is based upon expected average lives rather than contractual terms.b Weighted average yields are calculated based on amortized cost and exclude equity securities of $188 million that have no stated yield.
Such yields have been adjusted to a taxable-equivalent basis using the statutory federal income tax rate of 35%.c Includes primarily marketable equity securities (including an internally managed portfolio of bank common stock investments) with no stated maturity.
FIGURE 20 SECURITIES AVAILABLE FOR SALE
States and WeightedPolitical Average
dollars in millions Subdivisions Yielda
DECEMBER 31, 2002Remaining maturity:
One year or less $ 32 9.79%After one through five years 69 9.54After five through ten years 18 8.32After ten years 1 11.22
Amortized cost $120 9.43%Fair value 129 —Weighted average maturity 2.8 years —
DECEMBER 31, 2001Amortized cost $225 8.71%Fair value 234 —
DECEMBER 31, 2000Amortized cost $323 9.18%Fair value 333 —
a Weighted average yields are calculated based on amortized cost. Such yields have beenadjusted to a taxable-equivalent basis using the statutory federal income tax rate of 35%.
FIGURE 21 INVESTMENT SECURITIES The allowance for loan losses arising from nonimpaired loans is
determined by applying historical loss rates to existing loans with similar
risk characteristics and by exercising judgment to assess the impact of
factors such as changes in economic conditions, credit policies or
underwriting standards, and the level of credit risk associated with
specific industries and markets. The aggregate balance of the allowance
for loan losses at December 31, 2002, represents management’s best
estimate of the losses inherent in the loan portfolio at that date.
The allowance allocated for Key’s impaired loans was essentially
unchanged from the prior year, reflecting Key’s continued efforts to
resolve problem credits, combined with stabilizing credit quality trends
in certain portfolios. During the same period, the allowance allocated for
nonimpaired loans decreased by $224 million, or 15%, due largely to
slow loan growth and stabilizing credit quality trends in certain portfolios.
Management has determined that the level of watch credits in several
commercial portfolios decreased from year-ago levels. Watch credits are
loans with the potential for further deterioration in quality based on the
debtor’s current financial condition and related ability to perform in
accordance with the terms of the loan. The decline in watch credits in
specific commercial portfolios was due primarily to more conservative
underwriting and slower loan growth in a sluggish economy. The loan
portfolios with the most significant decreases in watch credits were large
corporate and healthcare. Other portfolios, including middle market,
showed signs of stability or modest improvement. At the same time, the
media and commercial real estate portfolios experienced higher levels of
watch credits. These changes reflect the fluctuations that occur in loan
portfolios from quarter to quarter. Management does not believe that
such changes require any adjustment to the allowance at this time.

42 NEXT PAGEPREVIOUS PAGE SEARCH BACK TO CONTENTS
MANAGEMENT’S DISCUSSION & ANALYSIS OF FINANCIAL CONDITION & RESULTS OF OPERATIONS KEYCORP AND SUBSIDIARIES
As shown in Figure 22, most of the 2002 decrease in Key’s allowance
for loan losses was attributable to developments in the commercial
loan portfolio. This decrease reflects net charge-offs recorded in the
nonreplenished allowance discussed in the following section, stabilizing
credit quality trends in certain portfolios and slow loan growth in a
weak economy.
December 31, 2002 2001 2000
Percent of Percent of Percent ofLoan Type to Loan Type to Loan Type to
dollars in millions Amount Total Loans Amount Total Loans Amount Total Loans
Commercial, financial and agricultural $1,092 27.9% $1,289 28.7% $ 742 30.0%Real estate — commercial mortgage 48 9.6 45 10.5 35 10.3Real estate — construction 45 9.1 39 9.3 27 7.7Commercial lease financing 74 12.0 89 11.6 45 10.7
Total commercial loans 1,259 58.6 1,462 60.1 849 58.7Real estate — residential mortgage 2 3.1 4 3.7 2 6.3Home equity 65 22.1 59 17.7 20 14.8Credit card — — — — — —Consumer — direct 16 3.5 24 3.7 15 3.8Consumer — indirect lease financing 5 1.4 8 3.2 9 4.5Consumer — indirect other 103 7.9 117 8.4 104 8.6
Total consumer loans 191 38.0 212 36.7 150 38.0Loans held for sale 2 3.4 3 3.2 2 3.3Unallocated — — — — — —
Total $1,452 100.0% $1,677 100.0% $1,001 100.0%
1999 1998
Percent of Percent ofLoan Type to Loan Type to
Amount Total Loans Amount Total Loans
Commercial, financial and agricultural $509 28.8% $357 27.5%Real estate — commercial mortgage 34 10.6 32 11.8Real estate — construction 16 7.1 15 5.6Commercial lease financing 39 10.4 49 9.0
Total commercial loans 598 56.9 453 53.9Real estate — residential mortgage 1 6.7 7 8.2Home equity 7 11.8 5 11.8Credit card — — 44 2.3Consumer — direct 8 4.0 15 3.8Consumer — indirect lease financing 6 5.0 5 4.2Consumer — indirect other 55 10.0 77 11.2
Total consumer loans 77 37.5 153 41.5Loans held for sale 18 5.6 1 4.6Unallocated 237 — 293 —
Total $930 100.0% $900 100.0%
FIGURE 22 ALLOCATION OF THE ALLOWANCE FOR LOAN LOSSES
Run-off Loan Portfolio. In May 2001, management set apart $300
million of Key’s allowance for loan losses as part of its decision to
discontinue many credit-only relationships in the leveraged financing
and nationally syndicated lending businesses and to facilitate sales of
distressed loans in other portfolios. An additional $190 million was
added to this allowance in the fourth quarter of 2001. The resulting
segregated allowance is being used to exit what initially amounted to
approximately $2.7 billion in related commitments (including $1.6 billion
of loans outstanding), which were moved to a separate run-off portfolio,
and to absorb losses incurred in connection with sales of distressed loans
in the continuing portfolio. As losses are charged to this segregated
allowance over time, we do not intend to replenish it. Within the run-off
portfolio, approximately $940 million of commitments (including $599
million of loans outstanding) remained as of December 31, 2002. Only
$85 million of these loans were nonperforming.

MANAGEMENT’S DISCUSSION & ANALYSIS OF FINANCIAL CONDITION & RESULTS OF OPERATIONS KEYCORP AND SUBSIDIARIES
Figure 23 summarizes certain asset quality indicators, segregated between Key’s continuing and run-off loan portfolios.
Additional information pertaining to the run-off portfolio is presented in Figure 24.
43 NEXT PAGEPREVIOUS PAGE SEARCH BACK TO CONTENTS
December 31, Run-off Loan Portfolio andContinuing Loan Portfolio Nonreplenished Allowance Total Loan Portfolio
in millions 2002 2001 2002 2001 2002 2001
Loans outstanding $61,858 $62,286 $599 $1,023 $62,457 $63,309Nonperforming loans 858 679 85 231 943 910Net loan charge-offs for the year 553 458 227a 215a 780 673Allowance for loan losses 1,404 1,402 48 275 1,452 1,677
a Includes activity related to the run-off loan portfolio and to sales of distressed loans in the continuing portfolio.
FIGURE 23 ASSET QUALITY INDICATORS — CONTINUING AND RUN-OFF LOAN PORTFOLIOS
SUMMARY OF CHANGES IN COMMITMENTS AND LOANS OUTSTANDING
Total Loansin millions Commitments Outstanding
BALANCE AT DECEMBER 31, 2001 $1,694 $1,023Charge-offs (139) (139)Payments, expirations and other changes, net (615) (285)
BALANCE AT DECEMBER 31, 2002 $ 940 $ 599
SUMMARY OF CHANGES IN NONPERFORMING LOANS AND NONREPLENISHED ALLOWANCE FOR LOAN LOSSESa
Nonperforming Nonreplenishedin millions Loans Allowance
BALANCE AT DECEMBER 31, 2001 $ 231 $ 275Loans placed on nonaccrual status 75 N/ACharge-offs (139) (227)Payments and other changes, net (82) N/A
BALANCE AT DECEMBER 31, 2002 $ 85 $ 48
a Includes activity related to the run-off loan portfolio and to sales of distressed loans in the continuing portfolio.
N/A = Not Applicable
FIGURE 24 RUN-OFF LOAN PORTFOLIO
Net loan charge-offs. Net loan charge-offs for 2002 were $780 million,
or 1.23% of average loans, compared with $673 million, or 1.02% of
average loans, for 2001 and $414 million, or .63% of average loans, for
2000. The composition of Key’s loan charge-offs and recoveries by type
of loan is shown in Figure 25. The increase in net charge-offs for 2002
occurred in the commercial loan portfolio, reflecting continued weakness
in the economy and Key’s continuing efforts to resolve distressed credits.
As shown in Figure 24, we used $227 million of Key’s nonreplenished
allowance during 2002 to absorb losses arising from the run-off loan
portfolio and from sales of distressed loans in the continuing portfolio.
Structured finance refers to a type of lending characterized by a high
degree of leverage in the borrower’s financial condition and a relatively
low level of tangible loan collateral. Key has used it in extensions of credit
to borrowers in the commercial, financial and agricultural portfolio
represented in Figure 25. The structured finance portfolio accounted for
23% of commercial net charge-offs for 2002, but represented only 3%
of Key’s commercial loans at the end of the year.
As shown in Figure 25, the increase in commercial loan net charge-offs
was offset in part by a decrease in the level of net charge-offs in the
consumer loan portfolio, primarily in the home equity and consumer
installment segments. The reduction in net charge-offs on installment
loans reflected actions taken by Key since May 2001 to exit the
automobile leasing business and to de-emphasize indirect prime
automobile lending.

MANAGEMENT’S DISCUSSION & ANALYSIS OF FINANCIAL CONDITION & RESULTS OF OPERATIONS KEYCORP AND SUBSIDIARIES
Nonperforming assets. Figure 26 shows the composition of Key’s
nonperforming assets. These assets totaled $993 million at December 31,
2002, and represented 1.59% of loans, other real estate owned (known
as “OREO”) and other nonperforming assets, compared with $947
million, or 1.49%, at December 31, 2001.
The economic slowdown can be expected to continue to impact Key’s
loan portfolio in general, although the erosion in credit quality that we
have experienced is disproportionately concentrated. At December 31,
2002, two segments of the commercial, financial and agricultural
portfolio (loans to middle market clients and loans underwritten as
structured finance credits) accounted for $219 million and $164 million,
respectively, of Key’s nonperforming loans. Although these two segments
comprised only 16% of Key’s total loans, they accounted for 41% of
total nonperforming loans.
At December 31, 2002, our 20 largest nonperforming loans totaled $258
million, representing 27% of total loans on nonperforming status. At
December 31, 2002, the run-off loan portfolio accounted for $85 million,
or 9%, of Key’s total nonperforming loans presented in Figure 26.
44 NEXT PAGEPREVIOUS PAGE SEARCH BACK TO CONTENTS
Year ended December 31,dollars in millions 2002 2001 2000 1999 1998
Average loans outstanding during the year $63,393 $65,976 $65,294 $62,401 $57,422
Allowance for loan losses at beginning of year $1,677 $1,001 $ 930 $ 900 $ 900Loans charged off:
Commercial, financial and agricultural 407 313 175 112 66
Real estate — commercial mortgage 78 18 9 2 20Real estate — construction 22 8 — — 2
Total commercial real estate loansa 100 26 9 2 22Commercial lease financing 94 62 14 20 12
Total commercial loans 601 401 198 134 100Real estate — residential mortgage 6 17 8 8 11Home equity 56 99 19 10 6Credit card — 1 17 89 104Consumer — direct 51 47 57 41 44Consumer — indirect lease financing 25 27 23 13 8Consumer — indirect other 166 192 200 125 111
Total consumer loans 304 383 324 286 284
905 784 522 420 384Recoveries:
Commercial, financial and agricultural 44 26 25 28 25
Real estate — commercial mortgage 6 4 4 4 6Real estate — construction 2 — — 1 2
Total commercial real estate loansa 8 4 4 5 8Commercial lease financing 9 5 2 3 1
Total commercial loans 61 35 31 36 34Real estate — residential mortgage 1 8 4 4 4Home equity 4 1 2 1 1Credit card — 1 5 14 10Consumer — direct 8 8 8 8 6Consumer — indirect lease financing 8 9 6 3 1Consumer — indirect other 43 49 52 36 31
Total consumer loans 64 76 77 66 53
125 111 108 102 87
Net loans charged off (780) (673) (414) (318) (297)Provision for loan losses 553 1,350 490 348 297Allowance related to loans acquired (sold), net 2 (1) (5) — —
Allowance for loan losses at end of year $1,452 $1,677 $1,001 $ 930 $ 900
Net loan charge-offs to average loans 1.23% 1.02% .63% .51% .52%Allowance for loan losses to year-end loans 2.32 2.65 1.50 1.45 1.45Allowance for loan losses to nonperforming loans 153.98 184.29 154.00 208.05 234.38
a See Figure 15 on page 38 and the accompanying discussion for more information related to Key’s commercial real estate portfolio.
FIGURE 25 SUMMARY OF LOAN LOSS EXPERIENCE

MANAGEMENT’S DISCUSSION & ANALYSIS OF FINANCIAL CONDITION & RESULTS OF OPERATIONS KEYCORP AND SUBSIDIARIES
Information pertaining to the credit exposure by industry classification
inherent in the largest sector of Key’s loan portfolio, commercial,
financial and agricultural loans, is presented in Figure 27. Within the
transportation category, Key had approximately $270 million of exposure
to the commercial passenger airline industry at December 31, 2002. The
types of activity that caused the change in Key’s nonperforming loans
during 2002 are summarized in Figure 28.
45 NEXT PAGEPREVIOUS PAGE SEARCH BACK TO CONTENTS
December 31,dollars in millions 2002 2001 2000 1999 1998
Commercial, financial and agricultural $448 $409 $301 $175 $144
Real estate — commercial mortgage 157 187 90 102 79Real estate — construction 50 83 28 7 6
Total commercial real estate loansa 207 270 118 109 85Commercial lease financing 69 94 48 28 29
Total commercial loans 724 773 467 312 258Real estate — residential mortgage 36 42 52 44 60Home equity 146 50 80 50 26Consumer — direct 13 9 8 6 6Consumer — indirect lease financing 5 10 7 3 3Consumer — indirect other 19 26 36 32 31
Total consumer loans 219 137 183 135 126
Total nonperforming loans 943 910 650 447 384
OREO 48 38 23 27 56Allowance for OREO losses (3) (1) (1) (3) (18)
OREO, net of allowance 45 37 22 24 38
Other nonperforming assets 5 — — 2 1
Total nonperforming assets $993 $947 $672 $473 $423
Accruing loans past due 90 days or more $198 $ 250 $236 $219 $159Accruing loans past due 30 through 89 days 790 1,096 963 916 753
Nonperforming loans to year-end loans 1.51% 1.44% .97% .70% .62%Nonperforming assets to year-end loans
plus OREO and other nonperforming assets 1.59 1.49 1.00 .74 .68
a See Figure 15 on page 38 and the accompanying discussion for more information related to Key’s commercial real estate portfolio.
FIGURE 26 SUMMARY OF NONPERFORMING ASSETS AND PAST DUE LOANS
December 31, 2002 Nonperforming Loans
Total Loans % of Loansdollars in millions Commitments Outstanding Amount Outstanding
Industry classification:Manufacturing $10,034 $ 3,931 $155 3.9%Services 6,198 2,506 90 3.6Financial services 4,061 979 5 .5Retail trade 4,250 2,518 43 1.7Wholesale trade 2,763 1,313 44 3.4Property management 2,900 1,098 8 .7Public utilities 1,728 461 1 .2Communications 1,178 494 23 4.7Agriculture/forestry/fishing 1,085 666 17 2.6Building contractors 1,217 547 26 4.8Public administration 739 245 — —Transportation 819 440 11 2.5Insurance 732 216 6 2.8Mining 379 169 — —Individuals 187 121 1 .8Other 1,904 1,721 18 1.0
Total $40,174 $17,425 $448 2.6%
FIGURE 27 COMMERCIAL, FINANCIAL AND AGRICULTURAL LOANS

MANAGEMENT’S DISCUSSION & ANALYSIS OF FINANCIAL CONDITION & RESULTS OF OPERATIONS KEYCORP AND SUBSIDIARIES
Deposits and other sources of funds“Core deposits” — domestic deposits other than certificates of deposit
of $100,000 or more — are Key’s primary source of funding. During
2002, core deposits averaged $37.7 billion, and represented 52% of the
funds Key used to support earning assets, compared with $37.5 billion
and 50% during 2001, and $37.3 billion and 50% during 2000. The
composition of Key’s deposits is shown in Figure 6, which spans pages
28 and 29.
The increase in the level of Key’s core deposits during 2002 was due
primarily to higher levels of noninterest-bearing deposits and money
market deposit accounts. The growth of these deposits reflected client
preferences for investments that provide high levels of liquidity in a low
interest rate environment. Also contributing to the significant growth
in noninterest-bearing deposits were our intensified cross-sell efforts and
the introduction of new products, including free checking. A more
aggressive pricing structure implemented in mid-2002 supported the
growth in savings deposits. During 2002, time deposits decreased by 9%
in part because, like our competitors, Key reduced the rates paid for them
as the Federal Reserve reduced interest rates in general.
In 2001, the level of Key’s core deposits rose from the prior year as
moderate growth of time deposits more than offset a decline in the level
of savings deposits. Time deposits grew by 2% in 2001, following an
increase of 17% in 2000. The growth rate of these deposits declined
largely as a result of a lower interest rate environment.
Purchased funds, comprising large certificates of deposit, deposits in the
foreign branch and short-term borrowings, averaged $15.5 billion
during 2002, compared with $20.0 billion during 2001 and $20.2
billion in 2000. As shown in Figure 6, both certificates of deposit and
short-term borrowings have declined as funding sources. This is
attributable in part to reduced funding needs resulting from loan sales,
slow demand for loans and from our decision to scale back or discontinue
certain types of lending. In addition, Key continues to consider loan sales
and securitizations as a funding alternative when market conditions
are favorable.
Since late 1995, Key has had a program in place under which deposit
balances (above a defined threshold) in certain negotiable order of
withdrawal (“NOW”) accounts and noninterest-bearing checking
accounts are transferred to money market accounts, thereby reducing the
46 NEXT PAGEPREVIOUS PAGE SEARCH BACK TO CONTENTS
2002 Quarters
in millions Full Year Fourth Third Second First
BALANCE AT BEGINNING OF PERIOD $ 910 $ 987 $ 957 $ 973 $ 910Loans placed on nonaccrual status 1,168 339 281 254 294Charge-offs (780) (186) (185) (203) (206)Loans sold (79) (36) (25) (18) —Payments (261) (149) (41) (49) (22)Transfers to OREO (3) — — — (3)Loans returned to accrual status (13) (13) — — —Acquisition 1 1 — — —
BALANCE AT END OF PERIOD $ 943 $ 943 $ 987 $ 957 $ 973
FIGURE 28 SUMMARY OF CHANGES IN NONPERFORMING LOANS
FIGURE 29 MATURITY DISTRIBUTION OF TIME DEPOSITS OF $100,000 OR MORE
December 31, 2002 Domestic Foreignin millions Offices Office Total
Remaining maturity:Three months or less $1,732 $3,743 $5,475After three through
twelve months 836 — 836After twelve months 2,181 — 2,181
Total $4,749 $3,743 $8,492
level of deposit reserves required to be maintained with the Federal
Reserve. Based on certain limitations, funds are periodically transferred
back to the checking accounts to cover checks presented for payment or
withdrawals. As a result of this program, average deposit balances for
2002 include NOW accounts of $4.4 billion and demand deposits of
$4.9 billion that are classified as money market deposit accounts. In
Figure 6, the NOW accounts transferred are included in the money
market deposit account category, while the demand deposits continue to
be reported as noninterest-bearing checking accounts.
At December 31, 2002, Key had $8.5 billion in time deposits of $100,000
or more. Figure 29 shows the maturity distribution of these deposits.
Liquidity“Liquidity” measures whether an entity has sufficient cash flow to
meet its financial obligations when due. Key has sufficient liquidity when
it can meet its obligations to depositors, borrowers and creditors at a
reasonable cost, on a timely basis, and without adverse consequences.
KeyCorp has sufficient liquidity when it can pay dividends to shareholders,
service its debt, and support customary corporate operations and activities,
including acquisitions, at a reasonable cost, in a timely manner and
without adverse consequences.
Liquidity risk. There are both direct and indirect circumstances that
could adversely affect Key’s liquidity or materially affect the cost of
funds. For example, events unrelated to Key, such as terrorism or
war, natural disasters, political events, or the default or bankruptcy of

MANAGEMENT’S DISCUSSION & ANALYSIS OF FINANCIAL CONDITION & RESULTS OF OPERATIONS KEYCORP AND SUBSIDIARIES
a major corporation, mutual fund or hedge fund, can have market-wide
consequences. A direct (but hypothetical) event would be a significant
downgrade in Key’s public credit rating by a rating agency due to a
deterioration in asset quality, a large charge to earnings, a significant
merger or acquisition or other events. Similarly, market speculation or
rumors about Key or the banking industry in general may cause
normal funding sources to withdraw credit until further information
becomes available.
Liquidity for Key. Key’s Funding and Investment Management Group
monitors the overall mix of funding sources with the objective of
maintaining an appropriate mix in light of the structure of the asset
portfolios. We use several tools to maintain sufficient liquidity.
• We maintain portfolios of short-term money market investments
and securities available for sale, substantially all of which could be
converted to cash quickly at a small expense.
• Key’s portfolio of investment securities generates prepayments (often
at a premium) and payments at maturity.
• We try to structure the maturities of our loans so we receive a
relatively consistent stream of payments from borrowers.
• We have a proven ability to access the securitization markets for a
variety of loan types.
• Our 910 full-service KeyCenters in 12 states generate a sizable
volume of core deposits. We monitor deposit flows and use alternative
pricing structures to attract deposits when necessary. For more
information about core deposits, see the previous section entitled
“Deposits and other sources of funds.”
• Key has access to various sources of money market funding (such as
federal funds purchased, securities sold under repurchase agreements,
and bank notes) and also can borrow from the Federal Reserve Bank to
meet short-term liquidity requirements. Key did not have any borrowings
from the Federal Reserve outstanding at December 31, 2002.
The Consolidated Statements of Cash Flow on page 56 summarize
Key’s sources and uses of cash by type of activity for the years ended
December 31, 2002, 2001 and 2000. As shown in these statements,
Key’s largest cash flows relate to both investing and financing activities.
Over the past three years, the primary sources of cash from investing
activities have been loan securitizations and sales and the sales,
prepayments and maturities of securities available for sale. Investing
activities that have required the greatest use of cash include lending and
the purchases of new securities.
Over the past three years, the primary source of cash from financing
activities has been the issuance of long-term debt. However, in both 2002
and 2000, deposits were also a significant source of cash. In each of the
past three years, cash has been used to repay debt issued in prior
periods and to reduce the levels of short-term borrowings.
Liquidity for KeyCorp. KeyCorp meets its liquidity requirements
principally through regular dividends from affiliate banks. In 2002,
affiliate banks paid KeyCorp a total of $900 million in dividends.
Federal banking law limits the amount of capital distributions that
banks can make to their holding companies without obtaining prior
regulatory approval. A national bank’s dividend paying capacity is
affected by several factors, including the amount of its net profits (as
defined by statute) for the two previous calendar years, and net profits
for the current year up to the date of dividend declaration. Due to this
constraint, and the restructuring charges taken by KBNA and Key
Bank USA in 2001, as of January 1, 2003, neither bank could pay
dividends or make other capital distributions to KeyCorp without
prior regulatory approval.
In February 2003, KBNA obtained regulatory approval to make capital
distributions to KeyCorp of up to $365 million in the aggregate in the
first and second quarters. If KBNA were to distribute such amount, it
would not have any further dividend paying capacity until it accumulates
at least $300 million of additional net profits in 2003. Management
expects this will occur during the second quarter. Management also
expects Key Bank USA to have restored dividend paying capacity
during the first quarter.
Assuming KBNA had distributed the $365 million to KeyCorp as of
February 15, 2003, as of that date, KeyCorp would have had
approximately $1.5 billion of cash or short-term investments available
to pay dividends on its common shares, to service its debt and to
finance its corporate operations. Management does not expect current
constraints on the subsidiary banks to pay dividends to KeyCorp to have
any material effect on the ability of KeyCorp to pay dividends to its
shareholders, to service its debt or to meet its other obligations.
Additional sources of liquidity. Management has implemented several
programs that enable Key and KeyCorp to raise money in the public
and private markets when necessary. The proceeds from all of these
programs can be used for general corporate purposes, including
acquisitions. Each of the programs is replaced or extended from time
to time as needed.
Bank note program. During 2002, Key’s affiliate banks raised $2.9
billion under Key’s bank note program. Of the notes issued during the
year, $2.2 billion have original maturities in excess of one year and are
included in long-term debt. The remaining notes have original maturities
of one year or less and are included in short-term borrowings. Key’s
current bank note program provides for the issuance of both long-
and short-term debt of up to $20.0 billion ($19.0 billion by KBNA and
$1.0 billion by Key Bank USA). At December 31, 2002, $18.1 billion was
available for future issuance under this program.
Euro note program. Under Key’s euro note program, KeyCorp, KBNA
and Key Bank USA may issue both long- and short-term debt of up to
$10.0 billion in the aggregate. The notes are offered exclusively to
non-U.S. investors and can be denominated in U.S. dollars and many
foreign currencies. There were $1.5 billion of borrowings issued under
this program during 2002. At the end of the year, $4.2 billion was
available for future issuance.
KeyCorp medium-term note program and other securities. KeyCorp has
registered with the Securities and Exchange Commission to provide for
the issuance of up to $2.2 billion of securities, which could include long-
or short-term debt, or equity securities. Of the amount registered, $1.0
billion has been allocated for the issuance of medium-term notes. At
December 31, 2002, unused capacity under KeyCorp’s universal shelf
47 NEXT PAGEPREVIOUS PAGE SEARCH BACK TO CONTENTS

MANAGEMENT’S DISCUSSION & ANALYSIS OF FINANCIAL CONDITION & RESULTS OF OPERATIONS KEYCORP AND SUBSIDIARIES
registration statement totaled $1.8 billion, including $575 million
allocated for the issuance of medium-term notes.
Commercial paper and revolving credit. KeyCorp has a commercial paper
program and a revolving credit agreement with an unaffiliated financial
institution that provide funding availability of up to $500 million and
$400 million, respectively. As of December 31, 2002, there were no
borrowings outstanding under either the commercial paper program or
the revolving credit agreement.
Key has favorable debt ratings as shown in Figure 30. As long as those
debt ratings are maintained, management believes that, under normal
conditions in the capital markets, future offerings of securities by
KeyCorp or its affiliate banks would be marketable to investors at a
competitive cost.
48 NEXT PAGEPREVIOUS PAGE SEARCH BACK TO CONTENTS
Senior SubordinatedShort-term Long-Term Long-Term Capital
December 31, 2002 Borrowings Debt Debt Securities
KEYCORP
Standard & Poor’s A-2 A– BBB+ BBBMoody’s P-1 A2 A3 “Baal”Fitch F1 A A– A
KBNA
Standard & Poor’s A-1 A A– N/AMoody’s P-1 A1 A2 N/AFitch F1 A A– N/A
N/A = Not Applicable
FIGURE 30 DEBT RATINGS
December 31, 2002 After AfterWithin 1 Through 3 Through After
in millions 1 Year 3 Years 5 Years 5 Years Total
Cash obligations:Long-term debt $4,430 $5,914 $2,676 $2,585 $15,605Noncancelable leases 125 212 170 395 902
Total $4,555 $6,126 $2,846 $2,980 $16,507
Lending-related and other off-balance sheet commitments:Commercial, including real estate $16,350 $6,970 $2,343 $1,384 $27,047Home equity 54 127 55 5,295 5,531Federal funds purchased and securities sold
under repurchase agreements 3,862 — — — 3,862Principal investing 1 — 8 213 222Commercial letters of credit 82 49 4 — 135
Total $20,349 $7,146 $2,410 $6,892 $36,797
FIGURE 31 CASH OBLIGATIONS AND OFF-BALANCE SHEET COMMITMENTS
Figure 31 summarizes Key’s significant cash obligations and contractual amounts of off-balance sheet lending commitments
at December 31, 2002, by the specific time periods in which related payments are due or commitments expire.
CapitalShareholders’ equity. Total shareholders’ equity at December 31, 2002,
was $6.8 billion, up $680 million from the balance at December 31, 2001.
Growth in retained earnings, net unrealized gains on securities available
for sale and the issuance of common shares out of the treasury stock
account in connection with employee stock purchase, 401(k), dividend
reinvestment and stock option programs contributed to the increase.
Other factors contributing to the change in shareholders’ equity during 2002
are shown in the Consolidated Statements of Changes in Shareholders’
Equity presented on page 55.
Share repurchases. In September 2000, the Board of Directors authorized
the repurchase of up to 25,000,000 common shares, including 3,647,200
shares remaining at the time from an earlier repurchase program. These
shares may be repurchased in the open market or through negotiated
transactions. During 2002, Key repurchased a total of 3,000,000 of its
common shares at an average price per share of $25.58. At December
31, 2002, a remaining balance of 13,764,400 shares may be repurchased
under the September 2000 authorization.
At December 31, 2002, Key had 67,945,135 treasury shares. Management
expects to reissue those shares over time to support the employee stock
purchase, 401(k), stock option and dividend reinvestment plans, and for
other corporate purposes. During 2002, Key reissued 2,938,589 treasury
shares for employee benefit and dividend reinvestment plans.
Capital adequacy. Capital adequacy is an important indicator of
financial stability and performance. Overall, Key’s capital position
remains strong: the ratio of total shareholders’ equity to total assets was
8.02% at December 31, 2002, and 7.60% at December 31, 2001.

MANAGEMENT’S DISCUSSION & ANALYSIS OF FINANCIAL CONDITION & RESULTS OF OPERATIONS KEYCORP AND SUBSIDIARIES
Banking industry regulators prescribe minimum capital ratios for bank
holding companies and their banking subsidiaries. Note 14 (“Shareholders’
Equity”), which begins on page 76, explains the implications of failing
to meet specific capital requirements imposed by the banking regulators.
Risk-based capital guidelines require a minimum level of capital as a
percent of “risk-weighted assets,” which is total assets plus certain off-
balance sheet items, both adjusted for predefined credit risk factors.
Currently, banks and bank holding companies must maintain, at a
minimum, Tier 1 capital as a percent of risk-weighted assets of 4.00%,
and total capital as a percent of risk-weighted assets of 8.00%. As of
December 31, 2002, Key’s Tier 1 capital ratio was 8.09%, and its total
capital ratio was 12.51%.
Another indicator of capital adequacy, the leverage ratio, is defined as
Tier 1 capital as a percentage of average quarterly tangible assets.
Leverage ratio requirements vary with the condition of the financial
institution. Bank holding companies that either have the highest
supervisory rating or have implemented the Federal Reserve’s risk-
adjusted measure for market risk — as KeyCorp has — must maintain
a minimum leverage ratio of 3.00%. All other bank holding companies
must maintain a minimum ratio of 4.00%. As of December 31, 2002,
Key had a leverage ratio of 8.15%.
Federal bank regulators group FDIC-insured depository institutions
into five categories, ranging from “critically undercapitalized” to “well
capitalized.” Both of Key’s affiliate banks qualified as “well capitalized”
at December 31, 2002, since each exceeded the prescribed thresholds
of 10.00% for total capital, 6.00% for Tier 1 capital and 5.00% for the
leverage ratio. If these provisions applied to bank holding companies,
Key would also qualify as “well capitalized” at December 31, 2002. The
FDIC-defined capital categories serve a limited supervisory function.
Investors should not treat them as a representation of the overall
financial condition or prospects of Key or its affiliate banks.
Figure 32 presents the details of Key’s regulatory capital position at
December 31, 2002 and 2001.
KeyCorp’s common shares are traded on the New York Stock Exchange
under the symbol KEY. At December 31, 2002:
• Book value per common share was $16.12, based on 423,943,645
shares outstanding, compared with $14.52, based on 424,005,056
shares outstanding, at December 31, 2001.
• The closing sales price of a KeyCorp common share on the New York
Stock Exchange was $25.14. This price was 156% of year-end book
value per share, and would produce a dividend yield of 4.77%.
• There were 40,166 holders of record of KeyCorp common shares.
In 2002, the quarterly dividend was $.30 per common share, up from
$.295 per common share in 2001. On January 16, 2003, the quarterly
dividend per common share was increased by 1.7% to $.305, effective
with the March 2003 dividend payment.
Figure 33 on page 51 shows the sales price ranges of the common
shares, per common share net income (loss) and dividends paid by
quarter for each of the last two years.
49 NEXT PAGEPREVIOUS PAGE SEARCH BACK TO CONTENTS
December 31,dollars in millions 2002 2001
TIER 1 CAPITALCommon shareholders’ equitya $ 6,738 $ 6,117Qualifying capital securities 1,096 1,243Less: Goodwill 1,142 1,101
Other assetsb 60 37
Total Tier 1 capital 6,632 6,222
TIER 2 CAPITALAllowance for loan lossesc 986 1,040Qualifying long-term debt 2,639 2,286
Total Tier 2 capital 3,625 3,326
Total risk-based capital $10,257 $ 9,548
RISK-WEIGHTED ASSETSRisk-weighted assets on balance sheet $67,051 $67,783Risk-weighted off-balance sheet exposure 16,595 17,480Less: Goodwill 1,142 1,101
Other assetsb 251 37Plus: Market risk-equivalent assets 192 217
Gross risk-weighted assets 82,445 84,342Less: Excess allowance for loan lossesc 466 637
Net risk-weighted assets $81,979 $83,705
AVERAGE QUARTERLY TOTAL ASSETS $82,735 $82,467
CAPITAL RATIOSTier 1 risk-based capital ratio 8.09% 7.43%Total risk-based capital ratio 12.51 11.41Leverage ratiod 8.15 7.65
a Common shareholders’ equity does not include net unrealized gains or losses on securities(except for net unrealized losses on marketable equity securities) nor net gains or losseson cash flow hedges.
b “Other assets” deducted from Tier 1 capital consists of intangible assets (excludinggoodwill) recorded after February 19, 1992, deductible portions of purchased mortgageservicing rights and deductible portions of nonfinancial equity investments.
“Other assets” deducted from risk-weighted assets consists of intangible assets(excluding goodwill) recorded after February 19, 1992, deductible portions of purchasedmortgage servicing rights and nonfinancial equity investments.
c The allowance for loan losses included in Tier 2 capital is limited by regulation to 1.25% of gross risk-weighted assets, excluding those with low-level recourse.
d This ratio is Tier 1 capital divided by average quarterly total assets less goodwill and thenonqualifying intangible assets described in footnote (b).
FIGURE 32 CAPITAL COMPONENTS AND RISK-WEIGHTED ASSETS

50 NEXT PAGEPREVIOUS PAGE SEARCH BACK TO CONTENTS
FOURTH QUARTER RESULTS
Some of the highlights of Key’s fourth quarter results are summarized
below. Key’s financial performance for each of the past eight quarters is
summarized in Figure 33.
Net income (loss). Key had net income of $245 million, or $.57 per
common share, for the fourth quarter of 2002, compared with a net loss
of $174 million, or $.41 per share, for the same period in 2001. The
improvement resulted from growth in both net interest income and
noninterest income, along with a decrease in noninterest expense and a
substantial reduction in the provision for loan losses. Results for the
fourth quarter of 2001 included charges of approximately $410 million
(after tax), or $.96 per share, taken to increase Key’s allowance for loan
losses and to strengthen the balance sheet. The section entitled “Financial
performance,” which begins on page 21, provides more information
about these charges.
On an annualized basis, Key’s return on average total assets for the
fourth quarter of 2002 was 1.17%, compared with a return of (.84)%
for the fourth quarter of 2001. The annualized return on average
equity was 14.46% for the fourth quarter of 2002, compared with a
return of (10.57)% for the year-ago quarter.
Net interest income. Net interest income was $712 million for the
fourth quarter of 2002, up from $700 million for the fourth quarter of
2001. Key’s net interest margin of 3.98% for the fourth quarter of 2002
was unchanged from the fourth quarter of 2001, while average earning
assets declined by $152 million or less than one percent. The decrease
in earning assets was due primarily to Key’s May 2001 decision to exit
the automobile leasing business, de-emphasize indirect prime automobile
lending and discontinue certain credit-only commercial relationships.
Key’s sale in September 2001 of $1.4 billion of residential mortgage loans
with low interest rate spreads also contributed to the decrease.
Noninterest income. Key’s noninterest income was $446 million for the
fourth quarter of 2002 compared with $418 million for the year-ago
quarter. The increase was due primarily to a $33 million decrease in
losses from principal investing. Noninterest income also benefited from
a $6 million increase in net gains from sales of securities. These positive
results were offset in part by an $18 million decline in income from trust
and investment services and a $7 million reduction in service charges on
deposit accounts.
Noninterest expense. Noninterest expense for the fourth quarter of
2002 totaled $668 million, compared with $702 million for the fourth
quarter of 2001. The largest declines occurred in software amortization
and the amortization of goodwill. The January 1, 2002, adoption of new
accounting guidance for goodwill resulted in an expense reduction of
approximately $20 million for each quarter of 2002.
Provision for loan losses. Key’s provision for loan losses was $147
million for the fourth quarter of 2002, compared with $723 million for
the fourth quarter of 2001. Included in the fourth quarter 2001 amount
is $400 million, which was used to increase the allowance for loan
losses for Key’s continuing loan portfolio. Another $190 million provision
was added last year to the portion of the allowance segregated in the
second quarter of 2001 in connection with Key’s decision to discontinue
many credit-only relationships in the leveraged financing and nationally
syndicated lending businesses and to facilitate sales of distressed loans in
other portfolios, as discussed on page 42 under the heading “Run-off loan
portfolio.” Net loan charge-offs totaled $186 million and were 1.18% of
average loans outstanding for the quarter, compared with $220 million
and 1.37%, respectively, for the fourth quarter of 2001. For more
information about Key’s allowance for loan losses, see the section
entitled “Allowance for loan losses,” which begins on page 40.
MANAGEMENT’S DISCUSSION & ANALYSIS OF FINANCIAL CONDITION & RESULTS OF OPERATIONS KEYCORP AND SUBSIDIARIES

51 NEXT PAGEPREVIOUS PAGE SEARCH BACK TO CONTENTS
MANAGEMENT’S DISCUSSION & ANALYSIS OF FINANCIAL CONDITION & RESULTS OF OPERATIONS KEYCORP AND SUBSIDIARIES
2002 2001
dollars in millions, except per share amounts Fourth Third Second First Fourth Third Second First
FOR THE QUARTERInterest income $1,077 $1,095 $1,102 $1,092 $1,210 $1,380 $1,467 $1,570Interest expense 365 395 419 438 510 656 754 882Net interest income 712 700 683 654 700 724 713 688Provision for loan losses 147 135 135 136 723 116 401 110Noninterest income before net securities
gains (losses) 441 432 447 443 419 452 390 429Net securities gains (losses) 5 — 1 — (1) 2 8 26Noninterest expense 668 659 665 661 702 683 858 698Income (loss) before income taxes and
cumulative effect of accounting changes 343 338 331 300 (307) 379 (148) 335Income (loss) before cumulative effect
of accounting changes 245 245 246 240 (174) 249 (136) 218Net income (loss) 245 245 246 240 (174) 249 (160) 217
PER COMMON SHAREIncome (loss) before cumulative effect
of accounting changes $ .58 $ .57 $ .58 $ .56 $ (.41) $ .59 $ (.32) $ .51Income (loss) before cumulative effect
of accounting changes — assuming dilution .57 .57 .57 .56 (.41) .58 (.32) .51Net income (loss) .58 .57 .58 .56 (.41) .59 (.38) .51Net income (loss) — assuming dilution .57 .57 .57 .56 (.41) .58 (.38) .51Cash dividends paid .30 .30 .30 .30 .295 .295 .295 .295Book value at period end 16.12 15.66 15.46 15.05 14.52 15.53 15.22 15.79Market price:
High 26.75 27.35 29.40 27.26 24.52 28.15 26.43 27.58Low 21.25 20.96 25.95 22.92 20.49 22.20 22.10 22.65Close 25.14 24.97 27.30 26.65 24.34 24.14 26.05 25.80
Weighted average common shares (000) 424,578 426,274 426,092 424,855 423,596 424,802 424,675 424,024Weighted average common shares and
potential common shares (000) 429,531 431,326 431,935 430,019 428,280 430,346 429,760 429,917
AT PERIOD ENDLoans $62,457 $62,951 $63,881 $63,956 $63,309 $64,506 $66,693 $67,027Earning assets 73,635 72,548 72,820 72,382 71,672 73,943 76,531 77,027Total assets 85,202 83,518 82,778 81,359 80,938 84,419 85,838 86,457Deposits 49,346 44,610 44,805 43,233 44,795 45,372 45,743 45,965Long-term debt 15,605 16,276 16,895 15,256 14,554 15,114 14,675 14,495Shareholders’ equity 6,835 6,654 6,592 6,402 6,155 6,575 6,467 6,702
Full-time equivalent employees 20,437 20,522 20,929 21,076 21,230 21,297 21,742 21,882Branches 910 903 905 911 911 911 926 922
PERFORMANCE RATIOSReturn on average total assets 1.17% 1.19% 1.21% 1.20% (.84)% 1.16% (.75)% 1.02%Return on average equity 14.46 14.74 15.16 15.53 (10.57) 15.20 (9.67) 13.28Net interest margin (taxable equivalent) 3.98 3.99 3.98 3.93 3.98 3.85 3.77 3.63
CAPITAL RATIOS AT PERIOD ENDEquity to assets 8.02% 7.97% 7.96% 7.87% 7.60% 7.79% 7.53% 7.75%Tangible equity to tangible assets 6.73 6.71 6.69 6.57 6.29 6.51 6.25 6.29Tier 1 risk-based capital 8.09 8.34 8.23 7.92 7.43 7.81 7.71 7.99Total risk-based capital 12.51 12.69 12.29 12.02 11.41 11.77 11.81 12.32Leverage 8.15 8.15 8.14 8.13 7.65 7.90 7.68 7.79
Note 3 (“Acquisitions and Divestitures”) on page 64 contains specific information about the business combinations and divestitures that Key completed in the past three years to help you understandhow those transactions may have impacted Key’s financial condition and results of operations.
FIGURE 33 SELECTED QUARTERLY FINANCIAL DATA

KEYCORP AND SUBSIDIARIES
52 NEXT PAGEPREVIOUS PAGE SEARCH BACK TO CONTENTS
We have audited the accompanying consolidated balance sheets of
KeyCorp and subsidiaries (“Key”) as of December 31, 2002 and 2001, and
the related consolidated statements of income, changes in shareholders’
equity, and cash flow for each of the three years in the period ended
December 31, 2002. These financial statements are the responsibility of
Key’s management. Our responsibility is to express an opinion on these
financial statements based on our audits.
We conducted our audits in accordance with auditing standards generally
accepted in the United States. Those standards require that we plan and
perform the audit to obtain reasonable assurance about whether the
financial statements are free of material misstatement. An audit includes
examining, on a test basis, evidence supporting the amounts and disclosures
in the financial statements. An audit also includes assessing the accounting
principles used and significant estimates made by management, as well as
evaluating the overall financial statement presentation. We believe that our
audits provide a reasonable basis for our opinion.
In our opinion, the financial statements referred to above present fairly,
in all material respects, the consolidated financial position of Key at
December 31, 2002 and 2001, and the consolidated results of their
operations and their cash flows for each of the three years in the period
ended December 31, 2002, in conformity with accounting principles
generally accepted in the United States.
As discussed in Note 1 to the consolidated financial statements, in
2002 Key changed its method of accounting for goodwill.
Cleveland, Ohio
January 13, 2003
Key’s management is responsible for the preparation, content and integrity
of the financial statements and other statistical data and analyses compiled
for this annual report. The financial statements and related notes have been
prepared in conformity with accounting principles generally accepted in
the United States and reflect management’s best estimates and judgments.
Management believes that the financial statements and notes present
fairly Key’s financial position, results of operations and cash flows, and that
the financial information presented elsewhere in this annual report is
consistent with the financial statements.
Management is responsible for establishing and maintaining a system of
internal control that is intended to protect Key’s assets and the integrity
of its financial statements. This corporate-wide system of controls includes
self-monitoring mechanisms, written policies and procedures, proper
delegation of authority and organizational division of responsibility, and
the careful selection and training of qualified personnel. Management also
maintains a code of ethics that addresses conflicts of interest, compliance
with laws and regulations, and prompt reporting of any failure or
circumvention of controls, among other things.
We generally certify compliance with Key’s code of ethics annually. We
have established an effective risk management function to periodically test
the other internal controls, and we endeavor to correct control deficiencies
as they are identified. Although any system of internal control can be
compromised by human error or intentional circumvention of required
procedures, management believes Key’s system provides reasonable
assurances that financial transactions are recorded properly, providing an
adequate basis for reliable financial statements.
The Board of Directors discharges its responsibility for Key’s financial
statements through its Audit Committee. This committee, which draws its
members exclusively from the outside directors, also hires the independent
auditors. The Audit Committee meets regularly with the independent
auditors to review the scope of their audits and audit reports and to discuss
necessary action. Both the independent and internal auditors have direct
access to and interaction with the Audit Committee.
Management has assessed Key’s internal control and procedures over
financial reporting using criteria described in “Internal Control —
Integrated Framework,” issued by the Committee of Sponsoring
Organizations of the Treadway Commission. Based on that assessment,
management believes that Key maintained an effective system of internal
control for financial reporting as of December 31, 2002.
Henry L. Meyer III
Chairman and Chief Executive Officer
Jeffrey B. Weeden
Senior Executive Vice President and Chief Financial Officer
REPORT OF MANAGEMENT
REPORT OF ERNST & YOUNG LLP, INDEPENDENT AUDITORS
Shareholders and Board of Directors
KeyCorp

KEYCORP AND SUBSIDIARIES
53 NEXT PAGEPREVIOUS PAGE SEARCH BACK TO CONTENTS
December 31,dollars in millions 2002 2001
ASSETSCash and due from banks $ 3,364 $ 2,891Short-term investments 1,632 1,898Securities available for sale 8,507 5,408Investment securities (fair value: $129 and $234) 120 225Other investments 919 832Loans, net of unearned income of $1,776 and $1,778 62,457 63,309
Less: Allowance for loan losses 1,452 1,677
Net loans 61,005 61,632Premises and equipment 644 687Goodwill 1,142 1,103Other intangible assets 35 31Corporate-owned life insurance 2,414 2,313Accrued income and other assets 5,420 3,918
Total assets $85,202 $80,938
LIABILITIESDeposits in domestic offices:
NOW and money market deposit accounts $16,249 $13,461Savings deposits 2,029 1,918Certificates of deposit ($100,000 or more) 4,749 4,493Other time deposits 11,946 13,657
Total interest-bearing 34,973 33,529Noninterest-bearing 10,630 9,667
Deposits in foreign office — interest-bearing 3,743 1,599
Total deposits 49,346 44,795Federal funds purchased and securities sold under repurchase agreements 3,862 3,735Bank notes and other short-term borrowings 2,823 5,549Accrued expense and other liabilities 5,471 4,862Long-term debt 15,605 14,554Corporation-obligated mandatorily redeemable preferred capital securities of subsidiary
trusts holding solely subordinated debentures of KeyCorp (see Note 13) 1,260 1,288
Total liabilities 78,367 74,783
SHAREHOLDERS’ EQUITYPreferred stock, $1 par value; authorized 25,000,000 shares, none issued — —Common shares, $1 par value; authorized 1,400,000,000 shares;
issued 491,888,780 shares 492 492Capital surplus 1,449 1,390Retained earnings 6,448 5,856Treasury stock, at cost (67,945,135 and 67,883,724 shares) (1,593) (1,585)Accumulated other comprehensive income 39 2
Total shareholders’ equity 6,835 6,155
Total liabilities and shareholders’ equity $85,202 $80,938
See Notes to Consolidated Financial Statements.
CONSOLIDATED BALANCE SHEETS

KEYCORP AND SUBSIDIARIES
54 NEXT PAGEPREVIOUS PAGE SEARCH BACK TO CONTENTS
Year ended December 31,dollars in millions, except per share amounts 2002 2001 2000
INTEREST INCOMELoans $3,913 $5,067 $5,699Tax-exempt investment securities 10 17 23Securities available for sale 389 454 447Short-term investments 30 65 83Other investments 24 24 25
Total interest income 4,366 5,627 6,277
INTEREST EXPENSEDeposits 897 1,478 1,768Federal funds purchased and securities sold under repurchase agreements 90 198 287Bank notes and other short-term borrowings 79 302 428Long-term debt, including capital securities 551 824 1,064
Total interest expense 1,617 2,802 3,547
NET INTEREST INCOME 2,749 2,825 2,730Provision for loan losses 553 1,350 490
Net interest income after provision for loan losses 2,196 1,475 2,240
NONINTEREST INCOMETrust and investment services income 609 651 687Service charges on deposit accounts 405 387 341Investment banking and capital markets income 172 88 293Letter of credit and loan fees 134 124 107Corporate-owned life insurance income 108 114 109Electronic banking fees 79 74 68Net securities gains (losses) 6 35 (28)Gain from sale of credit card portfolio — — 332Other income 256 252 285
Total noninterest income 1,769 1,725 2,194
NONINTEREST EXPENSEPersonnel 1,436 1,378 1,445Net occupancy 226 232 223Computer processing 192 252 240Equipment 136 152 173Marketing 122 112 110Professional fees 92 88 89Amortization of intangibles 11 245 101Restructuring charges (credits) — (4) 102Other expense 438 486 434
Total noninterest expense 2,653 2,941 2,917
INCOME BEFORE INCOME TAXES AND CUMULATIVE EFFECT OF ACCOUNTING CHANGES 1,312 259 1,517
Income taxes 336 102 515
INCOME BEFORE CUMULATIVE EFFECT OF ACCOUNTING CHANGES 976 157 1,002Cumulative effect of accounting changes, net of tax (see Note 1) — (25) —
NET INCOME $ 976 $ 132 $1,002
Per common share:Income before cumulative effect of accounting changes $2.29 $.37 $2.32Net income 2.29 .31 2.32Income before cumulative effect of accounting changes —
assuming dilution 2.27 .37 2.30Net income — assuming dilution 2.27 .31 2.30
Weighted average common shares outstanding (000) 425,451 424,275 432,617Weighted average common shares and potential common
shares outstanding (000) 430,703 429,573 435,573
See Notes to Consolidated Financial Statements.
CONSOLIDATED STATEMENTS OF INCOME

KEYCORP AND SUBSIDIARIES
55 NEXT PAGEPREVIOUS PAGE SEARCH BACK TO CONTENTS
AccumulatedLoans to Treasury Other
Common Capital Retained ESOP Stock, Comprehensive Comprehensivedollars in millions, except per share amounts Shares Surplus Earnings Trustee at Cost Income (Loss) Income
BALANCE AT DECEMBER 31, 1999 $492 $1,412 $5,833 $(24) $(1,197) $(127)Net income 1,002 $1,002Other comprehensive income (losses):
Net unrealized gains on securities available for sale, net of income taxes of $80a 132 132
Foreign currency translation adjustments (15) (15)
Total comprehensive income $1,119
Cash dividends declared on common shares ($1.12 per share) (484)
Issuance of common shares:Employee benefit and dividend reinvestment
plans — 2,480,161 net shares (10) 59Repurchase of common shares — 22,652,800 shares (462)ESOP transactions 1 11
BALANCE AT DECEMBER 31, 2000 492 1,402 6,352 (13) (1,600) (10)Net income 132 $132Other comprehensive income (losses):
Net unrealized gains on securities available for sale, net of income taxes of $11a 13 13
Cumulative effect of change in accounting for derivative financial instruments, net of income taxes of ($12) (22) (22)
Net unrealized gains on derivative financial instruments, net of income taxes of $12 20 20
Foreign currency translation adjustments 1 1
Total comprehensive income $144
Cash dividends declared on common shares ($1.48 per share) (628)
Issuance of common shares:Acquisition — 370,830 shares 9Employee benefit and dividend reinvestment
plans — 2,415,914 net shares (12) 56Repurchase of common shares — 2,035,600 shares (50)ESOP transactions 13
BALANCE AT DECEMBER 31, 2001 492 1,390 5,856 — (1,585) 2Net income 976 $ 976Other comprehensive income (losses):
Net unrealized gains on securities available for sale, net of income taxes of $27a 47 47
Net unrealized gains on derivative financial instruments, net of income taxes of $5 8 8
Foreign currency translation adjustments 7 7Minimum pension liability adjustment,
net of income taxes of ($14) (25) (25)
Total comprehensive income $1,013
Deferred compensation obligation 68Cash dividends declared on common shares
($.90 per share) (384)Issuance of common shares:
Employee benefit and dividend reinvestment plans — 2,938,589 net shares (9) 69
Repurchase of common shares — 3,000,000 shares (77)
BALANCE AT DECEMBER 31, 2002 $492 $1,449 $6,448 — $(1,593) $ 39
a Net of reclassification adjustments. Reclassification adjustments represent net unrealized gains (losses) as of December 31 of the prior year on securities available forsale that were sold during the current year. The reclassification adjustments were $35 million ($22 million after tax) in 2002, ($5) million [($4) million after tax] in 2001and ($11) million [($7) million after tax] in 2000.
See Notes to Consolidated Financial Statements.
CONSOLIDATED STATEMENTS OF CHANGES IN SHAREHOLDERS’ EQUITY

KEYCORP AND SUBSIDIARIES
56 NEXT PAGEPREVIOUS PAGE SEARCH BACK TO CONTENTS
Year ended December 31,in millions 2002 2001 2000
OPERATING ACTIVITIESNet income $ 976 $ 132 $ 1,002Adjustments to reconcile net income to net cash provided by operating activities:
Provision for loan losses 553 1,350 490Cumulative effect of accounting changes, net of tax — 25 —Depreciation expense and software amortization 215 285 281Amortization of intangibles 11 245 101Net gain from sale of credit card portfolio — — (332)Net securities (gains) losses (6) (35) 28Net (gains) losses from principal investing 14 79 (71)Net gains from loan securitizations and sales (56) (49) (31)Deferred income taxes 155 (139) 335Net (increase) decrease in mortgage loans held for sale 118 (10) (164)Net (increase) decrease in trading account assets (204) 146 26Net increase (decrease) in accrued restructuring charges (35) (64) 31Other operating activities, net (282) (271) (113)
NET CASH PROVIDED BY OPERATING ACTIVITIES 1,459 1,694 1,583INVESTING ACTIVITIESCash used in acquisitions, net of cash acquired (63) (3) (375)Net (increase) decrease in other short-term investments 485 (160) (49)Purchases of securities available for sale (6,744) (4,290) (6,855)Proceeds from sales of securities available for sale 1,552 349 2,450Proceeds from prepayments and maturities of securities available for sale 2,317 5,859 3,859Purchases of investment securities (18) (46) (30)Proceeds from prepayments and maturities of investment securities 95 144 155Purchases of other investments (167) (225) (374)Proceeds from sales of other investments 45 56 129Proceeds from prepayments and maturities of other investments 57 106 56Net increase in loans, excluding acquisitions, sales and divestitures (3,184) (1,876) (7,215)Purchases of loans — (107) —Proceeds from loan securitizations and sales 3,393 4,916 4,978Purchases of premises and equipment (90) (121) (103)Proceeds from sales of premises and equipment 9 15 22Proceeds from sales of other real estate owned 40 27 28
NET CASH PROVIDED BY (USED IN) INVESTING ACTIVITIES (2,273) 4,644 (3,324)FINANCING ACTIVITIESNet increase (decrease) in deposits 4,128 (3,854) 5,416Net decrease in short-term borrowings (2,611) (2,609) (696)Net proceeds from issuance of long-term debt, including capital securities 4,739 3,864 4,286Payments on long-term debt, including capital securities (4,418) (3,532) (5,985)Loan payments received from ESOP trustee — 13 11Purchases of treasury shares (77) (50) (462)Net proceeds from issuance of common stock 37 33 28Cash dividends paid (511) (501) (484)
NET CASH PROVIDED BY (USED IN) FINANCING ACTIVITIES 1,287 (6,636) 2,114
NET INCREASE (DECREASE) IN CASH AND DUE FROM BANKS 473 (298) 373CASH AND DUE FROM BANKS AT BEGINNING OF YEAR 2,891 3,189 2,816
CASH AND DUE FROM BANKS AT END OF YEAR $ 3,364 $ 2,891 $ 3,189
Additional disclosures relative to cash flow:Interest paid $1,549 $2,626 $3,572Income taxes paid 173 115 92
Noncash items:Derivative assets resulting from adoption of new accounting standard — $120 —Derivative liabilities resulting from adoption of new accounting standard — 152 —Cash dividends declared, but not paid — 127 —Transfer of investment securities to other investments $847 832 $820Transfer of investment securities to securities available for sale 62 62 55Assets acquired 475 — —Liabilities assumed 450 — —
See Notes to Consolidated Financial Statements.
CONSOLIDATED STATEMENTS OF CASH FLOW

NOTES TO CONSOLIDATED FINANCIAL STATEMENTS KEYCORP AND SUBSIDIARIES
57 NEXT PAGEPREVIOUS PAGE SEARCH BACK TO CONTENTS
ORGANIZATION
KeyCorp, an Ohio corporation and bank holding company
headquartered in Cleveland, Ohio, is one of the nation’s largest bank-
based financial services companies. KeyCorp’s subsidiaries provide
retail and commercial banking, commercial leasing, investment
management, consumer finance and investment banking products and
services to individual, corporate and institutional clients through three
major business groups: Key Consumer Banking, Key Corporate Finance
and Key Capital Partners. As of December 31, 2002, KeyCorp’s banking
subsidiaries operated 910 full-service branches, a telephone banking call
center services group and 2,165 ATMs in 17 states.
As used in these Notes, KeyCorp refers solely to the parent company and
Key refers to the consolidated entity consisting of KeyCorp and its
subsidiaries.
USE OF ESTIMATES
Key’s accounting policies conform to accounting principles generally
accepted in the United States and prevailing practices within the financial
services industry. Management must make certain estimates and judgments
when determining the amounts presented in Key’s consolidated financial
statements and the related notes. If these estimates prove to be inaccurate,
actual results could differ from those reported.
BASIS OF PRESENTATION
The consolidated financial statements include the accounts of KeyCorp
and its subsidiaries. All significant intercompany accounts and transactions
have been eliminated in consolidation. Some previously reported results
have been reclassified to conform to current reporting practices.
KeyCorp evaluates whether to consolidate entities in which it has
invested based on the nature and amount of equity contributed by
third parties, the decision-making power granted to those parties and the
extent of their control over the entity’s operating and financial policies.
Entities that KeyCorp controls, generally through majority ownership,
are consolidated and are considered subsidiaries.
Unconsolidated investments in entities in which KeyCorp has significant
influence over operating and financing decisions (usually defined as a
voting or economic interest of 20 to 50%) are accounted for by the
equity method. Unconsolidated investments in entities in which KeyCorp
has a voting or economic interest of less than 20% are generally
carried at cost. Investments held by KeyCorp’s broker/dealer and
investment company subsidiaries (principal investments) are carried at
estimated fair value.
KeyCorp uses special purpose entities (“SPEs”), including securitization
trusts, in the normal course of business for funding purposes. SPEs
established by KeyCorp as qualifying special purpose entities under the
provisions of SFAS No. 140, “Accounting for Transfers and Servicing of
Financial Assets and Extinguishments of Liabilities,” are not consolidated.
Nonqualifying SPEs are evaluated for consolidation by KeyCorp based
on the nature and amount of equity contributed by third parties, the risks
and rewards the parties assume and the control the respective parties
exercise over the SPE’s activities. Securitization trusts sponsored by
KeyCorp are not consolidated since they are qualifying SPEs.
KeyCorp also does not consolidate an asset-backed commercial paper
conduit for which it is a referral agent. The conduit is owned by a third party
and administered by an unaffiliated financial institution. KeyCorp shares the
risks and rewards of the conduit’s activities with multiple third parties.
Additional information on SFAS No. 140 is summarized in this note under
the heading “Loan Securitizations” on page 59. Additional information on
the conduit is summarized in Note 19 (“Commitments, Contingent
Liabilities and Guarantees”), which begins on page 81. The “Accounting
Pronouncements Pending Adoption” section of this note, which begins
on page 62, and Note 8 (“Loan Securitizations and Variable Interest
Entities”), which begins on page 70, summarize guidance issued by the
Financial Accounting Standards Board (“FASB”) in January 2003 that
changes the methods for evaluating when to consolidate entities and
may affect Key’s decision as to which entities to consolidate in the future.
BUSINESS COMBINATIONS
Key accounts for its business combinations using the purchase method of
accounting. Under this method of accounting, the acquired company’s net
assets are recorded at fair value at the date of acquisition and the results
of operations of the acquired company are combined with Key’s results
from that date forward. Purchase premiums and discounts, including
intangible assets, are amortized over the remaining useful lives of the
related assets or liabilities. The difference between the purchase price and
the fair value of the net assets acquired is recorded as goodwill. Key’s
accounting policy for intangible assets is summarized in this note under
the heading “Goodwill and Other Intangible Assets” on page 59.
In July 2001, the FASB issued SFAS No. 141, “Business Combinations,”
which eliminated the pooling-of-interests method of accounting for
business combinations initiated after June 30, 2001. Since that date, Key
has not initiated any business combinations that would have qualified
for the pooling-of-interests method of accounting under previous
accounting standards. The last business combination that Key accounted
for using the pooling-of-interests method occurred in December 1994.
STATEMENTS OF CASH FLOW
Cash and due from banks are considered “cash and cash equivalents”
for financial reporting purposes.
SECURITIES
Key classifies its securities into four categories: trading, available for sale,
investment and other investments.
Trading account securities. These are debt and equity securities that are
purchased and held by Key with the intent of selling them in the near
term, and certain interests retained in loan securitizations. All of these
assets are reported at fair value ($801 million at December 31, 2002, and
$597 million at December 31, 2001) and are included in “short-term
investments” on the balance sheet. Realized and unrealized gains and
1. SUMMARY OF SIGNIFICANT ACCOUNTING POLICIES

NOTES TO CONSOLIDATED FINANCIAL STATEMENTS KEYCORP AND SUBSIDIARIES
58 NEXT PAGEPREVIOUS PAGE SEARCH BACK TO CONTENTS
losses on trading account securities are reported in “investment banking
and capital markets income” on the income statement.
Securities available for sale. These include securities that Key intends
to hold for an indefinite period of time and that may be sold in response
to changes in interest rates, prepayment risk, liquidity needs or other
factors. Securities available for sale are reported at fair value and
include debt and marketable equity securities with readily determinable
fair values. Unrealized gains and losses (net of income taxes) deemed
temporary are recorded in shareholders’ equity as a component of
“accumulated other comprehensive income (loss).” Unrealized gains and
losses on specific securities deemed to be “other than temporary” are
included in “net securities gains (losses)” on the income statement.
Also included in “net securities gains (losses)” are actual gains and losses
resulting from sales of specific securities.
Investment securities. These are debt securities that Key has the intent
and ability to hold until maturity. Debt securities are carried at cost,
adjusted for amortization of premiums and accretion of discounts
using the interest method. This method produces a constant rate of return
on the basis of the adjusted carrying amount.
Other investments. Principal investments — investments in equity and
mezzanine instruments made by Key’s Principal Investing unit — represent
the majority of other investments and are carried at fair value. They
include direct and indirect investments predominately in privately-held
companies. Direct investments are those made in a particular company,
while indirect investments are made through funds that include other
investors. Changes in estimated fair values and actual gains and losses on
sales of Principal Investments are included in “investment banking and
capital markets income” on the income statement.
In addition to principal investments, other investments include securities
that do not have readily determinable fair values. These securities
include certain real estate-related investments that are carried at
estimated fair value, as well as other types of securities that are generally
carried at cost. The carrying amount of the securities carried at cost is
adjusted for declines in value that are considered to be “other than
temporary.” These adjustments are included in “net securities gains
(losses)” on the income statement.
LOANS
Loans are carried at the principal amount outstanding, net of unearned
income, including net deferred loan fees and costs. Key defers certain
nonrefundable loan origination and commitment fees and the direct costs
of originating or acquiring loans. The net deferred amount is amortized
over the estimated lives of the related loans as an adjustment to the yield.
At December 31, 2002, loans held for sale include commercial, mortgage
and education loans. These loans are carried at the lower of aggregate
cost or fair value. Fair value is determined based on prevailing market
prices for loans with similar characteristics. When a loan is placed in the
held for sale category, amortization of the related deferred fees and costs
is discontinued. The remaining unamortized fees and costs are recognized
as part of the cost basis of the loan at the time it is sold.
Direct financing leases are carried at the aggregate of lease payments
receivable plus estimated residual values, less unearned income. Unearned
income on direct financing leases is amortized over the lease terms
using methods that approximate the interest method. This method
amortizes unearned income to produce a constant rate of return on the
lease. Net gains or losses on sales of lease residuals are included in “other
income” on the income statement.
IMPAIRED AND OTHER NONACCRUAL LOANS
Key will generally stop accruing interest on a loan (i.e., designate the loan
“nonaccrual”) when payment is 90 days or more past due, unless the
loan is well-secured and in the process of collection. Loans are also
placed on nonaccrual status when payment is not past due but
management has serious doubts as to the ability of the borrower to
comply with existing loan repayment terms. Once a loan is designated
as nonaccrual, the interest accrued but not collected is generally charged
against the allowance for loan losses, and payments subsequently
received are generally applied to principal. However, if management
believes that all principal and interest on a nonaccrual loan ultimately
are collectible, interest income may be recognized as received.
Nonaccrual loans, other than smaller-balance homogeneous loans (i.e.,
loans to finance residential mortgages, automobiles, etc.), are designated
“impaired.” Impaired loans and other nonaccrual loans are returned to
accrual status when management determines that the borrower’s
performance has improved and that both principal and interest are
collectible. This generally requires a sustained period of timely principal
and interest payments.
ALLOWANCE FOR LOAN LOSSES
The allowance for loan losses represents management’s estimate of
probable credit losses inherent in the loan portfolio at the balance sheet
date. Key determines and maintains an appropriate allowance for loan
losses based on an analysis of the quality of the loan portfolio. This analysis
is conducted at least quarterly, and more often if deemed necessary.
Allowance for impaired loans. When expected cash flows or collateral
values do not justify the carrying amount of an impaired loan, the loan
is assigned a specific allowance. Management calculates the extent of the
impairment, which is the carrying amount of the loan less the estimated
present value of future cash flows and the fair value of any existing
collateral. The amount that management deems uncollectible (the
impaired amount) is charged against the allowance for loan losses. Even
when collateral value or other sources of repayment appear sufficient, if
management remains uncertain about whether the loan will be repaid in
full, an amount is specifically allocated in the allowance for loan losses.
Allowance for nonimpaired loans and binding commitments.
Management establishes an allowance for nonimpaired loans and legally
binding commitments by applying historical loss rates to existing loans with
similar risk characteristics. The portion of this allowance that was related
to legally binding commitments was $72 million at December 31, 2002,
compared with $71 million at December 31, 2001. The loss rates used to
establish the allowance may be adjusted to reflect management’s current
assessment of the following factors:
• changes in national and local economic and business conditions;
• changes in experience, ability and depth of lending management
and staff, in lending policies or in the mix and volume of the loan
portfolio;

NOTES TO CONSOLIDATED FINANCIAL STATEMENTS KEYCORP AND SUBSIDIARIES
59 NEXT PAGEPREVIOUS PAGE SEARCH BACK TO CONTENTS
• the trend of the volume of past due, nonaccrual and other loans; and
• external forces, such as competition, legal developments and regulatory
guidelines.
LOAN SECURITIZATIONS
Key sells education and certain other types of loans in securitizations.
A securitization involves the sale of a pool of loan receivables to
investors through either a public or private issuance (generally by a SPE)
of asset-backed securities. Securitized loans are removed from the
balance sheet and a net gain or loss is recorded when the combined net
sales proceeds and, if applicable, residual interests differ from the
loans’ allocated carrying amount. Net gains and losses resulting from
securitizations are recorded in “other income” on the income statement.
A servicing asset may also be recorded if Key either purchases or
retains the right to service these loans and receives related fees that exceed
the going market rate. Income earned under servicing or administration
arrangements also is recorded in “other income.”
Key adopted SFAS No. 140, “Accounting for Transfers and Servicing of
Financial Assets and Extinguishments of Liabilities,” which took effect for
all transactions entered into after March 31, 2001. SFAS No. 140 added
three significant rules to practices already in effect. These rules:
• prescribe the test that determines whether a SPE is a “qualifying” SPE,
and prescribe the amount and type of derivative instruments a qualifying
SPE can hold and the activities it may pursue;
• provide more restrictive guidance regarding the circumstances under
which a company that transfers assets to a qualifying SPE will be
deemed to have relinquished control of such assets and may account
for the transaction as a sale; and
• require extensive disclosures about collateral, assets securitized and
accounted for as a sale, and retained interests in securitized assets.
In some cases, Key retains a residual interest in securitized loans that may
take the form of an interest-only strip, a residual asset, a servicing
asset and/or a security. The accounting for these retained interests is
subject to the rules contained in SFAS No. 140. Under these rules, the
previous carrying amount of the assets sold is allocated between the
retained interests and the assets sold based on their relative fair values
at the date of transfer. Fair value is determined by computing the
present value of estimated cash flows, using a discount rate that reflects
the risks associated with the cash flows and the dates that Key expects
to receive such cash flows. Other assumptions used in the determination
of fair value are disclosed in Note 8 (“Loan Securitizations and Variable
Interest Entities”), which begins on page 70.
In July 2000, the Emerging Issues Task Force (“EITF”), a standard-
setting group working under the auspices of the FASB, issued EITF 99-
20. This guidance specifies how to record interest income and measure
impairment on beneficial interests retained in a securitization transaction
accounted for as a sale under SFAS No. 140, and on purchased beneficial
interests in securitized financial assets. Assets subject to this accounting
guidance are presented on the balance sheet as securities available for sale
[see Note 6 (“Securities”), which begins on page 68] or as trading
account assets. This guidance became effective for fiscal quarters
beginning after March 15, 2001, causing Key to record a cumulative
after-tax loss of $24 million in earnings for the second quarter of
2001. This loss is presented on Key’s income statement as a “cumulative
effect of accounting change.”
Key conducts a review to determine whether all retained interests are
valued appropriately in the financial statements on a quarterly basis.
Management reviews the historical performance of each retained
interest and the assumptions used to project future cash flows.
Assumptions are revised if past performance and future expectations
dictate, and the present values of cash flows are recalculated based on the
revised assumptions.
The present value of these cash flows is referred to as the “retained
interest fair value.” For retained interests classified as trading account
assets, any increase or decrease in the asset’s fair value is recognized in
“other income” on the income statement. Generally, if the carrying
amount of a retained interest classified as securities available for sale
exceeds its fair value, impairment is indicated and recognized in
earnings. Conversely, if the fair value of the retained interest exceeds its
carrying amount, the write-up to fair value is recorded in equity as a
component of “accumulated other comprehensive income (loss),” and the
yield on the retained interest is adjusted prospectively.
SERVICING ASSETS
Servicing assets purchased or retained by Key in a sale or securitization
of loans are reported at the lower of amortized cost or fair value ($99
million at December 31, 2002, and $73 million at December 31, 2001)
and included in “accrued income and other assets” on the balance
sheet. Fair value is initially measured by allocating the previous carrying
amount of the assets sold or securitized to the retained interests and the
assets sold based on their relative fair values at the date of transfer. Fair
value is determined by estimating the present value of future cash flows
associated with the serviced loans. The estimate is based on a number
of assumptions, including the cost of servicing, discount rate, prepayment
rate and default rate. The amortization of servicing assets is determined
in proportion to, and over the period of, the estimated net servicing
income and is recorded in “other income” on the income statement.
PREMISES AND EQUIPMENT
Premises and equipment, including leasehold improvements, are stated
at cost less accumulated depreciation and amortization. Management
determines depreciation of premises and equipment using the straight-line
method over the estimated useful lives of the particular assets. Leasehold
improvements are amortized using the straight-line method over the terms
of the leases. Accumulated depreciation and amortization on premises and
equipment totaled $1.1 billion at December 31, 2002 and 2001.
GOODWILL AND OTHER INTANGIBLE ASSETS
“Goodwill” represents the amount by which the cost of net assets
acquired in a business combination exceeds their fair value. “Other
intangibles” represent primarily the net present value of the future
economic benefits to be derived from the purchase of core deposits. Other
intangibles are amortized on either an accelerated or straight-line basis
over periods ranging from 7 to 30 years.

NOTES TO CONSOLIDATED FINANCIAL STATEMENTS KEYCORP AND SUBSIDIARIES
60 NEXT PAGEPREVIOUS PAGE SEARCH BACK TO CONTENTS
Effective January 1, 2002, Key adopted SFAS No. 142, “Goodwill and
Other Intangible Assets,” which replaced Accounting Principles Board
Opinion No. 17, “Intangible Assets.” Under the new accounting standard,
companies are no longer permitted to amortize goodwill and other
intangible assets deemed to have indefinite lives. This change reduced Key’s
noninterest expense and increased net income by approximately $79
million, or $.18 per common share, for 2002.
Under SFAS No. 142, goodwill and certain intangible assets are subject
to impairment testing, which must be conducted at least annually. Key
has determined that its reporting units for purposes of this testing are its
major business groups: Key Consumer Banking, Key Corporate Finance
and Key Capital Partners.
The first step in this testing requires that the fair value of each reporting
unit be determined. If the carrying amount of any reporting unit exceeds
its fair value, goodwill impairment may be indicated and a second step of
impairment testing is required. If such were the case, Key would assume
that the purchase price of the reporting unit is equal to its fair value as
determined in the first step and then allocate that purchase price to the fair
value of the unit’s assets (excluding goodwill) and liabilities. Any excess
of the assumed purchase price over the fair value of the reporting unit’s
assets and liabilities represents the implied fair value of goodwill. An
impairment loss would be recognized, as a charge to earnings, to the extent
the carrying amount of the reporting unit’s goodwill exceeds the implied
fair value of goodwill. Any impairment losses resulting from the initial
application of SFAS No. 142 must be reported as a “cumulative effect of
accounting change” on the income statement.
Key was required to perform a transitional impairment test of goodwill
as of January 1, 2002. In conducting this testing, Key used a discounted
cash flow methodology to determine the fair value of its reporting units
and a relative valuation methodology to review the fair values for
reasonableness. Then, Key compared the fair value of each reporting unit
with its carrying amount. Under SFAS No. 142, if the fair value of a
particular reporting unit exceeds its carrying amount, no impairment is
indicated and further testing is not required. Key completed its transitional
goodwill impairment testing during the first quarter of 2002, and
determined that no impairment existed as of January 1, 2002.
The annual goodwill impairment testing required by SFAS No. 142
will be performed by Key in the fourth quarter of each year beginning in
2002. Any future impairment losses would be charged against income
from operations. Key’s annual goodwill impairment testing was performed
as of October 1, 2002, and it was determined that no impairment
existed at that date.
Prior to the adoption of SFAS No. 142, goodwill was amortized using the
straight-line method over the period (up to 40 years) that management
expected the acquired assets to have value. Accumulated amortization on
goodwill and other intangible assets was $919 million at December 31,
2002, and $908 million at December 31, 2001. Before January 1, 2002,
Key reviewed goodwill and other intangibles for impairment when
impairment indicators, such as significant changes in market conditions,
changes in product mix or management focus, or a potential sale or
disposition, arose. In most instances, Key used the undiscounted cash flow
method in testing for impairment. In May 2001, Key recorded a goodwill
impairment charge of $150 million as a result of management’s decision
to downsize the automobile finance business.
INTERNALLY DEVELOPED SOFTWARE
Key relies on both company personnel and independent contractors to
plan, develop, install, customize and enhance computer systems
applications that support corporate and administrative operations.
Software development costs, such as those related to program coding,
testing, configuration and installation, are capitalized and included in
“accrued income and other assets” on the balance sheet. The resulting
asset ($105 million at December 31, 2002, and $134 million at December
31, 2001) is amortized using the straight-line method over its expected
useful life (not to exceed five years). Costs incurred during both the
planning and the post-development phases of an internal software
project are expensed as incurred.
Software that is considered impaired is written down to its fair value.
Software that is no longer used is written off to earnings immediately.
When management decides to replace unimpaired software, amortization
of such software is accelerated to the expected replacement date.
DERIVATIVES USED FOR ASSET AND LIABILITY MANAGEMENT PURPOSES
Key uses derivatives known as interest rate swaps and caps to hedge
interest rate risk. These instruments modify the repricing or maturity
characteristics of specified on-balance sheet assets and liabilities. For
example, an interest rate cap tied to variable rate debt would effectively
prevent the interest rate on that debt from rising above a specified point.
Key’s accounting policies related to such derivatives reflect the accounting
guidance in SFAS No. 133, “Accounting for Derivative Instruments and
Hedging Activities,” which became effective for Key as of January 1, 2001.
This standard established the appropriate accounting and reporting
for derivative instruments and for hedging activities. SFAS No. 133
requires that all derivatives be recognized as either assets or liabilities on
the balance sheet at fair value. The accounting for changes in the fair
value (i.e., gains or losses) of derivatives depends on whether they
have been designated and qualify as part of a hedging relationship, and
further, on the type of hedging relationship. For derivatives that are not
designated as hedging instruments, the gain or loss is recognized
immediately in earnings.
A derivative that is designated and qualifies as a hedging instrument must
be designated either a fair value hedge, a cash flow hedge or a hedge of
a net investment in a foreign operation. Key does not have any derivatives
that hedge net investments in foreign operations.
A fair value hedge is used to hedge changes in the fair value of existing
assets, liabilities and firm commitments against changes in interest
rates or other economic factors. Key recognizes the gain or loss on the
derivative, as well as the related gain or loss on the hedged item
underlying the hedged risk, in earnings during the period in which the
fair value changes. Thus, if a hedge is perfectly effective, the change in
the fair value of the hedged item will be offset, resulting in no net
effect on earnings.

NOTES TO CONSOLIDATED FINANCIAL STATEMENTS KEYCORP AND SUBSIDIARIES
61 NEXT PAGEPREVIOUS PAGE SEARCH BACK TO CONTENTS
A cash flow hedge is used to hedge the variability of future cash flows
against changes in interest rates or other economic factors. The effective
portion of a gain or loss on any cash flow hedge is reported as a
component of “other comprehensive income (loss)” and reclassified into
earnings in the same period or periods that the hedged transaction
affects earnings. Any ineffective portion of the derivative gain or loss is
recognized in earnings during the current period.
As a result of adopting SFAS No. 133, Key recorded cumulative after-
tax losses of $1 million in earnings and $22 million in “other
comprehensive income (loss)” as of January 1, 2001. The cumulative loss
included in earnings represented the fair value at January 1, 2001, of all
derivatives that were then designated as fair value hedges and the
unrealized gain or loss on the related hedged assets and liabilities. The
cumulative loss included in “other comprehensive income (loss)”
represented the effective portion of the fair value of all derivatives
designated as cash flow hedges.
Prior to the effective date of SFAS No. 133, to qualify for hedge
accounting treatment, a derivative had to be effective at reducing the risk
associated with the exposure being managed and had to be designated
as a risk management transaction at the inception of the derivative
contract. An instrument effectively reduced risk if there was a high degree
of interest rate correlation between the derivative and the asset or
liability being managed, both at inception and over the life of the
derivative contract.
There were several rules that governed the hedge accounting treatment
of derivatives prior to SFAS No. 133:
• Changes in fair value of a derivative were not included in the financial
statements.
• The net interest income or expense associated with a derivative was
accrued and recognized as an adjustment to the interest income or
interest expense of the asset or liability being managed.
• The interest receivable or payable from a derivative contract was
recorded in “other assets” or “other liabilities” on the balance sheet.
• Premiums paid for a derivative were amortized as an adjustment to
the interest income or expense of the asset or liability being managed.
• Realized gains and losses resulting from the early termination of a
derivative contract were deferred as an adjustment to the carrying
amount of the related asset or liability. Such gains or losses were
amortized using the straight-line method over the shorter of the
projected remaining life of the derivative contract on the date of
termination or the projected remaining life of the underlying asset or
liability on that date.
DERIVATIVES USED FOR TRADING PURPOSES
Derivatives that are not used for asset and liability management purposes
are used for trading purposes. Key enters into contracts for such
derivatives either to make a market for clients or for proprietary trading
purposes. Derivatives used for trading purposes typically include
financial futures, foreign exchange forward and spot contracts, written
and purchased options (including currency options), and interest rate
swaps, caps and floors.
All derivatives used for trading purposes are recorded at fair value. Fair
value is determined by estimating the present value of future cash
flows. Derivatives with a positive fair value are included in “accrued
income and other assets” on the balance sheet, and derivatives with a
negative fair value are included in “accrued expense and other
liabilities.” Changes in fair value (including payments and receipts) are
recorded in “investment banking and capital markets income” on the
income statement.
EMPLOYEE STOCK OPTIONS
Through December 31, 2002, Key accounted for stock options issued to
employees using the intrinsic value method. This method requires that
compensation expense be recognized to the extent that the fair value of
the stock exceeds the exercise price of the option at the grant date. Key’s
employee stock options generally have fixed terms and exercise prices
that are equal to or greater than the fair value of Key’s common shares
at the grant date, so Key generally does not recognize compensation
expense related to stock options.
In September 2002, KeyCorp’s Board of Directors approved
management’s recommendation to change Key’s method of accounting
for stock options granted to eligible employees and directors. Effective
January 1, 2003, Key will adopt the fair value method of accounting as
outlined in SFAS No. 123, “Accounting for Stock-Based Compensation.”
Additional information pertaining to this accounting change is
summarized under the heading “Accounting Pronouncements Pending
Adoption” on page 62.
SFAS No. 123 requires companies like Key that use the intrinsic value
method to account for employee stock options to provide pro forma
disclosures of the net income and earnings per share effect of stock
options using the fair value method. Management estimates the fair value
of options granted using the Black-Scholes option-pricing model. This
model was originally developed to estimate the fair value of exchange-
traded equity options, which (unlike employee stock options) have no
vesting period or transferability restrictions. As a result, the Black-
Scholes model is not a perfect indicator of the value of an option, but it
is commonly used for this purpose.
The Black-Scholes model requires several assumptions, which
management developed based on historical trends and current market
observations. These assumptions include:
• an average option life of 4.1 years in 2002, 3.9 years in 2001 and 4.7
years in 2000;
• a future dividend yield of 4.84% in 2002, 4.22% in 2001 and 5.83%
in 2000;
• share price volatility of .264 in 2002, .330 in 2001 and .267 in
2000; and
• a weighted average risk-free interest rate of 3.9% in 2002, 5.0% in
2001 and 6.6% in 2000.
The level of accuracy achieved in deriving the estimated fair values is
directly related to the accuracy of the underlying assumptions.

NOTES TO CONSOLIDATED FINANCIAL STATEMENTS KEYCORP AND SUBSIDIARIES
62 NEXT PAGEPREVIOUS PAGE SEARCH BACK TO CONTENTS
MARKETING COSTS
Key expenses all marketing-related costs, including advertising costs,
as incurred.
RESTRUCTURING CHARGES
Key may record restructuring charges in connection with certain events
or transactions, including business combinations, changes in Key’s
strategic plan, changes in business conditions that may result in a
decrease in or exit from affected businesses, or other factors. Such
charges typically result from consolidating or relocating operations, or
disposing of or abandoning operations or productive assets. Any of these
events could result in a significant downsizing of the workforce.
To qualify as restructuring charges, costs must be incremental and
incurred as a direct result of a restructuring event or transaction.
Restructuring charges do not include costs that are associated with or
incurred to benefit future periods. Among the costs typically included in
restructuring charges are those related to:
• employee severance and termination benefits;
• the consolidation of operations facilities; and
• losses resulting from the impairment or disposal of assets.
In July 2002, the FASB issued SFAS No. 146, “Accounting for Costs
Associated with Exit or Disposal Activities.” Additional information
pertaining to this new accounting guidance is summarized under the
heading “Accounting Pronouncements Pending Adoption.”
ACCOUNTING PRONOUNCEMENTS ADOPTED IN 2002
Acquisitions of certain financial institutions. Effective October 1,
2002, Key adopted SFAS No. 147, “Acquisitions of Certain Financial
Institutions.” SFAS No. 147 addresses the financial accounting and
reporting for the acquisition of all or part of a financial institution and
also provides guidance on the accounting for the impairment or disposal
of acquired long-term customer relationship intangible assets. The
adoption of this standard did not have any effect on Key’s financial
condition or results of operations.
Extinguishment of debt. Effective April 1, 2002, Key adopted SFAS No.
145, “Rescission of FASB Statements No. 4, 44, and 64, Amendment of
FASB Statement No. 13 and Technical Corrections.” Under this new
standard, gains and losses on the extinguishment of debt must be
recognized as income or loss from continuing operations rather than
extraordinary items. The adoption of this standard did not have any
effect on Key’s financial condition or results of operations.
Impairment or disposal of long-lived assets. Effective January 1, 2002,
Key adopted SFAS No. 144, “Accounting for the Impairment or Disposal
of Long-Lived Assets.” This new standard maintains the previous
accounting for the impairment or disposal of long-lived assets, but
imposes more conditions on the classification of such an asset as “held
for sale.” SFAS No. 144 also increases the range of dispositions that
qualify for reporting as discontinued operations and changes the manner
in which expected future operating losses from such operations are to
be reported. The adoption of this standard did not have any effect on
Key’s financial condition or results of operations.
Goodwill and other intangible assets. Effective January 1, 2002, Key
adopted SFAS No. 142, “Goodwill and Other Intangible Assets.”
Additional information pertaining to this new accounting guidance is
summarized under the heading “Goodwill and Other Intangible Assets”
on page 59.
ACCOUNTING PRONOUNCEMENTS PENDING ADOPTION
Consolidation of variable interest entities. In January 2003, the FASB
issued Interpretation No. 46, “Consolidation of Variable Interest Entities,”
which significantly changes how Key and other companies determine
when to consolidate other entities. Under this guidance, entities are
classified as either voting interest entities or variable interest entities
(“VIEs”). A voting interest entity is evaluated for consolidation under
existing accounting standards, which focus on the equity owner with
voting control, while a VIE is consolidated by its primary beneficiary. The
primary beneficiary is the party that holds variable interests that expose
it to a majority of the entity’s expected losses and/or residual returns.
Variable interests include equity interests, subordinated debt, derivative
Year ended December 31,in millions, except per share amounts 2002 2001 2000
Net income $976 $132 $1,002Less: Stock-based employee compensation expense determined
under fair value method, net of tax 20 25 17
Net income — pro forma $956 $107 $ 985
Per common share:Net income $2.29 $.31 $2.32 Net income — pro forma 2.25 .25 2.28 Net income assuming dilution 2.27 .31 2.30 Net income assuming dilution — pro forma 2.23 .25 2.24
The model assumes that the estimated fair value of an option is
amortized over the option’s vesting period and would be included in
personnel expense on the income statement. The pro forma effect of
applying the fair value method of accounting for the years shown in the
following table may not be indicative of the effect in future years.

NOTES TO CONSOLIDATED FINANCIAL STATEMENTS KEYCORP AND SUBSIDIARIES
63 NEXT PAGEPREVIOUS PAGE SEARCH BACK TO CONTENTS
contracts, leases, service agreements, guarantees, standby letters of
credit, loan commitments and other instruments.
Interpretation No. 46 was effective immediately for entities created or
obtained after January 31, 2003, and applies to previously existing
entities in quarters beginning after June 15, 2003. It requires additional
disclosures by primary beneficiaries and other significant variable interest
holders. Management is currently evaluating Key’s involvement with
entities created before February 1, 2003, to identify those that must be
consolidated or only disclosed in accordance with this guidance. The most
significant impact of this new guidance will be on Key’s balance sheet
since consolidating additional entities will increase assets and liabilities
and change leverage and capital ratios, as well as asset concentrations.
Additional information is summarized in Note 8 (“Loan Securitizations
and Variable Interest Entities”), which begins on page 70 and in Note 19
(“Commitments, Contingent Liabilities and Guarantees”), which begins
on page 81.
Accounting for and disclosure of guarantees. In November 2002, the
FASB issued Interpretation No. 45, “Guarantor’s Accounting and
Disclosure Requirements for Guarantees, Including Indirect Guarantees
of Indebtedness of Others.” This Interpretation requires a guarantor to
recognize, at the inception of a guarantee, a liability for the fair value of
obligations undertaken. The liability that must be recognized is specifically
related to the obligation to stand ready to perform over the term of the
guarantee. The initial recognition and measurement provisions of this
guidance are effective on a prospective basis for guarantees issued or
modified on or after January 1, 2003.
This new accounting guidance also expands the disclosures that a
guarantor must make about its obligations under certain guarantees.
These disclosure requirements are effective for financial statements of
interim or annual periods ending after October 15, 2002. The required
disclosures for Key are provided in Note 19 (“Commitments, Contingent
Liabilities and Guarantees”), which begins on page 81.
Management expects that the adoption of Interpretation No. 45 will not
have any material effect on Key’s financial condition or results of operations.
Costs associated with exit or disposal activities. In July 2002, the
FASB issued SFAS No. 146, “Accounting for Costs Associated with
Exit or Disposal Activities.” This new standard is effective for exit or
disposal activities (e.g., activities related to ceasing a line of business,
relocating operations, etc.) initiated after December 31, 2002. SFAS No.
146 substantially changes the rules for recognizing costs, such as lease
or other contract termination costs and one-time employee termination
benefits associated with exit or disposal activities arising from corporate
restructurings. Generally, these costs must be recognized when incurred.
Previously, those costs could be recognized earlier, for example, when a
company committed to an exit or disposal plan. Key will adopt SFAS No.
146 for restructuring activities initiated on or after January 1, 2003.
Management expects that the adoption of SFAS No. 146 will not
significantly affect Key’s financial condition or results of operations.
Asset retirement obligations. In August 2001, the FASB issued SFAS No.
143, “Accounting for Asset Retirement Obligations.” The new standard
takes effect for fiscal years beginning after June 15, 2002. SFAS No. 143
addresses the accounting for legal obligations associated with the
retirement of tangible long-lived assets and requires a liability to be
recognized for the fair value of these obligations in the period they are
incurred. Related costs are capitalized as part of the carrying amounts
of the assets to be retired and are amortized over the assets’ useful lives.
Key will adopt SFAS No. 143 as of January 1, 2003. Management has
determined that the adoption of this accounting guidance will not
affect Key’s financial condition or results of operations.
Accounting for stock compensation. Under SFAS No. 123, “Accounting
for Stock-Based Compensation,” companies may either recognize the
compensation cost associated with stock options as expense over the
respective vesting periods or disclose the pro forma impact on earnings
in their audited financial statements. Key has historically followed the
latter approach, but in September 2002, KeyCorp’s Board of Directors
approved management’s recommendation to recognize the compensation
cost for stock options. Effective January 1, 2003, Key will adopt the fair
value method of accounting as outlined in SFAS No. 123. Management
intends to apply the change in accounting prospectively (prospective
method) to all awards as permitted under the transition provisions in
SFAS No. 148, “Accounting for Stock-Based Compensation Transition
and Disclosure,” which was issued in December 2002. SFAS No. 148
amends SFAS No. 123 to provide alternative methods of transition
for an entity that voluntarily changes to the fair value method of
accounting for stock compensation. These alternative methods include
the: (i) prospective method; (ii) modified prospective method; and, (iii)
retroactive restatement method. This accounting guidance also amends
the disclosure requirements of SFAS No. 123 to require prominent
disclosures in both annual and interim financial statements about the
method of accounting for stock compensation and the effect of the
method used on reported financial results. The required disclosures
for Key are provided under the heading “Employee Stock Options” on
page 61 and in Note 15 (“Stock Options”), which begins on page 77.
Based on the valuation and timing of options granted in 2002 and
projected to be granted in 2003, management estimates that the
accounting change will reduce Key’s diluted earnings per common
share by up to $.04 in 2003. The effect on Key’s earnings per common
share in subsequent years will depend on the number and timing of
options granted and the assumptions used to estimate their fair value.

NOTES TO CONSOLIDATED FINANCIAL STATEMENTS KEYCORP AND SUBSIDIARIES
64 NEXT PAGEPREVIOUS PAGE SEARCH BACK TO CONTENTS
Key calculates its basic and diluted earnings per common share as follows:
Year ended December 31,dollars in millions, except per share amounts 2002 2001 2000
EARNINGSIncome before cumulative effect of accounting changes $976 $157 $1,002Net income 976 132 1,002
WEIGHTED AVERAGE COMMON SHARESWeighted average common shares outstanding (000) 425,451 424,275 432,617Effect of dilutive common stock options (000) 5,252 5,298 2,956
Weighted average common shares and potentialcommon shares outstanding (000) 430,703 429,573 435,573
EARNINGS PER COMMON SHAREIncome per common share before cumulative effect of accounting changes $2.29 $.37 $2.32Net income per common share 2.29 .31 2.32Income per common share before cumulative effect of accounting changes
— assuming dilution 2.27 .37 2.30Net income per common share — assuming dilution 2.27 .31 2.30
2. EARNINGS PER COMMON SHARE
Key completed the following acquisitions and divestitures during the past
three years.
ACQUISITIONSUnion Bankshares, Ltd.On December 12, 2002, Key purchased Union Bankshares, Ltd., the
holding company for Union Bank & Trust, a seven-branch bank
headquartered in Denver, Colorado. Key paid $22.63 per Union
Bankshares common share for a total cash consideration of $66 million.
Goodwill of approximately $34 million and core deposit intangibles of
$13 million were recorded. Union Bankshares, Ltd. had assets of $475
million at the date of acquisition. On January 17, 2003, Union Bank &
Trust was merged into KBNA.
Conning Asset Management On June 28, 2002, Key purchased substantially all of the mortgage loan
and real estate business of Conning Asset Management, headquartered in
Hartford, Connecticut. Conning’s mortgage loan and real estate business
originates, securitizes and services multi-family, retail, industrial and
office property mortgage loans on behalf of pension fund and life
insurance company investors. At the date of acquisition, Conning had net
assets of $17 million and serviced approximately $4 billion in commercial
mortgage loans. In accordance with a confidentiality clause in the purchase
agreement, the terms, which are not material, have not been disclosed.
The Wallach Company, Inc.On January 2, 2001, Key purchased The Wallach Company, Inc., an
investment banking firm headquartered in Denver, Colorado. Key paid
the purchase price of approximately $11 million using a combination of
cash and 370,830 Key common shares. Goodwill of approximately
$9 million was recorded and, prior to the adoption of SFAS No. 142,
“Goodwill and Other Intangible Assets,” on January 1, 2002, was
being amortized using the straight-line method over a period of 10 years.
Newport Mortgage Company, L.P.On September 30, 2000, Key purchased certain net assets of Newport
Mortgage Company, L.P., a commercial mortgage company
headquartered in Dallas, Texas, for $22 million in cash. Goodwill of
approximately $10 million was recorded and, prior to the adoption of
SFAS No. 142, was being amortized using the straight-line method
over a period of 10 years.
National Realty Funding L.C.On January 31, 2000, Key purchased certain net assets of National
Realty Funding L.C., a commercial finance company headquartered
in Kansas City, Missouri, for $359 million in cash. Goodwill of
approximately $10 million was recorded and, prior to the adoption of
SFAS No. 142, was being amortized using the straight-line method
over a period of 15 years.
DIVESTITURES401(k) Recordkeeping Business On June 12, 2002, Key sold its 401(k) recordkeeping business. Key
recognized a gain of $3 million ($2 million after tax), which is included
in “other income” on the income statement.
Credit Card PortfolioOn January 31, 2000, Key sold its credit card portfolio of $1.3 billion
in receivables and nearly 600,000 active VISA and MasterCard accounts
to Associates National Bank (Delaware). Key recognized a gain of
$332 million ($207 million after tax), which is included in “gain from
sale of credit card portfolio” on the income statement.
3. ACQUISITIONS AND DIVESTITURES

NOTES TO CONSOLIDATED FINANCIAL STATEMENTS KEYCORP AND SUBSIDIARIES
65 NEXT PAGEPREVIOUS PAGE SEARCH BACK TO CONTENTS
4. LINE OF BUSINESS RESULTS
Key has three major business groups that consist of 10 lines of business:
KEY CONSUMER BANKING
Retail Banking provides individuals with branch-based deposit and
investment products, personal finance services and loans, including
residential mortgages, home equity and various types of installment loans.
Small Business provides businesses that have annual sales revenues of $10
million or less with deposit, investment and credit products, and business
advisory services.
Indirect Lending offers automobile, marine and recreational vehicle
(RV) loans to consumers through dealers, and finances inventory for
automobile, marine and RV dealers. This line of business also provides
education loans, insurance and interest-free payment plans for students
and their parents.
National Home Equity provides primarily nonprime mortgage and
home equity loan products to individuals. These products originate
outside of Key’s retail branch system. This line of business also works
with mortgage brokers and home improvement contractors to provide
home equity and home improvement solutions.
KEY CORPORATE FINANCE
Corporate Banking provides financing, cash and investment management
and business advisory services to middle-market companies and large
corporations.
National Commercial Real Estate provides construction and interim
lending, permanent debt placements and servicing, and equity and
investment banking services to developers, brokers and owner-investors.
This line of business deals exclusively with nonowner-occupied properties
(i.e., generally properties in which the owner occupies less than 60% of
the premises).
National Equipment Finance meets the equipment leasing needs of
companies worldwide and provides equipment manufacturers,
distributors and resellers with financing options for their clients.
Lease financing receivables and related revenues are assigned to
Corporate Banking or National Commercial Real Estate if one of those
businesses is principally responsible for maintaining the relationship
with the client.
KEY CAPITAL PARTNERS
Victory Capital Management manages or gives advice regarding
investment portfolios for a national client base, including corporations,
labor unions, not-for-profit organizations, governments and individuals.
These portfolios may be managed in separate accounts, commingled
funds or the Victory family of mutual funds. This line of business also
provides administrative services for retirement plans.
High Net Worth offers financial, estate and retirement planning and asset
management services to assist high-net-worth clients with their banking,
brokerage, trust, portfolio management, insurance, charitable giving and
related needs.
Capital Markets offers investment banking, capital raising, hedging
strategies, trading and financial strategies to public and privately-held
companies, institutions and government organizations.
OTHER SEGMENTS
Other segments consists primarily of Treasury, Principal Investing and
the net effect of funds transfer pricing.
RECONCILING ITEMS
Total assets included under “Reconciling Items” represent primarily the
unallocated portion of nonearning assets of corporate support functions.
Charges related to the funding of these assets are part of net interest income
and are allocated to the business segments through noninterest expense.
Reconciling Items also include significant items (see note b to the table on
pages 66 and 67). These items are not allocated to the business segments
because they are not reflective of their normal operations.
The table that spans pages 66 and 67 shows selected financial data for each
major business group for the years ended December 31, 2002, 2001 and
2000. This table is accompanied by additional supplementary information
for each of the lines of business that comprise these groups. The information
was derived from the internal financial reporting system that management
uses to monitor and manage Key’s financial performance. Accounting
principles generally accepted in the United States guide financial accounting,
but there is no authoritative guidance for “management accounting” — the
way management uses its judgment and experience to make reporting
decisions. Consequently, the line of business results Key reports may not
be comparable with results presented by other companies.
The selected financial data are based on internal accounting policies
designed to compile results on a consistent basis and in a manner that
reflects the underlying economics of the businesses. As such:
• Net interest income is determined by assigning a standard cost for
funds used to assets or a standard credit for funds provided to
liabilities based on their maturity, prepayment and/or repricing
characteristics. The net effect of this funds transfer pricing is included
in the “Other Segments” columns.
• Indirect expenses, such as computer servicing costs and corporate
overhead, are allocated based on assumptions of the extent to which
each line actually uses the services.
• Key’s consolidated provision for loan losses is allocated among the lines
of business based primarily on their actual net charge-offs (excluding
those in the run-off portfolio discussed on page 43), adjusted for loan
growth and changes in risk profile. The level of the consolidated
provision is based on the methodology that management uses to
estimate Key’s consolidated allowance for loan losses. This methodology
is described in Note 1 (“Summary of Significant Accounting Policies”)
under the heading “Allowance for Loan Losses” on page 58.
• Income taxes are allocated based on the statutory federal income tax
rate of 35% (adjusted for tax-exempt interest income, income from
corporate-owned life insurance and tax credits associated with
investments in low-income housing projects) and a blended state
income tax rate (net of the federal income tax benefit) of 2%.

NOTES TO CONSOLIDATED FINANCIAL STATEMENTS KEYCORP AND SUBSIDIARIES
66 NEXT PAGEPREVIOUS PAGE SEARCH BACK TO CONTENTS
Year ended December 31, Key Consumer Banking Key Corporate Finance Key Capital Partners
dollars in millions 2002 2001 2000 2002 2001 2000 2002 2001 2000
SUMMARY OF OPERATIONSNet interest income (TE) $1,805 $1,818 $1,757 $1,123 $1,092 $1,011 $ 235 $ 216 $ 214Noninterest income 497 482 475 238 259 253 874 943 974
Total revenue (TE)a 2,302 2,300 2,232 1,361 1,351 1,264 1,109 1,159 1,188Provision for loan losses 303 300 281 236 140 125 14 13 4Depreciation and amortization expense 137 216 224 39 64 62 53 97 93Other noninterest expense 1,187 1,150 1,132 456 453 435 793 829 851
Income (loss) before income taxes (TE) and cumulative effect of accounting changes 675 634 595 630 694 642 249 220 240
Allocated income taxes and TE adjustments 253 252 239 236 265 246 93 91 98
Income (loss) before cumulative effect of accounting changes 422 382 356 394 429 396 156 129 142Cumulative effect of accounting changes — (24) — — — — — — —
Net income (loss) $ 422 $ 358 $ 356 $ 394 $ 429 $ 396 $ 156 $ 129 $ 142
Percent of consolidated net income 43% 271% 36% 41% 325% 39% 16% 98% 14%Percent of total segments net income 44 40 37 41 48 42 16 14 15
AVERAGE BALANCESLoans $27,806 $27,673 $26,690 $29,278 $31,098 $30,592 $4,904 $5,266 $5,439Total assetsa 29,970 30,398 29,637 30,568 32,593 32,086 8,382 8,965 8,994Deposits 33,942 35,221 35,370 3,384 3,093 2,815 3,924 3,679 3,480
OTHER FINANCIAL DATAExpenditures for additions to long-lived assetsa $ 74 $ 51 $ 48 $ 14 $ 19 $ 24 $11 $18 $21Net loan charge-offs 303 350 281 462 305 126 14 13 4Return on average allocated equity 21.14% 16.13% 14.64% 14.12% 15.42% 15.06% 16.25% 12.33% 12.49%Full-time equivalent employees 8,299 8,523 8,769 1,789 1,770 2,034 3,474 3,749 3,916
a Substantially all revenue generated by Key’s major business groups is derived from clients resident in the United States. Substantially all long-lived assets, including premises and equipment,capitalized software and goodwill, held by Key’s major business groups are located in the United States.
b Significant items included under Reconciling Items are as follows:
Year ended December 31, 2001
• Noninterest income includes a $40 million ($25 million after tax) charge taken to establish a reserve for losses incurred on the residual values of leased vehicles and a $15 million ($9 millionafter tax) increase in the reserve for customer derivative losses.
• The provision for loan losses includes an additional $400 million ($252 million after tax) taken to increase the allowance for loan losses for Key’s continuing loan portfolio and an additional$490 million ($309 million after tax) recorded primarily in connection with Key’s decision to discontinue certain credit-only commercial relationships.
• Depreciation and amortization expense includes a goodwill write-down of $150 million associated with the downsizing of the automobile finance business, and other noninterest expenseincludes charges of $20 million ($13 million after tax) taken to establish additional litigation reserves.
Year ended December 31, 2000
• Noninterest income includes a gain of $332 million ($207 million after tax) from the sale of Key’s credit card portfolio.
• The provision for loan losses includes an additional $121 million ($76 million after tax) recorded in connection with the implementation of an enhanced methodology for assessing credit risk,particularly in the commercial loan portfolio.
• Noninterest expense includes $127 million ($80 million after tax), primarily restructuring charges, recorded in connection with strategic actions taken to improve Key’s operating efficiency and profitability.
TE = Taxable Equivalent, N/A = Not Applicable, N/M = Not Meaningful
• Capital is assigned based on management’s assessment of economic
risk factors (primarily credit, operating and market risk).
Developing and applying the methodologies that management uses to
allocate items among Key’s lines of business is a dynamic process.
Accordingly, financial results may be revised periodically to reflect
accounting enhancements, changes in the risk profile of a particular
business or changes in Key’s organization structure. The financial data
reported for all periods presented in the tables reflect a number of
changes, which occurred during 2002:
• The Small Business line of business moved from Key Corporate
Finance to Key Consumer Banking.
• Methodologies used to allocate certain overhead costs, management
fees and funding costs were refined.
• In previous years, noninterest income and expense attributable
to Key Capital Partners was assigned to the other business groups
if one of those groups was principally responsible for maintaining
the relationship with the client that used Key Capital Partners’
products and services. That revenue and expense sharing has been
discontinued.
• The methodology used to assign a provision for loan losses to each
line of business was changed from one based on the credit quality
expectations within each line over a normal business cycle to one based
primarily upon actual net charge-offs (excluding those in the run-off
portfolio), adjusted for loan growth and changes in risk profile.

NOTES TO CONSOLIDATED FINANCIAL STATEMENTS KEYCORP AND SUBSIDIARIES
67 NEXT PAGEPREVIOUS PAGE SEARCH BACK TO CONTENTS
Other Segments Total Segments Reconciling Itemsb Key
2002 2001 2000 2002 2001 2000 2002 2001 2000 2002 2001 2000
$(194) $(139) $ (85) $2,969 $2,987 $2,897 $(100) $ (117) $(139) $2,869 $2,870 $2,758 118 66 142 1,727 1,750 1,844 42 (25) 350 1,769 1,725 2,194
(76) (73) 57 4,696 4,737 4,741 (58) (142) 211 4,638 4,595 4,952 1 5 3 554 458 413 (1) 892 77 553 1,350 490 — 1 1 229 378 380 1 152 2 230 530 382
24 23 30 2,460 2,455 2,448 (37) (44) 87 2,423 2,411 2,535
(101) (102) 23 1,453 1,446 1,500 (21) (1,142) 45 1,432 304 1,545 (81) (83) (35) 501 525 548 (45) (378) (5) 456 147 543
(20) (19) 58 952 921 952 24 (764) 50 976 157 1,002 — (1) — — (25) — — — — — (25) —
$ (20) $ (20) $ 58 $ 952 $ 896 $ 952 $ 24 $ (764) $ 50 $ 976 $ 132 $1,002
(2)% (15)% 6% 98% 679% 95% 2% (579)% 5% 100% 100% 100% (1) (2) 6 100 100 100 N/A N/A N/A N/A N/A N/A
$ 1,262 $ 1,833 $ 2,280 $63,250 $65,870 $65,001 $ 143 $ 106 $ 293 $63,393 $65,976 $65,294 11,210 11,585 11,511 80,130 83,541 82,228 1,651 1,362 1,807 81,781 84,903 84,035
3,606 3,492 3,773 44,856 45,485 45,438 (75) (30) (3) 44,781 45,455 45,435
— — — $ 99 $ 88 $ 93 $95 $111 $107 $194 $199 $200 $1 $5 $3 780 673 414 — — — 780 673 414
N/M N/M N/M 15.52% 13.72% 14.44% N/M N/M N/M 14.96% 2.01% 15.39% 35 31 36 13,597 14,073 14,755 6,840 7,157 7,387 20,437 21,230 22,142
SUPPLEMENTARY INFORMATION (KEY CONSUMER BANKING LINES OF BUSINESS)
Year ended December 31, Retail Banking Small Business Indirect Lending National Home Equity
dollars in millions 2002 2001 2000 2002 2001 2000 2002 2001 2000 2002 2001 2000
Total revenue (taxable equivalent) $ 1,301 $ 1,324 $ 1,304 $ 398 $ 391 $ 367 $ 355 $ 401 $ 425 $ 248 $ 184 $ 136 Provision for loan losses 71 62 124 60 44 33 132 158 115 40 36 9 Noninterest expense 814 855 872 170 179 170 175 187 182 165 145 132 Net income 260 247 185 105 104 101 30 10 76 27 (3) (6)Average loans 8,784 7,675 7,654 4,272 4,409 4,065 9,630 10,949 11,895 5,120 4,640 3,076 Average deposits 29,890 31,486 31,615 3,723 3,555 3,613 317 171 138 12 9 4 Net loan charge-offs 71 62 124 60 44 33 132 158 115 40 86 9 Return on average allocated equity 46.93% 42.15% 27.13% 32.92% 30.59% 31.08% 4.52% 1.17% 7.60% 5.87% (.68)% (1.42)% Full-time equivalent employees 6,053 6,191 6,606 295 258 253 747 776 829 1,204 1,298 1,081
SUPPLEMENTARY INFORMATION (KEY CORPORATE FINANCE LINES OF BUSINESS)
Year ended December 31, Corporate Banking National Commercial Real Estate National Equipment Finance
dollars in millions 2002 2001 2000 2002 2001 2000 2002 2001 2000
Total revenue (taxable equivalent) $ 738 $ 787 $ 773 $ 390 $ 377 $ 316 $ 233 $ 187 $ 175 Provision for loan losses 167 98 112 7 10 2 62 32 11 Noninterest expense 283 313 327 131 118 98 81 86 72 Net income 179 233 207 158 155 135 57 41 54 Average loans 15,687 17,945 18,454 7,782 7,931 7,227 5,809 5,222 4,911 Average deposits 2,776 2,561 2,478 599 525 328 9 7 9 Net loan charge-offs 393 239 113 7 10 2 62 56 11 Return on average allocated equity 10.86% 14.26% 12.71% 21.88% 21.15% 24.19% 13.57% 9.86% 12.22% Full-time equivalent employees 569 650 866 614 499 493 606 621 675

NOTES TO CONSOLIDATED FINANCIAL STATEMENTS KEYCORP AND SUBSIDIARIES
68 NEXT PAGEPREVIOUS PAGE SEARCH BACK TO CONTENTS
SUPPLEMENTARY INFORMATION (KEY CAPITAL PARTNERS LINES OF BUSINESS)
Year ended December 31, Victory Capital Management High Net Worth Capital Markets
dollars in millions 2002 2001 2000 2002 2001 2000 2002 2001 2000
Total revenue (taxable equivalent) $205 $227 $235 $ 583 $ 619 $ 652 $ 321 $ 313 $ 301 Provision for loan losses — — — 14 13 4 — — — Noninterest expense 146 164 169 473 521 533 227 241 242 Net income 36 38 40 61 50 69 59 41 33 Average loans 13 26 29 4,204 4,633 4,825 687 607 585 Average deposits 59 75 85 2,246 2,067 1,896 1,619 1,537 1,499 Net loan charge-offs — — — 14 13 4 — — — Return on average allocated equity 30.51% 28.57% 27.03% 13.47% 9.84% 12.34% 15.17% 10.12% 7.67% Full-time equivalent employees 429 579 623 2,347 2,483 2,586 698 687 707
Federal law requires depository institutions to maintain a prescribed
amount of cash or noninterest-bearing balances with the Federal Reserve
Bank. KeyCorp’s bank subsidiaries maintained average reserve balances
aggregating $336 million in 2002 to fulfill these requirements.
KeyCorp’s principal source of cash flow to pay dividends on its common
shares, to service its debt and to finance its corporate operations is capital
distributions from KBNA and its other subsidiaries. Federal banking law
limits the amount of capital distributions that national banks can make to
their holding companies without obtaining prior regulatory approval. A
national bank’s dividend paying capacity is affected by several factors,
including the amount of its net profits (as defined by statute) for the two
previous calendar years, and net profits for the current year up to the date
of dividend declaration. Due to this constraint, and the restructuring
charges taken by KBNA and Key Bank USA in 2001, as of January 1, 2003,
neither bank could pay dividends or make other capital distributions to
KeyCorp without prior regulatory approval.
In February 2003, KBNA obtained regulatory approval to make capital
distributions to KeyCorp of up to $365 million in the aggregate in the
first and second quarters. If KBNA were to distribute such amount, it
would not have any further dividend paying capacity until it accumulates
at least $300 million of additional net profits in 2003. Management
expects this will occur during the second quarter. Management also
expects Key Bank USA to have restored dividend paying capacity
during the first quarter.
Assuming KBNA had distributed the $365 million to KeyCorp as
of February 15, 2003, as of that date, KeyCorp would have had
approximately $1.5 billion of cash or short-term investments available
to pay dividends on its common shares, to service its debt and to
finance its corporate operations. Management does not expect current
constraints on the subsidiary banks to pay dividends to KeyCorp to have
any material effect on the ability of KeyCorp to pay dividends to its
shareholders, to service its debt or to meet its other obligations.
Federal law also restricts loans and advances from bank subsidiaries to
their parent companies (and to nonbank subsidiaries of their parent
companies), and requires those transactions to be secured.
5. RESTRICTIONS ON CASH, DIVIDENDS AND LENDING ACTIVITIES
The amortized cost, unrealized gains and losses, and approximate fair value of Key’s investment securities, securities available for sale and other
investments were as follows:
December 31, 2002 2001
Gross Gross Gross GrossAmortized Unrealized Unrealized Fair Amortized Unrealized Unrealized Fair
in millions Cost Gains Losses Value Cost Gains Losses Value
INVESTMENT SECURITIESStates and political subdivisions $120 $9 — $129 $225 $9 — $234
SECURITIES AVAILABLE FOR SALEU.S. Treasury, agencies and corporations $ 22 $ 1 — $ 23 $ 99 — — $ 99 States and political subdivisions 35 — — 35 21 — — 21 Collateralized mortgage obligations 7,143 129 $65 7,207 3,791 $ 86 $72 3,805 Other mortgage-backed securities 815 37 — 852 1,008 24 — 1,032 Retained interests in securitizations 166 43 — 209 214 20 — 234 Other securities 208 — 27 181 232 1 16 217
Total securities available for sale $8,389 $210 $92 $8,507 $5,365 $131 $88 $5,408
OTHER INVESTMENTSPrincipal investments $702 $36 $61 $677 $699 — $78 $621 Other securities 242 — — 242 211 — — 211
Total other investments $944 $36 $61 $919 $910 — $78 $832
6. SECURITIES

NOTES TO CONSOLIDATED FINANCIAL STATEMENTS KEYCORP AND SUBSIDIARIES
69 NEXT PAGEPREVIOUS PAGE SEARCH BACK TO CONTENTS
When Key retains an interest in loans it securitizes, it bears risk that the
loans will be prepaid (which would reduce expected interest income) or
not paid at all. Key accounts for these retained interests (which include
both certificated and uncertificated interests) as debt securities, classifying
them as available for sale or as trading account assets.
“Other securities” held in the available for sale portfolio primarily
are marketable equity securities, including an internally managed
portfolio of bank common stock investments. “Other securities” held in
the other investments portfolio are equity securities that do not have
readily determinable fair values.
Realized gains and losses related to securities available for sale were
as follows:
At December 31, 2002, securities available for sale and investment
securities with an aggregate amortized cost of approximately $6.0
billion were pledged to secure public and trust deposits, securities sold
under repurchase agreements, and for other purposes required or
permitted by law.
The following table shows securities available for sale and investment
securities by remaining contractual maturity. Included in securities
available for sale are collateralized mortgage obligations, other mortgage-
backed securities and retained interests in securitizations. All of these
securities are presented based on their expected average lives. Other
investments do not have stated maturities and are not included in the table.
Securities InvestmentAvailable for Sale Securities
December 31, 2002 Amortized Fair Amortized Fairin millions Cost Value Cost Value
Due in one year or less $ 861 $ 874 $ 32 $ 32Due after one through five years 6,718 6,889 69 76Due after five through ten years 234 218 18 20Due after ten years 576 526 1 1
Total $8,389 $8,507 $120 $129
Year ended December 31,in millions 2002 2001 2000
Realized gains $34 $40 $ 59Realized losses 28 5 87
Net securities gains (losses) $ 6 $35 $(28)
Key’s loans by category are summarized as follows:
December 31,in millions 2002 2001
Commercial, financial and agricultural $17,425 $18,159 Commercial real estate:
Commercial mortgage 6,015 6,669 Construction 5,659 5,878
Total commercial real estate loans 11,674 12,547 Commercial lease financing 7,513 7,357
Total commercial loans 36,612 38,063 Real estate — residential mortgage 1,968 2,315 Home equity 13,804 11,184 Consumer — direct 2,161 2,342 Consumer — indirect:
Automobile lease financing 873 2,036 Automobile loans 2,181 2,497 Marine 2,088 1,780 Other 667 1,036
Total consumer — indirect loans 5,809 7,349
Total consumer loans 23,742 23,190 Loans held for sale:
Commercial, financial and agricultural 41 —Real estate — commercial mortgage 193 252 Real estate — residential mortgage 57 116 Education 1,812 1,688
Total loans held for sale 2,103 2,056
Total loans $62,457 $63,309
Key uses interest rate swaps to manage interest rate risk; these swaps modify the repricingand maturity characteristics of certain loans. For more information about such swaps atDecember 31, 2002, see Note 20 (“Derivatives and Hedging Activities”), which begins onpage 84.
Commercial and consumer lease financing receivables in the preceding
table primarily are direct financing leases, but also include leveraged
leases and operating leases. The composition of the net investment in
direct financing leases is as follows:
December 31,in millions 2002 2001
Direct financing lease receivable $5,384 $6,785 Unearned income (639) (888)Unguaranteed residual value 637 716 Deferred fees and costs 38 38
Net investment in direct financing leases $5,420 $6,651
Minimum future lease payments to be received at December 31, 2002, are as follows: 2003 — $1.0 billion; 2004 — $980 million; 2005 — $1.1 billion; 2006 — $793 million; 2007 — $749 million; and all subsequent years — $807 million.
Changes in the allowance for loan losses are summarized as follows:
Year ended December 31,in millions 2002 2001 2000
Balance at beginning of year $1,677 $1,001 $ 930 Charge-offs (905) (784) (522) Recoveries 125 111 108
Net charge-offs (780) (673) (414) Provision for loan losses 553 1,350 490 Allowance related to loans
acquired (sold), net 2 (1) (5)
Balance at end of year $1,452 $1,677 $1,001
7. LOANS

NOTES TO CONSOLIDATED FINANCIAL STATEMENTS KEYCORP AND SUBSIDIARIES
70 NEXT PAGEPREVIOUS PAGE SEARCH BACK TO CONTENTS
8. LOAN SECURITIZATIONS AND VARIABLE INTEREST ENTITIES
RETAINED INTERESTS IN LOAN SECURITIZATIONS
Key sells certain types of loans in securitizations. A securitization
involves the sale of a pool of loan receivables to investors through
either a public or private issuance of asset-backed securities. Generally,
the assets are transferred to a trust that sells interests in the form of
certificates of ownership. In some cases, Key retains an interest in the
securitized loans. Certain assumptions and estimates are used to determine
the fair value allocated to these retained interests at the date of transfer
and at subsequent measurement dates. These assumptions and estimates
include loan repayment rates, projected charge-offs and discount rates
commensurate with the risks involved. Additional information pertaining
to Key’s residual interests is disclosed in Note 1 (“Summary of Significant
Accounting Policies”) under the heading “Loan Securitizations” on
page 59.
Key securitized and sold $792 million of education loans (including
accrued interest) in 2002 and $523 million in 2001. The securitizations
resulted in an aggregate gain of $7 million in 2002 (from gross cash
proceeds of $799 million) and $11 million in 2001 (from gross cash
proceeds of $534 million). In these transactions, Key retained residual
interests in the form of servicing assets and interest-only strips. During
2002, Key retained servicing assets of $6 million and interest-only
strips of $26 million. During 2001, Key retained servicing assets of $4
million and interest-only strips of $16 million.
Primary economic assumptions used to measure the fair value of Key’s
retained interests and the sensitivity of the current fair value of residual
cash flows to immediate adverse changes in those assumptions are
as follows:
December 31, 2002 Education Home Equity Automobiledollars in millions Loans Loans Loans
Carrying amount (fair value) of retained interests $209 $76 $8Weighted-average life (years) 1.1 — 5.3 1.9 — 2.8 .5
PREPAYMENT SPEED ASSUMPTIONS (ANNUAL RATE) 7.99% — 16.32% 23.89% — 27.10% 1.59%Impact on fair value of 1% CPR (education and home equity)
and .10% ABS (automobile) adverse change $ (6) $(1) —Impact on fair value of 2% CPR (education and home equity)
and .20% ABS (automobile) adverse change (11) (2) —
EXPECTED CREDIT LOSSES (STATIC RATE) .01% — 1.58% 1.27% — 2.59% 5.51%Impact on fair value of .10% (education)
and .25% (home equity and automobile) adverse change $ (7) $(5) $(1)Impact on fair value of .20% (education)
and .50% (home equity and automobile) adverse change (14) (9) (2)
RESIDUAL CASH FLOWS DISCOUNT RATE (ANNUAL RATE) 8.50% — 12.00% 7.50% — 10.75% 9.00%Impact on fair value of 1% adverse change $ (6) $(1) —Impact on fair value of 2% adverse change (12) (2) —
EXPECTED STATIC DEFAULT (STATIC RATE) 10.46% — 16.04% N/A N/AImpact on fair value of 1% (education loans) adverse change $ (8) N/A N/AImpact on fair value of 2% (education loans) adverse change (16) N/A N/A
VARIABLE RETURNS TO TRANSFEREES (a) (b) (c)
These sensitivities are hypothetical and should be relied upon with caution. Sensitivity analysis for each asset type is based on the nature of the asset, the seasoning (i.e., age and paymenthistory) of the portfolio and the results experienced. Changes in fair value based on a 1% variation in assumptions generally cannot be extrapolated because the relationship of the change inassumption to the change in fair value may not be linear. Also, the effect of a variation in a particular assumption on the fair value of the retained interest is calculated without changing any otherassumption; in reality, changes in one factor may cause changes in another. For example, increases in market interest rates may result in lower prepayments and increased credit losses, whichmight magnify or counteract the sensitivities.
a Forward London Interbank Offered Rate (known as “LIBOR”) plus contractual spread over LIBOR ranging from .06% to .75%, or Treasury plus contractual spread over Treasury ranging from .65% to 1.00% or fixed rate yield.
b Forward LIBOR plus contractual spread over LIBOR ranging from .23% to .40%, or Treasury plus contractual spread over Treasury ranging from 2.40% to 2.95% or fixed rate yield.
c Fixed rate yield.
CPR = Constant Prepayment Rate, ABS = Absolute Prepayment Speed, N/A = Not Applicable

NOTES TO CONSOLIDATED FINANCIAL STATEMENTS KEYCORP AND SUBSIDIARIES
71 NEXT PAGEPREVIOUS PAGE SEARCH BACK TO CONTENTS
Information about the components of Key’s managed loans (i.e., loans held in portfolio and securitized loans), as well as related delinquencies and
net credit losses is as follows:
December 31,
Loans Past Due Net Credit LossesLoan Principal 60 Days or More During the Year
in millions 2002 2001 2002 2001 2002 2001
Education loans $ 6,336 $ 5,964 $166 $161 $ 19 $ 13Home equity loans 14,242 11,925 237 200 58 104 Automobile loans 2,235 2,628 24 41 84 106
Total loans managed 22,813 20,517 427 402 161 223
Less:Loans securitized 5,016 5,148 209 238 16 20 Loans held for sale or securitization 1,812 1,688 — — — —
Loans held in portfolio $15,985 $13,681 $218 $164 $145 $203
VARIABLE INTEREST ENTITIES
A variable interest entity (“VIE”) is a partnership, limited liability
company, trust or other legal entity that is not controlled through a voting
equity interest and/or does not have enough equity at risk invested to
finance its activities without subordinated financial support from another
party. FASB Interpretation No. 46, “Consolidation of Variable Interest
Entities,” addresses the consolidation of VIEs. This interpretation is
summarized in Note 1 (“Summary of Significant Accounting Policies”)
under the heading “Accounting Pronouncements Pending Adoption” on
page 62. Under Interpretation No. 46, VIEs are consolidated by the party
(the primary beneficiary) who is exposed to the majority of the VIE’s
expected losses and/or residual returns.
The securitization trusts referred to in the “Retained Interests in Loan
Securitizations” section of this note are VIEs; however, as qualifying
special purpose entities under SFAS 140, “Accounting for Transfers and
Servicing of Financial Assets and Extinguishments of Liabilities,” they
are exempt from consolidation under Interpretation No. 46.
As required by Interpretation No. 46, Key is assessing its relationships
and arrangements with legal entities formed prior to February 1, 2003,
to identify VIEs in which Key holds a significant variable interest and to
determine if Key is the primary beneficiary of these entities and should
therefore consolidate them.
Based on the review performed to date, it is reasonably possible that Key
will have to consolidate (if primary beneficiary) or only disclose significant
variable interests in the following entities, as currently structured, when
Interpretation No. 46 becomes effective on July 1, 2003.
Commercial paper conduits. Key, among others, refers third party
assets and borrowers and provides liquidity and credit enhancement to
an unconsolidated asset-backed commercial paper conduit. The conduit
had assets of $423 million at December 31, 2002.
In addition, Key holds a subordinated note in and provides referral
services and liquidity to one program, also unconsolidated, within another
asset-backed commercial paper conduit. This program had assets of $79
million at December 31, 2002. These assets are expected to decrease over
time since this conduit program is in the process of being liquidated.
At December 31, 2002, Key’s maximum exposure to loss from its
interests in these conduits totaled $79 million, which represents a $68
million committed credit enhancement facility and an $11 million
subordinated note.
Additional information pertaining to Key’s involvement with conduits
is summarized in Note 1 (“Summary of Significant Accounting Policies”)
under the heading “Basis of Presentation” on page 57 and in Note 19
(“Commitments, Contingent Liabilities and Guarantees”) under the
heading “Guarantees” on page 83 and the heading “Other Off-Balance
Sheet Risk” on page 84.
Low-Income Housing Tax Credit (“LIHTC”) guaranteed funds. Key
Affordable Housing Corporation (“KAHC”) forms unconsolidated
limited partnerships (funds) which invest in LIHTC projects. Interests
in these funds are offered to qualified investors, who pay a fee to
KAHC for a guaranteed return. Key also earns syndication and asset
management fees from these funds. At December 31, 2002, the
guaranteed funds had unamortized equity of $676 million. Additional
information on the return guaranty agreement with LIHTC investors is
summarized in Note 19 (“Commitments, Contingent Liabilities and
Guarantees”) under the heading “Guarantees” on page 83.
Key’s maximum exposure to loss from its relationships with the above
entities was $851 million at December 31, 2002, which represents
undiscounted future payments due to investors for the return on and of
their investments. KAHC has established a reserve in the amount of $35
million at December 31, 2002, which management believes will be
sufficient to absorb future estimated losses under the guarantees.
LIHTC investments. Key makes investments directly in LIHTC projects
through the Retail Banking line of business. As a limited partner in these
unconsolidated projects, Key is allocated tax credits and deductions
associated with the underlying properties. At December 31, 2002,
Key’s investments in these projects totaled $298 million. Key has not yet
completed its analysis of these entities under Interpretation No. 46.

December 31,in millions 2002 2001
Impaired loans $610 $661 Other nonaccrual loans 333 249
Total nonperforming loans 943 910 Other real estate owned (OREO) 48 38 Allowance for OREO losses (3) (1)
OREO, net of allowance 45 37 Other nonperforming assets 5 —
Total nonperforming assets $993 $947
NOTES TO CONSOLIDATED FINANCIAL STATEMENTS KEYCORP AND SUBSIDIARIES
72 NEXT PAGEPREVIOUS PAGE SEARCH BACK TO CONTENTS
Year ended December 31,in millions 2002 2001 2000
Interest income receivable under original terms $50 $52 $62
Less: Interest income recorded during the year 20 21 25
Net reduction to interest income $30 $31 $37
Impaired loans, which account for the largest portion of Key’s
nonperforming assets, totaled $610 million at December 31, 2002,
compared with $661 million at December 31, 2001. Impaired loans
averaged $653 million for 2002 and $535 million for 2001.
Key’s nonperforming assets were as follows:
Key does not perform a specific impairment valuation for smaller-
balance, homogeneous, nonaccrual loans (shown in the preceding table
as “Other nonaccrual loans”). These typically are consumer loans,
including residential mortgages, home equity loans and various types of
installment loans. Management applies historical loss experience rates
to these loans, adjusted to reflect emerging credit trends and other
factors, and then allocates a portion of the allowance for loan losses to
each loan type.
The following table shows the amount by which loans classified as
nonperforming at December 31 reduced Key’s expected interest income.
9. IMPAIRED LOANS AND OTHER NONPERFORMING ASSETS
At December 31, 2002, Key did not have any significant commitments to
lend additional funds to borrowers with loans on nonperforming status.
Key evaluates most impaired loans individually using the process
described in Note 1 (“Summary of Significant Accounting Policies”)
under the heading “Allowance for Loan Losses” on page 58. At
December 31, 2002, Key had $377 million of impaired loans with a
specifically allocated allowance for loan losses of $179 million, and $233
million of impaired loans that were carried at their estimated fair value
without a specifically allocated allowance. At December 31, 2001,
impaired loans included $417 million of loans with a specifically
allocated allowance of $180 million, and $244 million that were carried
at their estimated fair value.
Effective January 1, 2002, Key adopted SFAS No. 142, “Goodwill and
Other Intangible Assets,” which eliminates the amortization of goodwill
and intangible assets deemed to have indefinite lives. Key’s total
amortization expense was $11 million for 2002, $245 million for
2001 and $101 million for 2000. Estimated amortization expense for
intangible assets subject to amortization for each of the next five
years is as follows: 2003 __ $12 million; 2004 __ $8 million; 2005 __ $3
million; 2006 __ $3 million; and 2007 __ $3 million.
10. GOODWILL AND OTHER INTANGIBLE ASSETS
Commercial Real Estate Investments. Through the National Commercial
Real Estate line of business, Key provides real estate financing for new
construction, acquisition and rehabilitation projects. In certain of these
unconsolidated projects, Key has provided or committed funds through
limited partnership interests, mezzanine investments or standby letters
of credit. At December 31, 2002, these investments and facilities totaled
$131 million. Key has not yet completed its analysis of these investments
under Interpretation No. 46.
Key is continuing to evaluate its relationships with, and investments in,
these entities as well as others to assess whether it is reasonably possible
that consolidation or disclosure of significant interests in such entities
will be necessary when the guidance provided under Interpretation
No. 46 becomes effective for existing VIEs on July 1, 2003.

NOTES TO CONSOLIDATED FINANCIAL STATEMENTS KEYCORP AND SUBSIDIARIES
73 NEXT PAGEPREVIOUS PAGE SEARCH BACK TO CONTENTS
The calculation of Key’s net income and earnings per common share, excluding goodwill amortization, is presented below.
Year ended December 31,dollars in millions, except per share amounts 2002 2001 2000
EARNINGSNet income $976 $132 $1,002 Add: Goodwill amortization — 82a 86
Adjusted net income $976 $214 $1,088
WEIGHTED AVERAGE COMMON SHARESWeighted average common shares outstanding (000) 425,451 424,275 432,617 Weighted average common shares and potential
common shares outstanding (000) 430,703 429,573 435,573
EARNINGS PER COMMON SHARENet income per common share $2.29 $.31 $2.32 Add: Goodwill amortization — .19a .20
Adjusted net income per common share $2.29 $.50 $2.52
Adjusted net income per common share — assuming dilution $2.27 $.50 $2.50
a Goodwill amortization for 2001 excludes a $150 million write-down (equivalent to $.35 per both basic and diluted common share) associated with Key’s decision to downsize the automobilefinance business.
During 2002, core deposit intangibles with a fair value of $13 million
were acquired in conjunction with the purchase of Union Bankshares and
are being amortized using the straight-line method over seven years.
Additional information pertaining to this acquisition is discussed in
Note 3 (“Acquisitions and Divestitures”) on page 64.
During 2002, Key performed transitional impairment testing of
goodwill at January 1, 2002, that was completed during the first
quarter and annual impairment testing of goodwill at October 1,
2002, that was completed during the fourth quarter. Both tests
determined that no impairment of Key’s goodwill existed at either of
those dates.
Additional information pertaining to the new accounting guidance is
included in Note 1 (“Summary of Significant Accounting Policies”)
under the heading “Goodwill and Other Intangible Assets” on page 59.
The following table shows the gross carrying amount and the accumulated amortization of intangible assets that are subject to amortization.
December 31, 2002 2001
Gross Carrying Accumulated Gross Carrying Accumulatedin millions Amount Amortization Amount Amortization
Intangible assets subject to amortization:Core deposit intangibles $227 $197 $215 $187 Other intangible assets 11 6 9 6
Total $238 $203 $224 $193
Changes in the carrying amount of goodwill by major business group are as follows:
Key Consumer Key Corporate Key Capitalin millions Banking Finance Partners Total
BALANCE AT DECEMBER 31, 2001 $446 $202 $455 $1,103 Additional goodwill:
Union Bankshares acquisition 34 — — 34 Conning Asset Management acquisition — 5 — 5
BALANCE AT DECEMBER 31, 2002 $480 $207 $455 $1,142

NOTES TO CONSOLIDATED FINANCIAL STATEMENTS KEYCORP AND SUBSIDIARIES
74 NEXT PAGEPREVIOUS PAGE SEARCH BACK TO CONTENTS
dollars in millions 2002 2001 2000
FEDERAL FUNDS PURCHASEDBalance at year end $2,147 $2,591 $3,267Average during the year 3,984 3,575 2,991Maximum month-end balance 5,983 5,034 4,693Weighted average rate during the year 1.71% 4.00% 6.42%Weighted average rate at December 31 1.19 1.72 6.68
SECURITIES SOLD UNDER REPURCHASE AGREEMENTSBalance at year end $1,715 $1,144 $1,669Average during the year 1,543 1,622 1,940Maximum month-end balance 2,313 1,807 2,447Weighted average rate during the year 1.49% 3.39% 4.90%Weighted average rate at December 31 1.26 1.80 6.01
SHORT-TERM BANK NOTESBalance at year end $ 575 $3,748 $4,345Average during the year 1,700 4,649 5,021Maximum month-end balance 3,048 6,098 6,834Weighted average rate during the year 1.94% 5.01% 7.35%Weighted average rate at December 31 2.05 2.16 8.28
OTHER SHORT-TERM BORROWINGSBalance at year end $2,248 $1,801 $2,612Average during the year 1,243 2,179 2,100Maximum month-end balance 2,248 2,841 2,326Weighted average rate during the year 1.29% 2.39% 3.10%Weighted average rate at December 31 .83 2.18 3.31
Key uses interest rate swaps and caps, which modify the repricing and maturity characteristics of certain short-term borrowings, to manage interest rate risk. For more information about suchfinancial instruments at December 31, 2002, see Note 20 (“Derivatives and Hedging Activities”),which begins on page 84.
11. SHORT-TERM BORROWINGS
Selected financial information pertaining to the components of Key’s short-term borrowings is as follows:
Key has several programs that support short-term financing needs.
Bank note program. This program provides for the issuance of up to
$20.0 billion [$19.0 billion by KeyBank National Association (“KBNA”)
and $1.0 billion by Key Bank USA, National Association (“Key Bank
USA”)] of bank notes with original maturities ranging from 30 days to
30 years. At December 31, 2002, $18.1 billion was available for future
issuance under this program.
Euro note program. KeyCorp, KBNA and Key Bank USA may issue both
long- and short-term debt of up to $10.0 billion to non-U.S. investors.
This facility had $4.2 billion available for future issuance as of December
31, 2002.
KeyCorp medium-term note program and other securities. KeyCorp has
registered with the Securities and Exchange Commission to provide for
the issuance of up to $2.2 billion of securities, which could include long-
or short-term debt, or equity securities. Of the amount registered, $1.0
billion has been allocated for the issuance of medium-term notes. At
December 31, 2002, unused capacity under KeyCorp’s universal shelf
registration statement totaled $1.8 billion, including $575 million
allocated for the issuance of medium-term notes.
Commercial paper and revolving credit. KeyCorp’s commercial paper
program and a revolving credit agreement provide funding availability
of up to $500 million and $400 million, respectively. There were no
borrowings outstanding under the commercial paper program at
December 31, 2002. Borrowings outstanding under the commercial
paper program totaled $25 million at December 31, 2001. There were
no borrowings outstanding under the revolving credit agreement at
December 31, 2002 and 2001. The revolving credit agreement serves as
a back-up facility for the commercial paper program.
Line of credit. KBNA has overnight borrowing capacity at the Federal
Reserve Bank. At December 31, 2002, this capacity was approximately
$17.5 billion and was secured by approximately $22.5 billion of loans,
primarily those in the commercial portfolio. There were no borrowings
outstanding under this facility at December 31, 2002 or 2001.

NOTES TO CONSOLIDATED FINANCIAL STATEMENTS KEYCORP AND SUBSIDIARIES
75 NEXT PAGEPREVIOUS PAGE SEARCH BACK TO CONTENTS
December 31,dollars in millions 2002 2001
Senior medium-term notes due through 2005a $ 1,445 $ 1,286 Subordinated medium-term notes
due through 2003a 45 85 Senior euro medium-term notes
due through 2003b 50 50 7.50% Subordinated notes due 2006c 250 250 6.75% Subordinated notes due 2006c 200 200 8.125% Subordinated notes due 2002c — 200 8.00% Subordinated notes due 2004c 125 125 6.625% Subordinated notes due 2017c 24 — All other long-term debti 36 16
Total parent companyj 2,175 2,212
Senior medium-term bank notes due through 2039d 3,854 4,525
Senior euro medium-term bank notes due through 2007e 4,792 3,989
6.50% Subordinated remarketable notes due 2027f 311 311
6.95% Subordinated notes due 2028f 300 300 7.125% Subordinated notes due 2006f 250 250 7.25% Subordinated notes due 2005f 200 200 6.75% Subordinated notes due 2003f 200 200 7.50% Subordinated notes due 2008f 165 165 7.00% Subordinated notes due 2011f 607 506 7.30% Subordinated notes due 2011f 107 107 7.85% Subordinated notes due 2002f — 93 7.55% Subordinated notes due 2006f 75 75 7.375% Subordinated notes due 2008f 70 70 5.70% Subordinated notes due 2012f 300 — 5.70% Subordinated notes due 2017f 200 — Lease financing debt due through 2006g 435 519 Federal Home Loan Bank advances
due through 2033h 1,018 762 All other long-term debti 546 270
Total subsidiaries 13,430 12,342
Total long-term debt $15,605 $14,554
Scheduled principal payments on long-term debt over the next five years
are as follows:
in millions Parent Subsidiaries Total
2003 $773 $3,657 $4,430 2004 490 3,112 3,6022005 403 1,909 2,3122006 450 785 1,235 2007 — 1,441 1,441
The components of Key’s long-term debt, presented net of unamortized
discount where applicable, were as follows:
Key uses interest rate swaps and caps, which modify the repricing and maturitycharacteristics of certain long-term debt, to manage interest rate risk. For more informationabout such financial instruments at December 31, 2002, see Note 20 (“Derivatives andHedging Activities”), which begins on page 84.a At December 31, 2002, the senior medium-term notes had a weighted average interest
rate of 2.54%, and the subordinated medium-term notes had a weighted average interestrate of 7.30%. At December 31, 2001, the senior medium-term notes had a weightedaverage interest rate of 2.51%, and the subordinated medium-term notes had a weightedaverage interest rate of 7.42%. These notes had a combination of fixed and floatinginterest rates.
b Senior euro medium-term notes had a weighted average interest rate of 1.62% atDecember 31, 2002, and 2.33% at December 31, 2001. These notes had a floatinginterest rate based on the three-month LIBOR.
c These notes may not be redeemed or prepaid prior to maturity.d Senior medium-term bank notes of subsidiaries had weighted average interest rates
of 2.59% at December 31, 2002, and 2.45% at December 31, 2001. These notes had a combination of fixed and floating interest rates.
e Senior euro medium-term notes had weighted average interest rates of 1.79% atDecember 31, 2002, and 2.58% at December 31, 2001. These notes, which areobligations of KBNA, had a combination of fixed interest rates and floating interest rates based on LIBOR.
f These notes are all obligations of KBNA, with the exception of the 7.55% notes, which are obligations of Key Bank USA. None of the subordinated notes may be redeemed priorto their maturity dates.
g Lease financing debt had weighted average interest rates of 7.14% at December 31,2002, and 7.41% at December 31, 2001. This category of debt consists of primarilynonrecourse debt collateralized by leased equipment under operating, direct financingand sales type leases.
h Long-term advances from the Federal Home Loan Bank had weighted average interestrates of 1.71% at December 31, 2002, and 2.19% at December 31, 2001. Theseadvances, which had a combination of fixed and floating interest rates, were secured byreal estate loans and securities totaling $1.4 billion at December 31, 2002, and $1.1 billionat December 31, 2001.
i Other long-term debt, consisting of industrial revenue bonds, capital lease obligations, and various secured and unsecured obligations of corporate subsidiaries, had weightedaverage interest rates of 6.29% at December 31, 2002, and 6.72% at December 31, 2001.
j At December 31, 2002, unused capacity under KeyCorp’s universal shelf registrationstatement filed with the Securities and Exchange Commission totaled $1.8 billion,including $575 million which was allocated for the issuance of medium-term notes.
12. LONG-TERM DEBT
KeyCorp has six fully-consolidated subsidiary business trusts that have
issued corporation-obligated mandatorily redeemable preferred capital
securities (“capital securities”). These securities are carried as liabilities
on Key’s balance sheet. They provide an attractive source of funds
since they constitute Tier I capital for regulatory reporting purposes, but
have the same tax advantages as debt for federal income tax purposes.
As guarantor, KeyCorp unconditionally guarantees payment of:
• required distributions on the capital securities;
• the redemption price when a capital security is redeemed; and
• amounts due if a trust is liquidated or terminated.
KeyCorp owns the outstanding common stock of each of the trusts. The
trusts used the proceeds from the issuance of their capital securities and
common stock to buy debentures issued by their respective parent
company: KeyCorp in the case of the Key trusts, and Union Bankshares,
Ltd. in the case of the Union trust. These debentures are the trusts’ only
assets; the interest payments from the debentures finance the distributions
paid on the capital securities. Key’s financial statements do not reflect the
debentures or the related effects on the income statement because they
are eliminated in consolidation.
13. CAPITAL SECURITIES

NOTES TO CONSOLIDATED FINANCIAL STATEMENTS KEYCORP AND SUBSIDIARIES
76 NEXT PAGEPREVIOUS PAGE SEARCH BACK TO CONTENTS
The capital securities, common stock and related debentures are summarized as follows:
Principal Interest Rate MaturityCapital Amount of of Capital of Capital
Securities, Common Debentures, Securities and Securities anddollars in millions Net of Discounta Stock Net of Discountb Debenturesc Debentures
DECEMBER 31, 2002KeyCorp Institutional Capital A $ 413 $11 $ 361 7.826% 2026KeyCorp Institutional Capital B 177 4 154 8.250 2026KeyCorp Capital I 230 8 237 2.546 2028KeyCorp Capital II 182 8 165 6.875 2029KeyCorp Capital III 248 8 208 7.750 2029Union Bankshares Capital Trust Id 10 1 11 9.000 2028
Total $1,260 $40 $1,136 6.779% —
DECEMBER 31, 2001 $1,288 $39 $1,282 6.824% —
a The capital securities must be redeemed when the related debentures mature, or earlier if provided in the governing indenture. Each issue of capital securities carries an interest rate identicalto that of the related debenture. The capital securities constitute minority interests in the equity accounts of KeyCorp’s consolidated subsidiaries and, therefore, qualify as Tier 1 capital underFederal Reserve Board guidelines. Included in certain capital securities at December 31, 2002 and 2001, are basis adjustments of $164 million and $45 million, respectively, related to fair valuehedges. See Note 20 (“Derivatives and Hedging Activities”), which begins on page 84, for an explanation of fair value hedges.
b KeyCorp has the right to redeem its debentures: (i) in whole or in part, on or after December 1, 2006 (for debentures owned by Capital A), December 15, 2006 (for debentures owned by Capital B),July 1, 2008 (for debentures owned by Capital I), March 18, 1999 (for debentures owned by Capital II), July 16, 1999 (for debentures owned by Capital III), and December 17, 2003 (for debenturesowned by Union Bankshares Capital Trust I); and (ii) in whole at any time within 90 days after and during the continuation of a “tax event” or a “capital treatment event” (as defined in the applicableoffering circular). If the debentures purchased by Capital A or Capital B are redeemed before they mature, the redemption price will be the principal amount, plus a premium, plus any accruedbut unpaid interest. If the debentures purchased by Capital I or Union Bankshares Capital Trust I are redeemed before they mature, the redemption price will be the principal amount, plus anyaccrued but unpaid interest. If the debentures purchased by Capital II or Capital III are redeemed before they mature, the redemption price will be the greater of: (a) the principal amount, plusany accrued but unpaid interest or (b) the sum of the present values of principal and interest payments discounted at the Treasury Rate (as defined in the applicable offering circular), plus 20basis points (25 basis points for Capital III), plus any accrued but unpaid interest. When debentures are redeemed in response to tax or capital treatment events, the redemption price generallyis slightly more favorable to Key.
c The interest rates for Capital A, Capital B, Capital II, Capital III and Union Bankshares Capital Trust I are fixed. Capital I has a floating interest rate equal to three-month LIBOR plus 74 basispoints; it reprices quarterly. The rates shown as the total at December 31, 2002 and 2001, are weighted average rates.
d On December 12, 2002, KeyCorp acquired Union Bankshares, Ltd., the owner of all the common stock of Union Bankshares Capital Trust I and the guarantor of all the trust’s obligations underits capital securities. On January 16, 2003, Union Bankshares, Ltd. merged into KeyCorp. As a result of this merger, KeyCorp became the owner of the common stock of the trust and theguarantor of all the trust’s obligations under its capital securities.
SHAREHOLDER RIGHTS PLAN
KeyCorp has a shareholder rights plan, which was first adopted in
1989 and has since been amended. Under the plan, each shareholder
received one Right — representing the right to purchase a common share
for $82.50 — for each KeyCorp common share owned. All of the
Rights expire on May 14, 2007, but KeyCorp may redeem Rights
earlier for $.005 apiece, subject to certain limitations.
Rights will become exercisable if a person or group acquires 15% or more
of KeyCorp’s outstanding shares. Until that time, the Rights will trade with
the common shares; any transfer of a common share will also constitute
a transfer of the associated Right. If the Rights become exercisable, they
will begin to trade apart from the common shares. If one of a number of
“flip-in events” occurs, each Right will entitle the holder to purchase a
KeyCorp common share for $1.00 (the par value per share), and the Rights
held by a 15% or more shareholder will become void.
CAPITAL ADEQUACY
KeyCorp and its banking subsidiaries must meet specific capital
requirements imposed by federal banking regulators. Sanctions for
failure to meet applicable capital requirements may include regulatory
enforcement actions that restrict dividend payments, require the
adoption of remedial measures to increase capital, terminate Federal
Deposit Insurance Corporation (“FDIC”) deposit insurance, and
mandate the appointment of a conservator or receiver in severe cases.
As of December 31, 2002, KeyCorp and its bank subsidiaries met all
capital requirements.
Federal bank regulators apply certain capital ratios to assign FDIC-
insured depository institutions to one of five categories: “well
capitalized,” “adequately capitalized,” “undercapitalized,” “significantly
undercapitalized” and “critically undercapitalized.” At December 31,
2002 and 2001, the most recent regulatory notification classified each
of KeyCorp’s subsidiary banks as “well capitalized.” Management does
not believe there have been any changes in condition or events since those
notifications that would cause the banks’ classifications to change.
Unlike bank subsidiaries, bank holding companies are not classified by
capital adequacy. However, Key satisfied the criteria for a “well
capitalized” institution at December 31, 2002 and 2001. The FDIC-
defined capital categories serve a limited regulatory function and may not
accurately represent the overall financial condition or prospects of Key
or its affiliates.
14. SHAREHOLDERS’ EQUITY
During 2002, the subsidiary business trusts repurchased an aggregate
$159 million of their outstanding capital securities and KeyCorp
repurchased a like amount of the related debentures. Management
intends to replace the capital securities at some future date with capital
securities that will yield a lower cost.

NOTES TO CONSOLIDATED FINANCIAL STATEMENTS KEYCORP AND SUBSIDIARIES
77 NEXT PAGEPREVIOUS PAGE SEARCH BACK TO CONTENTS
To Qualify as To Meet Minimum Well CapitalizedCapital Adequacy Under Federal Deposit
Actual Requirements Insurance Act
dollars in millions Amount Ratio Amount Ratio Amount Ratio
December 31, 2002TOTAL CAPITAL TO NET RISK-WEIGHTED ASSETSKey $10,257 12.51% $6,558 8.00% N/A N/AKBNA 8,248 11.19 5,899 8.00 $7,374 10.00%Key Bank USA 837 12.04 556 8.00 695 10.00
TIER 1 CAPITAL TO NET RISK-WEIGHTED ASSETSKey $6,632 8.09% $3,279 4.00% N/A N/AKBNA 5,054 6.85 2,949 4.00 $4,424 6.00%Key Bank USA 713 10.25 278 4.00 417 6.00
TIER 1 CAPITAL TO AVERAGE ASSETSKey $6,632 8.15% $2,440 3.00% N/A N/AKBNA 5,054 6.93 2,915 4.00 $3,644 5.00%Key Bank USA 713 8.50 335 4.00 419 5.00
December 31, 2001TOTAL CAPITAL TO NET RISK-WEIGHTED ASSETSKey $9,548 11.41% $6,696 8.00% N/A N/AKBNA 7,970 10.63 5,993 8.00 $7,492 10.00%Key Bank USA 746 11.48 520 8.00 650 10.00
TIER 1 CAPITAL TO NET RISK-WEIGHTED ASSETSKey $6,222 7.43% $3,348 4.00% N/A N/AKBNA 5,170 6.90 2,997 4.00 $4,495 6.00%Key Bank USA 618 9.51 260 4.00 390 6.00
TIER 1 CAPITAL TO AVERAGE ASSETSKey $6,222 7.65% $2,440 3.00% N/A N/AKBNA 5,170 7.13 2,897 4.00 $3,622 5.00%Key Bank USA 618 8.53 290 4.00 362 5.00
N/A = Not Applicable
Key’s compensation plans allow for the granting of stock options,
stock appreciation rights, limited stock appreciation rights, restricted
stock and performance shares to eligible employees and directors.
Under all of the option plans, exercise prices cannot be less than the fair
value of Key’s common stock on the grant date. Generally, options
become exercisable at the rate of 33% per year beginning one year from
their grant date and expire no later than 10 years from their grant date.
At December 31, 2002, KeyCorp had 1,680,959 common shares available
for future grant, compared with 3,569,750 at December 31, 2001.
15. STOCK OPTIONS
The following table presents Key’s, KBNA’s and Key Bank USA’s actual capital amounts and ratios, minimum capital amounts and ratios prescribed by
regulatory guidelines, and capital amounts and ratios required to qualify as “well capitalized” under the Federal Deposit Insurance Act.
DEFERRED COMPENSATION OBLIGATION
Key maintains various deferred compensation plans, under which
employees and directors can defer a portion of their compensation for
future distribution. All or a portion of such deferrals will be distributed
in the form of KeyCorp common shares. Effective December 31, 2002,
Key reclassified its $68 million obligation relating to the portion of
deferred compensation payable in KeyCorp common shares from “other
liabilities” to “capital surplus” in accordance with EITF 97-14,
“Accounting for Deferred Compensation Arrangements Where Amounts
Earned Are Held in a Rabbi Trust and Invested.” Among other things,
EITF 97-14, which became effective March 19, 1998, for deferrals
after that date, requires that the deferred compensation obligation to be
settled by the delivery of shares be classified in equity without any
subsequent expense recognition for changes in the market value of the
underlying shares. Key did not reclassify its obligation in prior years
because it was not material.

NOTES TO CONSOLIDATED FINANCIAL STATEMENTS KEYCORP AND SUBSIDIARIES
78 NEXT PAGEPREVIOUS PAGE SEARCH BACK TO CONTENTS
Information pertaining to Key’s method of accounting for employee stock
options, including pro forma disclosures of the net income and earnings
per share effect of stock options using the “fair value method,” are
included in Note 1 (“Summary of Significant Accounting Policies”)
under the heading “Employee Stock Options” on page 61.
The following table summarizes the range of exercise prices and other related information pertaining to Key’s stock options at December 31, 2002.
Options Outstanding Options Exercisable
Range of Weighted Weighted Average WeightedExercise Number of Average Price Remaining Options Average
Prices Options Per Option Life (Years) Exercisable Price
$8.94-$14.99 2,350,269 $14.14 1.7 2,350,269 $14.1415.00-19.99 5,655,710 17.55 5.5 2,175,367 17.2620.00-24.99 10,463,784 23.50 8.3 194,475 22.4425.00-29.99 9,760,542 27.52 7.5 2,202,805 26.1530.00-34.99 9,128,126 31.37 5.6 9,128,126 31.3735.00-50.00 317,500 43.48 5.8 317,500 43.48
Total 37,675,931 $25.14 6.6 16,368,542 $26.45
The following table summarizes activity, pricing and other information about Key’s stock options.
2002 2001
Weighted Average Weighted AverageOptions Price Per Option Options Price Per Option
Outstanding at beginning of year 34,246,323 $24.66 34,291,153 $23.72 Granted 7,918,780 24.85 7,377,680 28.02 Exercised 2,346,983 16.08 2,212,746 14.96 Lapsed or canceled 2,142,189 26.54 5,209,764 27.27
Outstanding at end of year 37,675,931 $25.14 34,246,323 $24.66
Exercisable at end of year 16,368,542 $26.45 19,501,856 $24.80
Weighted average fair value of optionsgranted during the year $3.95 $6.26
PENSION PLANS
Net periodic and total net pension cost (income) for all funded and
unfunded plans include the following components.
The curtailment gain in the above table resulted from Key’s competitiveness
initiative and related reduction in workforce.
Changes in the projected benefit obligation (“PBO”) related to Key’s
pension plans are summarized as follows:
Changes in the fair value of pension plan assets (“FVA”) are summarized
as follows:
Year ended December 31,in millions 2002 2001
PBO at beginning of year $787 $715Service cost 40 37Interest cost 54 53Actuarial losses 31 57Plan amendments 3 —Benefit payments (69) (75)
PBO at end of year $846 $787
Year ended December 31,in millions 2002 2001
FVA at beginning of year $ 875 $1,062Actual loss on plan assets (101) (121)Employer contributions 12 9Benefit payments (69) (75)
FVA at end of year $ 717 $ 875
16. EMPLOYEE BENEFITS
Year ended December 31,in millions 2002 2001 2000
Service cost of benefits earned $ 40 $ 37 $ 37 Interest cost on projected
benefit obligation 54 53 53 Expected return on plan assets (91) (95) (90)Amortization of unrecognized
net transition asset — (2) (5)Amortization of prior service cost — 1 2 Amortization of losses 3 1 1
Net periodic pension cost (income) 6 (5) (2)Curtailment gain — — (2)
Total net pension cost (income) $ 6 $ (5) $ (4)
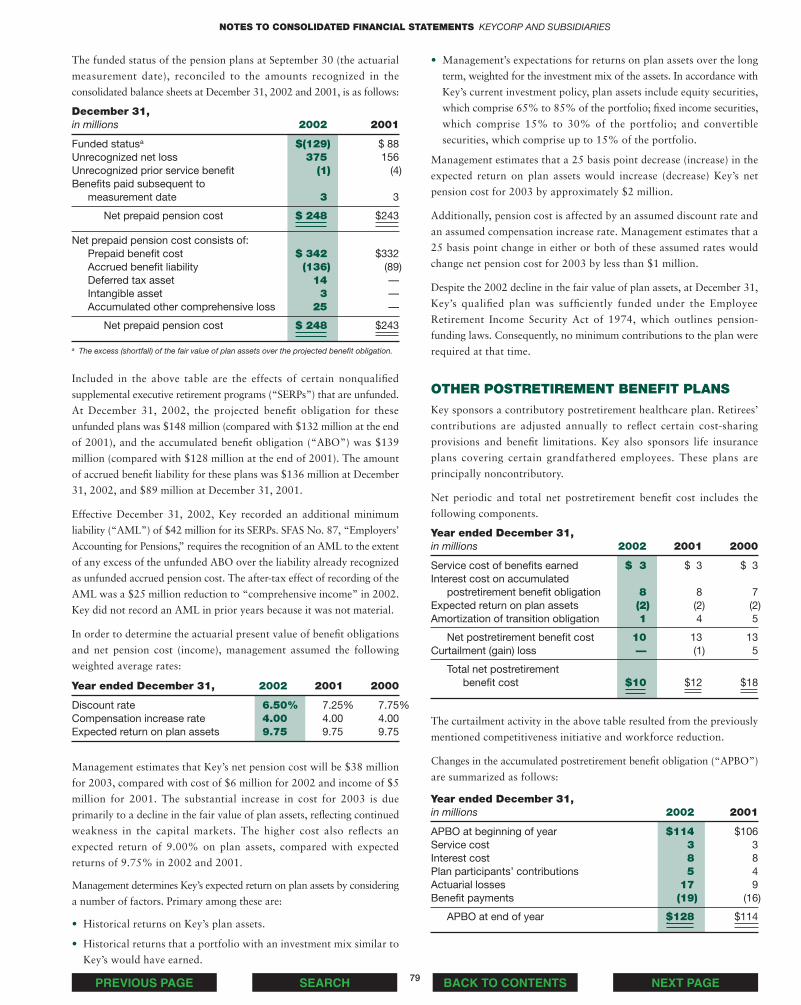
The funded status of the pension plans at September 30 (the actuarial
measurement date), reconciled to the amounts recognized in the
consolidated balance sheets at December 31, 2002 and 2001, is as follows:
Included in the above table are the effects of certain nonqualified
supplemental executive retirement programs (“SERPs”) that are unfunded.
At December 31, 2002, the projected benefit obligation for these
unfunded plans was $148 million (compared with $132 million at the end
of 2001), and the accumulated benefit obligation (“ABO”) was $139
million (compared with $128 million at the end of 2001). The amount
of accrued benefit liability for these plans was $136 million at December
31, 2002, and $89 million at December 31, 2001.
Effective December 31, 2002, Key recorded an additional minimum
liability (“AML”) of $42 million for its SERPs. SFAS No. 87, “Employers’
Accounting for Pensions,” requires the recognition of an AML to the extent
of any excess of the unfunded ABO over the liability already recognized
as unfunded accrued pension cost. The after-tax effect of recording of the
AML was a $25 million reduction to “comprehensive income” in 2002.
Key did not record an AML in prior years because it was not material.
In order to determine the actuarial present value of benefit obligations
and net pension cost (income), management assumed the following
weighted average rates:
Management estimates that Key’s net pension cost will be $38 million
for 2003, compared with cost of $6 million for 2002 and income of $5
million for 2001. The substantial increase in cost for 2003 is due
primarily to a decline in the fair value of plan assets, reflecting continued
weakness in the capital markets. The higher cost also reflects an
expected return of 9.00% on plan assets, compared with expected
returns of 9.75% in 2002 and 2001.
Management determines Key’s expected return on plan assets by considering
a number of factors. Primary among these are:
• Historical returns on Key’s plan assets.
• Historical returns that a portfolio with an investment mix similar to
Key’s would have earned.
• Management’s expectations for returns on plan assets over the long
term, weighted for the investment mix of the assets. In accordance with
Key’s current investment policy, plan assets include equity securities,
which comprise 65% to 85% of the portfolio; fixed income securities,
which comprise 15% to 30% of the portfolio; and convertible
securities, which comprise up to 15% of the portfolio.
Management estimates that a 25 basis point decrease (increase) in the
expected return on plan assets would increase (decrease) Key’s net
pension cost for 2003 by approximately $2 million.
Additionally, pension cost is affected by an assumed discount rate and
an assumed compensation increase rate. Management estimates that a
25 basis point change in either or both of these assumed rates would
change net pension cost for 2003 by less than $1 million.
Despite the 2002 decline in the fair value of plan assets, at December 31,
Key’s qualified plan was sufficiently funded under the Employee
Retirement Income Security Act of 1974, which outlines pension-
funding laws. Consequently, no minimum contributions to the plan were
required at that time.
OTHER POSTRETIREMENT BENEFIT PLANS
Key sponsors a contributory postretirement healthcare plan. Retirees’
contributions are adjusted annually to reflect certain cost-sharing
provisions and benefit limitations. Key also sponsors life insurance
plans covering certain grandfathered employees. These plans are
principally noncontributory.
Net periodic and total net postretirement benefit cost includes the
following components.
The curtailment activity in the above table resulted from the previously
mentioned competitiveness initiative and workforce reduction.
Changes in the accumulated postretirement benefit obligation (“APBO”)
are summarized as follows:
NOTES TO CONSOLIDATED FINANCIAL STATEMENTS KEYCORP AND SUBSIDIARIES
79 NEXT PAGEPREVIOUS PAGE SEARCH BACK TO CONTENTS
December 31,in millions 2002 2001
Funded statusa $(129) $ 88 Unrecognized net loss 375 156 Unrecognized prior service benefit (1) (4)Benefits paid subsequent to
measurement date 3 3
Net prepaid pension cost $ 248 $243
Net prepaid pension cost consists of:Prepaid benefit cost $ 342 $332 Accrued benefit liability (136) (89)Deferred tax asset 14 — Intangible asset 3 — Accumulated other comprehensive loss 25 —
Net prepaid pension cost $ 248 $243
a The excess (shortfall) of the fair value of plan assets over the projected benefit obligation.
Year ended December 31, 2002 2001 2000
Discount rate 6.50% 7.25% 7.75%Compensation increase rate 4.00 4.00 4.00Expected return on plan assets 9.75 9.75 9.75
Year ended December 31,in millions 2002 2001 2000
Service cost of benefits earned $ 3 $ 3 $ 3Interest cost on accumulated
postretirement benefit obligation 8 8 7 Expected return on plan assets (2) (2) (2)Amortization of transition obligation 1 4 5
Net postretirement benefit cost 10 13 13 Curtailment (gain) loss — (1) 5
Total net postretirement benefit cost $10 $12 $18
Year ended December 31,in millions 2002 2001
APBO at beginning of year $114 $106Service cost 3 3Interest cost 8 8 Plan participants’ contributions 5 4Actuarial losses 17 9 Benefit payments (19) (16)
APBO at end of year $128 $114.

NOTES TO CONSOLIDATED FINANCIAL STATEMENTS KEYCORP AND SUBSIDIARIES
Changes in the fair value of postretirement plan assets are summarized
as follows:
The funded status of the postretirement plans at September 30 (the
actuarial measurement date), reconciled to the amounts recognized in the
consolidated balance sheets at December 31, 2002 and 2001, is as
follows:
The assumed weighted average healthcare cost trend rate for 2003 is
10.0% for both Medicare-eligible retirees and non-Medicare-eligible
retirees. The rate is assumed to decrease gradually to 5.0% by the
year 2013 and remain constant thereafter. Increasing or decreasing the
assumed healthcare cost trend rate by one percentage point each future
year would not have a material impact on net postretirement benefit cost
or obligations since the postretirement plans have cost-sharing provisions
and benefit limitations.
To determine the accumulated postretirement benefit obligation and the
net postretirement benefit cost, management assumed the following
weighted average rates:
EMPLOYEE 401(K) SAVINGS PLAN
A substantial majority of Key’s employees are covered under a savings
plan that is qualified under Section 401(k) of the Internal Revenue
Code. Key’s plan permits employees to contribute from 1% to 16% (1%
to 10% prior to January 1, 2002) of eligible compensation, with up to
6% being eligible for matching contributions in the form of Key
common shares. The plan also permits Key to distribute a discretionary
profit-sharing component. Total expense associated with the plan was
$54 million in 2002, $42 million in 2001 and $51 million in 2000.
80 NEXT PAGEPREVIOUS PAGE SEARCH BACK TO CONTENTS
Year ended December 31,in millions 2002 2001
FVA at beginning of year $ 39 $ 38Employer contributions 18 19Plan participants’ contributions 5 4Benefit payments (19) (16)Actual loss on plan assets (4) (6)
FVA at end of year $ 39 $ 39
Year ended December 31,in millions 2002 2001
Funded statusa $(89) $(76)Unrecognized net loss 35 12 Unrecognized prior service cost 2 3 Unrecognized transition obligation 40 44 Contributions/benefits paid subsequent
to measurement date 10 9
Accrued postretirement benefit cost $ (2) $ (8)
a The excess of the accumulated postretirement benefit obligation over the fair value of plan assets.
Year ended December 31, 2002 2001 2000
Discount rate 6.50% 7.25% 7.75%Expected return on plan assets 5.73 5.71 5.71
Income taxes included in the consolidated statements of income are
summarized below. Key files a consolidated federal income tax return.
Significant components of Key’s deferred tax assets and liabilities are
as follows:
December 31,in millions 2002 2001
Provision for loan losses $ 477 $ 604 Restructuring charges 10 22Write-down of OREO 4 5 Other 268 294
Total deferred tax assets 759 925
Leasing income reported using the operating method for tax purposes 2,104 1,853
Net unrealized securities gains 57 18 Depreciation 12 —Other 388 606
Total deferred tax liabilities 2,561 2,477
Net deferred tax liabilities $1,802 $1,552
Year ended December 31,in millions 2002 2001 2000
Currently payable:Federal $150 $ 222 $147 State 31 19 33
181 241 180 Deferred:
Federal 150 (133) 307 State 5 (6) 28
155 (139) 335
Total income tax expensea $336 $ 102 $515
a Income tax expense (benefit) on securities transactions totaled $2 million in 2002, $14million in 2001 and ($10) million in 2000. Income tax expense in the above table excludesequity- and gross receipts-based taxes, which are assessed in lieu of an income tax incertain states in which Key operates. These taxes are recorded in noninterest expense onthe income statement and totaled $26 million in 2002, $29 million in 2001 and $33 millionin 2000.
17. INCOME TAXES

NOTES TO CONSOLIDATED FINANCIAL STATEMENTS KEYCORP AND SUBSIDIARIES
81 NEXT PAGEPREVIOUS PAGE SEARCH BACK TO CONTENTS
The following table shows how Key arrived at total income tax expense and the effective tax rate.
Year ended December 31, 2002 2001 2000
dollars in millions Amount Rate Amount Rate Amount Rate
Income before income taxes times 35% statutory federal tax rate $459 35.0% $ 90 35.0% $531 35.0%State income tax, net of federal tax benefit 23 1.8 9 3.4 40 2.6 Amortization of nondeductible intangibles — — 78 30.1 27 1.8 Tax-exempt interest income (13) (1.0) (15) (5.9) (18) (1.2)Corporate-owned life insurance income (39) (3.0) (42) (16.3) (40) (2.7)Tax credits (37) (2.8) (42) (16.1) (36) (2.4)Reduced tax rate on lease income (61) (4.7) (13) (5.1) — —Other 4 .3 37 14.3 11 .8
Total income tax expense $336 25.6% $102 39.4% $515 33.9%
In November 1999, KeyCorp instituted a competitiveness initiative to
improve Key’s operating efficiency and profitability.
In the first phase of the initiative, Key outsourced certain technology and
corporate support functions, consolidated sites in a number of businesses
and reduced the number of management layers. This phase was
completed in 2000. During 2002, Key completed the implementation of
all projects related to the second and final phase, which started during
the second half of 2000. This phase focused on:
• consolidating 22 business lines into 10 to simplify Key’s business
structure;
• streamlining and automating business operations and processes;
• standardizing product offerings and internal processes;
• consolidating operating facilities and service centers; and
• outsourcing certain noncore activities.
Management expected the initiative to reduce Key’s workforce by
approximately 4,000 positions. Those reductions were to occur at all
levels throughout the organization. During 2002, Key completed its
workforce reduction, bringing the total number of positions eliminated
in the initiative to nearly 4,100.
Changes in the components of the restructuring charge liability associated
with the actions taken are as follows:
18. RESTRUCTURING CHARGES
December 31, Restructuring Cash December 31,in millions 2001 Charges (Credits) Payments 2002
Severance $27 $(11) $13 $ 3 Site consolidations 33 3 9 27 Equipment and other 1 (1) — —
Total $61 $ (9) $22 $30
OBLIGATIONS UNDER NONCANCELABLE LEASES
Key is obligated under various noncancelable leases for land, buildings
and other property, consisting principally of data processing equipment.
Rental expense under all operating leases totaled $132 million in 2002,
$132 million in 2001 and $136 million in 2000. Minimum future
rental payments under noncancelable leases at December 31, 2002, are
as follows: 2003 — $125 million; 2004 — $113 million; 2005 — $99
million; 2006 — $91 million; 2007 — $79 million; all subsequent
years — $395 million.
COMMITMENTS TO EXTEND CREDIT OR FUNDING
Loan commitments generally help Key meet clients’ financing needs.
However, they also involve credit risk not reflected on Key’s balance
sheet. Key mitigates its exposure to credit risk with internal controls that
guide the way applications for credit are reviewed and approved, credit
limits are established and, when necessary, demands for collateral are made.
In particular, Key evaluates the credit-worthiness of each prospective
borrower on a case-by-case basis. Key does not have any significant
concentrations of credit risk related to commitments to extend credit.
Loan commitments provide for financing on predetermined terms as long
as the client continues to meet specified criteria. These agreements
generally carry variable rates of interest and have fixed expiration
dates or other termination clauses. In many cases, a client must pay a fee
to obtain a loan commitment from Key. Since a commitment may
expire without resulting in a loan, the total amount of outstanding
commitments may significantly exceed Key’s eventual cash outlay.
The table on page 82 shows the remaining contractual amount of each
class of commitments to extend credit or funding as of the date indicated.
19. COMMITMENTS, CONTINGENT LIABILITIES AND GUARANTEES
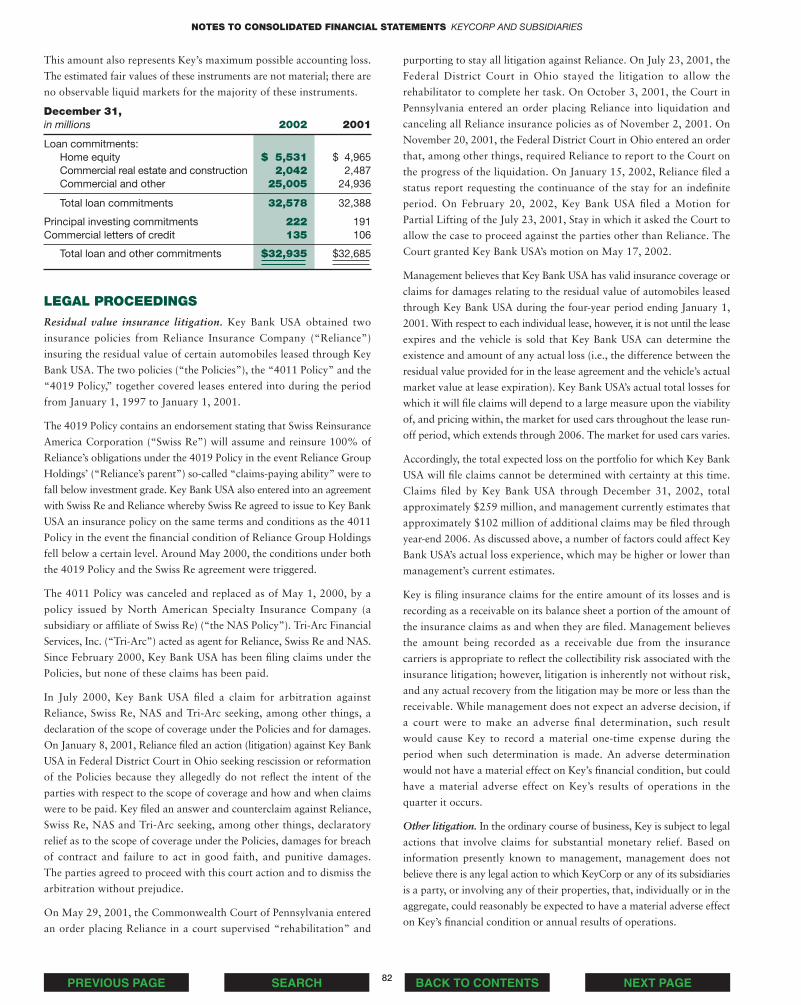
NOTES TO CONSOLIDATED FINANCIAL STATEMENTS KEYCORP AND SUBSIDIARIES
82 NEXT PAGEPREVIOUS PAGE SEARCH BACK TO CONTENTS
This amount also represents Key’s maximum possible accounting loss.
The estimated fair values of these instruments are not material; there are
no observable liquid markets for the majority of these instruments.
LEGAL PROCEEDINGS
Residual value insurance litigation. Key Bank USA obtained two
insurance policies from Reliance Insurance Company (“Reliance”)
insuring the residual value of certain automobiles leased through Key
Bank USA. The two policies (“the Policies”), the “4011 Policy” and the
“4019 Policy,” together covered leases entered into during the period
from January 1, 1997 to January 1, 2001.
The 4019 Policy contains an endorsement stating that Swiss Reinsurance
America Corporation (“Swiss Re”) will assume and reinsure 100% of
Reliance’s obligations under the 4019 Policy in the event Reliance Group
Holdings’ (“Reliance’s parent”) so-called “claims-paying ability” were to
fall below investment grade. Key Bank USA also entered into an agreement
with Swiss Re and Reliance whereby Swiss Re agreed to issue to Key Bank
USA an insurance policy on the same terms and conditions as the 4011
Policy in the event the financial condition of Reliance Group Holdings
fell below a certain level. Around May 2000, the conditions under both
the 4019 Policy and the Swiss Re agreement were triggered.
The 4011 Policy was canceled and replaced as of May 1, 2000, by a
policy issued by North American Specialty Insurance Company (a
subsidiary or affiliate of Swiss Re) (“the NAS Policy”). Tri-Arc Financial
Services, Inc. (“Tri-Arc”) acted as agent for Reliance, Swiss Re and NAS.
Since February 2000, Key Bank USA has been filing claims under the
Policies, but none of these claims has been paid.
In July 2000, Key Bank USA filed a claim for arbitration against
Reliance, Swiss Re, NAS and Tri-Arc seeking, among other things, a
declaration of the scope of coverage under the Policies and for damages.
On January 8, 2001, Reliance filed an action (litigation) against Key Bank
USA in Federal District Court in Ohio seeking rescission or reformation
of the Policies because they allegedly do not reflect the intent of the
parties with respect to the scope of coverage and how and when claims
were to be paid. Key filed an answer and counterclaim against Reliance,
Swiss Re, NAS and Tri-Arc seeking, among other things, declaratory
relief as to the scope of coverage under the Policies, damages for breach
of contract and failure to act in good faith, and punitive damages.
The parties agreed to proceed with this court action and to dismiss the
arbitration without prejudice.
On May 29, 2001, the Commonwealth Court of Pennsylvania entered
an order placing Reliance in a court supervised “rehabilitation” and
purporting to stay all litigation against Reliance. On July 23, 2001, the
Federal District Court in Ohio stayed the litigation to allow the
rehabilitator to complete her task. On October 3, 2001, the Court in
Pennsylvania entered an order placing Reliance into liquidation and
canceling all Reliance insurance policies as of November 2, 2001. On
November 20, 2001, the Federal District Court in Ohio entered an order
that, among other things, required Reliance to report to the Court on
the progress of the liquidation. On January 15, 2002, Reliance filed a
status report requesting the continuance of the stay for an indefinite
period. On February 20, 2002, Key Bank USA filed a Motion for
Partial Lifting of the July 23, 2001, Stay in which it asked the Court to
allow the case to proceed against the parties other than Reliance. The
Court granted Key Bank USA’s motion on May 17, 2002.
Management believes that Key Bank USA has valid insurance coverage or
claims for damages relating to the residual value of automobiles leased
through Key Bank USA during the four-year period ending January 1,
2001. With respect to each individual lease, however, it is not until the lease
expires and the vehicle is sold that Key Bank USA can determine the
existence and amount of any actual loss (i.e., the difference between the
residual value provided for in the lease agreement and the vehicle’s actual
market value at lease expiration). Key Bank USA’s actual total losses for
which it will file claims will depend to a large measure upon the viability
of, and pricing within, the market for used cars throughout the lease run-
off period, which extends through 2006. The market for used cars varies.
Accordingly, the total expected loss on the portfolio for which Key Bank
USA will file claims cannot be determined with certainty at this time.
Claims filed by Key Bank USA through December 31, 2002, total
approximately $259 million, and management currently estimates that
approximately $102 million of additional claims may be filed through
year-end 2006. As discussed above, a number of factors could affect Key
Bank USA’s actual loss experience, which may be higher or lower than
management’s current estimates.
Key is filing insurance claims for the entire amount of its losses and is
recording as a receivable on its balance sheet a portion of the amount of
the insurance claims as and when they are filed. Management believes
the amount being recorded as a receivable due from the insurance
carriers is appropriate to reflect the collectibility risk associated with the
insurance litigation; however, litigation is inherently not without risk,
and any actual recovery from the litigation may be more or less than the
receivable. While management does not expect an adverse decision, if
a court were to make an adverse final determination, such result
would cause Key to record a material one-time expense during the
period when such determination is made. An adverse determination
would not have a material effect on Key’s financial condition, but could
have a material adverse effect on Key’s results of operations in the
quarter it occurs.
Other litigation. In the ordinary course of business, Key is subject to legal
actions that involve claims for substantial monetary relief. Based on
information presently known to management, management does not
believe there is any legal action to which KeyCorp or any of its subsidiaries
is a party, or involving any of their properties, that, individually or in the
aggregate, could reasonably be expected to have a material adverse effect
on Key’s financial condition or annual results of operations.
December 31,in millions 2002 2001
Loan commitments:Home equity $ 5,531 $ 4,965 Commercial real estate and construction 2,042 2,487 Commercial and other 25,005 24,936
Total loan commitments 32,578 32,388
Principal investing commitments 222 191 Commercial letters of credit 135 106
Total loan and other commitments $32,935 $32,685

NOTES TO CONSOLIDATED FINANCIAL STATEMENTS KEYCORP AND SUBSIDIARIES
83 NEXT PAGEPREVIOUS PAGE SEARCH BACK TO CONTENTS
GUARANTEES
Key is a guarantor in various agreements with third parties. In accordance
with FASB Interpretation No. 45, “Guarantor’s Accounting and
Disclosure Requirements for Guarantees, Including Indirect Guarantees
of Indebtedness of Others,” certain guarantees issued or modified on or
after January 1, 2003, will require the recognition of a liability on Key’s
balance sheet for the “stand ready” obligation associated with such
guarantees. The accounting for guarantees existing at December 31,
2002, was not revised. Thus, the stand ready obligation related to the
majority of Key’s guarantees was not recorded on the balance sheet at
December 31, 2002. Additional information pertaining to Interpretation
No. 45 is summarized in Note 1 (“Summary of Significant Accounting
Policies”) under the heading “Accounting Pronouncements Pending
Adoption” on page 62. The following table shows the types of guarantees
(as defined by Interpretation No. 45) that Key had outstanding at
December 31, 2002.
Standby letters of credit. These instruments obligate Key to pay a third-
party beneficiary when a customer fails to repay an outstanding loan or
debt instrument, or fails to perform some contractual nonfinancial
obligation. Standby letters of credit are issued by many of Key’s lines of
business to address clients’ financing needs. If amounts are drawn under
standby letters of credit, such amounts are treated as loans; they bear
interest (generally at variable rates) and pose the same credit risk to Key
as a loan would. At December 31, 2002, Key’s standby letters of credit
had a remaining weighted average life of approximately 2 years, with
remaining actual lives ranging from less than 1 to 16 years.
Credit enhancement for asset-backed commercial paper conduit. Key
provides credit enhancement in the form of a committed facility to
ensure the continuing operations of an asset-backed commercial paper
conduit, which is owned by a third party and administered by an
unaffiliated financial institution. The commitment to provide credit
enhancement extends until September 26, 2003, and specifies that in the
event of default by certain borrowers whose loans are held by the
conduit, Key will provide financial relief to the conduit in an amount that
is based on defined criteria that consider the level of credit risk involved
and other factors.
At December 31, 2002, Key’s funding requirement under the credit
enhancement facility totaled $59 million. However, there were no
drawdowns under the facility during or at the end of the year. Key has
no recourse or other collateral available to offset any amounts that may
be funded under this credit enhancement facility. Key’s commitments to
provide increased credit enhancement to the conduit are periodically
evaluated by management.
Recourse agreement with Federal National Mortgage Association.
KBNA participates as a lender in the Federal National Mortgage
Association (“FNMA”) Delegated Underwriting and Servicing (“DUS”)
program. As a condition to FNMA’s delegation of responsibility for
originating, underwriting and servicing mortgages, KBNA has agreed to
assume a limited portion of the risk of loss during the remaining term
on each commercial mortgage loan sold. Accordingly, a reserve for
such potential losses has been established and is maintained in an
amount estimated by management to approximate the fair value of the
liability undertaken by KBNA. The outstanding commercial mortgage
loans in this program had a weighted average remaining term of 10 years
at December 31, 2002. At December 31, 2002, the unpaid principal
balance outstanding of loans sold by KBNA as a participant in this
program was approximately $1.1 billion. The maximum potential
amount of undiscounted future payments that may be required under this
program is equal to 20% of the principal balance of loans outstanding
at December 31, 2002. If payment is required under this program,
Key would have an interest in the collateral underlying the commercial
mortgage loan on which the loss occurred.
Return guarantee agreement with Low-Income Housing Tax Credit
(“LIHTC”) investors. Key Affordable Housing Corporation (“KAHC”),
a subsidiary of KBNA, offers limited partnership interests to qualified
investors. Unconsolidated partnerships formed by KAHC invest in
low-income residential rental properties that qualify for federal LIHTCs
under Section 42 of the Internal Revenue Code. In certain partnerships,
investors pay a fee to KAHC for a guaranteed return that is dependent
on the financial performance of the property and the property’s ability
to maintain its LIHTC status throughout the fifteen-year compliance
period. If these two conditions are not achieved, Key is obligated to
make any necessary payments to investors to provide the guaranteed
return. KAHC has the ability to affect changes in the management of
the properties to improve performance. However, other than the
underlying income stream from the properties, no recourse or collateral
would be available to offset the guarantee obligation. These guarantees
have expiration dates that extend through 2018. Key meets its
obligations pertaining to the guaranteed returns generally through
the distribution of tax credits and deductions associated with the
specific properties.
As shown in the preceding table, KAHC had established a reserve in the
amount of $35 million at December 31, 2002, which management
believes will be sufficient to cover estimated future obligations under
the guarantees. However, in accordance with Interpretation No. 45, for
any return guarantee agreements entered into or modified with LIHTC
investors on or after January 1, 2003, all fees received in consideration
for the guarantee will be established as the fair value liability.
Maximum PotentialUndiscounted Liability
in millions Future Payments Recorded
Financial guarantees:Standby letters of credit $4,325 —Credit enhancement for
asset-backed commercial paper conduit 68 $ 1
Recourse agreement with FNMA 227 4 Return guaranty agreement
with LIHTC investors 851 35 Default guarantees 140 2 Written interest rate capsa 43 24
Total $5,654 $66
a As of December 31, 2002, the weighted average interest rate of written interest rate capswas 1.5%. Maximum potential undiscounted future payments were calculated assuming a 10% interest rate.

NOTES TO CONSOLIDATED FINANCIAL STATEMENTS KEYCORP AND SUBSIDIARIES
84 NEXT PAGEPREVIOUS PAGE SEARCH BACK TO CONTENTS
Various types of default guarantees. Some lines of business provide or
participate in guarantees that obligate Key to perform if the debtor fails
to pay all or a portion of the subject indebtedness and/or related
interest. These guarantees are generally undertaken when Key is
supporting or protecting its underlying investment or where the risk
profile of the debtor should provide an investment return. The terms of
these default guarantees range from 1 year to as many as 19 years.
Although no collateral is held, Key would have recourse against the
debtors for any payments made under these default guarantees.
Written interest rate caps. In the ordinary course of business, Key
writes interest rate caps for commercial loan clients that have variable
rate loans with Key. These caps are purchased by clients to limit their
exposure to interest rate increases.
Key is obligated to pay the interest rate counterparty if the applicable
benchmark interest rate exceeds a specified level (known as the “strike
rate”) over a weighted average life of approximately 8.3 years. These
instruments are accounted for as derivatives with the fair market value
liability recorded in “other liabilities” on the balance sheet. Key’s potential
amount of future payments under these obligations is mitigated by the fact
that the company enters into offsetting positions with third parties.
OTHER OFF-BALANCE SHEET RISK
Other off-balance sheet risk stems from financial instruments that do not
meet the definition of a guarantee as specified in Interpretation No. 45
and from other relationships.
Liquidity facilities that support asset-backed commercial paper
conduits. Key provides liquidity to all or a portion of two separate asset-
backed commercial paper conduits that are owned by third parties
and administered by unaffiliated financial institutions. These liquidity
facilities obligate Key through February 15, 2005, to provide funding if
such is required as a result of a disruption in the markets or other factors.
Additional information about these asset-backed commercial paper
conduits is summarized in Note 1 (“Summary of Significant Accounting
Policies”) under the heading “Basis of Presentation” on page 57 and in
Note 8 (“Loan Securitizations and Variable Interest Entities”) under the
heading “Variable Interest Entities” on page 71.
Key provides liquidity to the conduits in the form of committed facilities
of $1.7 billion. The amount available to be drawn on these facilities was
$712 million at December 31, 2002. However, there were no drawdowns
under either of the committed facilities at that time. Of the $1.7 billion
of liquidity facility commitments, $108 million is associated with a
conduit program that is in the process of being liquidated. Therefore,
Key’s commitment will decrease as the assets in this conduit program
decrease. Key’s commitments to provide liquidity are periodically
evaluated by management.
Indemnifications provided in the ordinary course of business. Key
provides certain indemnifications primarily through representations and
warranties in contracts that are entered into in the ordinary course of
business in connection with purchases and sales of businesses, loan sales
and other ongoing activities. Management’s past experience with these
indemnifications has been that the amounts paid, if any, have not had a
significant effect on Key’s financial condition or results of operations.
Intercompany guarantees. KeyCorp and primarily KBNA are parties to
various guarantees that are undertaken to facilitate the ongoing business
activities of other Key affiliates. These business activities encompass debt
issuance, certain lease and insurance obligations, investments and
securities, and certain leasing transactions involving clients.
Relationship with MasterCard International Inc. and Visa U.S.A. Inc.
KBNA and Key Bank USA are members of MasterCard International Inc.
and Visa U.S.A. Inc. MasterCard’s charter documents and bylaws state
that MasterCard may assess members for certain liabilities, including
litigation liabilities. Visa’s charter documents state that Visa may fix fees
payable by members in connection with Visa’s operations. Descriptions
of pending lawsuits and MasterCard’s and Visa’s positions regarding
the potential impact of those lawsuits on members are set forth on
MasterCard’s and Visa’s respective websites and in MasterCard’s public
filings with the Securities and Exchange Commission. Key is not a party
to any significant litigation by third parties against MasterCard or Visa.
Key, mainly through its lead bank, KBNA, is party to various derivative
instruments. These instruments are used for asset and liability
management and trading purposes. Generally, these instruments help Key
meet clients’ financing needs and manage exposure to “market risk” —
the possibility that economic value or net interest income will be
adversely affected by changes in interest rates or other economic factors.
However, like other financial instruments, these derivatives contain an
element of “credit risk” — the possibility that Key will incur a loss
because a counterparty fails to meet its contractual obligations.
The primary derivatives that Key uses are interest rate swaps, caps
and futures, and foreign exchange forward contracts. All foreign
exchange forward contracts and interest rate swaps and caps held are
over-the-counter instruments.
ACCOUNTING TREATMENT AND VALUATION
Effective January 1, 2001, Key adopted SFAS No. 133, “Accounting for
Derivative Instruments and Hedging Activities,” which establishes
accounting and reporting standards for derivatives and hedging activities.
The new standards are summarized in Note 1 (“Summary of Significant
Accounting Policies”) under the heading “Derivatives Used for Asset and
Liability Management Purposes” on page 60.
As a result of adopting SFAS No. 133, Key recorded cumulative after-
tax losses of $1 million in earnings and $22 million in “other
comprehensive income (loss)” as of January 1, 2001. Of the $22 million
loss, an estimated $13 million was reclassified as a charge to earnings
during 2001.
20. DERIVATIVES AND HEDGING ACTIVITIES

NOTES TO CONSOLIDATED FINANCIAL STATEMENTS KEYCORP AND SUBSIDIARIES
85 NEXT PAGEPREVIOUS PAGE SEARCH BACK TO CONTENTS
At December 31, 2002, Key had $849 million of derivative assets and
$151 million of derivative liabilities on its balance sheet that were being
used in connection with hedging activities. As of the same date, the fair
value of derivative assets and liabilities classified as trading derivatives
totaled $1.6 billion and $1.5 billion, respectively. Derivative assets and
liabilities are recorded in “accrued income and other assets” and “accrued
expense and other liabilities,” respectively, on the balance sheet.
ASSET AND LIABILITY MANAGEMENT
Fair value hedging strategies. Key uses interest rate swap contracts
known as “receive fixed/pay variable” swaps to modify its exposure to
interest rate risk. These contracts convert specific fixed-rate deposits,
short-term borrowings and long-term debt into variable-rate obligations.
As a result, Key receives fixed-rate interest payments in exchange for
variable-rate payments over the lives of the contracts without exchanges
of the underlying notional amounts.
During 2002, Key recognized a net gain of approximately $3 million
related to the ineffective portion of its fair value hedging instruments.
The ineffective portion recognized is included in “other income” on the
income statement.
Cash flow hedging strategies. Key also enters into “pay fixed/receive
variable” interest rate swap contracts that effectively convert a portion
of its floating-rate debt into fixed-rate debt to reduce the potential
adverse impact of interest rate increases on future interest expense.
These contracts allow Key to exchange variable-rate interest payments for
fixed-rate payments over the lives of the contracts without exchanges of
the underlying notional amounts. Similarly, Key has converted certain
floating-rate commercial loans to fixed-rate loans by entering into
interest rate swap contracts.
Key also uses “pay fixed/receive variable” interest rate swaps to manage
the interest rate risk associated with anticipated sales or securitizations
of certain commercial real estate loans. These swaps protect against a
possible short-term decline in the value of the loans that could result from
changes in interest rates between the time they are originated and the
time they are securitized or sold. Key’s general policy is to sell or
securitize these loans within one year of their origination.
In May 2001, Key revised its projections of future debt needs. Consequently,
during the second quarter of 2001, Key reclassified a $3 million gain
from “accumulated other comprehensive income (loss)” to “other income”
on the consolidated income statement. This reclassification relates to a
cash flow hedge of a previously forecasted debt issuance that Key did
not make.
During 2002, the net gain recognized by Key in connection with the
ineffective portion of its cash flow hedging instruments was not significant.
The exclusion of portions of hedging instruments from the assessment of
hedge effectiveness had no effect on earnings during 2002.
The change in “accumulated other comprehensive income (loss)”
resulting from cash flow hedges is as follows:
ReclassificationDecember 31, 2002 of Losses December 31,
in millions 2001 Hedging Activity to Net Income 2002
Accumulated other comprehensive income(loss) resulting from cash flow hedges $(2) $(29) $37 $6
Key expects to reclassify an estimated $47 million of net gains on
derivative instruments from “accumulated other comprehensive income
(loss)” to earnings during the next twelve months. Reclassifications will
coincide with the income statement impact of the hedged item through
the payment of variable-rate interest on debt, the receipt of variable-rate
interest on commercial loans and the sale or securitization of commercial
real estate loans.
TRADING PORTFOLIO
Futures contracts and interest rate swaps, caps and floors. Key uses these
instruments for dealer activities, which are generally limited to Key’s
commercial loan clients, and enters into positions with third parties that
are intended to offset or mitigate the interest rate risk of the client
positions. The transactions entered into with clients are generally
limited to conventional interest rate swaps. All futures contracts and
interest rate swaps, caps and floors are recorded at their estimated fair
values. Adjustments to fair value are included in “investment banking
and capital markets income” on the income statement.
Foreign exchange forward contracts. Key uses these instruments to
accommodate the business needs of clients and for proprietary trading
purposes. Foreign exchange forward contracts provide for the delayed
delivery or purchase of foreign currency. Key mitigates the associated risk
by entering into other foreign exchange contracts with third parties.
Adjustments to the fair value of all foreign exchange forward contracts
are included in “investment banking and capital markets income” on the
income statement.
Options and futures. Key uses these instruments for proprietary trading
purposes. Adjustments to the fair value of options and futures are
included in “investment banking and capital markets income” on the
income statement.
The following table shows trading income recognized on interest rate
swap, foreign exchange forward, and option and futures contracts.
Year ended December 31,in millions 2002 2001 2000
Interest rate contracts $10 $17 $32Foreign exchange forward contracts 33 40 35 Option and futures contracts — — 3

NOTES TO CONSOLIDATED FINANCIAL STATEMENTS KEYCORP AND SUBSIDIARIES
86 NEXT PAGEPREVIOUS PAGE SEARCH BACK TO CONTENTS
COUNTERPARTY CREDIT RISK
Swaps and caps present credit risk because the counterparty may not
meet the terms of the contract. This risk is measured as the expected
positive replacement value of contracts. To mitigate credit risk, Key deals
exclusively with counterparties that have high credit ratings.
Key uses two additional precautions to manage exposure to credit risk
on swap contracts. First, Key generally enters into bilateral collateral and
master netting arrangements. These agreements include legal rights of
setoff that provide for the net settlement of the related contracts with the
same counterparty in the event of default. Second, Credit Administration
monitors credit risk exposure to the counterparty on each interest rate
swap to determine appropriate limits on Key’s total credit exposure and
whether it is advisable to demand collateral.
At December 31, 2002, Key was party to interest rate swaps and caps
with 51 different counterparties. Among these were swaps and caps
entered into to offset the risk of client exposure. Key had aggregate credit
exposure of $631 million to 31 of these counterparties, with the largest
credit exposure to an individual counterparty amounting to approximately
$277 million.
The carrying amount and estimated fair value of Key’s financial instruments are shown below in accordance with the requirements of SFAS No. 107,
“Disclosures About Fair Value of Financial Instruments.”
December 31, 2002 2001
Carrying Fair Carrying Fairin millions Amount Value Amount Value
ASSETSCash and short-term investmentsa $ 4,996 $ 4,996 $ 4,789 $ 4,789Securities available for saleb 8,507 8,507 5,408 5,408Investment securitiesb 120 129 225 234Other investmentsc 919 919 832 832Loans, net of allowanced 61,005 62,703 61,632 62,938Servicing assetsa 99 99 73 73Derivative assetsf 2,477 2,477 1,107 1,107
LIABILITIESDeposits with no stated maturitya $28,908 $28,908 $25,047 $25,047Time depositse 20,438 21,021 19,748 20,067Short-term borrowingsa 6,685 6,685 9,284 9,284Long-term debte 15,605 15,712 14,554 14,268Derivative liabilitiesf 1,628 1,628 899 899
CAPITAL SECURITIESe 1,260 1,129 1,288 1,157
Valuation Methods and Assumptions
a Fair value equals or approximates carrying amount.b Fair values of securities available for sale and investment securities generally were based on quoted market prices. Where quoted market prices were not available, fair values were based
on quoted market prices of similar instruments.c Fair values of most other investments were estimated based on the issuer’s financial condition and results of operations, prospects, values of public companies in comparable businesses,
market liquidity, and the nature and duration of resale restrictions. Where fair values were not readily determinable, they were based on fair values of similar instruments, or the investments were included at their carrying amounts.
d Fair values of most loans were estimated using discounted cash flow models. Lease financing receivables and loans held for sale were included at their carrying amounts in the estimated fair value of loans.
e Fair values of time deposits, long-term debt and capital securities were estimated based on discounted cash flows.f Fair values of interest rate swaps and caps were based on discounted cash flow models. Foreign exchange forward contracts were valued based on quoted market prices and had a fair
value that approximated their carrying amount.
21. FAIR VALUE DISCLOSURES OF FINANCIAL INSTRUMENTS
Residential real estate mortgage loans with carrying amounts of $2.0
billion at December 31, 2002, and $2.3 billion at December 31, 2001,
are included in the amount shown for “Loans, net of allowance.” The
estimated fair values of residential real estate mortgage loans and
deposits do not take into account the fair values of long-term client
relationships, which are integral parts of the related financial instruments.
The estimated fair values of these instruments would be significantly
higher if they included the fair values of these relationships.
For financial instruments with a remaining average life to maturity of less
than six months, carrying amounts were used as an approximation of
fair values.
If management used different assumptions (related to discount rates and
cash flow) and estimation methods, the estimated fair values shown in the
table could change significantly. Accordingly, these estimates do not
necessarily reflect the amounts Key’s financial instruments would command
in a current market exchange. Similarly, because SFAS No. 107 excludes
certain financial instruments and all nonfinancial instruments from its
disclosure requirements, the fair value amounts shown in the table do not,
by themselves, represent the underlying value of Key as a whole.

NOTES TO CONSOLIDATED FINANCIAL STATEMENTS KEYCORP AND SUBSIDIARIES
87 NEXT PAGEPREVIOUS PAGE SEARCH BACK TO CONTENTS
CONDENSED BALANCE SHEETSDecember 31,in millions 2002 2001
ASSETSInterest-bearing deposits with KBNA $ 1,406 $ 1,054Loans and advances to subsidiaries:
Banks 77 99Nonbank subsidiaries 693 669
770 768Investment in subsidiaries:
Banks 5,884 5,744Nonbank subsidiaries 1,993 2,004
7,877 7,748Accrued income and other assets 881 780
Total assets $10,934 $10,350
LIABILITIESAccrued expense and other liabilities $ 595 $ 580Short-term borrowings 187 121Long-term debt:
Subsidiary trusts 1,142 1,282Unaffiliated companies 2,175 2,212
3,317 3,494
Total liabilities 4,099 4,195
SHAREHOLDERS’ EQUITYa 6,835 6,155
Total liabilities and shareholders’ equity $10,934 $10,350
a See page 55 for KeyCorp’s Consolidated Statements of Changes in Shareholders’ Equity.
22. CONDENSED FINANCIAL INFORMATION OF THE PARENT COMPANY
CONDENSED STATEMENTS OF INCOMEYear ended December 31,in millions 2002 2001 2000
INCOMEDividends from subsidiaries:
Banks $ 900 $ 500 $1,440Nonbank subsidiaries 200 107 57
Interest income from subsidiaries 54 77 62Other income 3 49 46
1,157 733 1,605EXPENSESInterest on long-term debt with subsidiary trusts 80 92 98Interest on other borrowed funds 33 132 133Restructuring charges (credits) — (4) 102Personnel and other expense 58 56 59
171 276 392Income before income tax benefit and equity in
net income less dividends from subsidiaries 986 457 1,213Income tax benefit 53 28 103
1,039 485 1,316Equity in net income less dividends from subsidiaries (63) (353) (314)
NET INCOME $ 976 $ 132 $1,002
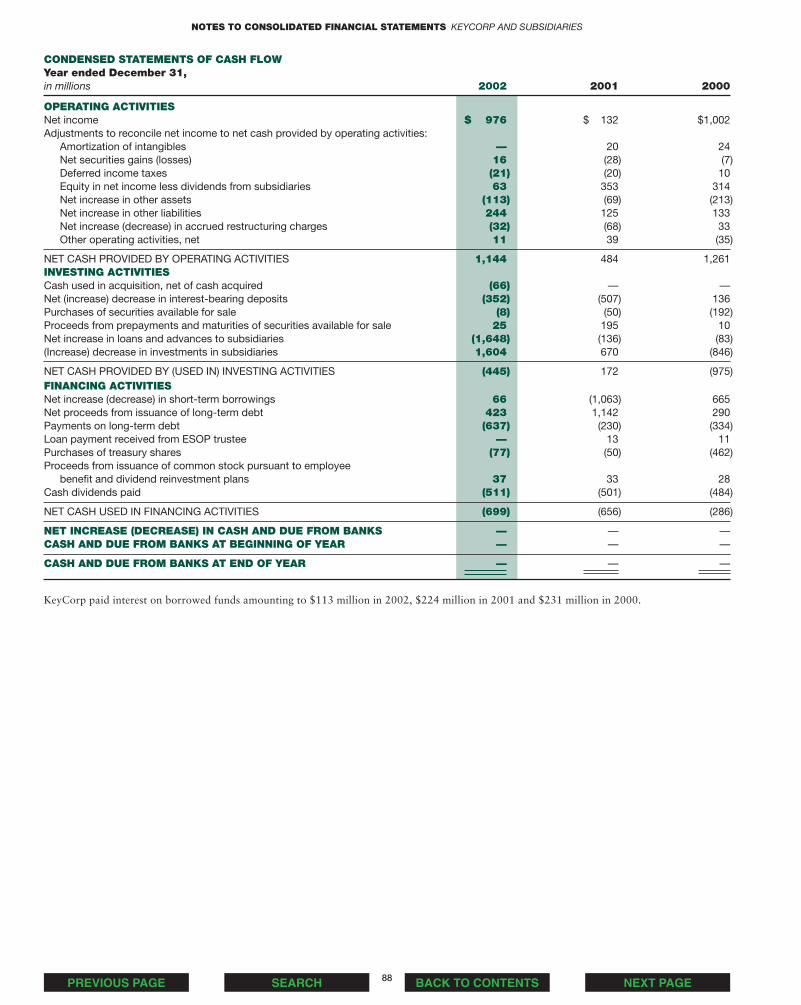
NOTES TO CONSOLIDATED FINANCIAL STATEMENTS KEYCORP AND SUBSIDIARIES
88 NEXT PAGEPREVIOUS PAGE SEARCH BACK TO CONTENTS
CONDENSED STATEMENTS OF CASH FLOWYear ended December 31,in millions 2002 2001 2000
OPERATING ACTIVITIESNet income $ 976 $ 132 $1,002Adjustments to reconcile net income to net cash provided by operating activities:
Amortization of intangibles — 20 24Net securities gains (losses) 16 (28) (7)Deferred income taxes (21) (20) 10Equity in net income less dividends from subsidiaries 63 353 314Net increase in other assets (113) (69) (213)Net increase in other liabilities 244 125 133Net increase (decrease) in accrued restructuring charges (32) (68) 33Other operating activities, net 11 39 (35)
NET CASH PROVIDED BY OPERATING ACTIVITIES 1,144 484 1,261INVESTING ACTIVITIES Cash used in acquisition, net of cash acquired (66) — —Net (increase) decrease in interest-bearing deposits (352) (507) 136Purchases of securities available for sale (8) (50) (192)Proceeds from prepayments and maturities of securities available for sale 25 195 10Net increase in loans and advances to subsidiaries (1,648) (136) (83)(Increase) decrease in investments in subsidiaries 1,604 670 (846)
NET CASH PROVIDED BY (USED IN) INVESTING ACTIVITIES (445) 172 (975)FINANCING ACTIVITIESNet increase (decrease) in short-term borrowings 66 (1,063) 665Net proceeds from issuance of long-term debt 423 1,142 290Payments on long-term debt (637) (230) (334)Loan payment received from ESOP trustee — 13 11Purchases of treasury shares (77) (50) (462)Proceeds from issuance of common stock pursuant to employee
benefit and dividend reinvestment plans 37 33 28Cash dividends paid (511) (501) (484)
NET CASH USED IN FINANCING ACTIVITIES (699) (656) (286)
NET INCREASE (DECREASE) IN CASH AND DUE FROM BANKS — — —CASH AND DUE FROM BANKS AT BEGINNING OF YEAR — — —
CASH AND DUE FROM BANKS AT END OF YEAR — — —
KeyCorp paid interest on borrowed funds amounting to $113 million in 2002, $224 million in 2001 and $231 million in 2000.

ONLINE
Key.com/IR
BY PHONE
Corporate Headquarters(216) 689-6300
KeyCorp Investor Relations(216) 689-4221
Annual Report, Form 10-Kand other financial reports(888) 539-3322
Transfer Agent/Registrarand Shareholder Services(800) 539-7216
BY MAIL
Corporate HeadquartersKeyCorp127 Public SquareCleveland, OH 44114-1306
KeyCorp Investor Relations127 Public Square; OH-01-27-1113Cleveland, OH 44114-1306
Transfer Agent/Registrarand Shareholder ServicesComputershare Investor ServicesAttn: Shareholder CommunicationsP.O. Box A3504Chicago, IL 60690-3504
ANNUAL SHAREHOLDERS MEETING
May 22, 20039:00 a.m., Local TimeDean White AuditoriumIndiana State MuseumWhite River State Park650 West Washington StreetIndianapolis, IN
COMMON SHARES
KeyCorp Common Shares are listed on the New York Stock Exchange under the symbol KEY.Anticipated dividend payable dates are the 15th of March, June,September and December.
QUARTERLYFINANCIAL RELEASES
Key expects to announce quarterlyearnings during the third week of April, July and October 2003 andJanuary 2004. For a copy of anearnings announcement, call theFinancial Report Request Line at (888) 539-3322 or visit Key.com/IR.
Investor Connection... Key.com/IRKey is committed to communicating quickly, accurately and cost-effectively with investors.Those who choose electronic access, particularly through the internet, can receive informationfaster and help Key reduce printing and postage costs.
Key’s Investor Relations website provides quick access to useful information and shareholderservices, including live webcasts of management’s quarterly earnings discussions.
Shareholders may receive Key’s Proxy Statement andAnnual Report electronically over the internet insteadof receiving a paper copy. Key also encouragesshareholders to vote their proxies over the internet –or by phone – instead of using the paper proxy card.
KeyCorp supports the National Association of Investors Corporation’s (NAIC)“Own Your Share of America” campaign, which encourages individuals to invest in common stock. NAIC is a non-profit organization dedicated to providing individual investors with investment information and education. Please call toll free (877) ASK-NAIC for membership information.
What do you think of this Annual Report? Through May 31, 2003,visit Key.com/IR or call (800) 539-4164 to share your opinion.
NEXT PAGEPREVIOUS PAGE SEARCH BACK TO CONTENTS

Achieve anything.
Dr. Donna Caniano, MD, is surgeon-in-chief at the Children’s Hospital inColumbus, Ohio, one of the largest children’s hospitals in the U.S. Nationallyrecognized in academic pediatric surgery, she is also one of only two womenin the country who are directors of major surgical pediatric programs.
McDonald Financial Group.Since she started out as a young medical professional, Dr. Caniano has relied on the integrated, comprehensive approach of the McDonald FinancialGroup team. Over the past 15 years, her financial advisor has helped her with everything from the purchase of three homes to her investments andcomplex retirement plan. She points out: “What’s most important is that myfinancial advisor is always available and instantly responsive. Nothing is everan obstacle.”
With time always at a premium, Dr. Caniano appreciates having just one number to call, whether to refinance her mortgage or pay dues to international surgical associations in different currencies. She sums up theclient-first service she receives from McDonald Financial Group: “Everything is always completely seamless.”
“It means a lot to be assisted in financial mattersby someone I trust.”
What is Dr. Donna Caniano’s prescription for success?
This testimonial may not be representative of the experience of other clients and is not indicative of future performance or success.
BACK TO CONTENTSPREVIOUS PAGE SEARCH