board diversity, corporate governance, corporate
TRANSCRIPT

1
Board Diversity, Corporate Governance, Corporate Performance and Executive Pay
ABSTRACT
Departing from previous studies, this paper investigates the impact of corporate board
diversity on corporate performance and executive pay within the context of MENA countries.
Our sample includes a balanced panel of 600 firm-year observations, consisting of 100
individual firms drawn from 5 Middle Eastern countries (Egypt, Jordan, Oman, Saudi Arabia
and United Arab of Emirates) over the 2009–2014 period. The findings are three-fold. First,
board diversity, as measured by director gender and nationality, has a positive effect on
corporate financial performance. Second, the relationship between board diversity and
corporate performance is stronger in better-governed firms than their poorly-governed
counterparts. Finally, board diversity, as measured by director gender, ethnicity and
nationality, enhances the pay-for-performance sensitivity, but not the actual executive pay.
Our results suggest that decisions about board diversity are not merely influenced by moral
values; they arise because of the cost-benefit considerations of what diversity can bring to the
firm. The findings are robust to controlling for different alternatives of board diversity
measures, corporate governance proxies, corporate outcomes and types of endogeneities.
KEY WORDS: economics and finance; financial and governance reforms; corporate
governance; corporate board diversity; corporate performance; executive pay; MENA
countries

2
1. INTRODUCTION
The events of the Arab Spring seemed to have ushered in a new era in which there is an
increasing demand for change throughout the region. Young people, especially women, want
to play a greater role in society, with better economic opportunities. In addition, modern
women in MENA countries are generally younger, better educated, and have fewer children
than previously (Chamlou, 2008; Hegland, 2018; Jamali et al., 2007; Salloum et al., 2017;
World Bank, 2013). Moreover, most MENA countries have made significant progress toward
improving access to education and healthcare, as well as enhancing gender equality (Salloum
et al., 2017). According to the United Nations Development Programme (UNDP) (2010),
MENA countries have made the world‘s fastest progress in human development since 1970.
However, this investment in human development is not yet reflected in higher rates of female
participation in political governance and leadership, senior management positions and on
corporate boards in particular, but in the labour force in general. This is widely known as ‗a
gender equality paradox‘ (Hegland, 2018; Jamali et al., 2007; Metcalfe, 2007; World Bank,
2013).
Economic, financial, governance, political and social reforms are being pursued
worldwide (Bussiere & Mulder, 2000; Gupta et al., 2005; Swamy & Dharani, 2018). Recent
corporate scandals have directed more attention to CG and EP mechanisms (Hasan et al.
2014; Ullah et al., 2018a), especially on the importance of board of directors in terms of their
roles, effectiveness, composition and diversity (Carter et al., 2003, 2010; Yamori et al.,
2017). It is worth noting, however, that the extent to which such contemporary economic,
financial, governance and social (e.g., education) reforms influence a number of key
corporate outcomes are rarely investigated (Salloum et al., 2017). Consequently, in this
paper, our objective is to extend the existing literature by examining the extent to which
contemporary economic, financial and social reforms that are often aimed at enhancing

3
governance and diversity of major corporations have influenced corporate outcomes in such
conservative institutional contexts. Specifically, we seek to contribute to the extant corporate
governance (CG) literature in four main ways, by investigating whether: (i) corporate board
diversity, as measured by gender, ethnicity and nationality, affects corporate financial
performance; (ii) CG quality moderates the relationship between corporate board diversity
and corporate financial performance; (iii) corporate board diversity influences executive pay
(EP); and (iv) corporate board diversity moderates the pay-for-performance sensitivity (PPS),
using a sample of firms operating in a number of Middle East and North African (MENA)
countries. The analysis draws on a multi-theoretical perspective that incorporates insights
from agency, resource dependence and social identity theories.
Board of directors is one of the top decision-making sub-groups in modern
organisations (Dale-Olsen et al., 2013; Luckerath-Rovers, 2013; Mahadeo et al., 2012; Ntim,
2015; Roberson & Park, 2007; Yamori et al., 2017). Corporate boards possess the
responsibility for making strategic decisions regarding mergers and acquisitions, hiring,
firing, compensating and promoting executives, amongst others (Abdullah, 2014; Jensen,
1993; Ntim et al., 2017). In addition, corporate boards can help modern organisations to
connect better with the external environment, which can facilitate access to resources, such as
finance and business contracts (Estélyi & Nisar, 2016; Wellalage & Locke, 2013).
Meanwhile, existing CG codes and reforms have focused mainly on the composition
of the board of directors (e.g., size, independence and diversity), as an influential tool, which
can help enhance CG standards (Adams & Ferreira, 2009; Carter et al., 2003, 2010; Ntim,
2015; Ullah et al., 2018a). Observably, board diversity may be pursued for two main reasons:
economic and/or social reasons. First and economically, the extant literature suggests that
appointing female, ethnic minority and foreign nationals to corporate boards may not only
improve board diversity and bring different expertise, ideas, talents, skills, work ethic,
4
backgrounds and experience to boardrooms (Carter et al., 2003, 2010; Gyapong et al., 2016;
Ntim, 2015; Salloum et al., 2017; Ullah et al., 2018a), but also may enhance board
independence and monitoring (Baranchuk & Dybvig, 2009; Jamail et al., 2007). Second and
socially, board diversity incorporates social equity or equal opportunities (Carter et al. 2003;
Gyapong et al., 2016; Terjesen et al., 2009, 2015). Thus, appointing female, ethnic minority
and foreign directors may help in building more inclusive and fair business institutions that
better reflect the constituencies of existing stakeholders (Jamali et al., 2007; Terjesen et al.,
2009, 2015; Terjesen & Sealy, 2016).
Therefore, diversifying corporate boards on the basis of gender, ethnicity and
nationality, has recently become a key global policy issue (Adams & Ferreira, 2009;
Gyapong et al., 2016; Mahadeo et al., 2012; Ullah et al., 2018a). Indeed, a large number of
countries around the world, especially in Europe, have recently implemented some form of
affirmative action in order to address it (Ullah et al., 2018a). In this case, Scandinavian
countries have shown a significant interest in passing ‗hard (enforceable in a law court)‘
national laws that specify quotas for the number of female director representation on publicly
traded firms and/or state-owned enterprises (Rose, 2007; Terjesen et al., 2015). For example,
Norway, Finland and Iceland passed laws in 2003, 2005 and 2010, respectively, requiring
40% of corporate board members to be female. The European Commission also requires all
publicly traded EU firms to have a minimum of 40% women on their boards (European
Union 2012). Similar ‗hard‘ or ‗soft (best practice guidance)‘ affirmative policies and laws
exist in other developed countries, such as Australia, Belgium, Canada, France, Germany,
Ireland, Israel, Italy, Japan, Netherlands, Spain and Sweden. Developing countries have also
recognised the importance of having diverse corporate boards. Accordingly, these developing
countries have also either passed a similar ‗hard‘ national law that set quotas for women
directors or issued CG codes that require the appointment of a certain percentage of women

5
into corporate boards (Terjesen et al., 2015). Kenya, for instance, passed a law in 2010
requiring 33% of the directors of state-owned enterprises to be women. Similarly, Brazil,
India, Malawi, Nigeria and South Africa have issued codes of good governance that include
board gender representation recommendations. Of closer relevance to our study, MENA
countries, including highly conservative ones, such as Bahrain, Kuwait, Qatar, Saudi, Tunisia
and UAE have started similar reforms of empowering women and enhancing their
representation at senior management levels (Salloum et al., 2017). Furthermore, a number of
previous studies have argued that the association between board diversity and firm value may
not just be influenced by organisation-level variations (Baysinger & Butler, 1985; Baysinger
& Hoskisson, 1990), but also by differences in country-level regulatory and institutional
structures (Byron & Post, 2016; Grosvold et al., 2016; Van der Walt & Ingley, 2003). Thus,
country-level institutional factors may influence the direction and the strength of the
relationship between board diversity and corporate outcomes (Byron & Post, 2016; Estélyi &
Nisar, 2016; Salloum et al., 2017).
However, most of the previous studies that have investigated the association among
board diversity, CG, corporate performance and EP have been conducted in developed
countries like Australia, Denmark, UK and US, which have relatively similar institutional
contexts (Adams and Ferreira, 2009; Carter et al., 2003; Carter et al., 2010; Rose, 2007; Liu
et al., 2017), with only a limited number of studies investigating emerging markets in general
(Gyapong et al., 2016; Liu et al., 2014; Mahadeo et al., 2012; Ntim, 2015), but MENA
countries in particular (Salloum et al., 2017).
Furthermore, most of the studies conducted in developed countries are concerned
with: (i) board diversity on the basis of gender (Burges & Tharenou, 2002; Erhardt et al.,
2003) to the relative neglect of the effects of ethnicity and nationality in particular (Estélyi &
Nisar, 2016; Gyapong et al., 2016; Ntim, 2015) and/or (ii) corporate performance (Abdullah,

6
2014; Luckerath-Rovers 2013), and thus ignoring the effect of board diversity on EP (Carter
et al., 2010). Hence, there is scarcity of empirical studies investigating the impact of
corporate board diversity on EP, and thus this study provides a timely contribution to the
extant literature. Noticeably, the Middle East remains one of the few regions, where the role
of board diversity has been acutely under-researched (Hasan et al., 2014; Piesse et al., 2012;
Salloum et al., 2017). Discernibly and as will be expatiated later on, we focus on MENA
countries because the economic, political, legal, cultural and CG structures in such countries
differ from those of other regions, and thus implies that the generalisability of their results for
the MENA region is arguably limited (Hasan et al., 2014; Jamali et al., 2007; Metcalfe, 2007;
Salloum et al., 2017; Samaha et al., 2012).
Consequently, this study seeks to examine the relationship among board diversity,
CG, firm value and EP in MENA countries, and thereby making a number of new
contributions, as well as extensions to the extant literature. First, the study offers new
evidence on the effect of board diversity (i.e., ethnicity, gender and nationality) on firm value
in MENA countries. Second, we provide the first evidence on the moderating effect of CG
quality on the board diversity–performance nexus in MENA countries. Third, we contribute
to the literature by providing the first evidence on the effect of board diversity on EP in
MENA countries. Finally, the study contributes to the extant literature by examining for the
first time, the moderating effect of board diversity on the PPS in MENA countries.
The rest of the paper is structured as follows. First, we provide a brief overview of
board diversity, CG, EP and the MENA corporate context. Second, we document the existing
theoretical and empirical literature on the impact of corporate board diversity on corporate
performance and EP. Third, we introduce the research design. We then report the empirical
analyses and discuss the empirical findings. Finally, we present a brief summary and
concluding remarks.

7
2. BOARD DIVERSITY, CG, EP AND THE MENA CORPORATE CONTEXT
The MENA region has recognised the importance of diversifying corporate boards in order to
improve corporate outcomes (Jamali et al., 2007; Loukil & Yousfi, 2016; Salloum et al.,
2017). In the Arab world, the 2010 Arab spring has particularly orchestrated a wave of
economic, financial, governance and social changes, even in highly conservative and
religious countries (Acemoglu et al., 2017; Hodler, 2018; Merrill, 2017; Salloum et al.,
2017). For example, Saudi Arabia, a highly conservative Islamic country, has in an
unprecedented manner, recently extended a number of major economic, financial,
governance, political and social rights and freedoms to women, such as banking, driving,
political (e.g., to stand and be elected as political office holders), executive (e.g., to be
appointed as directors) and voting rights, amongst others (Kamrava, 2012; Merrill, 2017;
Salloum et al., 2017)
For example and in a cross-country study, Terjesen and Singh (2008) find that boards‘
gender diversity is influenced by macro-level economic, environmental, political and social
factors. Thus, specific national contextual factors, such as social norms, legal framework and
structure of the economy may have a powerful influence on the incentives, preferences,
opportunities and the ability of women to participate in work and politics (Metcalfe, 2007;
Salloum et al., 2017; Ullah et al., 2018a; World Bank, 2013).
Meanwhile, MENA countries have inherited cultural practices, traditions, customs
and beliefs that have impacted negatively on women‘s development and instead ensured
continuous dominance of men (Jamali et al., 2007; Hegland, 2018; Metcalfe, 2007; Salloum
et al., 2017; World Bank, 2013). According to Chamlou (2008), the World Values Survey
1999-2004 shows that both men‘s and women‘s perceptions of working women are less
positive in the MENA region than elsewhere. The variation in male and female perception of

8
working women also is far wider in the MENA region. Men‘s less favourable attitude toward
working women may affect women‘s participation in the labour force, especially because
women usually have to obtain permission from their husbands before they can participate in
the labour force in most Middle East countries (Hegland, 2018).
Noticeably, religion has played a significant role in the evolution of customs, social
norms and laws in the MENA region (Hegland, 2018; Salloum et al., 2017; Syed & Van
Buren, 2014; World Bank, 2013). In Muslim-majority countries, culture and religion are
mutually reinforcing (Metcalfe, 2007; Syed & Van Buren, 2014). Within Islam, both women
and men have equal rights for work and compensation (Hegland, 2018; Syed & Van Buren,
2014), and Islam equally binds both women and men to seek education as a religious duty
(Ibn Majah, 1952). Islam also allows women to operate their own business (Hassan, 1994),
and recognises a woman‘s economic rights (Hussain, 1987). However, much of the Islamic
impetus for gender equality in educational, economic and employment rights has been
modified because of the influence of pre-existing Arab attitudes, customs and traditions
(Hussain, 1987; Lewis, 1995; Mernissi, 1991: Salloum et al., 2017). Women in many
Muslim-majority countries still face relatively higher gender discrimination than women in
the West, because of the narrow interpretation of Islamic female modesty and gender
segregation (Hegland, 2018; Syed et al., 2005; Syed & Van Buren, 2014).
In addition, most listed companies in MENA countries have highly concentrated
shareholding structures, with dominance of the state and family controls (Al-Bassam et al.,
2015; Hasan et al., 2014; Jamali et al., 2007; Piesse et al., 2012). Smith (2009) documents
that 75% of the region‘s companies are controlled by families. Powerful families in the
MENA region tend to actively shape the board of directors by choosing one of their own
inner circle (a close relative or senior manager) to be appointed to the board, so the family
continues to influence and control the decision-making process (Jamali et al., 2007: Salloum

9
et al., 2017). A better overall governance environment and investment climate, with greater
emphasis on qualifications and meritocracy, would have a positive impact on women‘s
opportunity to compete for jobs (Salloum et al., 2017). Conversely, increased levels of
corruption, poor governance and weak rule of law in MENA societies may negatively impact
women‘s participation in the workforce, and their opportunities for appointment to top
management positions and boardrooms, because preference might be given to those (men)
with connections (Chamlou, 2008). Most MENA countries began to introduce economic and
governance reforms in the mid-1990s, aiming for more market-driven, open and diversified
economies; this was well after the collapse of oil prices in the mid-1980s (Al-Bassam et al.,
2015; Piesse et al., 2012; World Bank, 2007). More recently, corporations in MENA
countries have started to attract a significant number of foreign equity investors, many of
which are holding companies listed on stock exchanges with stricter listing requirements than
existing standards on MENA stock exchanges (Jamali et al., 2007; World Bank, 2007). Thus,
it is expected that foreign investors may influence the composition of the board of directors,
for example, by calling for diversification of the board to include female, ethnic minority and
foreign members (Estélyi & Nisar, 2016; Jamali et al. 2007; Salloum et al., 2017). It has been
argued that such diversity within MENA corporate boards can impact positively on CG,
performance and EP. Consequently, we seek to contribute to the literature by examining the
relationship among board diversity, CG, performance and EP in MENA countries.
3. THEORETICAL FRAMEWORK
The main functions of the board of directors are to: (i) control and monitor managers; (ii)
provide advice to managers; (iii) monitor organisational compliance with applicable rules and
legislation; and (iv) connect the organisation to the external environment (Abdullah 2014;
Jensen 1993). The board diversity–corporate performance nexus could not be explored

10
through a single theory because there is no one single theory can sufficiently explain such a
complex relationship (Gyapong et al., 2016; Salloum et al., 2017). One reason is that most
single theories suffer from a number of limitations, such as lack of specificity (legitimacy),
excessive focus of financial stakeholders (resource dependence and stakeholder theories),
high levels of distrust and abuse of managerial power (agency, optimal contracting and
managerial power theories), and high levels of managerial trust (stewardship) (e.g., Ntim et
al., 2015a, b, 2017; Salloum et al., 2017), amongst others, such that they are unable to fully
explain complex relationships on their own. However, their explanatory power can be
enhanced when they are combined (Ntim et al., 2012; Ntim, 2015), and thus a multiple
theoretical perspective is adopted in our study. Discernibly, past studies have employed a
number of different theories to investigate the association between board diversity and
performance, including agency, resource dependence and social psychology theories. The
arguments driven by these theories suggest that the gender, ethnic and nationality diversity of
board members such that it may have a negative, positive or no impact firm value (Campbell
& Minguez-Vera, 2008; Carter et al., 2010; Estélyi & Nisar, 2016; Ntim, 2015; Salloum et
al., 2017).
First, agency theory suggests that more diversified boards are more independent and
better able to perform their monitoring function (Abdullah, 2014; Adams & Ferreira, 2009;
Carter et al., 2003; Van der Walt & Ingley, 2003). Females, foreigners and ethnic minorities,
as sub-groups, are more coordinated and effective in their monitoring role (Adams & Ferrira,
2009; Gul et al., 2011; Gyapong et al., 2016), and thus the appointment of women, foreign
and different ethnic directors reduces the extent of agency conflict (Ntim et al., 2012; Xiao &
Zahoo, 2014) and enhances firm value (Estélyi & Nisar, 2016; Ntim, 2015). Corporate board
diversity enhances the decision-making process by adding various ideas, skills, backgrounds,
perspectives and business knowledge (Baranchuk & Dybvig, 2009; Luckerath-Rovers, 2013),

11
increasing the board‘s ability to deal with different opportunities and challenges in the
organisational external environment (Ntim, 2015).
On the other hand, agency theory argues that qualified women directors tend to hold
multiple directorships (Sealy et al., 2008). This ‗director busyness‘ has a negative impact on
their ability to provide their monitoring and advisory roles, increasing agency problems and
thereby reducing firm value (Falato et al., 2014; Faleye et al., 2011; Field et al., 2013).
Women and ethnic minorities may lack the necessary level of skills, qualifications and
experience required for directorship (Terjesen et al., 2009). Women, compared to men, may
have lower levels of investment in education and work experience (Tharenou et al., 1994).
Thus, the monitoring and advisory roles of the board will be affected negatively by the
appointment of women and ethnic minorities, and consequently the firm value will decrease
(Gyapong et al., 2016).
Second, resource dependence theory argues that corporate board diversity enhances
the organisation‘s connections with its stakeholders, such as customers and suppliers, and
may improve its reputation and value (Mahadeo et al., 2012; Wellalage & Locke, 2013) and
increases board legitimacy (Carter et al., 2003; Liu et al., 2014; Salloum et al., 2017; Wang et
al., 2014). This legitimacy is associated with gaining stakeholders‘ appreciation, increased
capital inflows, investment opportunities, government support and community acceptance
(Loukil & Yousfi 2016; Mahadeo et al., 2011). Consequently, this will be positively
associated with increase in firm value (Gyapong et al., 2016; Ntim, 2015). Estélyi and Nisar
(2016) and Miletkov et al. (2014) also suggest that foreign directors can bring differing
perspectives and contacts to the board, as well as can facilitate access to different national
and international markets that can enhance geographic and product diversification, and
thereby firm performance.
12
The social identity theory argues that more diversified boards, with different
backgrounds, ideas and perceptions, have a heterogeneous working environment which
includes a number of sub-groups based on gender, race or nationality. Thus, board diversity
may increase communication problems and thereby degrade the board‘s decision-making
process and increase organisational and operational risk (Carter et al., 2010; Delias et al.,
2016; Salloum et al., 2017; Westphal & Milton, 2000). Westphal and Milton (2000) argue
that demographic diversity weakens the social cohesion in boardrooms. Thus, majority
viewpoints will dominate board decisions and individual directors will be unable to influence
the boards. Similarly, Campbell and Minguez-Vera (2008) suggest that the appointment of
women directors introduces conflicting viewpoints and unnecessary critical thinking that
delays and negatively impacts the decision-making process.
The association between good CG practice and EP can be interpreted from two main
perspectives of agency theory: optimal contracting theory (OCT) and managerial power
hypothesis (MPH) (Bebchuk et al., 2002; Bebchuk & Fried, 2004; Edmans & Gabaix, 2009;
Liu et al., 2017). OCT argues that independent corporate boards construct EP schemes after
arms-length negotiations with executives. Therefore, corporate boards can enhance a firm‘s
value by linking executive performance to the EP package (Conyon, 2014; Edmans &
Gabaix, 2009). Consequently, OCT suggests that because executives are less involved in
determining their own pay, there is a positive and/or strong association between EP and their
performance (Liu et al., 2017; Van Essen et al., 2015). Thus, OCT assumes that more
diversified boards have an essential impact on the effectiveness of the board of directors,
since they are able to constrain managers from expropriating shareholders‘ wealth by
enhancing the controlling and monitoring role of the board (Adams & Ferreira, 2009; Gul et
al., 2011; Gyapong et al., 2016; Ntim, 2015), as well as by bringing diverse talents,

13
backgrounds, ideas, knowledge and experience to the board (Abdullah, 2014; Adams &
Ferreira, 2009; Carter et al., 2003).
In contrast, MPH suggests that close negotiations between a weak/dependent board
and strong executives may lead to the foundation of an inefficient EP contract that can
increase agency problems (Bebchuk et al., 2002; Bebchuk & Fried, 2004). Thus, MPH
proposes a negative and/or weak link between EP and performance, because of strong
interference from executives in setting their own incentive schemes (Liu et al., 2017; Van
Essen et al., 2015).
4. HYPOTHESES DEVELOPMENT
In this part of the study, we discuss our four main hypotheses relating to the impact of
corporate board diversity on corporate financial performance and EP.
Corporate Board Diversity and Corporate Financial Performance
In line with the inconsistency in the theoretical literature on the expected impact of board
diversity on corporate performance, previous studies have similarly offered mixed empirical
evidence (e.g., Carter et al., 2003, 2010; Dale-Olsen et al., 2013; Salloum et al., 2017;
Ujunwa, 2012). The first group of studies has reported a positive impact of board
heterogeneity on performance. In a developing country context, Abdullah (2014), Mahadeo et
al. (2012), Ntim (2015), and Wellalage and Locke (2013) document a positive association
between diversed boards and firm value in Mauritius, Malaysia, Sri Lanka and South Africa,
respectively. For example, Gyapong et al. (2016), using data from 245 South African listed
firms from 2008-2013, find a positive and significant effect of both gender and ethnic
diversity on firm value. Salloum et al. (2017), support a positive impact of women and ethnic
minority group members on Middle Eastern SMEs‘ financial performance.

14
On the other hand, another group of studies has found a negative effect of board
diversity on corporate performance (e.g., Dale-Olsen et al., 2013; Ujunwa, 2012). The results
of these studies suggest that not only women and ethnic minorities have a token status on the
board but they may also have financial consequences for the organisation, resulting in a
negative impact on firm value (Ntim, 2015). Adams and Ferreira (2009), investigating the
impact of female directors on board inputs and corporate outcomes in a sample of 1,939 firms
for 1998-2003, find that gender diversity has a negative impact on performance, which
further suggests that assigning gender quotas may have a negative impact on performance in
better governed firms. Salloum et al. (2017) report that Western ethnic minority members
have a negative effect on firm performance, because these board members may be appointed
for different reasons related to regional and international board reputation legitimacy, and
personal business agendas, as well as links to the external corporate environment. Using a
sample of FTSE firms, Estélyi and Nisar (2016) find that boards containing diverse
nationalities are positively and significantly associated with shareholder heterogeneity, the
firm's international market operations and operating performance.
A third set of empirical studies (e.g., Gregory-Smith et al., 2014; Rose, 2007) has
documented no link between board diversity and corporate financial performance. For
example, Carter et al. (2010) examine the relation between appointment of women and ethnic
minority members of the board and board committees and financial performance for a sample
of 641 US firms for the five-year period from 1998 to 2002. They document no significant
impact of diversified boards and performance, which supports the contingency explanation
that board gender and ethnic diversity have different effects on performance under different
circumstances at different times.
Most developing countries, including the MENA region, have adopted a set of CG
guidelines that have been inspired by the OECD‘s CG principles (Egyptian CG code 2006;

15
Jordanian CG code 2012). These principles place greater emphasis on issues relating to
corporate board composition (such as board size, independence and diversity), as well as the
construction and functions of board committees (e.g., audit, compensation and nomination
committees) in enhancing board effectiveness. For example, the Jordanian CG code 2012,
which is based on the ―comply-or-explain‖ principle, recommends that the structure of the
board of directors should take into consideration a balanced mix of age, gender and
experience in order to achieve its roles and responsibilities. The 2016 Egyptian CG code (i.e.,
the latest) (amended version of the 2006 and 2011 CG Guides) suggests that firms should
follow the international standards regarding board diversity and not be biased against gender
or ethnicity when appointing directors. Thus, based on these arguments and mixed results, the
first hypothesis is as follows:
Hypothesis 1 There is an association between board diversity on the basis of gender,
ethnicity and nationality, and financial performance.
Although, the association between board diversity and corporate performance may be
affected by organisation-level heterogeneities (Baysinger & Butler, 1985; Baysinger &
Hoskisson, 1990), it is probably also affected by variation in country-level regulations, CG
reforms and institutional features (Byron & Post, 2016; Grosvold et al, 2016; Ntim, 2015;
Ullah et al., 2018a). Firms might use their internal CG mechanisms (e.g., board
characteristics and shareholding structure mechanisms) to compensate for a poor legal
environment and enhance investors‘ protection in aligning managers‘ and shareholders‘
interests (Klapper & Love, 2004; Shleifer & Wolfenzon, 2002), thereby improving corporate
performance (Castrillo et al., 2010; Yermack, 1996). Gul et al. (2011) suggest that board
diversity substitutes other CG measures in monitoring firms. Therefore, board diversity‘s

16
positive impact on corporate performance is more probably observable in weakly governed
firms (Adams & Ferreira, 2009; Gul et al., 2011). Because, in well governed firms, the extra
monitoring provided by diversified boards may lead to negative effects on corporate
performance (Adams & Ferreira, 2009; Gul et al. 2011). For example, Adams and Ferreira
(2007) argue that the CEO is less likely to communicate with boards that provide higher
monitoring intensity. On the other hand, Gyapong et al. (2016) suggest that developing
countries, compared to developed countries, have weaker investor protection and a weaker
external regulatory environment. Thus, the additional monitoring function performed by
female directors is of more value in firms with strong CG mechanisms. This is supported by
the findings of Miletkov et al. (2014), which suggest that, in countries with lower levels of
investor protection, the presence of foreign directors is associated with positive impact on
operating performance.
Using empirical evidence from the US, Adams and Ferreira (2009) and Gul et al.
(2011) find that board gender diversity is strongly associated with corporate financial
performance and stock price informativeness for firms with weak governance. This means
that gender-diverse boards might act as a substitute mechanism for weak CG. However, in the
South African context, Gyapong et al. (2016) find that the additional monitoring function
performed by minority ethnic directors is more value-relevant than that performed by female
directors in better governed firms.
Developing countries, including the MENA region, are characterised by concentrated
shareholding that is dominated by families and governments (Jamali et al., 2007; Piesse et al.,
2012; Samaha et al., 2012). Furthermore, these countries have a weak external corporate
regulatory environment, weak legal enforcement, and inadequate external discipline by the
market for corporate control (Khalil & Ozkan, 2016; La Porta et al., 2000; Ntim et al., 2012).
Accordingly, these features participate in reducing shareholders‘ rights and increasing agency

17
problems (Gyapong et al., 2016). Given the previous theoretical and empirical literature, the
second hypothesis is as follows:
Hypothesis 2 The strength of the association between board diversity based on gender,
nationality and ethnic minority directors, and financial performance is stronger (weaker) in
better-governed (poorly-governed) firms.
The Association between Board Diversity and Executive Pay
Agency theory argues that board members monitor managers on behalf of stockholders
(Jensen & Meckling, 1976) to align the interests of managers with those of shareholders
(Estélyi & Nisar, 2016; Fama & Jensen, 1983; Ullah et al., 2018a). The monitoring role of
directors includes, for example, hiring and firing top managers and determining EP (Monks
& Minow, 1995). EP, indeed, is highly influenced by the efficiency of the board‘s control and
monitoring (Conyon & He 2011; Ntim et al., 2017).
Accordingly, OCT suggests that managers‘ payment is associated with their efforts to
ensure that directors and executives behave in the interest of shareholders (Adams & Ferreira,
2009; Liu et al., 2017). Thus, better governed firms (with more diversified boards) are less
likely to overpay their executives (Stulz, 1988). In contrast, MPH suggests that EP packages
are set by opportunistic corporate executives in firms with weak CG structures (Bebchuk et
al., 2002; Bebchuck & Fried, 2004; Liu et al., 2017). Accordingly, MPH proposes that
women and minority ethnic board members are perceived as tokens (Abdullah, 2014; Adams
& Ferreira, 2009) and are appointed to boards mainly for symbolic reasons (Carter et al.,
2003; Gyapong et al., 2016; Terjesen et al., 2009, 2015). Thus, corporate executives can
influence the decisions of more diversified boards, especially those relating to the structure
and level of EP. Westphal and Zajac (1995) find evidence that CEOs are more likely to
18
attempt to influence the hiring of directors who have similar demographic characteristics to
themselves. They also document that in firms, where CEOs and directors share similar
demographic attributes, CEOs are more likely to be awarded higher salaries.
Although a number of prior studies have documented the positive association between
board diversity and corporate performance (e.g., Carter et al., 2003; Gyapong et al., 2016; Liu
et al., 2017; Luckerath-Rovers, 2013; Ntim, 2015), studies investigating the impact of
corporate board diversity on EP are rare, and thus this study provides a timely contribution to
the extant literature. For example, Adams and Ferreira (2009) document that directors on
gender-diversified boards receive comparatively more equity-based compensation, which
provides more performance-based incentives, while they have found no statistical evidence
for the impact of board gender diversity on CEO compensation. They argue that the absence
of the relationship between a high percentage of female directors on boards and CEOs‘ pay is
consistent with lower representation of women in compensation committees. Given the
previous theoretical and empirical literature, the third hypothesis is as follows:
Hypothesis 3 There is an association between board diversity based on gender, nationality
and ethnic minority directors, and executive pay.
Both internal CG mechanisms (as monitoring mechanisms) and EP contracts (for
alignment of interests) can be used by modern organisations to limit the implications of
agency conflict (Chen et al., 2015; Liu et al., 2017; Ntim et al., 2015a, 2015b). A number of
previous studies have recognised the importance of controlling for a comprehensive number
of internal CG variables (e.g., board characteristics and shareholding structure mechanisms)
when investigating the association between EP and firm performance (e.g., Newton, 2015;
Liu et al., 2017; Ntim et al., 2015a, b). A major limitation of these studies is that they

19
undermine possible endogeneity concerns of simultaneous use of both CG mechanisms and
EP to mitigate agency problems (Chen et al., 2015; Ntim et al., 2015a, b). Thus, this study
conducts regression analysis containing interaction terms between performance measures
(i.e., Tobin‘s Q) and gender, nationality and ethnicity board diversity variables.
Many scholars have documented the importance of the boardroom monitoring role in
enhancing the link between EP and corporate performance (e.g., Adams & Ferreira, 2009;
Conyon & He, 2011; Liu et al., 2017; Vieito, 2012). For example, Conyon and He (2011),
using 1,342 publicly listed Chinese firms from 2001 to 2005, find evidence that firms with
more independent directors on the board have a higher pay-for-performance link. Adams and
Ferreira (2009) document that directors on gender-diversed boards receive comparatively
more equity-based compensation, which provides more performance-based incentives. They
also cite empirical evidence from the US that, in boards with more female directors, poor
stock return performance increases the likelihood of CEO turnover. In addition, Vieito (2012)
finds that smaller differences in the total compensation gap between CEO and vice-presidents
(VPs) are associated with better performance in US firms managed by a female CEO. Given
the previous theoretical and empirical literature, the fourth hypothesis is as follows:
Hypothesis 4 Board diversity moderates the association between executive pay and
performance, with the pay-for-performance sensitivity being stronger (weaker) in firms with
more diversed (less diversed) boards.
5. RESEARCH DESIGN
Our sample is based on 494 non-financial corporations listed on the national stock exchanges
of Egypt, Jordan, Oman, Saudi Arabia (SA) and United Arab of Emirates (UAE) (143, 121,
71, 112, and 47, respectively), with data for the years 2009 to 2014, as of 31 December 2014.

20
Because traditional manual content analysis consumes a considerable amount of time and
effort, and in line with similar past disclosure studies (Barako et al., 2006; Anifowose et al.,
2017), we collected data on 600 firm year observations from 100 corporations, employing the
widely used stratified sampling technique based on firm size and industry in each country1.
Financial and utility firms are excluded from the sample selection due to their different
capital structure and regulatory issues (Gyapong et al., 2016; Ntim, 2015). CG variables (i.e.,
board characteristics and shareholding structure mechanisms) were collected from the
sampled firms‘ annual reports and capital markets websites. Financial and accounting
variables were collected from the Datastream database. Finally, country-level data, including
GDP and Control of Corruption Index, were collected from the website of the World Bank,
while the Inflation Index came from the International Monetary Fund‘s website.
Two criteria have been used in order to include corporations in the final sample: the
accessibility of an organisation‘s CG data for the six-year period from 2009 to 2014; and the
availability of financial data for the same time period. These criteria have been used for the
following reasons. First, it helps in satisfying the requirements for a balanced panel data
analysis (Carter et al., 2003; Yermack, 1996). This panel data structure is characterised by its
ability to provide a greater degree of freedom, lower multicollinearity among examined
variables (Gujarati, 2003; Wooldridge, 2010), opportunity to examine whether the link
between board diversity and corporate outcomes holds over time (Carter et al., 2003, 2010;
Ntim, 2015; Ntim et al., 2012) and opportunity to compare the findings with those of
previous studies (Adams & Ferreira, 2009; Gyapong et al., 2016; Ntim, 2015). DataStream
provides full data for corporate financial performance. However, financial reports do not
identify executives‘ compensation for the whole sample (600 firm-year observations). It
provides data for 534 firm-year observations. Thus, the study employs firm-year observations

21
that could be identified for the executives‘ compensation in order to test Hypothesis 3 and
Hypothesis 4.
The relationship between board characteristics, corporate performance and EP is
jointly and dynamically determined (Guest, 2009). Therefore, a number of endogenous
problems emerge as a result of possible omitted variables that can concurrently impact both
the appointment of women, ethnic minority and foreign directors, and corporate performance
and EP (Adams & Ferreira, 2009). In addition, endogenous problems may arise form
organisational specific characteristics, such as financial leverage, challenges, opportunities
and managerial skills, which change overtime (Adams & Ferreira, 2009; Carter et al., 2010;
Guest, 2009; Ntim et al., 2012). Thus, and given the panel nature of the data, as well as in
line with previous studies (e.g., Adams & Ferreira, 2009; Carter et al., 2010; Guest, 2009;
Gyapong et al., 2016; Ntim, 2015; Salloum et al., 2017), our study estimates a fixed-effects
regression model in order to control for possible omitted variables and unobserved
organisation-specific heterogeneities.2 The fixed-effects regression model employed is
specified as follows:
n
i
itititiitititit CONTROLSDiversityROAQ1
/ (1)
Where Qit is Tobin‘s Q for firm i at time t and ROA is return on assets for firm i at
time t; Diversityit refers to DIV, DIVG, DIVE, or DIVN; Controls stands for BRDS, UBL,
BSH, GSH, ISH, LNTS, LV, AGE, BIG4, GRTH, CCI, INFL, GDP, DIND, DYER; and δ is the
fixed-effects of a vector of the mean differences of all time-variant variables.
For the purpose of examining the moderating effect of the strength of CG on the
relation between different board diversity measures and firm value (Q) and accounting
returns (ROA), the study uses the CG Index (MCGI). The MCGI follows a checklist
developed by the Intergovernmental Working Group of Experts on International Standards of
Accounting and Reporting (ISAR), organised by United Nations Conference Trade and

22
Development (UNCTAD, 2006). This checklist (―UNCTAD ISAR benchmark‖) for good
practice in CG disclosure is based on five sections used to construct five sub-indices: (i)
shareholding structure and exercise of control rights (OSH); (ii) financial transparency (TCY);
(iii) auditing (AUD); (iv) corporate responsibility and compliance (RTY); and (v) board and
management structure and process (BMS). The MCGI is constructed by awarding a value of 1
if each of the 51 CG provisions is disclosed, and 0 otherwise. With this binary scoring
scheme a firm‘s total disclosure score in a particular firm-year can vary between 0 (perfect
non-compliance and non-disclosure) and 100% (perfect compliance and disclosure), with
higher index levels indicating better compliance and disclosure. Following Gyapong et al.
(2016), the MCGI is interacted with each board diversity measure in different regression
estimates of the following fixed-effects regression model:
n
i
itititiititititititit CONTROLSMCGIDiversityMCGIDiversityROAQ1
*/ (2)
The effect of different diversity measures on EP is examined using the following
fixed-effects regression model:
n
i
itititiititit CONTROLSDiversityEPAY1
(3)
Where EPAYit is the natural log of total cash -based pay (base salary, performance
bonus, pension contribution and others) of all executives scaled by the total number of
executives for firm i at time t; Diversityit refers to DIV, DIVG, DIVE, or DIVN; MCGI
denotes CG disclosure; Controls stands for BRDS, UBL, BSH, GSH, ISH, LNTS, LV, AGE,
BIG4, GRTH, CCI, INFL, GDP, DIND, DYER; and δ is the fixed-effects of a vector of the
mean differences of all time-variant variables.
To examine the moderating effect of different diversity variables on the association
between EP and performance, we modify Adams and Ferreira‘s (2009) model and add to it
23
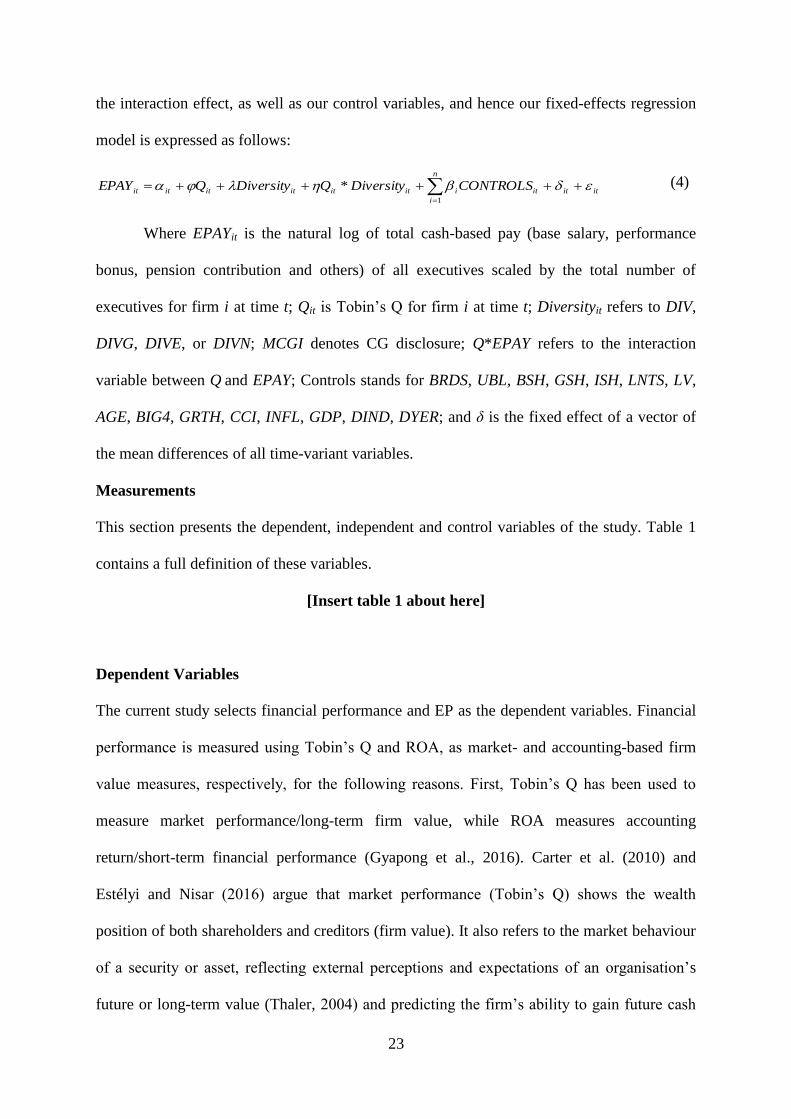
the interaction effect, as well as our control variables, and hence our fixed-effects regression
model is expressed as follows:
n
i
itititiitititititit CONTROLSDiversityQDiversityQEPAY1
* (4)
Where EPAYit is the natural log of total cash-based pay (base salary, performance
bonus, pension contribution and others) of all executives scaled by the total number of
executives for firm i at time t; Qit is Tobin‘s Q for firm i at time t; Diversityit refers to DIV,
DIVG, DIVE, or DIVN; MCGI denotes CG disclosure; Q*EPAY refers to the interaction
variable between Q and EPAY; Controls stands for BRDS, UBL, BSH, GSH, ISH, LNTS, LV,
AGE, BIG4, GRTH, CCI, INFL, GDP, DIND, DYER; and δ is the fixed effect of a vector of
the mean differences of all time-variant variables.
Measurements
This section presents the dependent, independent and control variables of the study. Table 1
contains a full definition of these variables.
[Insert table 1 about here]
Dependent Variables
The current study selects financial performance and EP as the dependent variables. Financial
performance is measured using Tobin‘s Q and ROA, as market- and accounting-based firm
value measures, respectively, for the following reasons. First, Tobin‘s Q has been used to
measure market performance/long-term firm value, while ROA measures accounting
return/short-term financial performance (Gyapong et al., 2016). Carter et al. (2010) and
Estélyi and Nisar (2016) argue that market performance (Tobin‘s Q) shows the wealth
position of both shareholders and creditors (firm value). It also refers to the market behaviour
of a security or asset, reflecting external perceptions and expectations of an organisation‘s
future or long-term value (Thaler, 2004) and predicting the firm‘s ability to gain future cash

24
flows and investment opportunities (Carter et al., 2010). On the other hand, ROA, as a
measure of accounting returns, reflects past or short-term financial performance and
illustrates how efficiently the organisation utilises its assets and investments to generate
earnings (Estélyi & Nisar, 2016). Second, they have been commonly used in literature to
measure financial performance (e.g., Adams & Ferreira, 2009; Carter et al., 2010; Estélyi &
Nisar, 2016; Ntim, 2015), allowing for comparing our findings with those of previous studies.
Executive compensation (EPAY) is measured using the natural log of all executives‘
cash compensation (e.g., salary, bonus and other benefits) scaled by the total number of
executives in a financial year to get an estimate of the average EP. The use of cash
compensation is consistent with previous research (e.g., Conyon & He, 2011; Firth et al.,
2007).
Independent Variables
Literature employs different measures of board diversity (e.g., age, race, gender, educational
background, experience and professional qualifications); the current study uses gender,
nationality and ethnic diversity for two reasons. First, these three measures can be observed
and calculated easily (Carter et al., 2010; Gyapong et al., 2016; Miletkov et al., 2014).
Second, they have been widely investigated (Carter et al., 2003; Estélyi & Nisar, 2016; Ntim,
2015), and therefore, can permit us to compare our results with those of previous studies that
also employed these measures.
Following Adams and Ferreira (2009), Gyapong et al. (2016), Liu et al. (2014) and
Ntim (2015), board diversity is measured using percentage of women, ethnic minority and
foreign directors on the board of directors (DIV). The main independent variable is divided
into the following sub-measures: board diversity on the basis of gender (DIVG); board

25
diversity on the basis of ethnicity (DIVE); and board diversity on the basis of nationality
(DIVN).
Control Variables
Consistent with previous studies (e.g., Carter et al., 2003, 2010; Chamlou, 2008; Dale-Olsen
et al., 2013; Hasan et al., 2014; Ntim, 2015; Salloum et al., 2017), the current study controls
for possible omitted variables bias by including a number of control variables. The study
controls for CG mechanisms that have been examined in previous studies: board
characteristics (e.g., board size and unitary board leadership) and shareholding structure
mechanisms (e.g., block, government, and institutional shareholding). Our study also controls
for firm-level variables that could be related to firm‘s outcome such as firm size, sales
growth, leverage, age and audit quality; and country-level variables such as control of
corruption, inflation and GDP growth (Delis et al., 2016; Miletkov et al., 2014). Finally,
some scholars argue that firm performance and EP may be affected by industry type and time
(e.g., Ntim, 2015; Roberson & Park, 2007). Therefore, we include industry dummies (DIND)
for the eight industries: (i) basic materials, (ii) oil and gas, (iii) consumer goods, (iv)
consumer services, (v) health care, (vi) industrials, (vii) technology and (viii) telecoms; and
year dummies (DYER) for the financial years from 2009 to 2014.
6. EMPIRICAL ANALYSIS AND DISCUSSION
Descriptive Statistics
Table 2 shows the detailed descriptive statistics of the study‘s dependent, independent and
control variables. Panel A reveals the wide variation of different measures of corporate
outcomes. For example, Tobin‘s Q (Q) ranges from 0.08 to 9.07, with an average (standard
deviation) of 1.38 (0.98), which means firm values display wide variation which is consistent

26
with previous studies (e.g., Delis et al., 2016; Salloum et al., 2017). Furthermore, accounting
returns (ROA) ranges from –32.09% to 31.03%, and has a mean (median) of 6.56% (6.11%)
and standard deviation of 7.76%. The average EP records a minimum of $4413.14, maximum
of $3,887,360, mean of $309,054.20 and median of $134,712.24. Similarly this means that
the EPAY is highly varied among firms listed in MENA countries. Panel B illustrates that
board diversity based on gender, nationality and ethnicity (DIV) has widespread variation
ranging from 0% to 76.92%, and averaging of 14.08%. With regard to gender board diversity
(DIVG), the ethnic board diversity (DIVE) and nationality board diversity (DIVN) results
range from 0% to 37.50%, 66.67% and 72.73%, with an average of 2.71%, 5.20% and
11.40%, respectively. The findings document that on average the boards of directors in the
MENA region firms are dominated by Arab males. This low representation of women,
foreigners and non-Arab directors on board rooms is in line with evidence coming from most
developing countries (e.g., Mahadeo et al., 2012; Loukil & Yousfi, 2015; Salloum et al.,
2017).
[Insert table 2 about here]
Moreover, the descriptive statistics for CG variables are illustrated in panel C. Board
size (BRDS) with an average of 8.52 board members ranges between a minimum of four and
a maximum of 19. Panel C also shows that unitary board leadership (UBL) is not common
among sampled firms with average of 21% and median of 0%. Shareholding structure
mechanisms also display an adequate variation, where block shareholding (BSH), government
shareholding (GSH) and institutional shareholding (ISH) range from 5%, 0% and 0% to
98.92%, 98.67% and 98.92% with an average of 55.89%, 16.15% and 34.01%, respectively.
Shareholding statistics are consistent with previous studies conducted in MENA countries
(e.g., Al-Janadi et al., 2013; Samaha et al., 2012). Similarly, the descriptive statistics for firm

27
control variables and country control variables, which are illustrated in Panels D and E,
respectively, display wide variation.
Table 3 presents the correlation matrix (including both Pearson‘s parametric and
Spearman‘s non-parametric bivariate coefficients) among different corporate outcomes
variables, independent and control variables. The correlation analysis (i.e., Person‘s
parametric correlation coefficients only) reveals that Tobin‘s Q positively and significantly
correlates with the percentage of female directors on the board. Additionally, it shows that
ROA has a positive significant correlation with all board diversity measures (DIV, DIVG,
DIVE, and DIVN). EPAY has a positive correlation with DIV and DIVN, while it has a
negative significant correlation with DIVG. In general, the results of the correlation matrix
suggest that different board diversity measures have a significant impact on various corporate
outcomes.
[Insert table 3 about here]
Multivariate Regression Analyses
Fixed-effects regression results of the impact of different board diversity measures on
corporate financial performance, as measured by firm value (Tobin‘s Q) and accounting
returns (ROA), are reported in Table 4. First, to determine the impact of board diversity (DIV)
on corporate performance, the study runs Q on DIV and control variables in Model 1; while,
Model 5 documents the results of regressing ROA on DIV and control variables. These
models show that diversified boards have a positive and significant impact on both firm value
(Q) at 5% level and accounting returns (ROA) at 1% level. These findings provide support for
Hypothesis 1 and are in line with previous studies that have investigated the impact of board
diversity on Q and/or ROA (e.g., Erhardt et al., 2003; Ntim, 2015; Salloum et al., 2017;
Wellalage and Locke, 2013). This evidence is consistent with the theoretical predictions of
agency theory (Abdullah, 2014; Adams & Ferreira, 2009; Carter et al., 2003; Van der Walt &

28
Ingley, 2003) and resource dependence theory (Loukil & Yousfi, 2016; Mahadeo et al., 2011;
Salloum et al., 2017), suggesting that board diversity based on gender, ethnic and nationality
enhances board independence and monitoring function, and helps companies to gain
legitimacy, contacts and investment opportunities. Diversified boards also provide expertise,
knowledge and opinions that improve decision making effectiveness and hence financial
performance.
[Insert table 4 about here]
Second, Models 2 and 6 illustrate that board diversity measured on the basis of gender
(DIVG) similarly has a positive and significant effect on firm value (Q) at 1% level and
accounting returns (ROA) at 5% level, providing further support for Hypothesis1 and similar
findings of previous studies (e.g., Adams & Ferreira, 2009; Gyapong et al., 2016; Luckerath-
Rovers, 2013; Ntim, 2015; Salloum et al., 2017; Terjesen et al., 2015; Wellalage & Locke,
2013). These findings are consistent with the theoretical predictions of agency theory that
female directors are more likely to provide better monitoring function compared to male
directors (Adams & Ferreira, 2009), and resource dependence theory, which predicts that
appointing female directors can improve firm legitimacy and provides firms with more
capital inflows, investment opportunities, government support and community acceptance
(Loukil & Yousfi, 2016; Mahadeo et al., 2011)
Third, to examine the effect of ethnic minority board members (non-Arab) on firm
value (Q) and accounting returns (ROA), the study regresses DIVE on Q and ROA by re-
estimating equation (1). The results reported in Models 3 and 7 indicate that board diversity
measured on the basis of ethnicity (DIVE) has an insignificant impact on firm value (Q) and
accounting returns (ROA). The results are in line with previous studies that have documented
no relationship between appointing ethnic minority directors and different measures of
corporate financial performance (Carter et al. 2010). Fourth, equation (1) was re-estimated by

29
regressing DIVN on firm value (Q) and accounting returns (ROA) including control variables,
in order to examine the impact of appointing foreign directors on corporate financial
performance. Findings stated in Model 4 document no relationship between national board
diversity and firm value Q, while the positive significant impact of foreign directors on
accounting returns is illustrated in Model 8 at 10% level. This finding supports Hypothesis 1
and in line with resource dependence theory and previous studies which have suggested that
appointing directors with diverse nationalities brings different perspectives and contacts to
the board and facilitates access to different national and international markets that enhance
the geographic and product diversification, and thereby improves corporate financial
performance (Estélyi & Nisar, 2016; Mahadeo et al., 2011; Miletkov et al., 2014). Finally,
with regard to control variables, results reported in Models 1 to 4 show that institutional
shareholding and auditor size have a positive and significant impact on firm market value,
while block shareholding and inflation have a negative and significant effect on firm market
value. On the other hand and with reference to the results reported in Models 5 to 8, there is a
positive and significant association between firm size, age, sales growth and accounting
returns (ROA). However, the results indicate that firms with unitary board leadership, high
leverage and listed in countries with high GDP have lower ROA.
Table 5 shows the fixed-effects regression results of the moderating effect of CG
strength on the association between different diversity measures and firm value (Q) and
accounting returns (ROA). We run Q and ROA separately on different board diversity
measures, MCGI, interaction of different diversity measures and MCGI, and control
variables. With reference to the interaction variables, the evidence generally indicates
significant positive relationship between interaction variables (Diversity*MCGI) and Q and
ROA in Models 1, 2, 5 and 6, which appear to be consistent with Hypothesis 2. The results of
the interaction variables indicate statistically significant and positive effect of the interaction

30
variables on Q and ROA for DIV and DIVG which indicates that, in well-governed firms, the
increased monitoring effort provided by highly diversified boards and diversified boards on
the basis of gender impact firm market value (Q) and accounting returns (ROA) positively.
Accordingly, the results are consistent with those of Gyapong et al. (2016), which suggest
that board diversity complements other CG measures in monitoring firms especially in
developing countries with weak external corporate regulatory environment, weak legal
enforcement and inadequate external discipline by the market for corporate control.
[Insert table 5 about here]
Models 1 to 4 in Table 6 show the fixed-effects regression results of the influence of
different diversity measures on EP. The findings reported in Models 1 to 4 suggest that
different measures of board diversity (DIV, DIVG, DIVE and DIVN) have no significant
impact on EP. These results do not support Hypothesis 3, but are consistent with findings of
Adams and Ferreira (2009) that document that gender diversified boards are less likely to
impact CEO pay due to lower representation of female directors in compensation committees.
With regard to control variables, Models 1 to 4 document that inflation impact EP negatively
and significantly, while unitary board leadership, firm size and GDP have a positive and
significant relationship with EP.
[Insert table 6 about here]
Models 6 to 9 in Table 6 present the fixed-effects regression results of the moderating
effect of different measures of diversity on the relationship between EP and performance.
Model 5 shows the fixed-effects regression results of the EPAY on corporate performance (Q)
and control variables in order to determine the PPS. The results suggest that there is a
positive and significant association between corporate performance and EP in MENA
countries. This result is consistent with OCT which argues that, as executives are less
involved in determining their own pay, a positive and strong association exists between EP

31
and performance. The results reported in Models 6 to 9 show that the coefficients of Q on
EPAY are positive and statistically significant. Crucially, it is clearly observable from the
results that the PPS has noticeably improved, suggesting that board diversity based on
gender, ethnic minority and nationality moderate the PPS. The coefficient of Q has increased
from .058 (.025) in Model 5 to .064 (.030), .070 (.014), .078 (.009) and .064 (.019) in Models
6 to 9, respectively, supporting Hypothesis 4. This means that the PPS being stronger in firms
with greater gender, ethnicity and nationality diversed boards. The findings are in line with
predictions of OCT that board diversity can enhance firm value by linking EP to performance
(Conyon, 2014; Edmans and Gabaix, 2009).
Robustness Checks
We conduct a number of additional analyses in order to test the robustness of our findings.
First, we examine the relationship between corporate financial performance and the number
of female directors within boardrooms.3 Results reported in Models 1 to 6 in Table 7 show
that appointing one female director (GEN_1) has a positive and significant impact on firm
value (Q) (.341 (.004)). This finding supports that one woman appointed to corporate boards
increases firm legitimacy, public image and shareholders‘ representation (Jamali et al. 2007;
Loukil & Yousfi 2016). However, increasing the number of female directors to more than
two (GEN_3) have a positive and significant impact on accounting returns (ROA) which
supports the critical mass theory.
[Insert table 7 about here]
Second and following literature (e.g., Faleye et al., 2011; Gul et al., 2011; Liu et al.,
2014; Ntim, 2015), the association between board diversity and financial performance was re-
investigated using market-to-book (MTB) and return on equity (ROE) as alternative market
value and accounting return measures, respectively. The results in Models 7 and 8 in Table 7

32
illustrate that, board diversity has a positive and significant relationship with MTB and ROE,
respectively. Third, we investigate the non-linear relationship between board diversity and
corporate performance. Our results support a probable concave relationship between DIV, Q
and ROA, and consistent with findings of Gyapone et al. (2016) and Roberson and Park
(2007).
Fourth, following Carter et al. (2003, 2010), Gyapong et al. (2016) and Louki and
Yousfi (2016), we employ alternative measures of board diversity. Our results reported in
Models 1 to 4 in Table 8 are fairly robust to the use of the number of diversified directors
(DIV_NO) or board diversity dummy measure (DIV_DU), instead of percentage of diversified
directors on the board (DIV). Fifth, following Ntim (2015) and Salloum et al. (2017), a one
year lag between board diversity and firm performance (Q and ROA) was introduced. Our
findings are largely robust when estimating a lagged board diversity. Finally, we apply the
two-stage least squares (2SLS) technique (Beiner et al., 2006; Carter et al., 2003, 2010; Ullah
et al., 2018b).4 Overall, the robustness analyses indicate that our results are fairly robust to
alternative checks.
[Insert table 8 about here]
7. SUMMARY AND CONCLUSION
Although a number of previous studies have investigated the extent to which corporate board
diversity affects financial performance and EP in different countries around the world, such
evidence in MENA countries is under-researched. This might have been justified in the past,
as in most MENA countries; there was a rare opportunity for women to be appointed into
corporate boards. Recent reforms pursued in different MENA countries have, however,
witnessed a gradual increase in women‘s presence on corporate boards. Consequently, we
have examined the effect of corporate board diversity on both corporate performance and EP.
Hence, we contribute to the literature by ascertaining whether: (i) corporate board diversity,

33
as measured by gender, ethnicity and nationality, affects corporate financial performance; (ii)
CG quality moderates the relationship between corporate board diversity and corporate
financial performance; (iii) corporate board diversity influences EP; and (iv) corporate board
diversity moderates the PPS.
We find a wide variation of board diversity on the basis of gender, nationality and
ethnicity, ranging from 0% to 76.92%, with an average of 14.08%. This indicates that most
boards of MENA listed firms are dominated by Arab males. Empirically, we detect a positive
and significant impact of diversed boards, based on gender, nationality and ethnicity, on
corporate financial performance. In particular, appointing female directors improves firm
market value and accounting returns, while foreign directors have a positive and significant
effect on firm accounting returns. Third, we find empirical evidence that shows that CG
quality has a moderating effect on the link between board diversity and corporate financial
performance. This implies that the positive impact of board diversity on corporate financial
performance is more observable in better governed firms. Finally, our evidence shows that
board diversity has a moderating effect on the PPS, but not actual EP.
Our research has a number of important implications for board diversity literature.
First, although most studies have investigated the impact of board diversity on corporate
financial performance (Campbell and Minguez-Vera, 2008; Carter et al., 2006, 2010;
Luckerath-Rovers, 2013; Gyapong et al., 2015; Ntim, 2015), a limited number have
examined the association between board diversity and EP (e.g., Adams and Ferreira, 2009;
Vieito, 2012). Our research findings shed light on the impact of corporate board diversity on
different aspects of corporate outcomes, including financial performance, EP and PPS.
Second, our research offers new critical insights on the impact of board diversity based on
gender, ethnicity and nationality on corporate outcomes. While, the majority of previous
studies have investigated the impact of board gender diversity on corporate outcomes (Carter
34
et al., 2010; Ntim, 2015), our results suggest that ethnic, national and gender diversity are
dissimilar phenomena, and they will impact corporate outcomes in different ways (Carter et
al., 2010; Gyapong et al., 2016; Ntim, 2015). Finally, our study differentiates itself for most
previous studies investigating the association between corporate board diversity, and
financial performance and EP (Adams and Ferreira, 2009; Carter et al., 2003; Carter et al.,
2010; Rose, 2007), by examining a sample of MENA countries.
Our findings have several practical implications. First, the under-representation of
women on corporate boards in MENA countries is influenced by the glass ceiling hypothesis
(Jamali et al., 2007; Loukil & Yousfi, 2015), and hence, governments in developing countries
should issue regulations and/or recommendations, in line with international CG best
practices, in order to address the weak representation of women in top management and
corporate board level positions. Our results suggest that decisions about board diversity are
not merely influenced by moral values; they arise because of the cost-benefit considerations
of what diversity can bring to the firm. Second, our evidence encourages firms in developing
countries to employ female, ethnicity minority and foreign directors in order to enhance
corporate financial performance and PPS.
Although our results are robust, their limitations need to be clearly acknowledged.
First and like all archival research of this nature, the proxies for board diversity, CG,
performance and EP may or may not reflect what happens in practice. Second and due to the
hand-collection of data, the final sample used was relatively small. Thus, future studies might
use a larger sample with a view to further enhancing the generalisability of their results.
Third, future studies may offer new insights by conducting in-depth case studies based on
interviews and other qualitative approaches to research. Finally, given the unavailability of
data on different features of boards of directors, this study focused on ethnicity, gender and
nationality aspects of board diversity. As more data becomes available, future studies may

35
offer new insights by examining how other aspects of board diversity that may have a
significant impact on corporate outcomes, such as educational background, age, experience
and professional qualifications. Future studies can also examine the impact of board diversity
on different corporate outcomes, such as earnings management, corporate social
responsibility and corporate disclosures.
ENDNOTES
1. The choice of the selected five countries is to satisfy three main criteria. First, in order to ensure data
availability and sample homogeneity, some filtering rules were applied. Accordingly, some countries were
excluded from the sample. For example, Bahrain and Qatar were dropped because their firms capital
markets include mostly financial and investment corporations. Countries with non-active stock markets
(such as, Iraq and Libya) and did not issue governance code (such as, Kuwait) were excluded. Second, the
selected countries should reflect the diversity in MENA countries in order to support the generalisation of
the results. Specifically, from a capital perspective, whereas Saudi Arabia and the UAE are net capital
exporting countries, Egypt and Jordan are considered net capital importing countries (Piesse et al., 2012).
Oman was the first country in the MENA region to issue its national governance code in 2002. The final
selected five countries account for over 58% of the MENA stock market capitalization in 2014. Finally, the
selected countries share a number a common characteristics: (i) they are all have similar accounting,
governance, and legal systems which are derived from the Anglo–Saxon system; and (ii) they have similar
cultural characteristics (e.g., a strong hierarchical social structure, importance of personal relationships,
religion, accountability and trust), corporate law and shareholding structures (concentrated shareholding
dominated by the state and powerful families); thereby permitting comparability of governance and
corporate reporting quality among firms and across countries.
2. In order to determine the suitable panel estimation technique (Gujarati, 2003; Wooldridge, 2010), we first
conduct the Breusch and Pagan (1980) LM test. The result of the test rejects the null hypothesis of the
existence of zero variance across entities. Thus, OLS is inappropriate technique to test the hypothesis.
Second, we test whether the individual effects are correlated with the repressors by performing Hausman
(1978) test and the findings reject the null hypothesis, supporting the appropriateness of the fixed-effects
model for the study.
3. Following, Gyapong et al. (2016), Liu et al. (2014) and Salloum et al. (2017), equation (1) was re-estimated
using the following dummies; GEN_1 refers to a dummy variable equal to 1 if a firm has one female
director on the board, otherwise 0; GEN_2 refers to a dummy variable equal to 1 if a firm has two female
directors on the board, otherwise 0; GEN_3 refers to a dummy variable equal to 1 if a firm has three or
more female directors on the board, otherwise 0.
4. To make sure that the 2SLS research design is appropriate, and in line with Beiner et al. (2006), we first
carry out Durbin-Wu-Hausman exogeneity test to determine whether DIV is endogenously associated with
Q and ROA. Applied to equation (1), the test rejects the null hypothesis of exogeneity, and therefore we
conclude that the 2SLS technique may be appropriate. In the first stage, we conjecture that DIV will be
determined by all the control (exogenous) variables specified in equation (1). In the second stage, we utilise
the predicted portion of DIV as an instrument for DIV and re-estimate equation (1).
References
Abdullah, S. N. (2014). The causes of gender diversity in Malaysian large firms. Journal of
Management & Governance, 18(4), 1137-1159.
Acemoglu, D., Hassan, T.A., & Tahoun, A. (2017). The power of the street: Evidence from
egypt‘s arab spring. The Review of Financial Studies, 31(1), 1-42.

36
Adams, R. B., & Ferreira, D. (2007). A theory of friendly boards. Journal of Finance, 62(1),
217-250.
Adams, R. B., & Ferreira, D. (2009). Women in the boardroom and their impact on
governance and performance. Journal of Financial Economics, 94(2), 291-309.
Al-Bassam, W. M., Ntim, C. G., Opong, K. K., & Downs, Y. (2018). Corporate Boards and
Ownership Structure as Antecedents of Corporate Governance Disclosure in Saudi
Arabian Publicly Listed Corporations. Business & Society, 57(2), 335–377.
Anifowose, M., Abdul Rashid, H. M., & Annuar, H. A. (2017). Intellectual capital disclosure
and corporate market value: does board diversity matter?. Journal of Accounting in
Emerging Economies, 7(3), 369-398.
Barako, D. G., Hancock, P., & Izan, H. Y. (2006). Factors influencing voluntary corporate
disclosure by Kenyan companies Corporate Governance: An International Review, 14(2),
107-125.
Baranchuk, N., & Dybvig, P. H. (2009). Consensus in diverse corporate boards. Review of
Financial Studies, 22(2), 715-747.
Baysinger, B. D., & Butler, H. N. (1985). Corporate governance and the board of directors:
Performance effects of changes in board composition. Journal of Law, Economics, &
Organization, 1(1), 101-124.
Baysinger, B., & Hoskisson, R. E. (1990). The composition of boards of directors and
strategic control: Effects on corporate strategy. Academy of Management Review, 15(1),
72-87.
Bebchuk, L. A., Fried, J. M., & Walker, D. I. (2002). Managerial power and rent extraction in
the design of executive compensation. University of Chicago Law Review, 69, 751–846.
Bebchuk, L.A., & Fried, J.M. (2004). Pay without performance: The unfulfilled promise of
executive compensation. Cambridge, MA: Harvard University Press.
Beiner, S., Drobetz, W., Schmid, M. M., & Zimmermann, H. (2006). An integrated framework of
corporate governance and firm valuation. European Financial Management, 12(2), 249-283.
Breusch, T. S., & Pagan, A. R. (1980). The Lagrange multiplier test and its applications to
model specification in econometrics. Review of Economic Studies, 47(1), 239-253.
Burgess, Z., & Tharenou, P. (2002). Women board directors: Characteristics of the few.
Journal of Business Ethics, 37(1), 39-49.
Bussiere, M., & Mulder, C. (2000). Political instability and economic
vulnerability. International Journal of Finance & Economics, 5(4), 309-330.
Byron, K., & Post, C. (2016). Women on Boards of Directors and Corporate Social
Performance: a Meta‐Analysis. Corporate Governance: An International Review, 24(4),
428-442.
Campbell, K., & Mínguez-Vera, A. (2008). Gender diversity in the boardroom and firm
financial performance. Journal of Business Ethics, 83(3), 435-451.
Carter, D. A., D'Souza, F., Simkins, B. J., & Simpson, W. G. (2010). The gender and ethnic
diversity of US boards and board committees and firm financial performance. Corporate
Governance: An International Review, 18(5), 396-414.
Carter, D. A., Simkins, B. J., & Simpson, W. G. (2003). Corporate governance, board
diversity, and firm value. Financial review, 38(1), 33-53.
Castrillo, L. A., Marcos, S., & San Martin, J. M. (2010). Corporate governance, legal investor
protection, and performance in Spain and the United Kingdom. Corporate Ownership and
Control, 7(3), 416-429.

37
Chamlou, N. (2008). The Environment for Women's Entrepreneurship in the Middle East and
North Africa. Orientations in Development Series. Washington, DC: World Bank.
https://openknowledge.worldbank.org/handle/10986/6479 License: Creative Commons
Attribution CC BY 3.0.”
Chen, S., Lin, B., Lu, R., & Zhang, T. (2015). Controlling shareholders‘ incentives and
executive pay-for-performance sensitivity: Evidence from the split share structure reform
in China. Journal of International Financial Markets, Institutions and Money, 34, 147-
160.
Chen, Y., & Jermias, J. (2014). Business strategy, executive compensation and firm
performance. Accounting & Finance, 54(1), 113-134.
Conyon, M. J. (2014). Executive compensation and board governance in US firms. The
Economic Journal, 124(574), F60-F89.
Conyon, M. J., & He, L. (2011). Executive compensation and corporate governance in
China. Journal of Corporate Finance, 17(4), 1158-1175.
Dale-Olsen, H., Schone, P., & Verner, M. (2013). Diversity among Norwegian boards of
directors: Does a quota for women improve firm performance?. Feminist Economics, 19(4),
110-135.
Delis, M. D., Gaganis, C., Hasan, I., & Pasiouras, F. (2016). The effect of board directors
from countries with different genetic diversity levels on corporate
performance. Management Science, 63(1), 231-249.
Edmans, A., & Gabaix, X. (2009). Is CEO pay really inefficient? A survey of new optimal
contracting theories. European Financial Management, 15(3), 486-496.
Elkinawy, S., Stater, M. (2011). Gender differences in executive compensation: Variation
with board gender composition and time. Journal of Economics and Business, 63(1), 23-
45.
Erhardt, N. L., Werbel, J. D., & Shrader, C. B. (2003). Board of director diversity and firm
financial performance. Corporate Governance: An International Review, 11(2), 102-111.
Estélyi, K. S., & Nisar, T. M. (2016). Diverse boards: Why do firms get foreign nationals on
their boards?. Journal of Corporate Finance, 39, 174-192.
European Union (2012). Women in economic decision-making in the EU: progress report. A
Europe 2020 initiative, Commission Staff Working Document, Luxembourg.
Falato, A., & Kadyrzhanova, D., Lel, U. (2014). Distracted directors: Does board busyness
hurt shareholder value?. Journal of Financial Economics, 113(3), 404-426.
Faleye, O., Hoitash, R., & Hoitash, U. (2011). The costs of intense board monitoring. Journal
of Financial Economics, 101(1), 160-181.
Fama, E. F., & Jensen, M. C. (1983). Separation of ownership and control. The Journal of
Law & Economics, 26(2), 301-325.
Field, L., Lowry, M., & Mkrtchyan, A. (2013). Are busy boards detrimental?. Journal of
Financial Economics, 109(1), 63-82.
Firth, M., Fung, P. M., & Rui, O. M. (2007). How ownership and corporate governance influence
chief executive pay in China's listed firms. Journal of Business Research, 60(7), 776-785.
Goergen, M., & Renneboog, L. (2011). Managerial compensation. Journal of Corporate
Finance, 17(4), 1068-1077.
Gregory‐Smith, I., Main, B. G., & O'Reilly, C. A. (2014). Appointments, pay and
performance in UK boardrooms by gender. The Economic Journal, 124(574), 109-128.
Grosvold, J., Rayton, B., & Brammer, S. (2016). Women on corporate boards: A comparative
institutional analysis. Business & Society, 55(8), 1157-1196.

38
Guest, P. M. (2009). The impact of board size on firm performance: evidence from the
UK. The European Journal of Finance, 15(4), 385-404.
Gul, F. A., Srinidhi, B., & Ng, A. C. (2011). Does board gender diversity improve the
informativeness of stock prices?. Journal of Accounting and Economics, 51(3), 314-338.
Gupta, S., Baldacci, E., Clements, B., & Tiongson, E.R., (2005). What sustains fiscal
consolidations in emerging market countries?. International Journal of Finance &
Economics, 10(4), 307-321.
Gyapong, E., Monem, R. M., & Hu, F. (2016). Do Women and Ethnic Minority Directors
Influence Firm Value? Evidence from Post‐Apartheid South Africa. Journal of Business
Finance & Accounting, 43(3-4), 370-413.
Hasan, I., Kobeissi, N., & Song, L. (2014). Corporate governance, investor protection, and
firm performance in MENA countries. Middle East Development Journal, 6(1), 84-107.
Hassan, R. (1994). Women‘s interpretation of Islam. In H. Thijssen (Ed.), Women and Islam in
Muslim societies. The Hague: Ministry of Foreign Affairs Poverty and Development Program.
Hausman, J. (1978). Specification tests in econometrics. Econometrica, 46, 1251–1271.
Hegland, M. E. (2018). Gender and religion in the Middle East and South Asia: Women‘s
voices rising. In A Social History of Women and Gender in the Modern Middle East, 177-
212. Routledge.
Hodler, R., 2018. The political economics of the Arab Spring. Economic Inquiry, 56(2), 821-
836.
Hussain, A. (1987). Status of women in Islam. Lahore: Law Publishing Company.
Ibn Majah. (1952). Sunan Ibn Majah. Cairo: Dar Ihya‘ al Kutub al Arabiyah.
Jamali, D., Safieddine, A., Daouk, M. (2007). Corporate governance and women: an empirical
study of top and middle women managers in the Lebanese banking sector. Corporate
Governance: The International Journal of Business in Society, 7(5), 574-585.
Jensen, M. C. (1993). The modern industrial revolution, exit, and the failure of internal
control systems. The Journal of Finance, 48(3), 831-880.
Jensen, M. C., & Meckling, W. H. (1976). Theory of the firm: Managerial behaviour, agency
costs and ownership structure. Journal of Financial Economics, 3(4), 305–360.
Kamrava, M. (2012). The Arab Spring and the Saudi-led counterrevolution. Orbis, 56(1), 96-
104.
Khalil, M., Ozkan, A. (2016). Board Independence, Audit Quality and Earnings
Management: Evidence from Egypt. Journal of Emerging Market Finance, 15(1), 84-118.
Klapper, L. F., & Love, I. (2004). Corporate governance, investor protection, and
performance in emerging markets. Journal of Corporate Finance, 10(5), 703-728.
La Porta, R., Lopez-de-Silanes, F., Shleifer, A., & Vishny, R. (2000). Investor protection and
corporate governance. Journal of Financial Economics, 58(1), 3-27.
Lewis, B. 1995. The middle east. London: Weidenfeld & Nicolson.
Liu, Y., Padgett, C. & Varotto, S. (2017). Corporate governance, bank mergers and executive
compensation. International Journal of Finance & Economics, 22(1), 12-29.
Liu, Y., Wei, Z., & Xie, F. (2014). Do women directors improve firm performance in
China?. Journal of Corporate Finance, 28, 169-184.
Loukil, N., & Yousfi, O. (2016). Does gender diversity on corporate boards increase risk‐taking?. Canadian Journal of Administrative Sciences, 33, 66–81.
Luckerath-Rovers, M. (2013). Women on boards and firm performance. Journal of
Management & Governance, 17(2), 491-509.

39
Mahadeo, J. D., Soobaroyen, T., & Hanuman, V. O. (2012). Board composition and financial
performance: Uncovering the effects of diversity in an emerging economy. Journal of
Business Ethics, 105(3), 375-388.
Mernissi, F. (1991). Women and Islam: An historical and theological enquiry. Oxford:
Blackwell.
Metcalfe, B. D. (2007). Gender and human resource management in the Middle East. The
International Journal of Human Resource Management, 18(1), 54-74.
Miletkov, M. K., Poulsen, A. B., & Wintoki, M. B. (2014). A multinational study of foreign
directors on non-US corporate boards. Available at: http://ssrn.com/abstract=2024655.
Monks, R. A. G., & Minow, N. (1995). Corporate Governance. Cambridge, MA: Blackwell
Business.
Newton, A. N. (2015). Executive compensation, organizational performance, and governance
quality in the absence of owners. Journal of Corporate Finance, 30, 195-222.
Ntim, C. G. (2015). Board diversity and organizational valuation: unravelling the effects of
ethnicity and gender. Journal of Management & Governance, 19(1), 167-195.
Ntim, C. G., Lindop, S., Osei, K. A., & Thomas, D. A. (2015a). Executive compensation,
corporate governance and corporate performance: a simultaneous equation approach.
Managerial and Decision Economics, 36(2), 67-96.
Ntim, C. G., Lindop, S., Thomas, D. A., Abdou, H., & Opong, K. K. (2017). Executive pay and
performance: the moderating effect of CEO power and governance structure. The
International Journal of Human Resource Management.
doi.org/10.1080/09585192.2017.1282532.
Ntim, C. G., Opong, K. K., & Danbolt, J. (2012). The relative value relevance of shareholder
versus stakeholder corporate governance disclosure policy reforms in South
Africa. Corporate Governance: An International Review, 20(1), 84-105.
Ntim, C. G., Opong, K. K., & Danbolt, J. (2015b). Board size, corporate regulations and firm
valuation in an emerging market: a simultaneous equation approach. International Review
of Applied Economics, 29(2), 194-220.
Piesse, J., Strange, R., & Toonsi, F. (2012). Is there a distinctive MENA model of corporate
governance?. Journal of Management & Governance, 16(4), 645-681.
Roberson, Q. M., & Park, H. J. (2007). Examining the link between diversity and firm
performance the effects of diversity reputation and leader racial diversity. Group &
Organization Management, 32(5), 548-568.
Rose, C. (2007). Does female board representation influence firm performance? The Danish
evidence. Corporate Governance: An International Review, 15(2), 404-413.
Samaha, K., Dahawy, K., Hussainey, K., & Stapleton, P. (2012). The extent of corporate
governance disclosure and its determinants in a developing market: The case of Egypt.
Advances in Accounting, 28(1), 168-178.
Salloum, C., George, J., and Catherine M. (2017). Democracy across Gender Diversity and
Ethnicity of Middle Eastern SMEs: How Does Performance Differ?. Journal of Small
Business Management.
Sealy, R., Vinnicombe, S., & Singh, V. (2008). The Female FTSE Report 2008. A decade of
delay. International Center for Women Leaders, Cranfield School of Management.
Shleifer, A., & Wolfenzon, D. (2002). Investor protection and equity markets. Journal of
Financial Economics, 66(1), 3-27.
Smith, P. A. (2009). Gulf aims to take lead in corporate governance. Middle East, 396: 52-56.

40
Stulz, R. (1988). Managerial control of voting rights: Financing policies and the market for
corporate control. Journal of Financial Economics, 20, 25-54.
Swamy, V., & Dharani, M. (2018). An alternate approach in exploring the causal link
between financial development and economic growth—Evidence from advanced
economies. International Journal of Finance & Economics, 23(1), 55-76.
Syed, J., Ali, F., & Winstanley, D. (2005). In pursuit of modesty: contextual emotional labour
and the dilemma for working women in Islamic societies. International Journal of Work
Organisation and Emotion, 1(2), 150-167.
Syed, J., & Van Buren, H. J. (2014). Global business norms and Islamic views of women‘s
employment. Business Ethics Quarterly, 24(2), 251-276.
Terjesen, S., Aguilera, R. V., & Lorenz, R. (2015). Legislating a woman‘s seat on the board:
Institutional factors driving gender quotas for boards of directors. Journal of Business
Ethics, 128(2), 233-251.
Terjesen, S., & Sealy, R. (2016). Board Gender Quotas: Exploring Ethical Tensions From A
Multi-Theoretical Perspective. Business Ethics Quarterly, 26(1), 23-65.
Terjesen, S., Sealy, R., & Singh, V. (2009). Women directors on corporate boards: A review
and research agenda. Corporate Governance: An International Review, 17(3), 320-337.
Terjesen, S., & Singh, V. (2008). Female presence on corporate boards: A multi-country
study of environmental context. Journal of Business Ethics, 83(1), 55-63.
Thaler, R. (2004). Advances in behavioral finance. New York, NY: Russell Sage Foundation.
Tharenou, P., Latimer, S., & Conroy, D. (1994). How do you make it to the top? An
examination of influences on women's and men's managerial advancement. Academy of
Management Journal, 37(4), 899-931.
Ujunwa, A. (2012). Board characteristics and the financial performance of Nigerian quoted firms.
Corporate Governance: The International Journal of Business in Society, 12(5), 656-674.
Ullah, S., Ahmad, S., Akbar, S., & Kodwani, D. (2018a). International Evidence on the
Determinants of Organizational Ethical Vulnerability. British Journal of Management. In
Press
Ullah, S., Akhtar, P., & Zaefarian, G. (2018b). Dealing with endogeneity bias: The generalized
method of moments (GMM) for panel data. Industrial Marketing Management, 71, 69-78.
UNDP (United Nations Development Programme). (2010). The Real Wealth of Nations:
Pathways to Human Development. 20th Anniversary Ed. Human Development Report 2010,
New York.
Van Der Walt, N., & Ingley, C. (2003). Board dynamics and the influence of professional
background, gender and ethnic diversity of directors. Corporate Governance: An
International Review, 11(3), 218-234.
Van Essen, M., Otten, J., & Carberry, E. J. (2015). Assessing managerial power theory: A
meta-analytic approach to understanding the determinants of CEO compensation. Journal
of Management, 41(1), 164-202.
Vieito, J. P. T. (2012). Gender, top management compensation gap, and company
performance: Tournament versus behavioral theory. Corporate Governance: An
International Review, 20(1), 46-63.
Walt, N., & Ingley, C. (2003). Board dynamics and the influence of professional background,
gender and ethnic diversity of directors. Corporate Governance: An International
Review, 11(3), 218-234.
Wang, T., Song, M., & Zhao, Y. L. (2014). Legitimacy and the value of early
customers. Journal of Product Innovation Management, 31(5), 1057-1075.
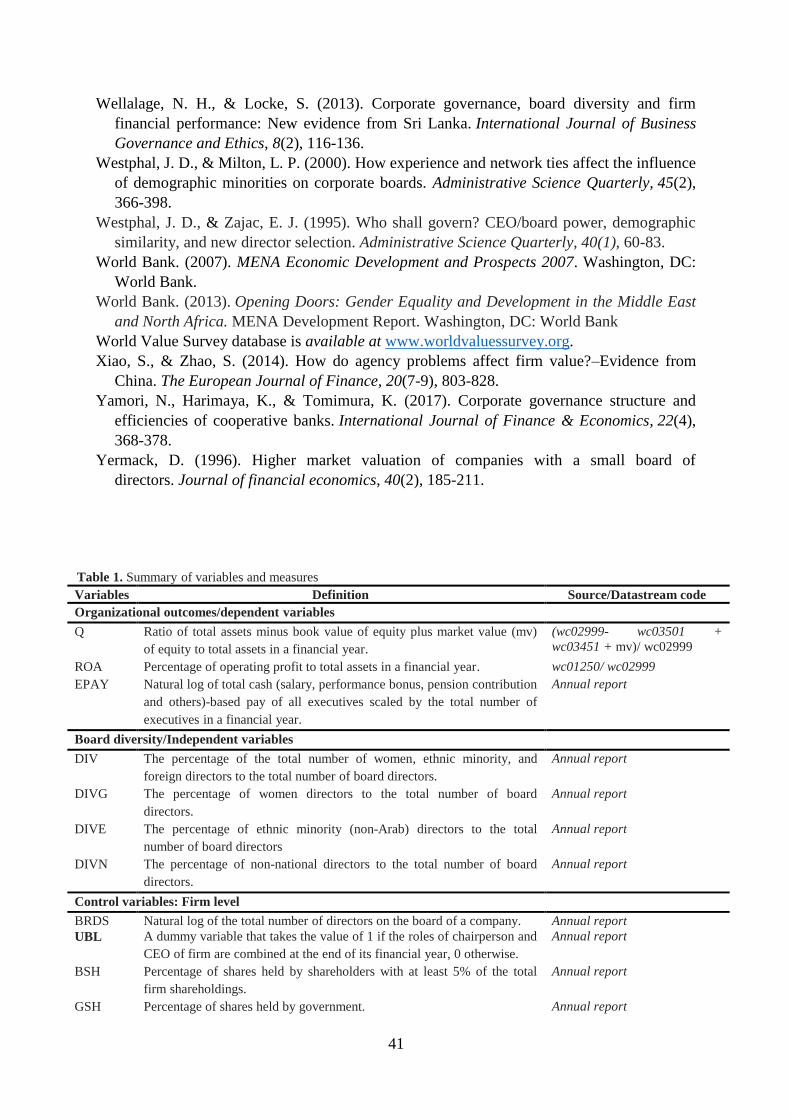
41
Wellalage, N. H., & Locke, S. (2013). Corporate governance, board diversity and firm
financial performance: New evidence from Sri Lanka. International Journal of Business
Governance and Ethics, 8(2), 116-136.
Westphal, J. D., & Milton, L. P. (2000). How experience and network ties affect the influence
of demographic minorities on corporate boards. Administrative Science Quarterly, 45(2),
366-398.
Westphal, J. D., & Zajac, E. J. (1995). Who shall govern? CEO/board power, demographic
similarity, and new director selection. Administrative Science Quarterly, 40(1), 60-83.
World Bank. (2007). MENA Economic Development and Prospects 2007. Washington, DC:
World Bank.
World Bank. (2013). Opening Doors: Gender Equality and Development in the Middle East
and North Africa. MENA Development Report. Washington, DC: World Bank
World Value Survey database is available at www.worldvaluessurvey.org.
Xiao, S., & Zhao, S. (2014). How do agency problems affect firm value?–Evidence from
China. The European Journal of Finance, 20(7-9), 803-828.
Yamori, N., Harimaya, K., & Tomimura, K. (2017). Corporate governance structure and
efficiencies of cooperative banks. International Journal of Finance & Economics, 22(4),
368-378.
Yermack, D. (1996). Higher market valuation of companies with a small board of
directors. Journal of financial economics, 40(2), 185-211.
Table 1. Summary of variables and measures
Variables Definition Source/Datastream code
Organizational outcomes/dependent variables
Q Ratio of total assets minus book value of equity plus market value (mv)
of equity to total assets in a financial year.
(wc02999- wc03501 +
wc03451 + mv)/ wc02999
ROA Percentage of operating profit to total assets in a financial year. wc01250/ wc02999
EPAY Natural log of total cash (salary, performance bonus, pension contribution
and others)-based pay of all executives scaled by the total number of
executives in a financial year.
Annual report
Board diversity/Independent variables
DIV The percentage of the total number of women, ethnic minority, and
foreign directors to the total number of board directors.
Annual report
DIVG The percentage of women directors to the total number of board
directors.
Annual report
DIVE The percentage of ethnic minority (non-Arab) directors to the total
number of board directors
Annual report
DIVN The percentage of non-national directors to the total number of board
directors.
Annual report
Control variables: Firm level
BRDS Natural log of the total number of directors on the board of a company. Annual report
UBL A dummy variable that takes the value of 1 if the roles of chairperson and
CEO of firm are combined at the end of its financial year, 0 otherwise.
Annual report
BSH Percentage of shares held by shareholders with at least 5% of the total
firm shareholdings.
Annual report
GSH Percentage of shares held by government. Annual report

42
ISH Percentage of shares held by institutions. Annual report
LNTS Natural log of the total sales of a firm. wc01001
LV
AGE
BIG4
GRTH
Percentage of total debt to total assets in a financial year
Natural log of the total number of years since a company was established.
A dummy variable that takes the value of 1 if a firm is audited by a big
four audit firm (PricewaterhouseCoopers, Deloitte & Touche, Ernst &
Young, and KPMG), 0 otherwise.
Percentage of current year‘s sales minus previous year‘s sales scaled by
previous year‘s sales.
wc03255/ wc02999
Annual report
Annual report
(wc02999 - wc02999)/
wc02999
DYER Dummies for the years 2009 to 2014 inclusive.
DIND
Dummies for each of the eight main industries: basic materials, oil and
gas, industrials, customer goods, customer services, health care,
technology, and telecommunication.
Control variables: Country
CORP
INFL
GDP
Control of corruption
Inflation, average consumer prices
Natural log of gross domestic product (current US$).
World Bank
International Monetary Fund
World Bank
Table 2. Summary of descriptive statistics of all variables for all sampled firms
Variables Mean Median STD Minimum Maximum
Panel A: Dependent variables
Q 1.38 1.18 0.98 0.08 9.07
ROA % 6.56 6.11 7.76 -32.09 31.03
EPAY ($) 309054.20 134712.24 450282.80 4413.14 3887360
Panel B: Independent variables
DIV% 14.08 0 20.17 0 76.92
DIVG% 2.71 0 6.61 0 37.50
DIVE% 5.20 0 12.78 0 66.67
DIVN% 11.40 0 19.34 0 72.73
Panel C: Corporate Governance variables
BRDS 8.52 9 2.59 4 19
UBL% 21 0 40.9 0 100
BSH% 55.89 59.49 23.39 5 98.92
GSH% 16.15 3.29 24.60 0 98.67
ISH% 34.01 27.45 27.50 0 98.92
Panel D: Firm control variables
LNTS ($000) 933074.41 91199.22 2466268.62 171.83 16536233.87
LV% 20.38 17.99 17.65 0 69.75
AGE 21.84 20 10.06 1 47
BIG4% 59 100 49.30 0 100
GRTH% 9.06 6.01 45.46 -92.59 594.06
Panel E: Country control variables
CORP% 59.31 60.77 16.19 27.96 87.56
INFL% 179.70 149.43 59.92 110.50 316.99
GDP ($m) 265136.31 244774.61 228668.68 23818.32 746248.53
Table 1 fully defines all the variables used.

43
Table 3. Pearson and Spearman correlation matrices of all variables
Q ROA EPAY DIV DIVG DIVE DIVN BRDS DUAL BSH GSH ISH LNTA LV AGE BIG4 GRTH CORP INFN GDP
Q 1 .343*** .197*** .039 .105*** -.025 .007 .008 -.048 .056 -.092** .048 .095** -.056 -.123*** .009 .066 -.199*** -.297*** .111***
ROA .306*** 1 .247*** .197** .135*** .152*** .172*** .077* -.012 .238*** .137*** .156*** .270*** -.169*** -.077* .174*** .290*** -0.003 -0.025 -.088**
EPAY .154*** .210*** 1 .047 -.071 .071 .102** .298*** -.415*** .005 .434*** -.109** .738*** .215*** -.158*** .574*** .274*** .131*** .099** .555***
DIV .054 .189*** .083* 1 .431*** .615*** .881*** .130*** -.029 .253*** .017 .392*** .129*** .048 -.234*** .206*** .065 -0.002 0.040 -.160***
DIVG .106*** .120*** -.096** .306** 1 .027 .023 .276*** .311*** .124*** .167*** .071* .004 -.138*** -.063 .018 -.018 -.199*** .134*** -.148***
DIVE -.012 .148*** .064 .664** .030 1 .700*** -.119*** -.244*** .269*** -.097** .367*** .100** .132*** -.157*** .233*** -.016 0.053 0.002 -.126***
DIVN .028 .161*** .114*** .945** -.005 .694*** 1 .024 -.179*** .239*** -.083** .412*** .149*** .127*** -.236*** .232*** .084** .106*** -0.020 -.121***
BRDS -.043 .086** .313*** .121** .274*** -.074* .041 1 .243*** -.098** .273*** -.101** .310*** .016 -.005 .150*** .099** -.221*** .083** 0.080*
DUAL -.039 .001 -.411*** -.124** .279*** -.236*** -.212*** .249*** 1 -.017 -.023 -.067* -.148*** -.087** .067 -.296*** .013 -.379*** .121*** -.232***
BSH .032 .258*** -.018 .258** .099** .269*** .241*** -.067 -.018 1 .220*** .490*** .183*** .037 -.113*** .178*** .067 -0.006 .300*** -.126***
GSH -.077* .046 .323*** -.114** .077* -.123*** -.152*** .167*** -.027 .328*** 1 -.311*** .491*** -.009 .114*** .350*** .050 0.013 .313*** .181***
ISH .057 .165*** -.140*** .456** .089** .370*** .453*** -.090** -.069* .538*** -.409*** 1 -.059 .062 -.183*** .128*** .034 0.021 .126*** -.258***
LNTA .099** .247*** .733*** .157** -.007 .116*** .165*** .301*** -.151*** .221*** .442*** -.056 1 .364*** -.100** .533*** .214*** -0.023 .144*** .440***
LV -.026 -.209*** .210*** .063 -.137*** .144*** .112*** .026 -.080** .057 -.053 .062 .352*** 1 -.226*** .225*** .036 0.012 -0.030 0.076*
AGE -.127*** -0.030 -.247*** -.240** -.042 -.117*** -.230*** -.030 .117*** -0.070* .053 -.168*** -.201*** -.282*** 1 -.088** -.081** .091** .206*** 0.051
BIG4 .008 .158*** .566*** .222** .026 .235*** .226*** .135*** -.296*** .200*** .238*** .113*** .525*** .212*** -.123*** 1 .104** .087** .109*** .230***
GRTH .068* .274*** .251*** .071 -.016 -.017 .080** .094** .012 .094** .029 .051 .230*** .047 -.121*** .110*** 1 -.116*** 0.065 .158***
CORP -.152*** -.031 .269*** -.035 -.253*** -.005 0.044 -.230*** -.460*** -.069* .021 -.081** 0.048 .014 .020 .121*** -.086** 1 .081** -.151***
INFN -.297*** -.081** .134*** -.052 .109*** -.089** -.085** .184*** .160*** .240*** .282*** .056 .186*** .004 .184*** .098** .068* -0.069* 1 .095**
GDP .067 -.066 .528*** -.138** -.101** -.139*** -.113*** .122*** -.159*** -.102** .211*** -.216*** .460*** .086** -.039 .230*** .177*** -0.053 .338*** 1
The bottom half of the table contains Person‘s parametric correlation coefficients, whereas the upper right half of the table shows Spearman‘s non-parametric correlation coefficients. *, **, and *** indicate significance at the 0.10, 0.05, and 0.01 levels, respectively. Table 1 fully defines all the variables used.

44
Table 4. Fixed-effect regression of the relationship between corporate board diversity and corporate financial performance Q ROA
Indep. variables 1 2 3 4 5 6 7 8
DIV .884**
(.049)
.088***
(.005)
DIVG 3.949*** (.000)
.151** (.049)
DIVE -1.582
(.132)
-.001
(.985)
DIVN -.101
(.863)
.072*
(.081)
CG variables: BRDS -.279
(.476)
-.340
(.382)
-.102
(.798)
-.249
(.527)
-.008
(.783)
-.008
(.772)
-.004
(.875)
-.004
(.873) UBL -.142
(.364)
-.142
(.361)
-.149
(.342)
-.148
(.348)
-.045***
(.000)
-.045***
(.000)
-0.045***
(.000)
-.046***
(.000)
BSH -1.589***
(.001) -1.644***
(.001)
-1.669***
(.001) -1.587***
(.001) .016
(.632) .015
(.671) .017
(.627) .019
(.584)
GSH .854
(.271)
.883
(.249)
1.147
(.140)
1.003
(.197)
.039
(.474)
.049
(.372)
.053
(.336)
.046
(.397) ISH 1.163***
(.010)
1.173***
(.009)
1.234***
(.006)
1.189***
(.009)
.038
(.225)
.040
(.205)
.041
(.201)
.039
(.217)
Firm control variables LNTS -.007
(.923)
-.011
(.876)
-.005
(.946)
-.002
(.973)
.027***
(.000)
.027***
(.000)
.027***
(.000)
.027***
(.000)
LV .178 (.601)
.153 (.649)
.035 (.919)
.113 (.742)
-.098*** (.000)
-.103*** (.000)
-.104*** (.000)
-.100*** (.000)
AGE .406
(.101)
.407*
(.097)
.466*
(.063)
.387
(.119)
.070***
(.000)
.069***
(.000)
.068***
(.000)
.068***
(.000)
BIG4 .363***
(.000)
.333***
(.001)
.349***
(.001)
.359***
(.000)
-.004
(.586)
-.005
(.466)
-.004
(.561)
-.003
(.636)
GRTH -.043 (.437)
-.032 (.565)
-.054 (.327)
-.046 (.402)
.019*** (.000)
.020*** (.000)
.019*** (.000)
.019*** (.000)
Country control variables
CORP -1.045* (.075)
-1.005* (.084)
-1.091* (.063)
-1.029* (.081)
.051 (.219)
.053 (.198)
.052 (.208)
.053 (.201)
INFL -.302**
(.025)
-.298**
(.026)
-.331**
(.015)
-.307**
(.023)
-.017*
(.071)
-.017*
(.070)
-.018*
(.066)
-.017*
(.070) GDP .091
(.672)
.104
(.625)
.120
(.576)
.118
(.583)
-.082***
(.000)
-.080***
(.000)
-.080***
(.000)
-.082***
(.000)
DIND Included Included Included Included Included Included Included Included DYER Included Included Included Included Included Included Included Included
Constant -.315 -.459 -1.326 -.962 1.676*** 1.634*** 1.616*** 1.649***
F-value 2.89*** 3.64*** 2.88*** 2.60*** 10.49*** 10.13*** 9.77*** 10.05*** Adjusted R2 74.88 75.37 74.87 74.68 80.44 80.28 80.12 80.25
No. of observations 600 600 600 600 600 600 600 600
*, **, and *** indicate significance at the 0.10, 0.05, and 0.01 levels, respectively. Table 1 fully defines all the variables used.

45
Table 5. Corporate board diversity, corporate financial performance and moderating effect of governance
Q ROA
Indep. variables 1 2 3 4 5 6 7 8
DIV .930**
(.036)
.086***
(.006)
DIVG 3.999*** (.000)
.149* (0.051)
DIVE -1.355
(0.658)
-.007
(.899)
DIVN -0.026
(0.963)
.070*
(.089)
MCGI -2.806*** (.000)
-2.792*** (.000)
-2.491*** (.002)
-2.639*** (.001)
.059 (.292)
.066 (.236)
.074 (.190)
.063 (.259)
Interaction variable
BDI* MCGI 1.430** (.050)
7.090*** (.000)
-1.967 (.103)
-.260 (.772)
.112** (.031)
.217* (.091)
-.044 (.611)
.072 (.257)
Firm Control Variables
BRDS -.421 (.280)
-.459 (.234)
-.236 (.555)
-.381 (.330)
-.004 (.888)
-.003 (.906)
.002 (.935)
-.002 (.946)
UBL -.222
(.156)
-.221
(.153)
-.214
(.173)
-.217
(.169)
-.044***
(0.000)
-.044***
(0.000)
-.043***
(0.000)
-.044***
(0.000)
BSH -1.634***
(0.001)
-1.746***
(0.000)
-1.734***
(0.000)
-1.669***
(0.001)
.021
(.544)
.016
(.638)
.017
(.620)
.022
(.531)
GSH .721 (.349)
.778 (.303)
1.068 (.167)
.927 (.229)
.041 (.457)
.051 (.347)
.059 (.286)
.049 (.372)
ISH 1.095**
(.014)
1.150***
(0.009)
1.210***
(0.007)
1.167***
(.009)
.037
(.247)
.041
(.193)
.043
(.181)
.039
(.224)
Firm Control Variables
LNTS .003
(.970)
-.003
(.967)
.004
(.954)
.007
(.918)
.027***
(.000)
.027***
(.000)
.027***
(.000)
.027***
(.000) LV .237
(.484)
.204
(.539)
.090
(.790)
.152
(.654)
-.099***
(.000)
-.104***
(.000)
-.107***
(.000)
-.102***
(.000)
AGE .338 (.168)
.348 (.150)
.423* (.090)
.349 (.156)
.069*** (.000)
.069*** (.000)
.071*** (.000)
.068*** (.000)
BIG4 .392*** (.000)
.359*** (.000)
.376*** (.000)
.385*** (.000)
-.004 (.527)
-.006 (.420)
-.005 (.473)
-.004 (.549)
GRTH -.041
(.458)
-.032
(.548)
-.051
(.349)
-.045
(.417)
.019***
(.000)
.019***
(.000)
.019***
(.000)
.019***
(.000)
Country Control Variables:
CORP -.385
(.527)
-.348
(.563)
-.474
(.438)
-.403
(.510)
.037
(.394)
.037
(.388)
.034
(.433)
.037
(.394) INFN -.264**
(.048)
-.275**
(.037)
-.293**
(.029)
-.275**
(.041)
-.017*
(.061)
-.018*
(.052)
-.019**
(.049)
-.018
(.061)
GDP .496** (.040)
.513** (.032)
.495** (.041)
.513** (.035)
-.091*** (.000)
-.090*** (.000)
-.091*** (.000)
-.091*** (.000)
DIND Included Included Included Included Included Included Included Included
DYER Included Included Included Included Included Included Included Included CONSTANT -9.195 -9.469* -9.702* -9.731* 1.882*** 1.852*** 1.845*** 1.865***
F-value 3.53*** 4.41*** 3.44*** 3.25*** 9.63*** 9.48*** 9.26*** 9.34***
Adjusted R2 75.41 76.00 75.35 75.22 80.34 80.26 80.16 80.20 No. of observations 600 600 600 600 600 600 600 600
*, **, and *** indicate significance at the 0.10, 0.05, and 0.01 levels, respectively. Table 1 fully defines all the variables used.

46
Table 6. Executive pay, performance and moderating effect of board diversity
EPAY
Indep. variables 1 2 3 4 5 6 7 8 9
Q .058**
(.025)
.064**
(.030)
.070**
(.014)
.078***
(.009)
.068**
(.019)
DIV .110
(.687)
.160
(.647)
DIVG 1.101
(.113)
2.525**
(.048)
DIVE -.018
(.969)
.660 (.302)
DIVN .129
(.697)
.302
(.443)
Interaction variable
Q*DIV -.058
(.642)
-.852
(.119)
-.410
(.187)
-.106
(.436)
CG control variables
BRDS -.076
(.749)
-.080
(.733)
-.072
(.765)
-.074 (.754)
-.071 (.764)
-.080 (.735)
-.057 (.810)
-.111 (.645)
-.085 (.720)
UBL .340***
(.003)
.330***
(.004)
.342***
(.003)
.342***
(.003)
.362***
(.001)
.365***
(.001)
.355***
(.002)
.362***
(.001)
.368***
(.001)
BSH -.187
(.512)
-.204
(.473)
-.190
(.507)
-.183
(.520)
-.094
(.742)
-.090
(.753)
-.128
(.655)
-.085
(.769)
-.079
(.783)
GSH -.285
(.526)
-.300
(.502)
-.265
(.556)
-.280 (.533)
-.315 (.479)
-.323 (.471)
-.293 (.511)
-.308 (.491)
-.330 (.461)
ISH -.202
(.440)
-.205
(.432)
-.195
(.456)
-.200
(.443)
-.255
(.329)
-.263
(.316)
-.235
(.368)
-.279
(.288)
-.272
(.300)
Firm control variables
LNTS .196***
(.000)
.196***
(.000)
.196***
(.000)
.196***
(.000)
.195***
(.000)
.197***
(.000)
.195***
(.000)
.196***
(.000)
.198***
(.000)
LV .254
.207
.255
(.202)
.246
(.224)
.255 (.206)
.241 (.227)
.237 (.240)
.220 (.271)
.269 (.183)
.239 (.233)
AGE -.024
(.865)
-.025
(.860)
-.024
(.869)
-.025
(.862)
-.044
(.754)
-.045
(.748)
-.043
(.760)
-.062
(.664)
-.048
(.734)
BIG4 .089
(.114)
.080
(.159)
.089
(.115)
.091
(.109)
.070
(.216)
.069
(.223)
.063
(.268)
.067
(.242)
.070
(.222)
GRTH .013
(.693)
.017
(.599)
.013
(.700)
.012 (.707)
.016 (.615)
.015 (.641)
.019 (.552)
.015 (.642)
.014 (.668)
Firm control variables
CORP .187
(.589)
.203
(.558)
.188
(.588)
.189 (.584)
.243 (.482)
.227 (.513)
.242 (.483)
.243 (.483)
.227 (.512)
INFN -.265***
(.009)
-.267***
(.009)
-.268***
(.009)
-.266***
(.009)
-.259**
(.011)
-.259**
(.011)
-.283***
(.006)
-.256**
(.012)
-.260**
(.011)
GDP .616***
(.000)
.618***
(.000)
.620***
(.000)
.617***
(.000)
.615***
(.000)
.616***
(.000)
.632***
(.000)
.613***
(.000)
.615***
(.000)
DIND Included Included Included Included Included Included Included Included Included
DYER Included Included Included Included Included Included Included Included Included
Constant -5.518* -5.545* -5.601* -5.533* -5.547* -5.569* -5.994** -5.415* -5.574*
F-value 8.55*** 8.77*** 8.54*** 8.55*** 9.00*** 7.86*** 8.16*** 7.98*** 7.90***
Adjusted R2 94.05 94.08 94.04 94.05 94.11 94.09 94.14 94.11 94.10
No. of obs. 534 534 534 534 534 534 534 534 534
*, **, and *** indicate significance at the 0.10, 0.05, and 0.01 levels, respectively. Table 1 fully defines all the variables used.

47
Table 7. Sensitivity analyses of the relationship between corporate board diversity and corporate financial performance (Part I)
Q ROA MTB ROE Q ROA
Ind. Var. 1 2 3 4 5 6 7 8 9 10
DIV 9.768**
(.028)
.161*
(.059)
.802*
(.075)
.086***
(.006)
DIV2 1.408*
(.059)
.205***
(.000)
GEN_1 .341***
(.004)
.012
(.165)
GEN_2 .015
(.922)
-.010
(.349)
GEN_3 .183
(.460)
.034*
(.053)
CG control variables
BRDS -.325
(.406)
-.247
(.530)
-.278
(.482)
-.007
(.797)
-.006
(.837)
-.010
(.721)
1.314
(.736)
-.014
(.850)
-.219
(.577)
-.000
(.996)
UBL -.165
(.290)
-.149
(.344)
-.129
(.420)
-.046***
(.000)
-.045***
(.000)
-.042***
(.000)
-1.748
(.262)
-.065**
(.028)
-.145
(.356)
-.045***
(0.000)
BSH -1.585***
(.001)
-1.584***
(.001)
-1.607***
(.001)
.017
(.625)
.017
(.627)
.013
(.712)
4.565
(.347)
.000
(.988)
-1.594***
(.001)
.015
(.651)
GSH .960
(.212)
.994
(.200)
.989
(.202)
.052
(.344)
.053
(.335)
.052
(.340)
7.437
(.335)
.201
(.172)
.939
(.224)
.045
(.404)
ISH 1.220***
(.007)
1.184***
(.009)
1.213***
(.007)
.042
(.188)
.043
(.176)
.045
(.154)
6.373
(.154)
-1.019
(.824)
1.187***
(.008)
.041***
(.194)
Firm control variables
LNTS -.006
(.932)
-.002
(.976)
-.005
(.942)
.027***
(.000)
.027***
(.000)
.027***
(.000)
-.464
(.495)
.025*
(.056)
-.011
(.873)
.026***
(.000)
LV .207
(.542)
.116
(.734)
.124
(.715)
-.101***
(.000)
-.102***
(.000)
-.103***
(.000)
6.110*
(.072)
-.242***
(.000)
.187
(.585)
-.094***
(.000)
AGE .370
(.133)
.387
(.119)
.403
(.105)
.068***
(.000)
.068***
(.000)
.071
(.000)
2.689
(.274)
.009
(.843)
.403
(.104)
.070***
(.000)
BIG4 .337***
(.001)
.360***
(.000)
.364***
(.000)
-.005
(.490)
-.004
(.583)
-.003
(.630)
2.211**
.026
.008
(.667)
.356***
(.000)
-.005
(.495)
GRTH -.037
(.497)
-.047
(.398)
-.044
(.429)
.019***
(.000)
.019***
(.000)
.020***
(.000)
.718
(.192)
.051***
(.000)
-.046
(.409)
.019***
(.000)
Country control variables
CORP -.924
(.115)
-1.030*
(.081)
-1.051*
(.075)
.056
(.178)
.053
(.197)
.048
(.245)
11.084*
(.058)
.236**
(.034)
-1.028*
(.080)
.052
(.200)
INFN -.279**
(.038)
-.305**
(.027)
-.325**
(.018)
-.017*
(.081)
-.019**
(.048)
-.021
(.030)
.804
(.548)
-.048*
(.062)
-.310**
(.022)
-.018*
(.054)
GDP .101
(.634)
.116
(.591)
.117
(.587)
-.080***
(.000)
-.080***
(.000)
-.080***
(.000)
-2.730
(.201)
-.054
(.185)
.112
(.600)
-.080***
(.000)
DIND Included Included Included Included Included Included Included Included Included Included
DYER Included Included Included Included Included Included Included Included Included Included
Constant -.449 -.915 -.850 1.632*** 1.616*** 1.629*** 50.098 1.150 -.909 1.617***
F-value 3.24*** 2.60*** 2.64*** 9.95*** 9.85*** 10.11*** 2.26*** 5.30*** 2.87*** 11.21***
Adjusted R2 75.11 74.68 74.71 80.20 80.16 80.28 77.31 71.46 74.86 80.75
No. of obs. 600 600 600 600 600 600 600 600 600 600
*, **, and *** indicate significance at the 0.10, 0.05, and 0.01 levels, respectively. Variables are defined as follows: square the
percentage of the total number of women, ethnic minority and foreign directors to the total number of board directors (DIV2); A dummy
variable equal to 1 if a firm has one woman director on the board (GEN_1); A dummy variable equal to 1 if a firm has two woman
directors on the board (GEN_2); A dummy variable equal to 1 if a firm has more than two woman directors on the board (GEN_3);
market-to-book (MTB) and return on equity (ROE). Table 1 fully defines all the variables used.

48
Table 8. Sensitivity analyses of the relationship between corporate board diversity and corporate financial performance (Part II)
Q ROA Q ROA Q ROA Q ROA
lagged lagged 2SLS 2SLS
Independent variables 1 2 3 4 5 6 7 8
DIV 1.145**
(.036)
.077*
(.076)
3.681*
(.059)
2.539***
(.000)
DIV_NO .075*
(.067)
.009***
(.005)
DIV_DUM .251*
(.070)
.007**
(.046)
CG control variables
BRDS -.332
(.401)
-.015
(.588)
-.344
(.384)
-.002
(.948)
.284
(.492)
.058*
(.079)
.098
(.903)
-.243***
(.000)
UBL -.139
(.376)
-.044***
(.000)
-.145
(.354)
-.045***
(.000)
-.207
(222)
-.010
(.440)
-.355
(.371)
.097***
(.001)
BSH -1.615***
(.001)
.013
(.705)
-1.542***
(.002)
.016
(.649)
.556
(.279)
-.000
(.996)
-1.691***
(.001)
.091**
(.013)
GSH .964
(.213)
.049
(.365)
.835
(.283)
.057
(.297)
.697
(.419)
.010
(.886)
.981
(.205)
.061
(.260)
ISH 1.213***
(.007)
.044
(.164)
1.117**
(.013)
.043
(.181)
.427
(.382)
-.050
(.192)
2.320
(.279)
-.741***
(.000)
Firm control variables
LNTS -.006
(.925)
.027***
(.000)
.005
(.937)
.027***
(.000)
.074
(.278)
-.009*
(.098)
.059
(.647)
-.015
(.100)
LV .155
(.649)
-.099***
(.000)
.127
(.709)
-.104***
.000
.159
(.220)
-.004
(.686)
-.194
(.776)
.112**
(.020)
AGE .406
(.101)
.070***
.000
.393
(.112)
.068***
(.000)
-.081*
(.058)
.004
(.248)
.223
(.660)
.181***
(.000)
BIG4 .364***
(.000)
-.004
(.609)
.366***
(.000)
-.004
(.545)
.067
(.157)
.001
(.732)
.492*
(.060)
-.095***
(.000)
GRTH -.044
(.431)
.019***
.000
-.042
.443
.019***
(.000)
.006
(.906)
.006
(.171)
-.032
(.582)
.009**
(.026)
Country Control variables
CORP -1.066*
(.070)
.048
(.248)
-1.040*
(.077)
.053
(.204)
-.062
(.643)
.009
(.411)
-1.262*
(.060)
.214***
(.000)
INFN -310**
(.022)
-.018
(.058)
-.263*
(.055)
-.019*
(.052)
-.000
(.994)
.001
(.796)
-.350**
(.049)
.012
(.345)
GDP .099
(.644)
-.082***
.000
.056
(.796)
-.078***
(.000)
.021
(.268)
-.001
(.408)
-.515
(.683)
.550***
(.000)
DIND Included Included Included Included Included Included Included Included
DYER Included Included Included Included Included Included Included Included
Constant -.386 1.683*** .556 1.575*** -1.073 .068 1.551 -.085
F-value 2.79*** 10.50*** 2.85*** 9.82*** 1.93** 1.13 2.80*** 10.54***
Adjusted R2 74.81 80.45 79.59 80.15 80.35 79.42 74.73 80.16
No. of observations 600 600 600 600 600 600 600 600
*, **, and *** indicate significance at the 0.10, 0.05, and 0.01 levels, respectively. Variables are defined as follows: the number of
women, ethnic minority and foreign directors on the board (DIV_NO) and dummy variable equal 1 if the firm has one women,
ethnic minority or foreign director and 0 otherwise (DIVG_DU). Table 1 fully defines all the variables used.