bnp paribas european leader with strong capital generation ... · bnp paribas european leader with...
TRANSCRIPT

BNP PARIBASEUROPEAN LEADER WITH STRONG CAPITAL GENERATION CAPACITY
Morgan Stanley Conference, London16 March 2016
Philippe BordenaveChief Operating Officer

Morgan Stanley Conference – March 2016 2
Disclaimer
Figures included in this presentation are unaudited. On 24 March 2015, BNP Paribas issued a restatement of its quarterly results for2014 reflecting, in particular, the new organization of the Bank’s operating divisions as well as the adoption of the accountingstandards IFRIC 21. This presentation is based on the published or the restated 2014 data as appropriate.
This presentation includes forward-looking statements based on current beliefs and expectations about future events. Forward-looking statements include financial projections and estimates and their underlying assumptions, statements regarding plans,objectives and expectations with respect to future events, operations, products and services, and statements regarding futureperformance and synergies. Forward-looking statements are not guarantees of future performance and are subject to inherent risks,uncertainties and assumptions about BNP Paribas and its subsidiaries and investments, developments of BNP Paribas and itssubsidiaries, banking industry trends, future capital expenditures and acquisitions, changes in economic conditions globally or inBNP Paribas’ principal local markets, the competitive market and regulatory factors. Those events are uncertain; their outcome maydiffer from current expectations which may in turn significantly affect expected results. Actual results may differ materially from thoseprojected or implied in these forward looking statements. Any forward-looking statement contained in this presentation speaks as ofthe date of this presentation. BNP Paribas undertakes no obligation to publicly revise or update any forward-looking statements inlight of new information or future events. It should be recalled in this regard that the Supervisory Review and Evaluation Process iscarried out each year by the European Central Bank, which can modify each year its capital adequacy ratio requirements for BNPParibas.
The information contained in this presentation as it relates to parties other than BNP Paribas or derived from external sources hasnot been independently verified and no representation or warranty expressed or implied is made as to, and no reliance should beplaced on the fairness, accuracy, completeness or correctness of, the information or opinions contained herein. None of BNPParibas or its representatives shall have any liability whatsoever in negligence or otherwise for any loss however arising from anyuse of this presentation or its contents or otherwise arising in connection with this presentation or any other information or materialdiscussed.

Morgan Stanley Conference – March 2016 3
Overview
10.1% ROTE stemming from a good performance of the three operating divisions
Solid 2015 results thanks to the integrated and diversified model serving the clientele
€2.31 per share full cash dividend45% pay-out ratio
Strong and recurrent organic capital generation10.9% fully loaded Basel 3 CET1 ratio

Morgan Stanley Conference – March 2016 4
Operating Divisions Going Forward
Appendix
Strong Financial Structure and Value Creation
Solid 2015 Group Results

Morgan Stanley Conference – March 2016 5
Revenues of the Operating Divisions - 2015
2015
€m
Domestic Markets* IFS CIB
+13.2%+1.6% +14.5%
2014
Solid performance of Domestic MarketsStrong growth at IFS and CIB
2015 vs. 2014
Good resilience in a low interest rate environment given business and geographic diversification
* Including 100% of Private Banking in France (excluding PEL/CEL effects), in Italy, Belgium and Luxembourg
+9.1%
Operating Divisions
+3.5%at constant scope and
exchange rates

Morgan Stanley Conference – March 2016 6
Expenses of the Operating Divisions - 2015
€m
Operating expenses of the operating divisions : +3.2% at constant scope and exchange rates Improvement of the cost/income ratio: -0.2 pt vs. 2014** Implementation of new regulations and strengthening compliance 2014-2016 business development plans now largely completed
Simple & Efficient savings target raised to € 3.3bn for 2016 (+ € 0.6 bn vs. actual 2015)
Rise in regulatory costs and finalisation of the business development plans mitigated by the effects of Simple & Efficient
* Including 100% of Private Banking in France (excluding PEL/CEL effects), Italy, Belgium and Luxembourg ; ** At constant scope and exchange rates
20152014
2015 vs. 2014
+9.3%
Operating Divisions
+3.2%at constant scope and
exchange rates
Domestic Markets* IFS CIB
+11.5%+3.1% +15.0%

Morgan Stanley Conference – March 2016 7
Net provisions/Customer loans (in annualised bp)
Group Cost of Risk
Cost of Risk/Gross Operating Income 2008-2015
Low risk appetite and strong diversification lead to low cost of risk
One of the lowest CoR/GOI through the cycle
Overall stability of the cost of risk over the past 4 years
Ongoing reduction of BNL’s CoR in Italy Oil & Gas: well-diversified quality exposure
Only 1% of doubtful exposure at YE 2015
Cost of risk stable at a moderate levelStrong diversification implying lower risk profile
Group Cost of Risk

Morgan Stanley Conference – March 2016 8
Strong Underlying Profitability
* As disclosed by banks; **Average quarterly exchange rates
Return on Equity: 8.3% Return on Tangible Equity: 10.1% Net Income excluding exceptional items: €7.3bn
2015 Net Profit (reported)*€m**
- 6 794 - 2 661
Good profit-generation capacity and best-in-class returns
- 2 715BNPP SAN SG CASA ISP BBVA UCI Natixis CBK DB HSBC UBS BARC CS RBS

Morgan Stanley Conference – March 2016 9
Operating Divisions Going Forward
Appendix
Strong Financial Structure and Value Creation
Solid 2015 Group Results

Morgan Stanley Conference – March 2016 10
Fully loaded Basel 3 CET1 ratio*: 10.9% as at 31.12.15(+60 bp vs. 31.12.14) Essentially due to the 2015 results after taking into account
the dividend payment
Fully loaded Basel 3 leverage**: 4.0% as at 31.12.15(+40 bp vs. 31.12.14) Effect of the higher CET1 capital Reduction of the leverage exposure in capital market activities
Liquidity Coverage Ratio: 124% as at 31.12.15
Immediately available liquidity reserve***: €266bn(€260bn as at 31.12.14) Amounting to ~185% of short-term wholesale funding,
equivalent to over 1 year of room to manœuvre
Financial Structure
Solid organic capital generation
Fully loaded Basel 3CET1 ratio*
* CRD4 (2019 fully loaded ratio); ** CRD4 (2019 fully loaded ratio), calculated according to the delegated act of the European Commission dated 10.10.2014, on Tier1 capital (including as at 31.12.14 the forthcoming replacement of Tier1 instruments that have become ineligible with equivalent eligible instruements); *** Liquid market assets or eligible to central banks (counterbalancing capacity) taking into account prudential standards, notably US standards, minus intradays payment systems needs
Fully loaded Basel 3leverage ratio**

Morgan Stanley Conference – March 2016 11
Evolution of CET1 Ratio by 2019
Target of a fully loaded CET1 ratio of 12%Steady organic growth of CET1 ratio across the cycle
* Subject to market conditions and regulatory authorisations; ** Basel 2 from December 2007 to December 2011, Basel 2.5 as at December 2012, then fully loaded Basel 3 for the years after; *** Including the buy-back of the Fortis shares held by the minority shareholders (~-50bp); **** +100bp excluding costs related to the comprehensive settlement with the U.S. authorities; ***** Q/Q-1 CET1 ratio evolution restated of capital increases and acquisitions; average number of quarters of negative CET1 ratio evolution for 10 European peers
Annual evolution of the CET1 ratio**
12.07 12.08 12.09 12.10 12.11 12.12 12.13 12.14 12.15
Capital requirement (CET1) following the ECB’ SREP: 10.0% in 2016 Including G-SIB buffer of 0.5% in 2016 Phased-in CET1 ratio of 11.0% as at 31.12.15, well above the
minimum requirement
Anticipated level of fully loaded Basel 3 CET1 ratio requirement of 11.5% in 2019 Given the gradual phasing-in of the G-SIB buffer to 2% in 2019
Target to achieve this level by mid 2017 thanks to: Organic generation and active capital management policy
(~35 bp per year) Sale or initial public offering of First Hawaiian Bank (~40 bp*)
Target of a fully loaded Basel 3 CET1 ratio of 12.0% as of 2018 Taking into account a 50 bp management buffer, coherent
with the Group’s strong and recurring organic capital generation throughout the cycle
Number of quarters of negative CET1 ratio evolution (2009-2015, European peers)*****
BNPP European peers
Over 28 quarters

Morgan Stanley Conference – March 2016 12
An Integrated Business Model with Strong Diversification Resulting in Recurrent Earnings Generation
2015 Revenues by geography: >85% in wealthy markets
Rest of the World : 7%
Germany: 3%
France: 32%
Italy: 12%
APAC: 8%
North America: 12%
Belgium: 11%
Other Europe: 15%
* Operating divisions; ** Adjusted for costs and provisions related to the comprehensive settlement with US authorities
2015 Allocated equity* by business
Corporate Banking: 15%
Other Domestic Market Activities: 5%
Advisory and Capital Markets: 15%
Retail France: 12%
Retail Italy: 9%
PersonalFinance: 6%
BancWest: 9%
Retail Belgium: 6%
Europe-Mediterranean: 7%Insurance: 12%
WAM: 3%
Securities Services: 1%
Recurrent earnings generation through the cycleNet Income Group Share (2008-2015)
€bn
4.8
0.2
Morgan Stanley Conference – March 2016 13
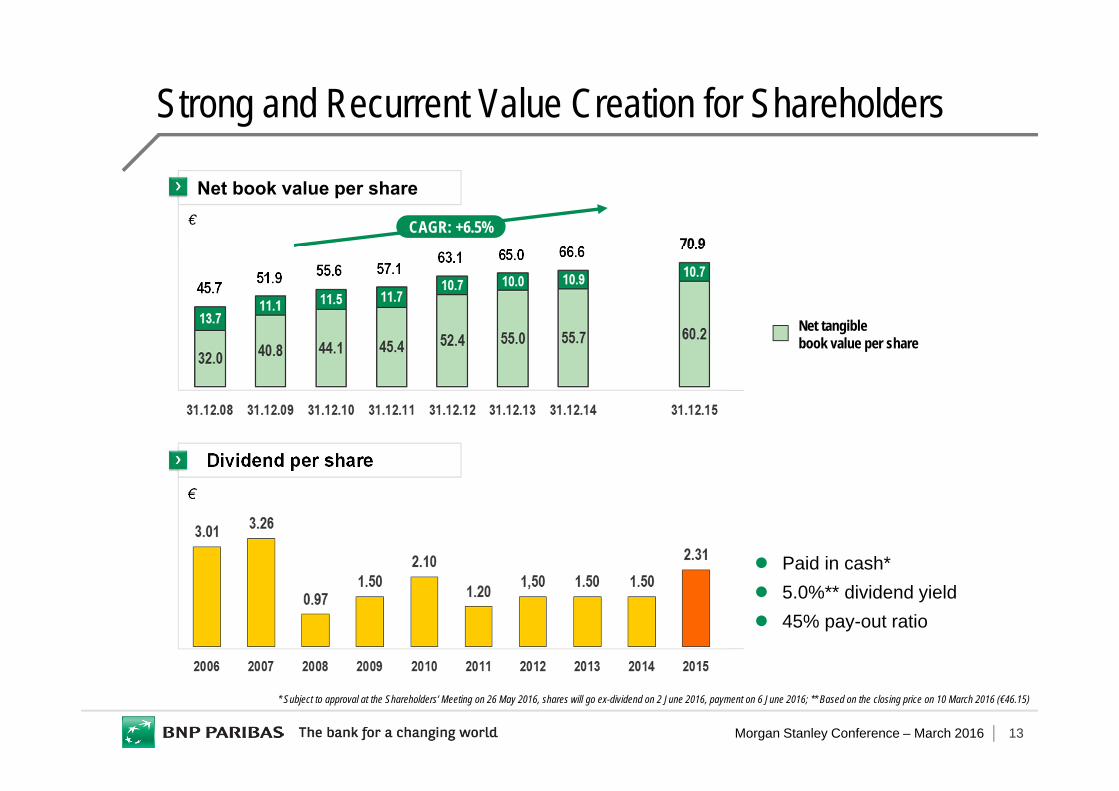
Strong and Recurrent Value Creation for Shareholders
Net book value per share
Net tangible book value per share
CAGR: +6.5%
45.7 51.9 55.6 57.163.1 66.6 70.965.0
Dividend per share
€
€
* Subject to approval at the Shareholders’ Meeting on 26 May 2016, shares will go ex-dividend on 2 June 2016, payment on 6 June 2016; ** Based on the closing price on 10 March 2016 (€46.15)
Paid in cash* 5.0%** dividend yield 45% pay-out ratio
Morgan Stanley Conference – March 2016 14
Operating Divisions Going Forward
Appendix
Strong Financial Structure and Value Creation
Solid 2015 Group Results

Morgan Stanley Conference – March 2016 15
Positive macro factors for the EU economy in 2016 Drop in oil price to translate into higher disposable
income for households and lower charges for corporates Depreciation of the Euro vs. USD in 2015 benefitting
exporting European corporates
Non-conventional measures by the ECB to re-launch economic growth Quantitative Easing started on March 2015 and was
recently expanded Resulting in prolonged very low interest rates which will
be favourable for investments
The “Juncker Plan”: a €315bn investment plan Allocated to long-term investments & SMEs/Mid-caps
Gradual recovery of growth in Eurozone Gradual rise of loan growth in the eurozone
Eurozone Economic Outlook
Positive factors supporting economic recovery in Europe* Sources : Eurostat’s reports, European Commission’s forecasts; ** Lending to private non-financial sector, yoy variation
Growth forecast for Eurozone GDP*
GDP in Volume €bn
9,500
10,500
10,000
+0.9%+1.5%
+1.7%
+1.9%
Yoy %
+1.1%
Eurozone lending**
Dec 14 Dec 15
€bn

Morgan Stanley Conference – March 2016 16
Domestic MarketsContinued Transformation of the Retail Networks
Footprint optimisation and modernisation of branch formats
2,009(-191)
812(-78)
789(-149)
# branches end-2015 (change vs 2012)
* % of targeted branches
41(+3)
Branch network optimisation with differentiated branch formats Continued footprint optimisation Full range of services available in “hub” branches Lighter branch formats developed to maintain proximity at a lower cost
Revamped commercial set up Opening hours reviewed and adapted to client needs Meeter/Greeter as a shared role in most branches Personalized approach and reinforced expertise for some
client segments
Digitalised branches Videoconference support Wi-Fi for customers New mobile workstation tablet-based % of branches already revamped
EXPRESS
ADVISORY
PROJECTS
ADVISORY
FULL
OPEN BNL
FULL
63% 95%* 43%
Ongoing footprint optimisation
New branch formats
% of branches already
equipped
56%
52%
62%

Morgan Stanley Conference – March 2016 17
Domestic MarketsContinued Development of Hello bank!
Hello bank! successfully developing in 5 countries 2.4 million clients
* FRB, BRB, BNLbc and Personal Investors revenues, excluding Private Banking; ** Including DAB customers
Client base(‘000)As at 31.12.15
1,575
TOTAL
439
Germany** Belgium France Italy Austria
237 93 77
2.4 M clients
Hello bank! awareness (France)
52% +12pts
(vs 2014)
A fast growing customer base Strong organic client acquisition
(~+400,000 clients vs. 31.12.14) Acquisition of DAB Bank in Germany in 2014 and
merger in 2015 with Consorsbank! Direktanlage.at became Hello bank! in Austria in 2015
A new brand successfully rolled-out in the Eurozone Brand positioning “100% mobile” Promising spontaneous awareness New features and services €24bn deposits and €80bn assets under management Generating 8.7% of individual clients revenues*
in 2015 (x2 vs. 2014)
Shared assets with the network and across Hello bank! Use of existing infrastructures and resources in each
country: IT systems, back-offices, call centres,…

Morgan Stanley Conference – March 2016 18
Domestic Markets - Medium-term Ambitions More Digitalisation, More Customisation
Effortless & value-added client experience, tailored to client needs end-to-end
Efficiency improvement: process optimisation and operating functions adaptation
Further development of cross-selling within the Group
Optimize commercial proactivity and reactivity
Improve pricing and risk scoring management
Digitalisation of the whole product offering subscriptions Boost digital communication and marketing Specific client acquisition offers with ambitious targets
for 2020
New aggregation service offers (e.g. Arval Active Link) tailored to client utilisations
Develop business and enrich offer through innovationand FinTechs partnerships
Differentiated models in terms of value proposition and relationship model: choice offered to customers (Retail, Private, Corporate)
New relationship styles with more digital and adapted interactions
Common platforms for product offering, remote expertise…
Already launched
50%
20202015
12%
Targeted digital sales
Aggregation of optional services Active Journey (route analysis) Active Routing (real-time geo-
localization) Active Sharing (management of
shared vehicles)
I NEED CASH NOWI WANT TO BUY
MY HOME /
I WANT TO BUY MY TV
I WANT TO BECOME
A CORPORATE
CUSTOMER
AssistedSelf Face to Face Offsite
Face to Face Offsite
Face to Face
Remote
Face to Face
Remote
UsageUsage
Data managementData management
Data analysisData analysis
Create digitalised service models
Reinvent customer journeys
Enhance customer knowledge
Boost digital acquisition &
sales
Develop comprehensive service offers

Morgan Stanley Conference – March 2016 19
International Retail Banking Europe-Mediterranean: retail networks in 14 countries,
notably in Turkey (TEB), in Poland (BGZ BNP Paribas) and in the South Mediterranean Basin
BancWest (United States)
Specialised businesses Personal Finance: consumer finance business,
#1 specialty player in Europe with notably , and
Wealth & Asset Management: Wealth Management, Asset Management, Real Estate Services(€739bn AuM as at 31.12.2015)
Insurance: savings and protection products, #3 Life bancassurance in France*, #5 bancassurance in Italy**
International Financial Services
2015 Revenues by business
A growth engine for the Group* Argus de l’Assurance 2014; ** IAM Consulting 2014
Europe–Med: 16%Personal Finance:
31%
Wealth & Asset Management:
20%Insurance: 15%
BancWest: 18%
Two main activities
Morgan Stanley Conference – March 2016 20
CLIENTS INTERNATIONAL
PARTNERSHIPS CROSS-SELLING
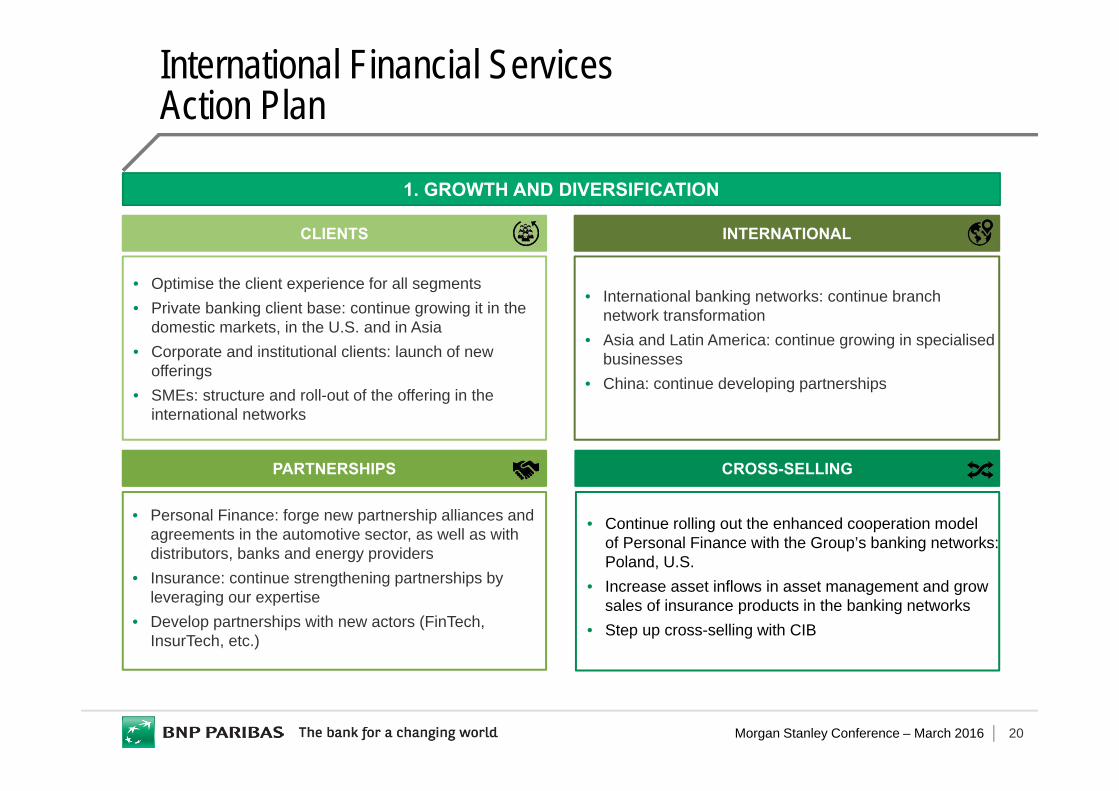
1. GROWTH AND DIVERSIFICATION
• Optimise the client experience for all segments• Private banking client base: continue growing it in the
domestic markets, in the U.S. and in Asia• Corporate and institutional clients: launch of new
offerings • SMEs: structure and roll-out of the offering in the
international networks
• Personal Finance: forge new partnership alliances and agreements in the automotive sector, as well as with distributors, banks and energy providers
• Insurance: continue strengthening partnerships by leveraging our expertise
• Develop partnerships with new actors (FinTech, InsurTech, etc.)
• International banking networks: continue branch network transformation
• Asia and Latin America: continue growing in specialised businesses
• China: continue developing partnerships
• Continue rolling out the enhanced cooperation model of Personal Finance with the Group’s banking networks: Poland, U.S.
• Increase asset inflows in asset management and grow sales of insurance products in the banking networks
• Step up cross-selling with CIB
International Financial ServicesAction Plan

Morgan Stanley Conference – March 2016 21
• Industrialise the platforms and enhance operating efficiency• Finalise integrations with LaSer (Personal Finance) and Bank BGZ (Poland)• Continue adapting to regulatory changes (MiFID II, …)
DATA AND ANALYTICS INNOVATION BANKS AND DIGITAL OFFERINGS
2. DIGITALISATION, NEW TECHNOLOGIES AND NEW BUSINESS MODELS
3. CONTINUE INDUSTRIALISATION, TRANSFORMATION AND ADAPTATION
INDUSTRIALISATION AND ADAPTATION
• Initiatives in all the business units• Unite data labs to pool best
practices
• Put open innovation in general practice in all the businesses
• Capitalise on innovative approaches (Cardif Lab, PF Echangeur, Hackathon…)
• Analyse and test the roll-out of new services
• Continue the expansion of mobile and digital banking services, including in new countries
• Develop the digital solutions offering in all the businesses
• Bring innovation to the payment offering (new offerings and technologies)
International Financial ServicesAction Plan
Morgan Stanley Conference – March 2016 22
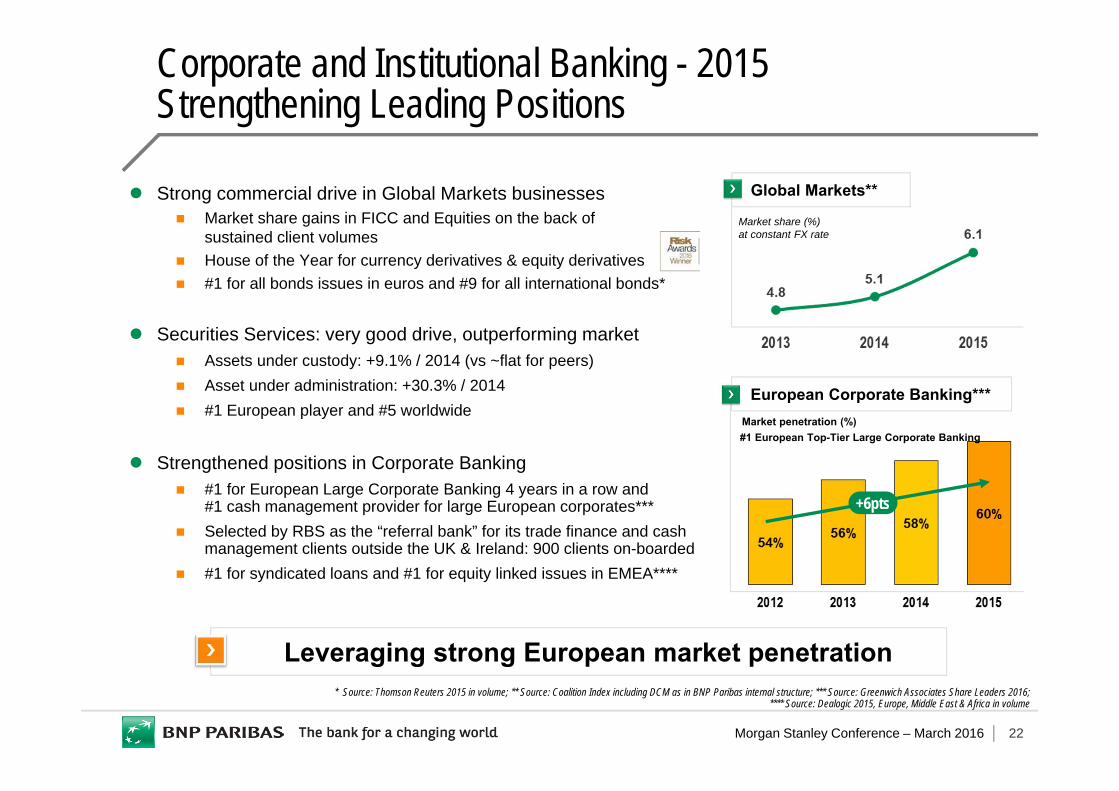
Strong commercial drive in Global Markets businesses Market share gains in FICC and Equities on the back of
sustained client volumes House of the Year for currency derivatives & equity derivatives #1 for all bonds issues in euros and #9 for all international bonds*
Securities Services: very good drive, outperforming market Assets under custody: +9.1% / 2014 (vs ~flat for peers) Asset under administration: +30.3% / 2014 #1 European player and #5 worldwide
Strengthened positions in Corporate Banking #1 for European Large Corporate Banking 4 years in a row and
#1 cash management provider for large European corporates*** Selected by RBS as the “referral bank” for its trade finance and cash
management clients outside the UK & Ireland: 900 clients on-boarded #1 for syndicated loans and #1 for equity linked issues in EMEA****
Corporate and Institutional Banking - 2015Strengthening Leading Positions
* Source: Thomson Reuters 2015 in volume; ** Source: Coalition Index including DCM as in BNP Paribas internal structure; *** Source: Greenwich Associates Share Leaders 2016; **** Source: Dealogic 2015, Europe, Middle East & Africa in volume
Leveraging strong European market penetration
European Corporate Banking***
#1 European Top-Tier Large Corporate BankingMarket penetration (%)
+6pts
Global Markets**
Market share (%) at constant FX rate

Morgan Stanley Conference – March 2016 23
CIB Today: a Solid and Profitable Platform
Early adaptation to Basel 3 (2011-2012 deleveraging) and ongoing reduction of leverage exposure
E&C1 downsizing largely completed at end-2015 New organisation implemented since the end of 2014
to speed up the evolution Compliance, control and conduct: reinforcement
of rules and set up
CIB leverage exposure
-166
Disciplined and
Agile
Disciplined and
Agile
Client focused: a CIB built up organically on the Group’s historic client franchises
2 well-balanced client franchises: Corporates and Institutionals
Cross-selling at the heart of the business model Right size within the Group business mix
(31% of allocated equity)
Integratedwithin
BNP Paribas Group
Integratedwithin
BNP Paribas Group
€bn
1. Energy & Commodity business line; 2. Evolution in Euros for 8 European CIB; 3. Evolution in USD for 6 US CIB
Gaining market shares from peers’ retrenching context
Success of regional initiatives launched in APAC and in the US
Generating best-in-class profitability among European peers
Improving Global
Positioning
Improving Global
Positioning
Revenues evolution vs. peers
100 basis
BNP ParibasEuropeanBanks2
US Banks3
2014 2015

Morgan Stanley Conference – March 2016 24
1. RONE: pre-tax Return On Notional Equity; 2. Based on the Group current CET1 ratio of 10.9%; 3. Review of credit & counterparty risk, market risk (FRTB) & equity risk, operational risk, securitization andresidual Prudent Valuation Adjustment; 4. On the basis of actual 9% allocated equity; 5. Booked in Corporate Centre
Constraints already partly incurred by the Group and not yet allocated to businesses Contribution to Single Resolution Fund (SRF)
Increased CET1 ratio requirement
Equivalent to ~-4pts of RONE1 as of today2
Potential headwinds from upcoming regulatory changes Reviews of RWA and models3
Other banking and market regulations (MiFID II, US regulation for FBOs, etc.)
Magnitude and timing still uncertain
Possible delay but “wait and see” is not an option
Evolution of 2019 CIB RONE1
2015 Actual4
18.6%
~+8pts additional
RONE4
Transformation plan target: +8pts additional RONE4
Three implementation levers: Improve efficiency, Focus resources and Grow selectively
To be fine tuned and extended to 2020 in the Group upcoming 2017-2020 plan
Transformation Plan 20194
~-4% already incurred by the
Group2,5
Upcoming
Improve:+5pts
Grow:+1pt
Focus:+2pts
Headwinds
CIB 2016-2019 Transformation PlanSwift Actions Required to Absorb Headwinds

Morgan Stanley Conference – March 2016 25
CIB 2016-2019 Transformation Plan Three Levers Across All Regions & Business Lines
Specific strategic growth initiatives
Further develop strategic clients Invest in processing businesses:
i.e. Securities Services and Transaction Banking
Specific investmentsin Americas and APAC
+€21bn RWAs
Revenues: +€1.6bnCosts2: +€0.5bn
+€~0.5bn in pre-tax income4
Grow
1. Gross savings based on 2015 total CIB costs base including €50m cost savings linked to Focus initiatives; 2. Excluding regulatory costs and inflation; 3. Including ~€90m of residual S&E savings; 4. After impact of regulatory projects, inflation and variable on costs, cost of risk and non operating revenues; 5. Booked in Corporate Centre (€300m in 2016, 250m in 2017 and 2018)
Free-up capital and balance sheet to fuel targeted growth
Reduce unproductive RWAs through portfolios’ optimisation
Selective rightsizing of businesses, countries and client portfolios
Reinvest to capture market growth and increase market share
RWA gross reduction: -€20bnRWA reinvestment: +€10bn
Revenues: +€0.5bnCosts2: -€0.05bn
+€~0.2bn in pre-tax income4
Focus
Optimize CIB operating model
Industrialise the set up Improve operating efficiency Deliver enough savings
to support growth, while structurally reducing C/I ratio
12% total cost savings1,3
Revenues: no impactCosts2,3: -€0.95bn
+€0.95bn in pre-tax income4
Improve
One-off costs to achieve transformation: €800m over 2016-20195

Morgan Stanley Conference – March 2016 26
Conclusion
Solid organic capital generation10.9% fully loaded Basel 3 CET1 ratio
A well balanced and integrated business model resulting in a low risk profile and recurrent profit generation capacity
Preparation of a new 2017-2020 plan
Net tangible book value per share: €60.2ROTE 2015: 10.1%

Morgan Stanley Conference – March 2016 27
Operating Divisions Going Forward
Appendix
Strong Financial Structure and Value Creation
Solid 2015 Group Results

Morgan Stanley Conference – March 2016 28
Evolution of the Total Capital Ratio by 2019 Total Capital Ratio
Conservation buffer
Tier 2
Tier 1
CET1
* Reminder: Pillar 2 does not currently apply to Tier 1 and Total Capital as confirmed by the ECB in the 2015 SREP ; the SREP is carried out each year by the ECB, which can modify each year its capital adequacy ratio requirements
G-SIB buffer
BNPP01.01.2019
Total Capital ratio requirement of 12.5% in 2019 based on SREP 2015*
Target of a Total Capital ratio above 15% in 2019 Target of a fully loaded CET1 ratio of 12.0% Issuance of €1.5 to €2bn of Additional Tier 1 per year
during 3 years to achieve 1.5% of Tier 1 Issuance of €2 to €3bn of Tier 2 per year during
3 years to achieve ~2.0% of Tier 2
Bringing the Total Capital to over €100bn
Giving an excellent credit quality to the debt securities issued by BNP Paribas
BNPP’s 2016-2019 trajectory01.01.2019Requirements*
Minimum CET1 requirement (Pillar 1)
>15.0%
Minimum Total Capital
requirement
13.6%
BNPP31.12.2015(phased-in)
12.5%

Morgan Stanley Conference – March 2016 29
Evolution of the Total Loss Absorbing Capacity (TLAC) Ratio by 2019
TLAC Ratio
TLAC+ buffers**21.0%
Conservation buffer
Tier 2
Tier 1 CET1
* Depending on market conditions; ** Conservation buffer and G-SIB buffer
G-SIB buffer
BNPP01.01.2019
TLAC requirement of 20.5% in 2019 Including Conservation buffer and G-SIB buffer
Target of a TLAC ratio of 21.0% in 2019
Issue of ~€30bn of TLAC eligible senior debt by 01.01.2019* Given a MREL level of 2.5% eligible for TLAC Equivalent to ~€10bn per year, to be realised within
the usual medium long term funding programme of about €25bn per year
TLAC + buffers**20.5%
TLAC requirement01.01.2019
TLAC eligible debt
2019 BNPP 2019 requirement
TLAC ratio excluding buffers

Morgan Stanley Conference – March 2016 30
Buffers to Maximum Distributable Amount Restrictionsas at 01.01.2016
CET1
Capital requirements as at 01.01.2016
TIER 1
Reminder: Pillar 2 limited to the CET1 ratio Pillar 2 not applicable to Tier 1 and Total Capital*
ratio requirements
2016 CET1 requirement: 10.0% 2016 Tier 1 requirement: 7.125% 2016 Total Capital requirement: 9.125% Buffers as at 01.01.16 to Maximum Distributable Amount
(MDA**) restrictions CET1: 1.0% or €6.6bn*** Tier1: 5.1% or €32.0bn*** Total Capital: 4.5% or €28.5bn***
10.0%
TOTAL CAPITAL
7.125%
9.125%
G-SIB buffer
Conservation buffer
Pillar 2
Pillar 1
* Confirmed by the ECB in the 2015 SREP; ** As defined in Art. 141 of CRD4; *** Calculated based on €630bn of risk-weighted assets (phased-in)
11.0% 12.2% 13.6%BNP Paribas phased-in ratios as at 01.01.2016
1.0%€6.6bn
5.1%€32.0bn
4.5%€28.5bnBuffers as at 01.01.2016 to MDA** restrictions
Management buffer largely above regulatory requirements

Morgan Stanley Conference – March 2016 31
Wholesale Medium/Long-Term Funding
* Depending on opportunities and market conditions; ** As at 4 March 2016; *** Excluding TLTRO; **** Debt qualified prudentially as Tier 1 booked as subordinated debt or as equity
2015 MLT funding programme completed: €24.1bn Senior debt : €19bn issued (average maturity of 4.3 years,
mid-swap +24 bp) Additional Tier 1: €2.1bn issued (mid-swap + 497 bp) Tier 2: €3.1bn issued (average maturity of 9.4 years,
mid-swap +165 bp) Reminder: €14bn TLTRO taken at the end of December 2014
2016 MLT funding programme: €25bn Of which Additional Tier 1: €1 to €2bn* Of which Tier 2: €2 to €3bn* Of which TLAC eligible senior debt: ~€10bn*
Public issuances already made under the 2016 programme**: Tier 2: €750m issued on 19.11.2015 (10 years) and €750m issued on
04.03.2016 (10 years) Senior debt: €1.25bn issued on 08.01.2016 (7 years) and €1.0bn issued on
16.02.2016 (10 years) Covered Bond: €750m issued on 22.01.2016 (5.5 years)
Wholesale MLT funding structure breakdown as at 31.12.15: €142bn***
Tier One****: 9Other
subordinateddebt: 16
Senior secured: 25
Senior unsecured: 92
€bn

Morgan Stanley Conference – March 2016 32
Bank BGZPoland
ROE Accretive Bolt-on Acquisitions in 2014 and 2015
• Creation of the 7th largest bank in Poland with ~4% market share
• Broadening Group’s digital banking offer
Levers for additional profit generation going forward
Bolting onto existing
businesses
BNPP Polska
50% of LaSerEurope - France
• Merger completed on 1.09.2015• Targeting 1% market share growth
per year in France in 2016-2018Cetelem
DAB BankGermany
• ~1.6 million clients• #1 online broker** and Top 5 digital
bank in Germany
Consorsbank!
GE Fleet ServicesEurope
• +164,000 vehicles• Arval now #1 in Europe with
strengthened positions in all countries, ~950,000 vehicles
Arval
Additional synergiesexpected by 2017*
* Excluding restructuring costs ; ** Cumulated ; *** In terms of retail trades and securities accounts
€m
2014
2015
Year of acquisition

Morgan Stanley Conference – March 2016 33
Domestic Markets - 2015
Good income increaseGradual return to economic growth in Europe
* Including 100% of Private Banking, excluding PEL/CEL effects; ** Excluding non recurrent contribution to the resolution process of 4 Italian banks (€65m) and one-off restructuring costs (€20m); *** Including 2/3 of Private Banking, excluding PEL/CEL effects
Business activity Loans: +1.6% vs. 2014, gradual recovery in demand for loans Deposits: +6.5% vs. 2014 Rise of private banking AuM in France, Italy and Belgium: +5.3% vs. 31.12.14
Ongoing expansion of the digital offering and transformation of the customer experience : omni-channel, mobile and real time
Revenues*: €15.9bn; +1.6% vs. 2014 Good performance of BRB, Arval, Leasing Solutions and Personal Investors Impact of persistently low interest rates
Operating expenses*: €10.3bn; +3.1% vs. 2014 +0.8% at constant scope and exchange rates **
Pre-tax income***: €3.6bn; +6.4% vs. 2014 Decrease in the cost of risk, in particular in Italy
Other DM
FRB
BNL bc
Loans€bn +1.6%
BRB
344 350
Pre-tax income***
+6.4%
€bn

Morgan Stanley Conference – March 2016 34
Regulatory changes
Additional complexity due to new regulatory requirements Expected to potentially alter the competitive landscape
Create new digital customer journeys and seize opportunitiesentailed by regulatory evolutions
Evolving customer behaviours & expectations
Banking customers expectations increasing with new digital standards: value added, seamless, efficiency and security
Available data and digital tools create opportunities to enrich the customer relationship and generate new revenues
Traditional networks only partially answer these expectations:reinvent client experience and adapt commercial strategy
Profitability challenges
Low interest rate environment and margins under pressure Growing investment needs (IT/data) to align with new digital
standards
Roll-out digital transformation to reduce costs and adapt the historical operating model
Competition & digital disruption
Internet giants are developing financial service offerings, notably in the payment area
FinTechs are attracting significant investments to innovate certain areas of banking activity
Propose best-in-class offerings & services and agileimplementation of new cooperation models
Domestic Markets - Medium-term AmbitionsStructural Changes Requiring Transformation Actions
Accelerated time
Direct access everywhere/every time
Simple, reliable & intuitive
Revised European Directive on Payment Services
MiFID 2
Payments
Crowdfunding
Market activitiesInfrastructures
Investment/planning
Interactive & customised
2006-2007 2013-2014
Cost/Income(European banks)
New client relationship
Morgan Stanley Conference – March 2016 35
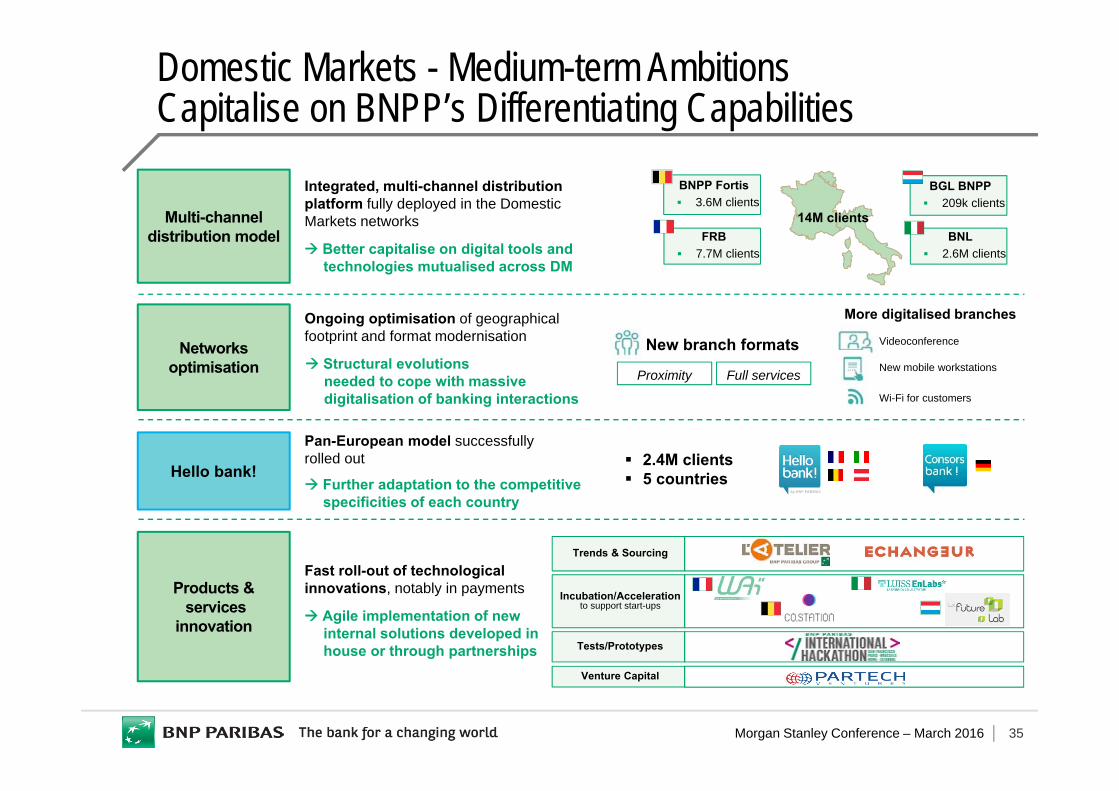
Domestic Markets - Medium-term AmbitionsCapitalise on BNPP’s Differentiating Capabilities
Multi-channel distribution model
Networks optimisation
Hello bank!
Products &services
innovation
Integrated, multi-channel distribution platform fully deployed in the Domestic Markets networks
Better capitalise on digital tools and technologies mutualised across DM
Ongoing optimisation of geographical footprint and format modernisation
Structural evolutionsneeded to cope with massivedigitalisation of banking interactions
Pan-European model successfully rolled out
Further adaptation to the competitive specificities of each country
Fast roll-out of technological innovations, notably in payments
Agile implementation of newinternal solutions developed in house or through partnerships
BGL BNPP 209k clients
BNPP Fortis 3.6M clients
FRB 7.7M clients
14M clientsBNL
2.6M clients
New branch formats
More digitalised branches
Videoconference
New mobile workstations
Wi-Fi for customers
2.4M clients 5 countries
Proximity Full services
Incubation/Accelerationto support start-ups
Tests/Prototypes
Venture Capital
Trends & Sourcing
Morgan Stanley Conference – March 2016 36
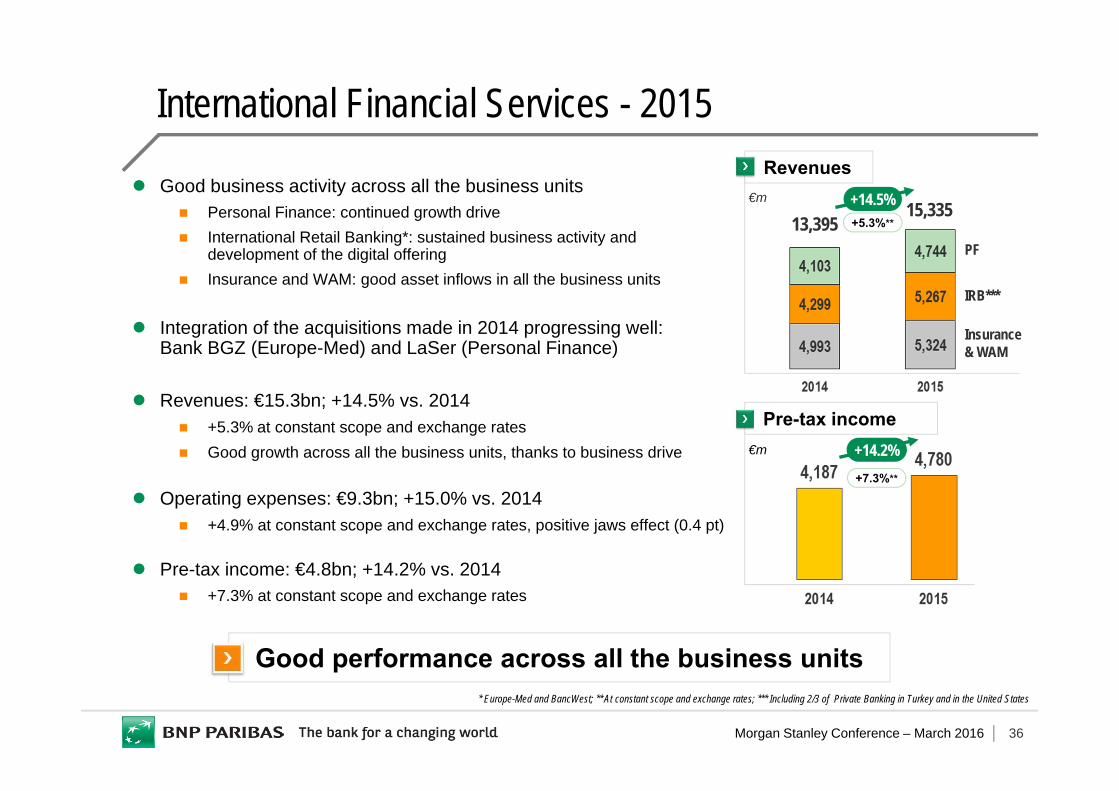
International Financial Services - 2015
Insurance& WAM
PF
Revenues€m +14.5%
IRB***
13,39515,335
Good performance across all the business units* Europe-Med and BancWest; ** At constant scope and exchange rates; *** Including 2/3 of Private Banking in Turkey and in the United States
Good business activity across all the business units Personal Finance: continued growth drive International Retail Banking*: sustained business activity and
development of the digital offering Insurance and WAM: good asset inflows in all the business units
Integration of the acquisitions made in 2014 progressing well:Bank BGZ (Europe-Med) and LaSer (Personal Finance)
Revenues: €15.3bn; +14.5% vs. 2014 +5.3% at constant scope and exchange rates Good growth across all the business units, thanks to business drive
Operating expenses: €9.3bn; +15.0% vs. 2014 +4.9% at constant scope and exchange rates, positive jaws effect (0.4 pt)
Pre-tax income: €4.8bn; +14.2% vs. 2014 +7.3% at constant scope and exchange rates
Pre-tax income€m +14.2%
+5.3%**
+7.3%**

Morgan Stanley Conference – March 2016 37
Corporate and Institutional Banking - 2015
* +14.4% excluding the impact of the introduction of Funding Valuation Adjustment (-€166m) in 2014; ** Including CIB and Securities Services; *** Intermediate Holding Company
Strong income growth
Revenues: €11,659m (+13.2% vs. 2014) Rise across all the business units: Global Markets
(+18.1%*), Securities Services (+14.1%) and Corporate Banking (+5.7%)
Increase in Europe, strong growth in the Americas and rise in Asia-Pacific
Operating expenses: €8,278m (+11.5% vs. 2014) Positive jaws effect: +1.7 pts; cost/income ratio: 71% +3.4% at constant scope and exchange rates:
impact of the appreciation of the U.S. dollar Increase in regulatory costs (implementation of the
IHC***, compliance, etc.) partly offset by the effects of Simple & Efficient (~€176m in savings)
Pre-tax income: €3,329m (+17.9% vs. 2014) +7.6% at constant scope and exchange rates
Pre-tax income
Revenues by business unit€m
Total: +13.2% vs. 201410,110 10,298 11,659
Equity &Prime Services: +23.6%
FICC: +15.2%
CorporateBanking: +5.7%
Securities Services: +14.1%
Introduction of FVA (FICC)

Morgan Stanley Conference – March 2016 38
A Business Model Focused on Serving Two BalancedFranchises: Corporates and Institutionals
More than 10,000 clients of Domestic Markets and International Financial Services served by CIB in 2015
Corporate & Institutional Banking
Global Institutional Franchise
(~9,500 clients)
Promote advisory and optimised financing solutions
Connect clients to investment opportunities worldwide
Structure investment products for institutional clients
Offer custody and clearing solutions
Global Corporate Franchise
(~7,000 clients)
Structure financing solutions
Offer advisory and capital market products to corporates
Develop new cash management and trade finance solutions
BNP Paribas Group
APACAMERICAS
EMEA
Corporate Banking
Securities Services
Global Markets

Morgan Stanley Conference – March 2016 39
CIB 2016-2019 Transformation PlanImprove Cost Efficiency
1. Including -€90m of residual effect from S&E; 2. Excluding constraints already partly incurred by the Group and not yet allocated to the business units and potential future constraints
Cost savings: >€1bn vs. 2015 All regions, businesses & functions contributing
to the savings target 200 efficiency projects to improve operating efficiency
Cost/income target: >-8pts by 20192
Continued cost effort to offset impact on the costs of regulatory costs, inflation and growth initiatives
Industrialisation and deep changes in terms of set up Optimised organisation of business lines (simplification,
standardisation, etc.): -€260m Smart sourcing including the development of
mutualised platforms in Portugal, Canadaand India: -€230m
Industrialisation of IT and operational process: -€365m Digital solutions, expense discipline and other
initiatives: -€180m
Evolution of CIB cost base
2019Target
Regulatory costs and inflation
0.5
0.5
Improve1
-0.95
2015
In €bn, excl. variable compensation
GrowFocus
-0.05
Morgan Stanley Conference – March 2016 40
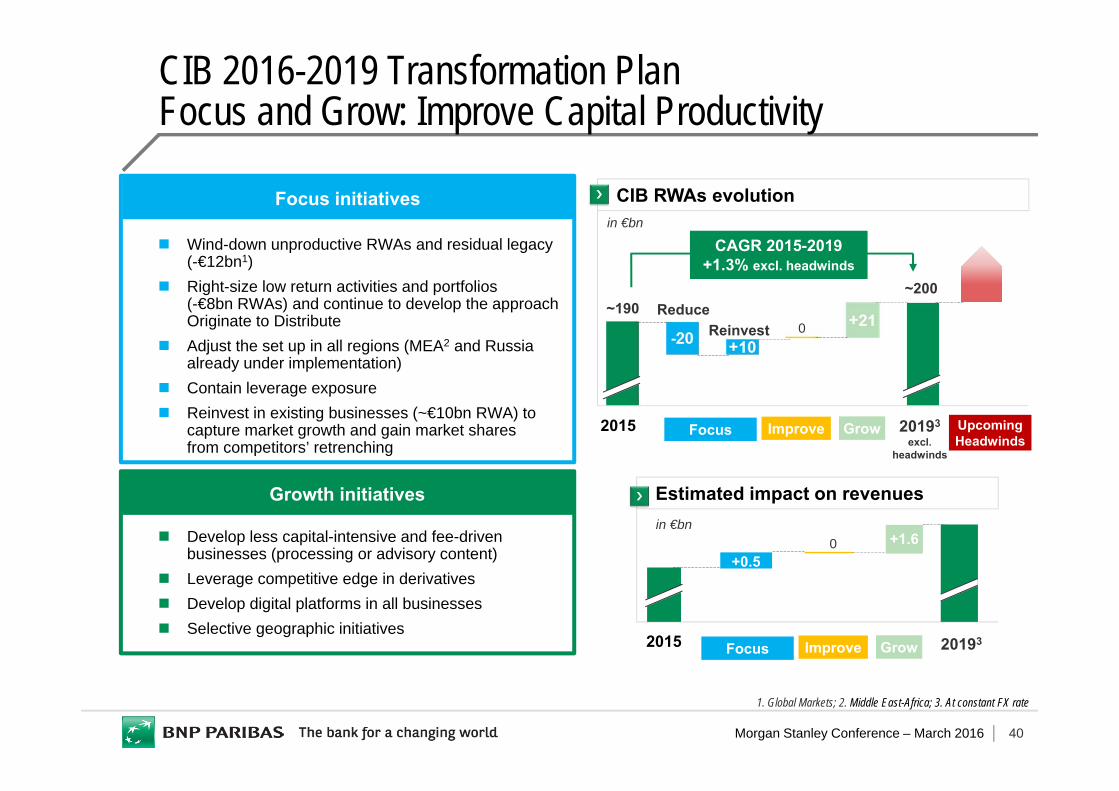
CIB 2016-2019 Transformation PlanFocus and Grow: Improve Capital Productivity
Wind-down unproductive RWAs and residual legacy(-€12bn1)
Right-size low return activities and portfolios(-€8bn RWAs) and continue to develop the approach Originate to Distribute
Adjust the set up in all regions (MEA2 and Russiaalready under implementation)
Contain leverage exposure Reinvest in existing businesses (~€10bn RWA) to
capture market growth and gain market shares from competitors’ retrenching
Develop less capital-intensive and fee-driven businesses (processing or advisory content)
Leverage competitive edge in derivatives Develop digital platforms in all businesses Selective geographic initiatives
1. Global Markets; 2. Middle East-Africa; 3. At constant FX rate
Focus initiatives
Growth initiatives Estimated impact on revenues
2015
+0.5+1.6
CIB RWAs evolution
20193
excl. headwinds
ReinvestReduce
2015
~190
Focus Grow
in €bn
CAGR 2015-2019+1.3% excl. headwinds
+10
~200
UpcomingHeadwinds
Improve
0
20193Focus GrowImprove
0in €bn

Morgan Stanley Conference – March 2016 41
Financing Businesses& Advisory
Market Intermediation Businesses
Processing Businesses
CIB Transformation Plan : Develop Less Capital-intensive Businesses & Advisory / Processing Activities
• Securities Services
• Transaction Banking
• Equities• Credit • Forex• Rates• Commodity
Derivatives
Increase shift towards fee-driven products
Develop advisory, leveraging on Group’s close relationships with corporates
Leverage Corporate Debt Platform to structure debt solutions and further grow corporate bonds origination
Benefit from market repricing in prime services
Become top 4 global multi-asset servicer – Leveraging Group’s financial institutions franchise
and Global Markets platforms
Become leading multi-regional flow provider– Reinforce Cash management franchises – Selectively enhance trade finance capabilities
Invest in businesses with competitive edge or supporting the Group franchises (derivatives, credit, FX,…)
More efficient use of capital and balance sheet resources
Shift from voice to electronically traded markets
Transformation path
Trajectory2016-2019
RWA resources
Competitive positioning
Competitive positioning
Competitive positioning
RWA resources
RWA resources
• Financing Solutions
• Advisory• Primary • Prime
Solutions& Financing
Business lines
Cor
pora
teB
anki
ngG
loba
l Mar
kets

Morgan Stanley Conference – March 2016 42
CIB 2016-2019 Transformation PlanTransformation Path Adapted to Regional Positioning
EMEA(57% of 2015 revenues)
APAC(22% of 2015 revenues)
Americas(21% of 2015 revenues)
BNP Paribas’ home market:among European leaders
Good positioning in selected businesses
Opportunistic positioning, behind firms with large US franchises
Intensify focus on strategic clients to maximize wallet share
Grow in fee-driven businesses and Securities Services
Global Markets: focused investments in specific segments
Strong cost effort and resource optimization
Capitalizing on the success of the APAC plan
Grow Europe-APAC cross-border business for Corporates
Grow franchise of large local clients with regional needs
Continue to develop cross-selling with Wealth Management
Taking advantage of LT regional growth
Benefit from the momentum created by the CIB US plan
Focus on strategic clients with global needs to grow cross-selling
Grow wallet share of cross-border flow banking businesses
Optimise cost structure and benefit from investments on IHC2
Better align the platform with the Group strategy and franchises
An even stronger European leader
Stra
tegy
Com
petit
ive
Posi
tioni
ng1
1. Source: Oliver Wyman 2014, Dealogic and internal; 2. Intermediate Holding Company
Positionning:#1 Financing business and Securities Services Top 3 Transaction Banking and Equity DerivativesTop 5 Fixed Income
Positionning:Top 5 Equity DerivativesTop 9 Transaction Banking and Financing business>Top 10 Fixed Income
Positionning:Top 10 Transaction Banking>Top 10 in other businesses

Morgan Stanley Conference – March 2016 43
CIB 2016-2019 Transformation PlanCIB Transformation: 2019 Targets
Develop fully digitalised processes and data analytics capabilities
Investingin digital
transformation
Investingin digital
transformation
Creating sustainable
value
Creating sustainable
value
Enhance operating efficiency and free-up resources to support selective growth
Develop less capital-intensive businesses and more advisory / processing activities
Integrated within the Group
Integrated within the Group
Responsible and
inspiring for staff
Responsible and
inspiring for staff Dedicated to finance the economy with the
utmost ethical standards
Key financial targets
Contribute further to the development ofthe Group corporate and institutional client franchises
2019 Targetvs 2015
Revenues1
(CAGR)Cost Income1
CIB ≥+4% >-8pts
2019 pre-tax income1: +€1.6bn vs 2015
A CIB…
1. Excluding constraints already partly incurred by the Group and not yet allocated to the business units and potential future constraints
Morgan Stanley Conference – March 2016 44
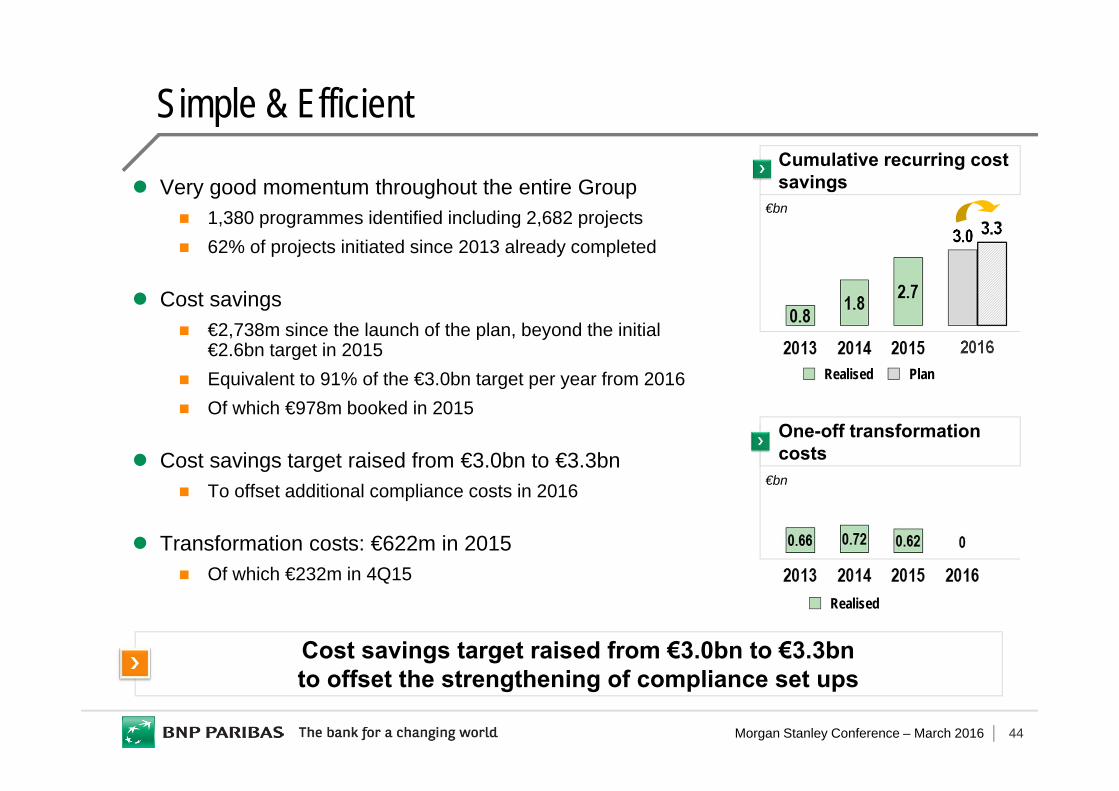
Simple & Efficient
Very good momentum throughout the entire Group 1,380 programmes identified including 2,682 projects 62% of projects initiated since 2013 already completed
Cost savings €2,738m since the launch of the plan, beyond the initial
€2.6bn target in 2015 Equivalent to 91% of the €3.0bn target per year from 2016 Of which €978m booked in 2015
Cost savings target raised from €3.0bn to €3.3bn To offset additional compliance costs in 2016
Transformation costs: €622m in 2015 Of which €232m in 4Q15
Cost savings target raised from €3.0bn to €3.3bn to offset the strengthening of compliance set ups
Cumulative recurring costsavings
€bn
One-off transformation costs
€bn
Realised
PlanRealised2016
3.0 3.3

Morgan Stanley Conference – March 2016 45
Net provisions/Customer loans (in annualised bp)
Group
Cost of risk: €3,797m (+€92m vs. 2014) Scope effect linked to the acquisitions made in 2014
(+€143m vs. 2014) Cost of risk down slightly excluding this effect
Cost of Risk - 2015 (1/2)
CIB - Corporate Banking
€139m (+€8m vs. 2014) Cost of risk at a very low level

Morgan Stanley Conference – March 2016 46
Net provisions/Customer loans (in annualised bp)
FRB €343m (-€59m vs. 2014) Cost of risk still low
BNL bc €1,248m (-€150m vs. 2014) Decline in the cost of risk Significant decrease in
doubtful loan inflows
BRB
€85m (-€46m vs. 2014) Cost of risk particularly low
Europe-Mediterranean €466m (+€109m vs. 2014) Scope effect linked to the
acquisition of BGZ: €38m
Cost of risk ~stable (bp)
BancWest €50m (stable vs. 2014) Cost of risk still very low
Personal Finance €1,176m (+€81m vs. 2014)
Scope effect linked to the acquisitions
Decrease in the cost of riskexcluding this effect
Cost of Risk - 2015 (2/2)

Morgan Stanley Conference – March 2016 47
Review of industries affected by the decrease of oil and commodities prices Exposure to Oil & Gas and Metals & Mining: respectively
2.45% and 0.98% of the Group’s gross commitments on and off-balance sheet
Strong reduction of the Energy & Commodities business since 2013 Positive impact of the decrease of prices on a large number of industries:
transport, chemicals, food & beverage, automotive
Oil & Gas: €25.6bn net exposure* Close to 60% of gross exposure on Majors and national oil companies 75% of investment grade** exposure Good coverage with collaterals for non investment grade**
exposure Short average maturity: less than 2 years Only 1% of doubtful exposure Reminder: sale of the Reserve Based Lending business
in the US in 2012
Metals & Mining: €8.4bn net exposure* 60% of investment grade** exposure Short average maturity: less than 2 years Diversified portfolio with different sectorial dynamics Only 3% of doubtful exposure
Specific Review of Industries Affected by Oil and Commodities Prices
Total gross commitments of the Group
Well-diversified quality portfolios
National oil companies 0.64%
Oil & Gas services 0.42%
Shipyards 0.09%
Upstream 0.56%
Majors 0.74%
Oil & Gas (2.45%)of which 54% off balance sheet
Metals & Mining (0.98%)of which 48% off balance sheet
Steel 0.29%
Diversified players 0.36%
Specialised players
* Net of guarantees and provisions; ** External rating or BNP Paribas’ equivalent rating
Total gross commitments on and off balance sheet, unweighted of €1,399bn as at 31.12.2015
Aluminium 0.09%
Coal & Iron ore 0.09%
Base metals 0.07%
Precious metals 0.09%