bmp: brand management process establishing brand positioniing creating brand design measuring brand...
Post on 22-Dec-2015
246 views
TRANSCRIPT

BMP: Brand Management Process
• Establishing BRAND POSITIONIING
• Creating BRAND DESIGN
• Measuring BRAND PERFORMANCE
• Sustaining BRAND EQUITY

Why Measure?
• How strong is our brand?• Impact of Marketing Activity• Overall value of the Brand
RETURN ON MARKETING INVESTMENT (ROMI)

Brand Value Chain
Marketing Inputs
ConsumerMindset
Market Performance
Measuring Brand Performance
Quantitative Research
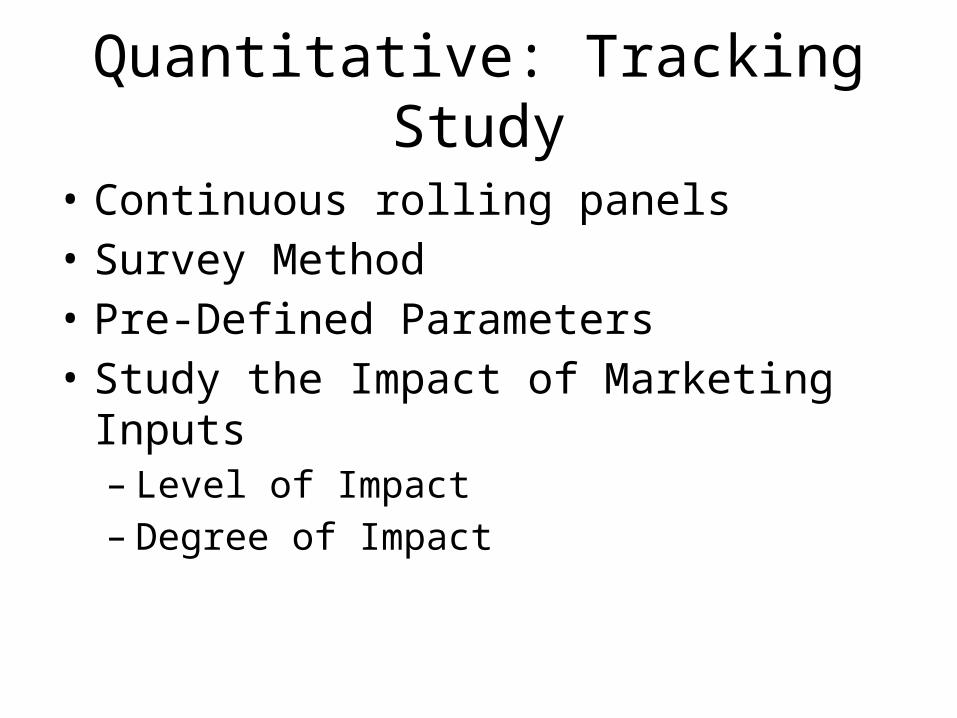
Quantitative: Tracking Study
• Continuous rolling panels• Survey Method• Pre-Defined Parameters• Study the Impact of Marketing Inputs
– Level of Impact– Degree of Impact

Product-Brand Tracking
• Brand Awareness– Recall (TOM/Unaided/Aided)– Recognition
• Ad Awareness• Brand Associations
– Benefit Associations– Quality Associations– Image Associations
• Brand Consideration
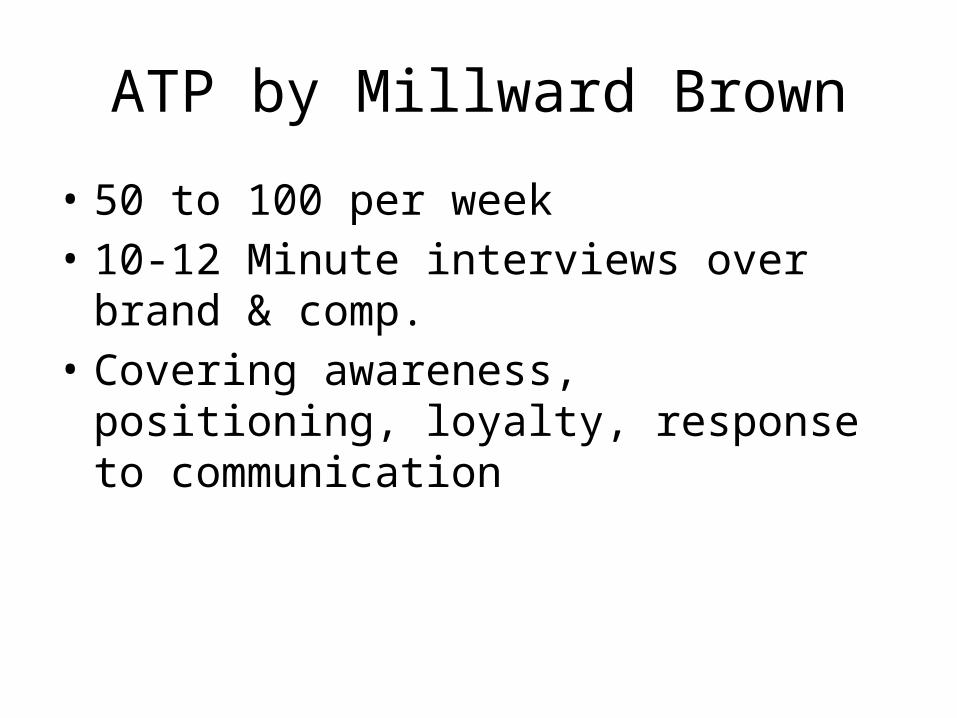
ATP by Millward Brown
• 50 to 100 per week• 10-12 Minute interviews over brand & comp.• Covering awareness, positioning, loyalty,
response to communication

ATP Sample Data

MethodologyWhat?
Where?
When?
Millward Brown ATP
Mumbai, Delhi, Kolkata, Chennai, Bangalore, Hyderabad, Ahmedabad
October – December, 2004
Who?MALES Aged 25- 50 years From SEC A/B Working Full Time Decision maker for financial products in the household
FEMALES Aged 25- 50 years From SEC A/B Working Decision maker OR Joint Decision maker for financial products in the household

Oct’04 – Dec’04
In Rs. Lakhs
1. ICICI Prudential
235
2. HDFC Standard
178
3. LIC
136
4. SBI Life
101
5. Aviva
86
6. Bajaj Allianz
84
7. AMP Sanmar
48
8. Max New York
53
9. Birla Sun Life
44
10. Tata AIG
29
11. ING Vysya
17
12. Om Kotak
15
13. MetLife 8
Top spenders across markets – Press*
Mumbai
LIC 65
ICICI Prudential 62
HDFC Standard 48
Aviva 33
SBI Life 24
Delhi
LIC 64
HDFC Standard 36
Aviva 28
Max New York 26
ICICI Prudential 26
Kolkata
LIC 50
ICICI Prudential 33
HDFC Standard 27
SBI Life 15
Aviva 12
Chennai
LIC 21
HDFC 15
Max New York 9
ICICI Prudential 9
AMP Sanmar 7
Bangalore
LIC Total 19
HDFC Standard 15
ICICI Prudential 12
SBI Life 9
Aviva 8
Hyderabad
Tata AIG 1
SBI Life 4
Om Kotak 0
MetLife 2
Max New York 4
Ahmedabad
ICICI Prudential 15
HDFC Standard 12
LIC 11
SBI Life 8
Aviva 5
Source: Mind Share
*Normalized to 100cc

Snapshot – 7 marketsAll figures are in % I-Pru LIC TATA-AIGBase - 3654 respondents
Brand AwarenessTOM Recall 6 87 0Spontaneous Recall 54 99 28
Ad AwarenessSpontaneous Recall 28 60 10
ConsiderationTop box 2 86 0Top 2 boxes 42 91 10
ImageThe best company to have a relationship with 26 96 8
Offers the best returns 23 86 6
Comes out with new & innovative products 30 86 8GRPs 7222 17 3313
Press Spends (Rs. Lakhs) 169 245 38
(Mumbai+Delhi+Kolkata+Chennai+Bangalore+Hyderabad+Ahmedabad)
LIC has the highest scores on brand health, imagery and consideration.

Communication Awareness
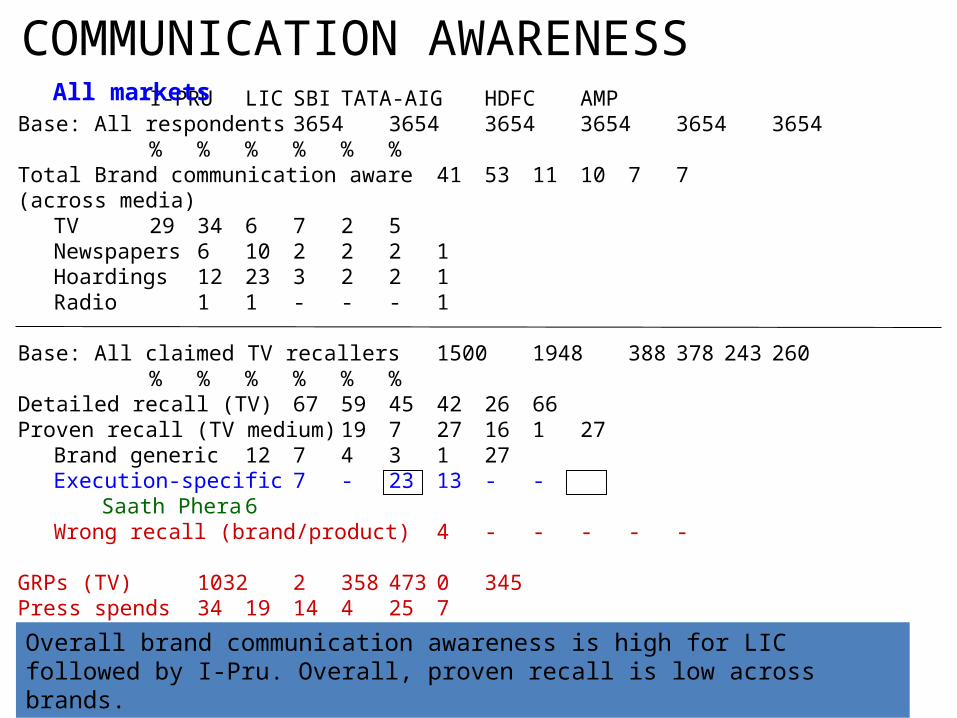
COMMUNICATION AWARENESSI-PRU LIC SBI TATA-AIG HDFC AMP
Base: All respondents 3654 3654 3654 3654 3654 3654% % % % % %
Total Brand communication aware 41 53 11 10 7 7(across media)
TV 29 34 6 7 2 5Newspapers 6 10 2 2 2 1Hoardings 12 23 3 2 2 1Radio 1 1 - - - 1
Base: All claimed TV recallers 1500 1948 388 378 243 260% % % % % %
Detailed recall (TV) 67 59 45 42 26 66Proven recall (TV medium) 19 7 27 16 1 27
Brand generic 12 7 4 3 1 27Execution-specific 7 - 23 13 - -
Saath Phera 6Wrong recall (brand/product) 4 - - - - -
GRPs (TV) 1032 2 358 473 0 345Press spends 34 19 14 4 25 7
All markets
Overall brand communication awareness is high for LIC followed by I-Pru. Overall, proven recall is low across brands.

Execution Recall – ICICI PrudentialExecution-recallBase : Proven recallers of I-Pru Har Vaada ad 90
%Shown man emptying suitcase of angry wife 9Voice-over: Saat janmo tak suraksha karoonga 7Shown old man help wife get into an escalator 10Shown couple walking around fire 74Husband applies sindoor on wife’s head 60Any mention of ICICI Prudential 43
Impressions% Agree strongly Mean score
Made you more interested to know about pdts of I-Pru 20 3.73What it said was relevant to me 21 3.88What it said was believable 29 3.95Told me something new 29 3.85Is an enjoyable ad 55 4.34More likely to consider the next time 26 3.69
Weak recall of executional lements; seen more as an enjoyable ad and evokes lower than desired scores on response measures.

Profile of proven recallersBase : Proven recallers of I-Pru ad 90
%Mumbai 23Delhi 10Chennai 61Bangalore 1Hyderabad 1Ahmedabad 3
25-35 years 6436-50 years 36
SEC A1+ 22SEC A1 33SEC B 44
Recall of I-Pru largely led by Chennai and amongst younger audience.

All figures are in % All Currently Invested Aware Currently Invested
Rejecter of L.I Non-Rejecter of L.I Non-Rejecter of L.I
ZINDAGI KE SAATH BHI, ZINDAGI KE BAAD BHI
Life Insurance Corporation (LIC) 59 40 65 56
ICICI Prudential Life Insurance 11 22 11 8
SBI Life Insurance 1 4 1 0Base: All respondents recalled the slogan____ 1580 131 741 708
HAR VAADE MEIN AAPKE SAATH
ICICI Prudential Life Insurance 34 22 38 32
Life Insurance Corporation (LIC) 23 25 27 18
Kotak Mahindra 1 - 1 1
SBI Life Insurance 1 3 2 1
Tata AIG Life Insurance 1 1 1 2Base: All respondents recalled the slogan____ 1011 72 459 480
JEENE KI AZAADI
Life Insurance Corporation (LIC) 22 29 23 19
ICICI Prudential Life Insurance 10 8 13 6
Tata AIG Life Insurance 6 1 7 5
Kotak Mahindra 3 3 2 4Base: All respondents recalled the slogan____ 964 106 417 441
SLOGAN RECALL

All figures are in % All Currently Invested Aware Currently Invested
Rejecter of L.I Non-Rejecter of L.I Non-Rejecter of L.I
KAL PAR CONTROL
Aviva Life insurance 21 4 19 26
ICICI Prudential Life Insurance 10 4 12 8
Life Insurance Corporation (LIC) 9 25 11 5
Kotak Mahindra 3 0 3 5
Tata AIG Life Insurance 3 4 2 3Base: All respondents recalled the slogan____ 552 48 242 262
HAVE YOU MET LIFE TODAY
MetLife Insurance 65 44 66 67
Life Insurance Corporation (LIC) 3 6 5 1
ICICI Prudential Life Insurance 1 8 1 0
Max New York Life Insurance 1 3 1 1Base: All respondents recalled the slogan____ 902 62 427 413
SLOGAN RECALL

Brand Associations

2523
-186
-20
-85
15654
7030
3715
3530
2729
5540
5530
3550
455052
47
4545
5538
5040
215
101922
15
512
-2710
7
IMAGE PROFILES - An Illustration
Innovative services
This brand is most visible
Offers good value to customers Good network of agents
wide range of products
Promptness - complaints
Responsive Company personnelInnovative schemes
Modern organisation
Good schemes
Open on convenient times
©
PSU Brand
Very trustworthy
Pvt. Brand PSU Brand Pvt. Brand
% Associations Differentiation
BRAND IMAGE PROFILING

4
-2
-4
-5
-3
-1
2
1
4
2
1
-5
-3
2
-1
3
-1
4
-1
2
-1
-3
-3
0
-1
2
2
-1
2
2
-1
-6
-1
-2
-4
1
9
-3
-1
-1
0
10
Best Insurance Co. to have a relationship with
Takes care of its customers
Offers the best returns
Comes out with new & innovative products
Makes products for people like me
Helps in choosing a policy
Different policies for the entire family
Delivers what it promises
Ensures safety of my money
Easy access for buying a policy /pay
premiums
Agents could be trusted to give correct
information
Will settle claims quickly
Addresses queries promptly
Can be trusted to be there ten years from
now
Base :
LICI-PRU SBI T-AIGHDFC ING V KOTAK
-1
1
2
1
0
0
0
-1
-1
0
0
1
0
0
1
1
1
1
1
-1
-2
0
1
0
-1
0
-1
1
-2
-1
1
-1
0
0
1
1
0
0
0
0
0
0
-1
1
0
0
0
0
0
1
-1
0
0
0
0
0
(3452) (3654) (2878) (2867) (2614) (1938) (2411)
BIP – 7 markets(Mumbai+Delhi+Kolkata+Chennai+Bangalore+Hyderabad+Ahmedabad)
Avg. Asso : 25 89 17 11 8 5 5

Imagery• ICICI Prudential
– Differentiates on following attributes
• Has different policies for entire family (Ahmedabad)
• Comes out with products that are new and innovative (Delhi, Mumbai)
• Takes care of its customers through good service (Hyderabad, Mumbai)
• Best Insurance company to have a relation with (Hyderabad)
• Will settle claims quickly (Hyderabad)
• Has knowledgeable agents who help me in choosing a policy (Bangalore, Chennai)
• Ensures safety of my money (Chennai)
• Will settle claims quickly (Chennai)
• Addresses queries promptly (Chennai)
• Can be trusted to be there ten years from now (Chennai)`

Imagery• LIC
– Not differentiated in Chennai & Hyderabad
– Differentiates on following attributes
• Best Insurance company to have a relation with (Ahmedabad, Bangalore, Delhi, Kolkata, , Mumbai)
• Company delivers what it promises (Ahmedabad)
• Addresses queries promptly (Bangalore)
• SBI Life
– Differentiates on following attributes
• Takes care of its customers through good service (Chennai, Mumbai)
• Ensures safety of my money (Chennai, Hyderabad, Mumbai)
• Can be trusted to be there ten years from now (Chennai, Hyderabad, Mumbai)
• Best Insurance company to have a relation with (Hyderabad)
• Company always delivers what it promises (Mumbai)

Brand Consideration
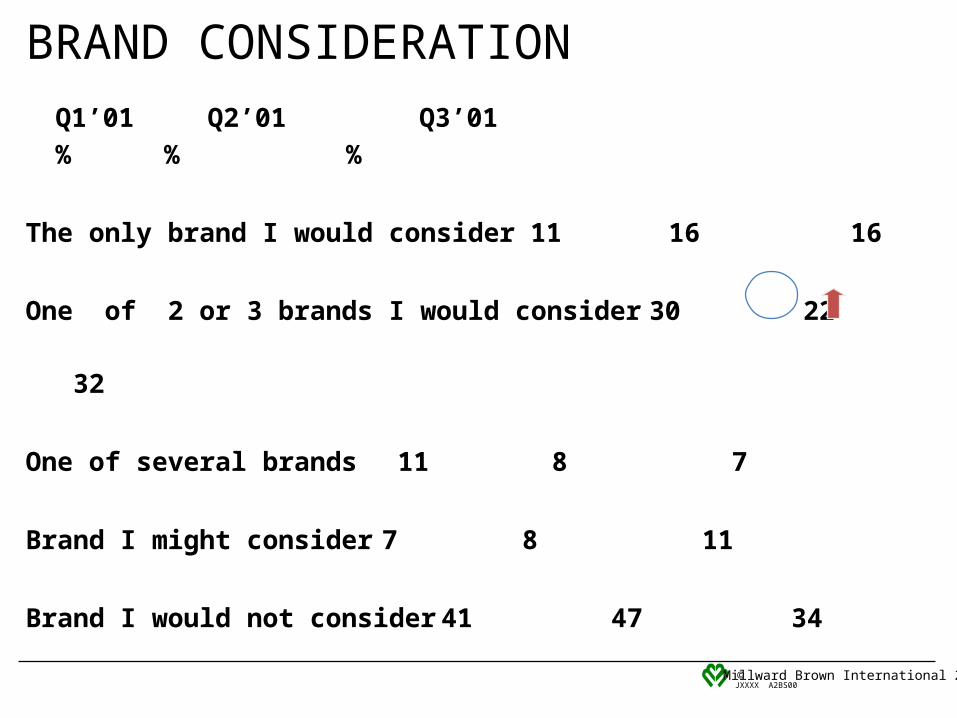
BRAND CONSIDERATION
Q1’01 Q2’01 Q3’01 % % %
The only brand I would consider 11 16 16
One of 2 or 3 brands I would consider 30 22 32
One of several brands 11 8 7
Brand I might consider 7 8 11
Brand I would not consider41 47 34© Millward Brown International 2001JXXXX A2BS00

All figures are in % All Currently Invested Aware Currently Invested
Rejecter of L.I Non-Rejecter of L.I Non-Rejecter of L.I
Extremely unlikely to purchase 31 68 17 36
Quite unlikely to purchase 15 10 13 19
Quite likely to purchase 22 14 30 14
Extremely likely to purchase 15 6 21 12
Base – All respondents 3654 375 1705 1574
INTENTION TO PURCHASE

All figures are in % All Currently Invested Aware Currently Invested
Rejecter of L.I Non-Rejecter of L.I Non-Rejecter of L.I
Life Insurance Corporation (LIC) 87 84 82 95
ICICI Prudential Life Insurance 3 8 3 2
SBI Life Insurance 1 3 1 0
Kotak Mahindra 0 1 0 0
Tata AIG Life Insurance 0 1 0 0
Base – All respondents 3654 375 1705 1574
RECOMMENDED LIFE INSURANCE COMPANY
Brand Dynamics
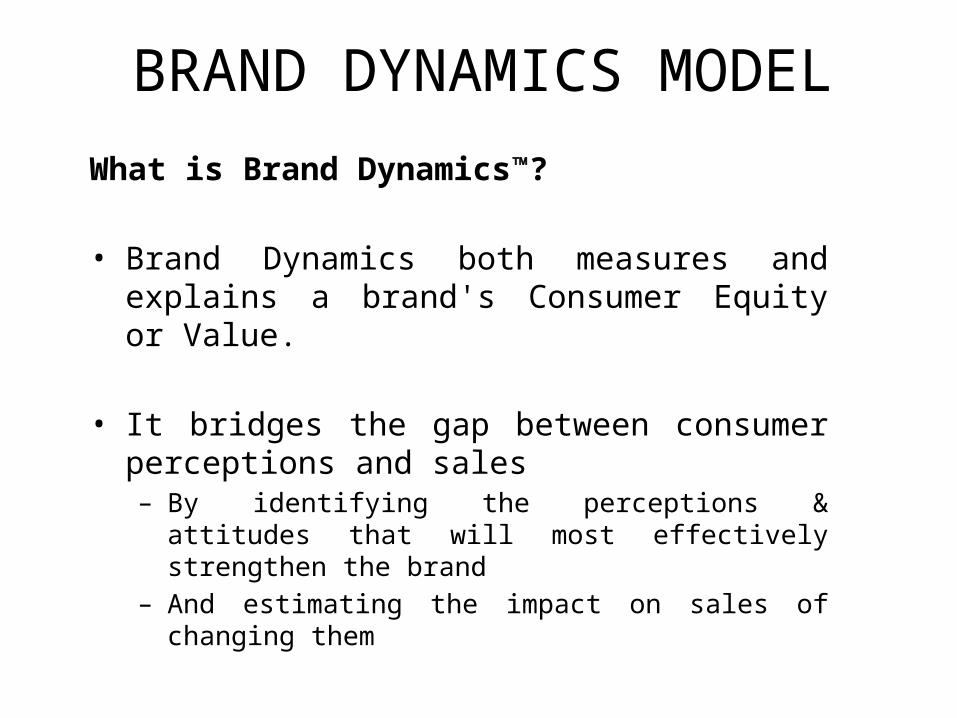
What is Brand Dynamics?
• Brand Dynamics both measures and explains a brand's Consumer Equity or Value.
• It bridges the gap between consumer perceptions and sales– By identifying the perceptions & attitudes that will most
effectively strengthen the brand– And estimating the impact on sales of changing them
BRAND DYNAMICS MODEL

Components of Brand Dynamics
Consumer Value
CONSUMER VALUE is the potential value of each consumer to the brand.
Measured through a “consideration” scale which is suitably adjusted for effects such as brand size, consumer typology, brand price etc. Consumer Value correlates very well with value share of the brand.

Brand Pyramid : the “dynamics” of Consumer Value
Helps to explain why the strength of someone’s relationship with a brand might vary based on their brand associations.
This is done through the Brand Pyramid framework which draws a hierarchy of consumers for each brand - depending on their relationship with the brand.
Components of Brand Dynamics

BRAND PYRAMID
[c:\andy aequity \afsell3.ppt\23]
Millward Brown International
BrandDynamics™ PYRAMID
The Brand Pyramid is the framework fordefining how consumers relate to brands
BondedBonded
AdvantageAdvantage
PerformancePerformance
RelevanceRelevance
PresencePresence

THE FIVE LAYERS OF THE PYRAMID
g Presence is the gateway to the market
g Consumers without presence are of little current value to the brand.
PRESENCE

g The size of the market available to the brand is defined by the relevance of the brand to the consumers needs and pocket.
PRESENCE PRESENCE PRESENCE
RELEVANCE
THE FIVE LAYERS OF THE PYRAMID

g For a consumer to buy the brand repeatedly, it must deliver acceptable product performance.
PRESENCE PRESENCE PRESENCE
RELEVANCE
PERFORMANCE
THE FIVE LAYERS OF THE PYRAMID

g For consumers to commit more expenditure to the brand, it must have an advantage for them over other brands.
PRESENCE PRESENCE PRESENCE
RELEVANCE
PERFORMANCE
ADVANTAGE
THE FIVE LAYERS OF THE PYRAMID

g The more unique the perceived advantage, the greater the chance of consumers becoming bonded to the brand.
PRESENCE PRESENCE PRESENCE
RELEVANCE
PERFORMANCE
ADVANTAGE
BONDING
THE FIVE LAYERS OF THE PYRAMID

CALCULATING CONVERSION PROFILES
Bonding
Advantage
Performance
Relevance
Presence
29/68 = 43%
68/85 = 80%
85/85 = 100%
85/85 = 100%
85/100 = 85%
58%
69%
95%
88%
75%
Conversion
85%
85%
85%
68%
29%
Expected Conversion
Pyramid Conversion
Profile
-15
11
5
12
10

CASE STUDY-PEPSODENT-

BRAND PYRAMIDS - PEPSODENT : DELHI
Base : (650) (650) (550) (650)
Bonding
Advantage
Performance
Relevance
Presence 83%
82%
82%
50%
19%
Q1’01%
81%
76%
75%
52%
21%
Q2’01%
Q3’01%
86%
85%
84%
67%
25%40
69
99
94
81
38
79
100
99
8685%
85%
85%
68%
29%
Q3’00%

Acceptable Price
Appeals More
Better Performance
Different
Growing popular
High Opinion
Most Popular
DIAGNOSIS OF ADVANTAGE
Base : 414 549Consumers at product performance level (or above)
© Millward Brown International 2001JXXXX A2BS00
49
57
39
56
58
61
30
Q3’01%
Q2 ’01%
52
68
48
65
71
72
32

Measuring Brand Performance
Qualitative Research

Association Techniques
Respond to the presentation of a stimulus with the first thing(s) that comes to mind
Word association -- Free word / Successive word
Personification [Exercise: Axe/FAL/CP/Surf]
Analogies and Metaphors [Cricketer: Enfield]
Picture Association
Film and Song Titles

Completion Techniques
Respondents are required to complete an
incomplete stimulus
Sentence completion
Story building
Cartoon completion
Clues and scenarios
Make an advertisement

Construction Techniques
Require the respondent to produce/construct something Brand Mapping [Cold Drinks] Classification/Grouping [Indian Filmmakers] Family Trees [Toothpaste] Laddering [Sony Plasma] Life Cycle [Detergent]
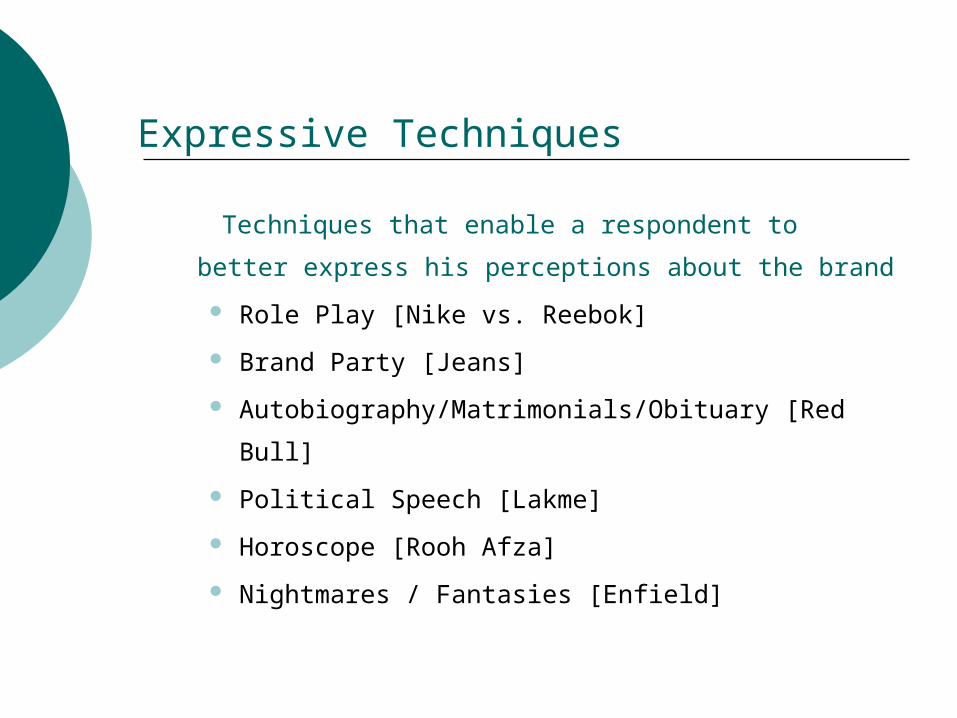
Expressive Techniques
Techniques that enable a respondent to better express
his perceptions about the brand
Role Play [Nike vs. Reebok]
Brand Party [Jeans]
Autobiography/Matrimonials/Obituary [Red Bull]
Political Speech [Lakme]
Horoscope [Rooh Afza]
Nightmares / Fantasies [Enfield]

Creativity Techniques
Techniques which use the consumer’s creativity to
derive perceptions about the brand
Random Input [Nike without ‘Just do it’]
Pictionary [Surprise Surprise!]
Transformation [Dabur Chavanprash]
Re-birth [Yamaha RX100]

Group Assignment
Bajaj has launched Pulsar 135
Study the impact of this launch on brand image amongst existing Pulsar owners
Quantitative: Survey -- 20 Respondents
Qualitative: Any 3 projective techniques
Deadline: Sunday, 12th December, 2010 @ 2:00 PM