bmi middle east and africa oil and gas insight march 2016
DESCRIPTION
BMI Oil and Gas Insight March 2016 Sulaiman BMI Oil and Gas Insight March 2016 SulaimanTRANSCRIPT
IMPORTANT NOTICE:
The information in this PDF file is subject to Business Monitor International Ltd’s full copyrightand entitlements as defined and protected by international law. The contents of the file are forthe sole use of the addressee. All content in this file is owned and operated by BusinessMonitor International Ltd, and the copying or distribution of this file, internally or externally, isstrictly prohibited without the prior written permission and consent of Business MonitorInternational Ltd. If you wish to distribute the file, please email the Subscriptions Department [email protected], providing details of your subscription and the number of recipientsyou wish to forward or distribute this information to.
DISCLAIMER
All information contained in this publication has been researched and compiled from sources believedto be accurate and reliable at the time of publishing. However, in view of the natural scope for humanand/or mechanical error, either at source or during production, Business Monitor International Ltdaccepts no liability whatsoever for any loss or damage resulting from errors, inaccuracies or omissionsaffecting any part of the publication. All information is provided without warranty, and Business MonitorInternational Ltd makes no representation of warranty of any kind as to the accuracy or completenessof any information hereto contained.
CONTENTS
Middle East & AfricaOil and Gas
BMI’s monthly market intelligence, trend analysis and forecasts for the oil and gas industry across the Middle East & Africa
March 2016 Issue 118
Editorial Office:85 Queen Victoria Street,
London EC4V 4AB, UKTel: +44 (0)20 7246 5126
Fax: +44 (0)20 7248 0467www.bmiresearch.com
www.oilandgasinsight.com
ISSN: 1750-7723
Editorial Office:85 Queen Victoria Street,
London EC4V 4AB, UKTel: +44 (0)20 7246 5126
Fax: +44 (0)20 7248 0467www.bmiresearch.com
www.oilandgasinsight.com
Middle East .....................................................................................1Fuel Price Reforms Support Deficit, Consumption Unchanged .................................. 1
Middle East: Oil, Gas & Refining Output Set For Growth .......................................... 2
Iran ................................................................................................5Gas Growth Adds To Global Fuels Glut ................................................................... 5
Oil Poised For Gradual Return ................................................................................ 6
Qatar...............................................................................................7Oil Production Forecast Revised Downwards ........................................................... 7
Price Concessions Mark New Asian LNG Contract Precedents ................................... 8
Libya ..............................................................................................9Exports Face Rising Headwinds ............................................................................. 9
MIDDLE EAST
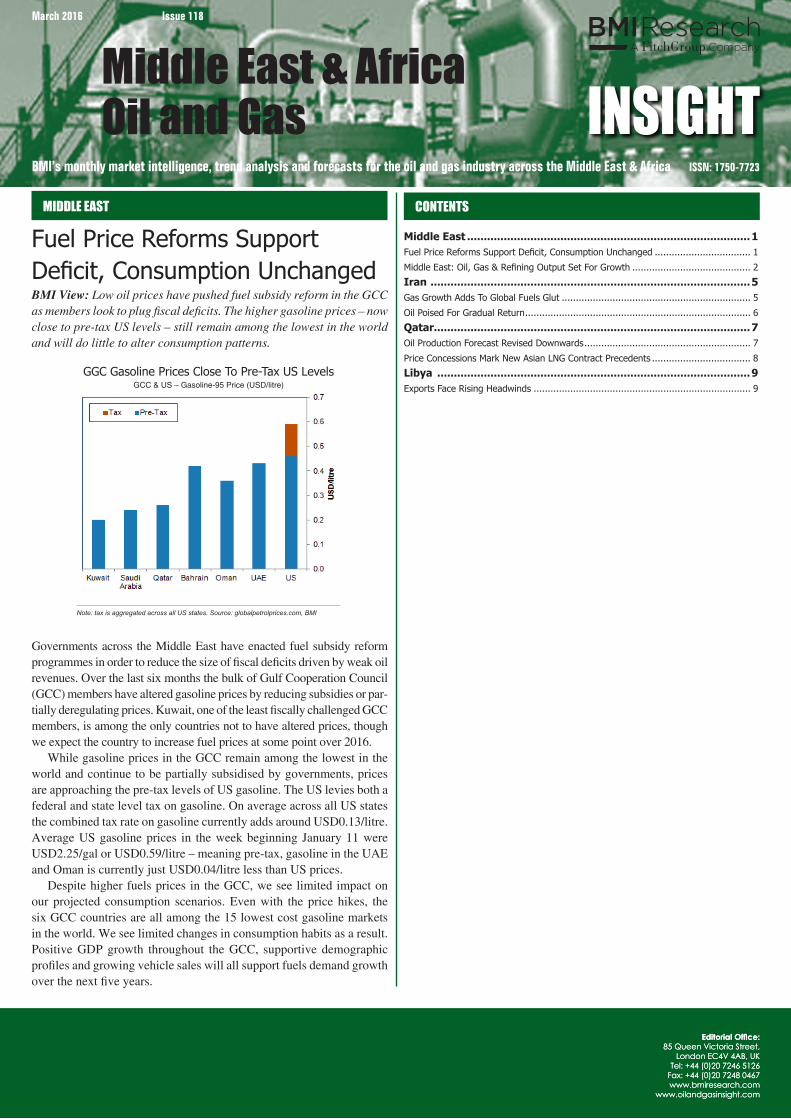
Fuel Price Reforms Support Deficit, Consumption UnchangedBMI View: Low oil prices have pushed fuel subsidy reform in the GCC as members look to plug fiscal deficits. The higher gasoline prices – now close to pre-tax US levels – still remain among the lowest in the world and will do little to alter consumption patterns.
Governments across the Middle East have enacted fuel subsidy reform programmes in order to reduce the size of fiscal deficits driven by weak oil revenues. Over the last six months the bulk of Gulf Cooperation Council (GCC) members have altered gasoline prices by reducing subsidies or par-tially deregulating prices. Kuwait, one of the least fiscally challenged GCC members, is among the only countries not to have altered prices, though we expect the country to increase fuel prices at some point over 2016.
While gasoline prices in the GCC remain among the lowest in the world and continue to be partially subsidised by governments, prices are approaching the pre-tax levels of US gasoline. The US levies both a federal and state level tax on gasoline. On average across all US states the combined tax rate on gasoline currently adds around USD0.13/litre. Average US gasoline prices in the week beginning January 11 were USD2.25/gal or USD0.59/litre – meaning pre-tax, gasoline in the UAE and Oman is currently just USD0.04/litre less than US prices.
Despite higher fuels prices in the GCC, we see limited impact on our projected consumption scenarios. Even with the price hikes, the six GCC countries are all among the 15 lowest cost gasoline markets in the world. We see limited changes in consumption habits as a result. Positive GDP growth throughout the GCC, supportive demographic profiles and growing vehicle sales will all support fuels demand growth over the next five years.
GGC Gasoline Prices Close To Pre-Tax US LevelsGCC & US – Gasoline-95 Price (USD/litre)
Note: tax is aggregated across all US states. Source: globalpetrolprices.com, BMI
2 www.oilandgasinsight.com
Middle East & Africa Oil & GasMIddlE EASt
That said, we note subsidy reform in other areas, such as energy and water prices, could add inflationary pressures and limit discretion-ary spending on fuel. The proposed introduction of a value-added tax (VAT) from 2017 or 2018 across all countries could add to this pres-sure, although the initial level of VAT will be low, perhaps 5%. These reforms will have a positive impact on the fiscal deficits of the GCC countries, though the improvement will slow. All six GCC countries will see their fiscal deficits as a % of GDP peak in 2015 or 2016 with a gradual trend towards a balance over the coming five years.
Middle East: Oil, Gas & Refining Output Set For GrowthBMI View: Oil production in the Middle East will rise 7.9% from 2015 to 2024 though lower oil prices are impacting certain countries. Weak oil prices are also increasing momentum behind subsidy re-form, impacting long-term consumption. Refining capacity will grow strongly as the region steps up economic diversification, increasing domestic demand for crude.
To highlight the key themes that will unfold in BMI's Middle East oil and gas forecasts, we have compared countries on the basis of the following key indicators:
• Oil Production• Oil Consumption• Refining Capacity• Gas Production• Gas Consumption
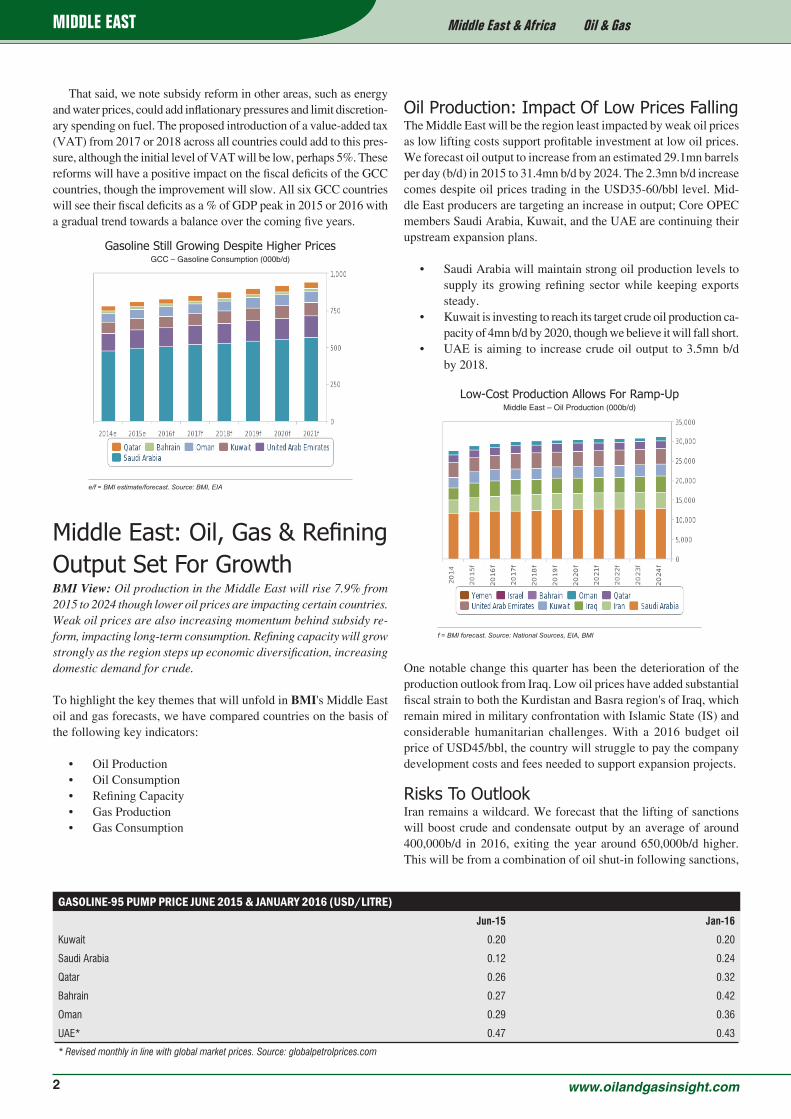
Oil Production: Impact Of Low Prices FallingThe Middle East will be the region least impacted by weak oil prices as low lifting costs support profitable investment at low oil prices. We forecast oil output to increase from an estimated 29.1mn barrels per day (b/d) in 2015 to 31.4mn b/d by 2024. The 2.3mn b/d increase comes despite oil prices trading in the USD35-60/bbl level. Mid-dle East producers are targeting an increase in output; Core OPEC members Saudi Arabia, Kuwait, and the UAE are continuing their upstream expansion plans.
• Saudi Arabia will maintain strong oil production levels to supply its growing refining sector while keeping exports steady.
• Kuwait is investing to reach its target crude oil production ca-pacity of 4mn b/d by 2020, though we believe it will fall short.
• UAE is aiming to increase crude oil output to 3.5mn b/d by 2018.
One notable change this quarter has been the deterioration of the production outlook from Iraq. Low oil prices have added substantial fiscal strain to both the Kurdistan and Basra region's of Iraq, which remain mired in military confrontation with Islamic State (IS) and considerable humanitarian challenges. With a 2016 budget oil price of USD45/bbl, the country will struggle to pay the company development costs and fees needed to support expansion projects.
Risks To OutlookIran remains a wildcard. We forecast that the lifting of sanctions will boost crude and condensate output by an average of around 400,000b/d in 2016, exiting the year around 650,000b/d higher. This will be from a combination of oil shut-in following sanctions,
GASOLINE-95 PUMP PRICE JUNE 2015 & JANUARY 2016 (USD/LITRE) Jun-15 Jan-16
Kuwait 0.20 0.20
Saudi Arabia 0.12 0.24
Qatar 0.26 0.32
Bahrain 0.27 0.42
Oman 0.29 0.36
UAE* 0.47 0.43
* Revised monthly in line with global market prices. Source: globalpetrolprices.com
Gasoline Still Growing Despite Higher PricesGCC – Gasoline Consumption (000b/d)
e/f = BMI estimate/forecast. Source: BMI, EIA
Low-Cost Production Allows For Ramp-UpMiddle East – Oil Production (000b/d)
f = BMI forecast. Source: National Sources, EIA, BMI
3www.oilandgasinsight.com
Middle East & Africa Oil & GasMIddlE EASt
growing condensate production from new gas project phases, and to a lesser extent storage release. However, we are not currently factor-ing in potential production growth from new oil projects awarded under the new Iran petroleum contract, where we envisage upside in excess of 1mn b/d by the end of our forecast.
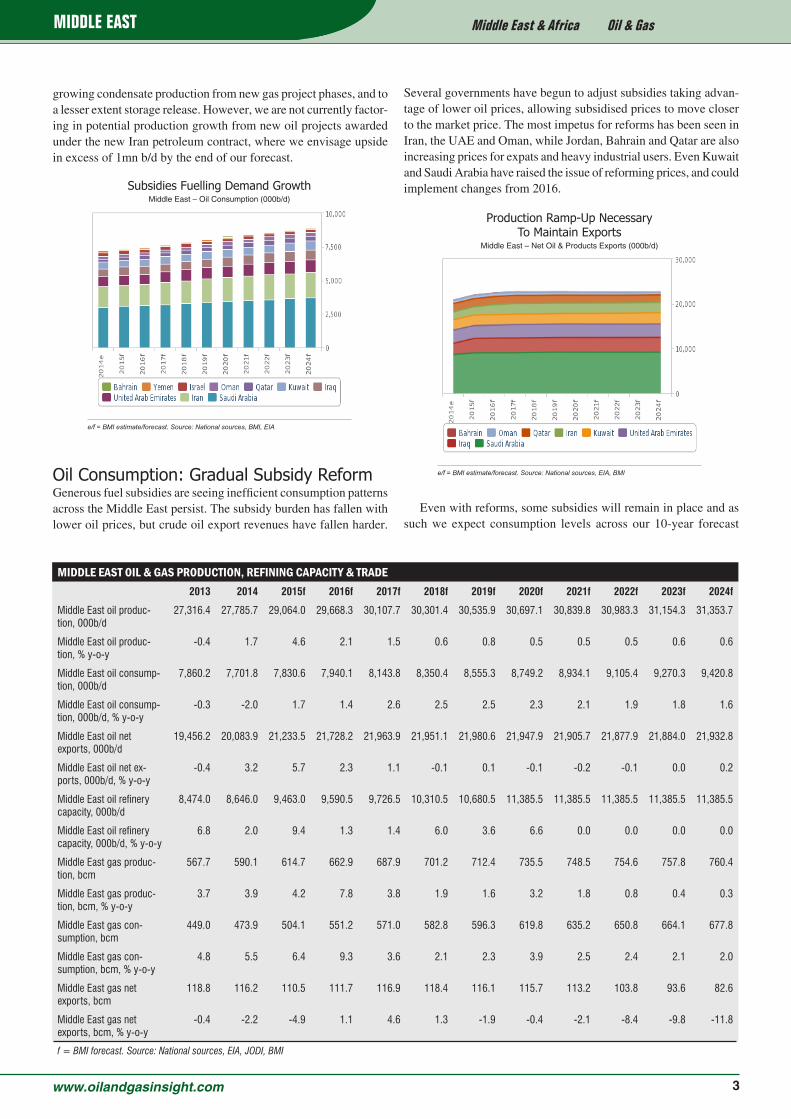
Oil Consumption: Gradual Subsidy ReformGenerous fuel subsidies are seeing inefficient consumption patterns across the Middle East persist. The subsidy burden has fallen with lower oil prices, but crude oil export revenues have fallen harder.
Several governments have begun to adjust subsidies taking advan-tage of lower oil prices, allowing subsidised prices to move closer to the market price. The most impetus for reforms has been seen in Iran, the UAE and Oman, while Jordan, Bahrain and Qatar are also increasing prices for expats and heavy industrial users. Even Kuwait and Saudi Arabia have raised the issue of reforming prices, and could implement changes from 2016.
Even with reforms, some subsidies will remain in place and as such we expect consumption levels across our 10-year forecast
Subsidies Fuelling Demand Growth Middle East – Oil Consumption (000b/d)
e/f = BMI estimate/forecast. Source: National sources, BMI, EIA
MIDDLE EAST OIL & GAS PRODUCTION, REFINING CAPACITY & TRADE 2013 2014 2015f 2016f 2017f 2018f 2019f 2020f 2021f 2022f 2023f 2024f
Middle East oil produc-tion, 000b/d
27,316.4 27,785.7 29,064.0 29,668.3 30,107.7 30,301.4 30,535.9 30,697.1 30,839.8 30,983.3 31,154.3 31,353.7
Middle East oil produc-tion, % y-o-y
-0.4 1.7 4.6 2.1 1.5 0.6 0.8 0.5 0.5 0.5 0.6 0.6
Middle East oil consump-tion, 000b/d
7,860.2 7,701.8 7,830.6 7,940.1 8,143.8 8,350.4 8,555.3 8,749.2 8,934.1 9,105.4 9,270.3 9,420.8
Middle East oil consump-tion, 000b/d, % y-o-y
-0.3 -2.0 1.7 1.4 2.6 2.5 2.5 2.3 2.1 1.9 1.8 1.6
Middle East oil net exports, 000b/d
19,456.2 20,083.9 21,233.5 21,728.2 21,963.9 21,951.1 21,980.6 21,947.9 21,905.7 21,877.9 21,884.0 21,932.8
Middle East oil net ex-ports, 000b/d, % y-o-y
-0.4 3.2 5.7 2.3 1.1 -0.1 0.1 -0.1 -0.2 -0.1 0.0 0.2
Middle East oil refinery capacity, 000b/d
8,474.0 8,646.0 9,463.0 9,590.5 9,726.5 10,310.5 10,680.5 11,385.5 11,385.5 11,385.5 11,385.5 11,385.5
Middle East oil refinery capacity, 000b/d, % y-o-y
6.8 2.0 9.4 1.3 1.4 6.0 3.6 6.6 0.0 0.0 0.0 0.0
Middle East gas produc-tion, bcm
567.7 590.1 614.7 662.9 687.9 701.2 712.4 735.5 748.5 754.6 757.8 760.4
Middle East gas produc-tion, bcm, % y-o-y
3.7 3.9 4.2 7.8 3.8 1.9 1.6 3.2 1.8 0.8 0.4 0.3
Middle East gas con-sumption, bcm
449.0 473.9 504.1 551.2 571.0 582.8 596.3 619.8 635.2 650.8 664.1 677.8
Middle East gas con-sumption, bcm, % y-o-y
4.8 5.5 6.4 9.3 3.6 2.1 2.3 3.9 2.5 2.4 2.1 2.0
Middle East gas net exports, bcm
118.8 116.2 110.5 111.7 116.9 118.4 116.1 115.7 113.2 103.8 93.6 82.6
Middle East gas net exports, bcm, % y-o-y
-0.4 -2.2 -4.9 1.1 4.6 1.3 -1.9 -0.4 -2.1 -8.4 -9.8 -11.8
f = BMI forecast. Source: National sources, EIA, JODI, BMI
Production Ramp-Up Necessary To Maintain Exports
Middle East – Net Oil & Products Exports (000b/d)
e/f = BMI estimate/forecast. Source: National sources, EIA, BMI
4 www.oilandgasinsight.com
Middle East & Africa Oil & GasMIddlE EASt
period to grow, but at a slower pace than in recent years. Economic diversification into the refining and petrochemical
sectors will also drive greater domestic oil demand. We forecast Middle East refined product consumption to increase from 7.8mn b/d in 2015 to 9.4mn b/d by 2024. Consumption is forecast to grow 20.3% over the 10-year period, far stronger than our 7.9% forecast growth in oil production, straining net exports.
Israel is the only exception to the trend, with oil consumption set to decline. A considerable increase in natural gas production will support greater gas use over oil, particularly in power and industry, but also potentially in the transport sector.
Strong consumption growth is expected to limit net oil export growth, though some countries will see increased fuels and petrochemi-cal exports through downstream diversification plans. Greater focus on developing natural gas could free up more oil for export; otherwise export volumes from most countries will remain relatively flat.
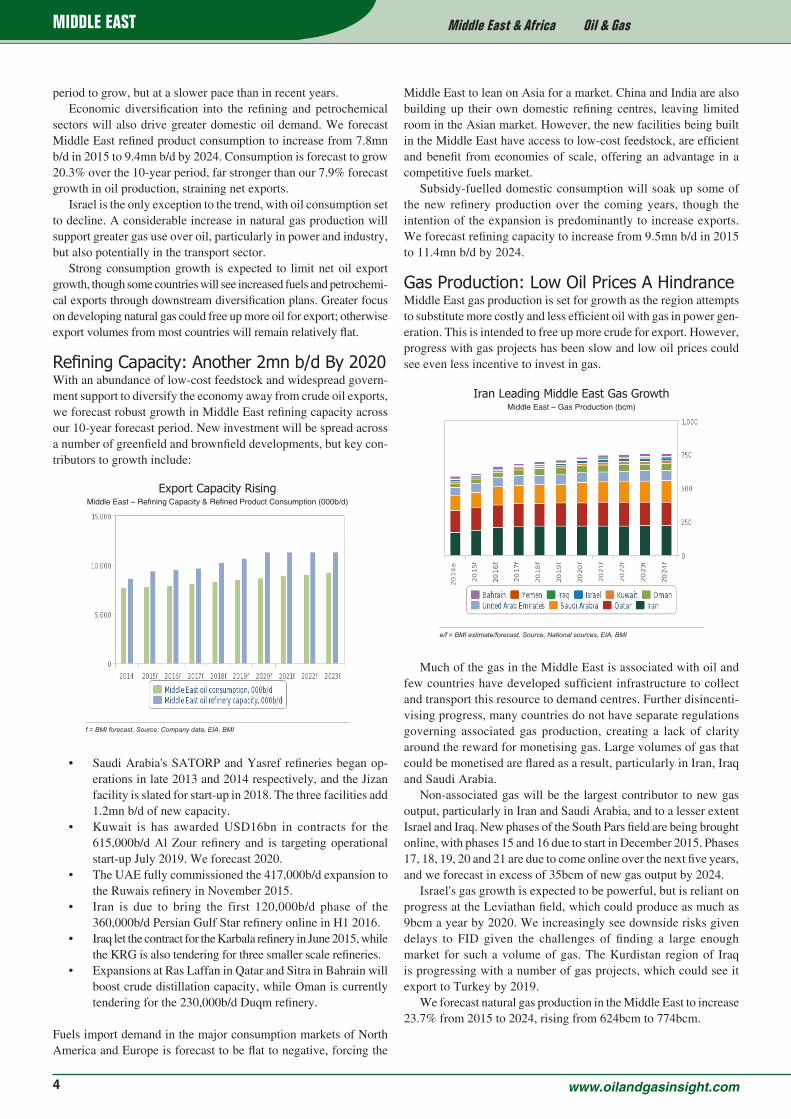
Refining Capacity: Another 2mn b/d By 2020With an abundance of low-cost feedstock and widespread govern-ment support to diversify the economy away from crude oil exports, we forecast robust growth in Middle East refining capacity across our 10-year forecast period. New investment will be spread across a number of greenfield and brownfield developments, but key con-tributors to growth include:
• Saudi Arabia's SATORP and Yasref refineries began op-erations in late 2013 and 2014 respectively, and the Jizan facility is slated for start-up in 2018. The three facilities add 1.2mn b/d of new capacity.
• Kuwait is has awarded USD16bn in contracts for the 615,000b/d Al Zour refinery and is targeting operational start-up July 2019. We forecast 2020.
• The UAE fully commissioned the 417,000b/d expansion to the Ruwais refinery in November 2015.
• Iran is due to bring the first 120,000b/d phase of the 360,000b/d Persian Gulf Star refinery online in H1 2016.
• Iraq let the contract for the Karbala refinery in June 2015, while the KRG is also tendering for three smaller scale refineries.
• Expansions at Ras Laffan in Qatar and Sitra in Bahrain will boost crude distillation capacity, while Oman is currently tendering for the 230,000b/d Duqm refinery.
Fuels import demand in the major consumption markets of North America and Europe is forecast to be flat to negative, forcing the
Middle East to lean on Asia for a market. China and India are also building up their own domestic refining centres, leaving limited room in the Asian market. However, the new facilities being built in the Middle East have access to low-cost feedstock, are efficient and benefit from economies of scale, offering an advantage in a competitive fuels market.
Subsidy-fuelled domestic consumption will soak up some of the new refinery production over the coming years, though the intention of the expansion is predominantly to increase exports. We forecast refining capacity to increase from 9.5mn b/d in 2015 to 11.4mn b/d by 2024.
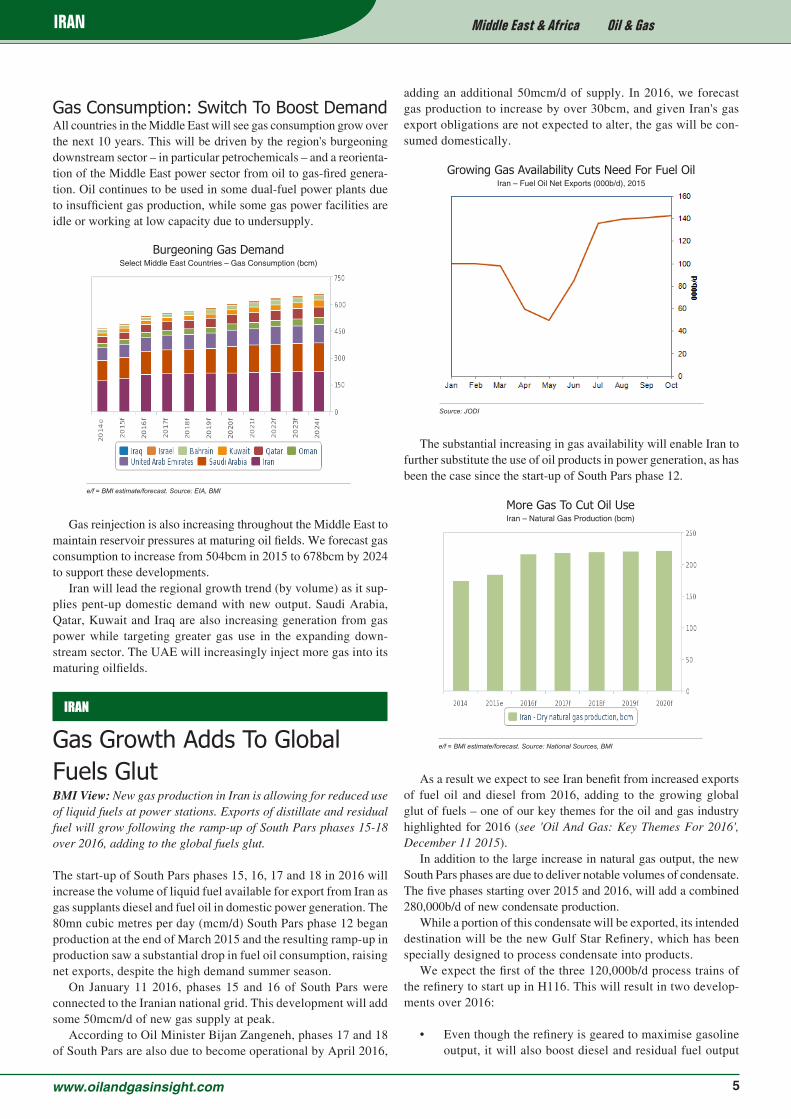
Gas Production: Low Oil Prices A HindranceMiddle East gas production is set for growth as the region attempts to substitute more costly and less efficient oil with gas in power gen-eration. This is intended to free up more crude for export. However, progress with gas projects has been slow and low oil prices could see even less incentive to invest in gas.
Much of the gas in the Middle East is associated with oil and few countries have developed sufficient infrastructure to collect and transport this resource to demand centres. Further disincenti-vising progress, many countries do not have separate regulations governing associated gas production, creating a lack of clarity around the reward for monetising gas. Large volumes of gas that could be monetised are flared as a result, particularly in Iran, Iraq and Saudi Arabia.
Non-associated gas will be the largest contributor to new gas output, particularly in Iran and Saudi Arabia, and to a lesser extent Israel and Iraq. New phases of the South Pars field are being brought online, with phases 15 and 16 due to start in December 2015. Phases 17, 18, 19, 20 and 21 are due to come online over the next five years, and we forecast in excess of 35bcm of new gas output by 2024.
Israel's gas growth is expected to be powerful, but is reliant on progress at the Leviathan field, which could produce as much as 9bcm a year by 2020. We increasingly see downside risks given delays to FID given the challenges of finding a large enough market for such a volume of gas. The Kurdistan region of Iraq is progressing with a number of gas projects, which could see it export to Turkey by 2019.
We forecast natural gas production in the Middle East to increase 23.7% from 2015 to 2024, rising from 624bcm to 774bcm.
Export Capacity RisingMiddle East – Refining Capacity & Refined Product Consumption (000b/d)
f = BMI forecast. Source: Company data, EIA, BMI
Iran Leading Middle East Gas GrowthMiddle East – Gas Production (bcm)
e/f = BMI estimate/forecast. Source: National sources, EIA, BMI
5www.oilandgasinsight.com
Middle East & Africa Oil & GasIrAN
Gas Consumption: Switch To Boost Demand All countries in the Middle East will see gas consumption grow over the next 10 years. This will be driven by the region's burgeoning downstream sector – in particular petrochemicals – and a reorienta-tion of the Middle East power sector from oil to gas-fired genera-tion. Oil continues to be used in some dual-fuel power plants due to insufficient gas production, while some gas power facilities are idle or working at low capacity due to undersupply.
Gas reinjection is also increasing throughout the Middle East to maintain reservoir pressures at maturing oil fields. We forecast gas consumption to increase from 504bcm in 2015 to 678bcm by 2024 to support these developments.
Iran will lead the regional growth trend (by volume) as it sup-plies pent-up domestic demand with new output. Saudi Arabia, Qatar, Kuwait and Iraq are also increasing generation from gas power while targeting greater gas use in the expanding down-stream sector. The UAE will increasingly inject more gas into its maturing oilfields.
IRAN
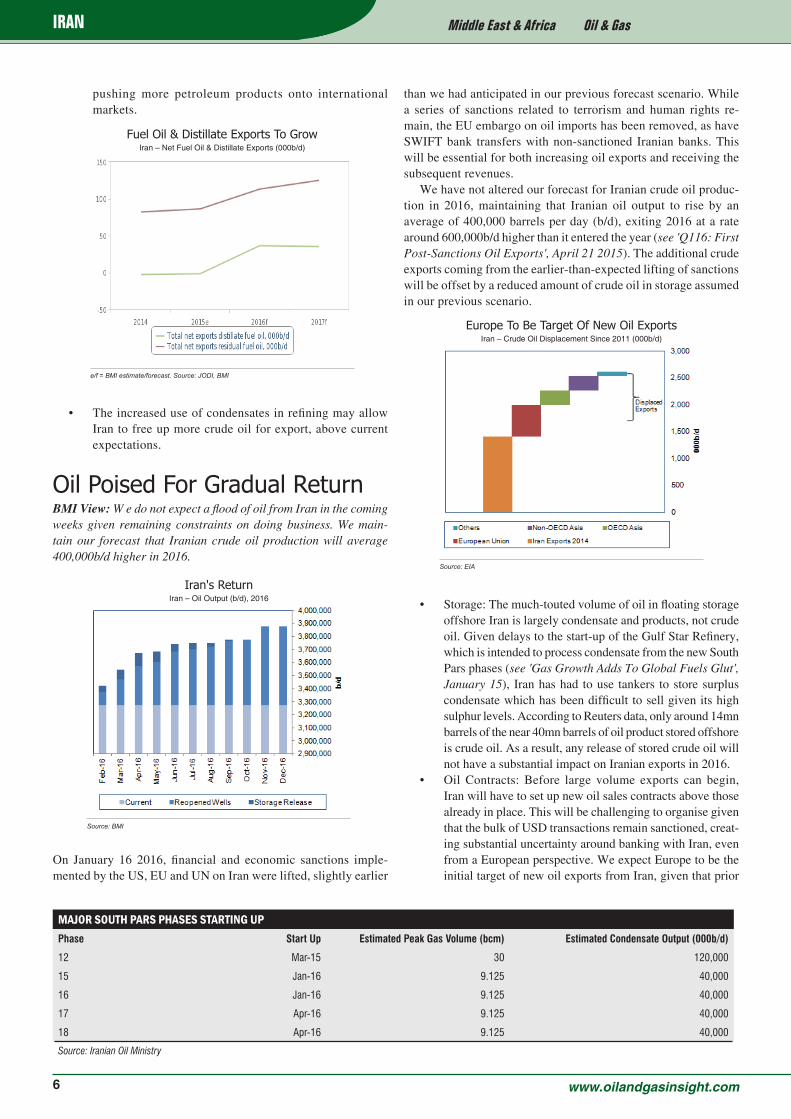
Gas Growth Adds To Global Fuels GlutBMI View: New gas production in Iran is allowing for reduced use of liquid fuels at power stations. Exports of distillate and residual fuel will grow following the ramp-up of South Pars phases 15-18 over 2016, adding to the global fuels glut.
The start-up of South Pars phases 15, 16, 17 and 18 in 2016 will increase the volume of liquid fuel available for export from Iran as gas supplants diesel and fuel oil in domestic power generation. The 80mn cubic metres per day (mcm/d) South Pars phase 12 began production at the end of March 2015 and the resulting ramp-up in production saw a substantial drop in fuel oil consumption, raising net exports, despite the high demand summer season.
On January 11 2016, phases 15 and 16 of South Pars were connected to the Iranian national grid. This development will add some 50mcm/d of new gas supply at peak.
According to Oil Minister Bijan Zangeneh, phases 17 and 18 of South Pars are also due to become operational by April 2016,
adding an additional 50mcm/d of supply. In 2016, we forecast gas production to increase by over 30bcm, and given Iran's gas export obligations are not expected to alter, the gas will be con-sumed domestically.
The substantial increasing in gas availability will enable Iran to further substitute the use of oil products in power generation, as has been the case since the start-up of South Pars phase 12.
As a result we expect to see Iran benefit from increased exports of fuel oil and diesel from 2016, adding to the growing global glut of fuels – one of our key themes for the oil and gas industry highlighted for 2016 (see 'Oil And Gas: Key Themes For 2016', December 11 2015).
In addition to the large increase in natural gas output, the new South Pars phases are due to deliver notable volumes of condensate. The five phases starting over 2015 and 2016, will add a combined 280,000b/d of new condensate production.
While a portion of this condensate will be exported, its intended destination will be the new Gulf Star Refinery, which has been specially designed to process condensate into products.
We expect the first of the three 120,000b/d process trains of the refinery to start up in H116. This will result in two develop-ments over 2016:
• Even though the refinery is geared to maximise gasoline output, it will also boost diesel and residual fuel output
Burgeoning Gas DemandSelect Middle East Countries – Gas Consumption (bcm)
e/f = BMI estimate/forecast. Source: EIA, BMI
More Gas To Cut Oil UseIran – Natural Gas Production (bcm)
e/f = BMI estimate/forecast. Source: National Sources, BMI
Growing Gas Availability Cuts Need For Fuel OilIran – Fuel Oil Net Exports (000b/d), 2015
Source: JODI
6 www.oilandgasinsight.com
Middle East & Africa Oil & GasIrAN
pushing more petroleum products onto international markets.
• The increased use of condensates in refining may allow Iran to free up more crude oil for export, above current expectations.
Oil Poised For Gradual ReturnBMI View: W e do not expect a flood of oil from Iran in the coming weeks given remaining constraints on doing business. We main-tain our forecast that Iranian crude oil production will average 400,000b/d higher in 2016.
On January 16 2016, financial and economic sanctions imple-mented by the US, EU and UN on Iran were lifted, slightly earlier
than we had anticipated in our previous forecast scenario. While a series of sanctions related to terrorism and human rights re-main, the EU embargo on oil imports has been removed, as have SWIFT bank transfers with non-sanctioned Iranian banks. This will be essential for both increasing oil exports and receiving the subsequent revenues.
We have not altered our forecast for Iranian crude oil produc-tion in 2016, maintaining that Iranian oil output to rise by an average of 400,000 barrels per day (b/d), exiting 2016 at a rate around 600,000b/d higher than it entered the year (see 'Q116: First Post-Sanctions Oil Exports', April 21 2015). The additional crude exports coming from the earlier-than-expected lifting of sanctions will be offset by a reduced amount of crude oil in storage assumed in our previous scenario.
• Storage: The much-touted volume of oil in floating storage offshore Iran is largely condensate and products, not crude oil. Given delays to the start-up of the Gulf Star Refinery, which is intended to process condensate from the new South Pars phases (see 'Gas Growth Adds To Global Fuels Glut', January 15), Iran has had to use tankers to store surplus condensate which has been difficult to sell given its high sulphur levels. According to Reuters data, only around 14mn barrels of the near 40mn barrels of oil product stored offshore is crude oil. As a result, any release of stored crude oil will not have a substantial impact on Iranian exports in 2016.
• Oil Contracts: Before large volume exports can begin, Iran will have to set up new oil sales contracts above those already in place. This will be challenging to organise given that the bulk of USD transactions remain sanctioned, creat-ing substantial uncertainty around banking with Iran, even from a European perspective. We expect Europe to be the initial target of new oil exports from Iran, given that prior
MAJOR SOUTH PARS PHASES STARTING UPPhase Start Up Estimated Peak Gas Volume (bcm) Estimated Condensate Output (000b/d)
12 Mar-15 30 120,000
15 Jan-16 9.125 40,000
16 Jan-16 9.125 40,000
17 Apr-16 9.125 40,000
18 Apr-16 9.125 40,000
Source: Iranian Oil Ministry
Fuel Oil & Distillate Exports To GrowIran – Net Fuel Oil & Distillate Exports (000b/d)
e/f = BMI estimate/forecast. Source: JODI, BMI
Europe To Be Target Of New Oil ExportsIran – Crude Oil Displacement Since 2011 (000b/d)
Source: EIA
Iran's ReturnIran – Oil Output (b/d), 2016
Source: BMI
7www.oilandgasinsight.com
Middle East & Africa Oil & GasQAtAr
to sanctions being imposed it received some 0.5mn b/d of crude. However, caution among European banks will limit the speed at which this is able to take place.
• Iran will have to offer incentives and ensure sufficient transparency in its domestic banking sector to lure back European buyers. As such we expect a more gradual return of oil to markets, not an immediate flood of oil. We do not believe it is in Iran's interest to dump oil on the spot market given the negative impact on the oil price, though it may lower selling prices in the coming months to gradually win back lost export markets.
• State Of Infrastructure: The upkeep of infrastructure was likely overlooked under sanctions given the reduced amount of money available to invest in the oil sector, and because it was unnecessary to maintain idle pipelines and gathering equipment. Restarting oil production will likely result in the failure of some transit infrastructure, which will need repair-ing or replacing. As such, particularly over the coming three months, new output of oil is expected to be inconsistent.
• State Of Oilfields: Over the coming months we will learn more about the true state of the Iranian oilfields where pro-duction was shut-in under sanctions, and whether Iran will be able to increase production to anywhere near the 1mn b/d difference prior to sanctions. While we do not expected extensive formation damage, we do expect that wells that have been shut-in will not produce at the same rate as previ-ously and are likely to require extensive workovers, delaying full production potential.
QATAR
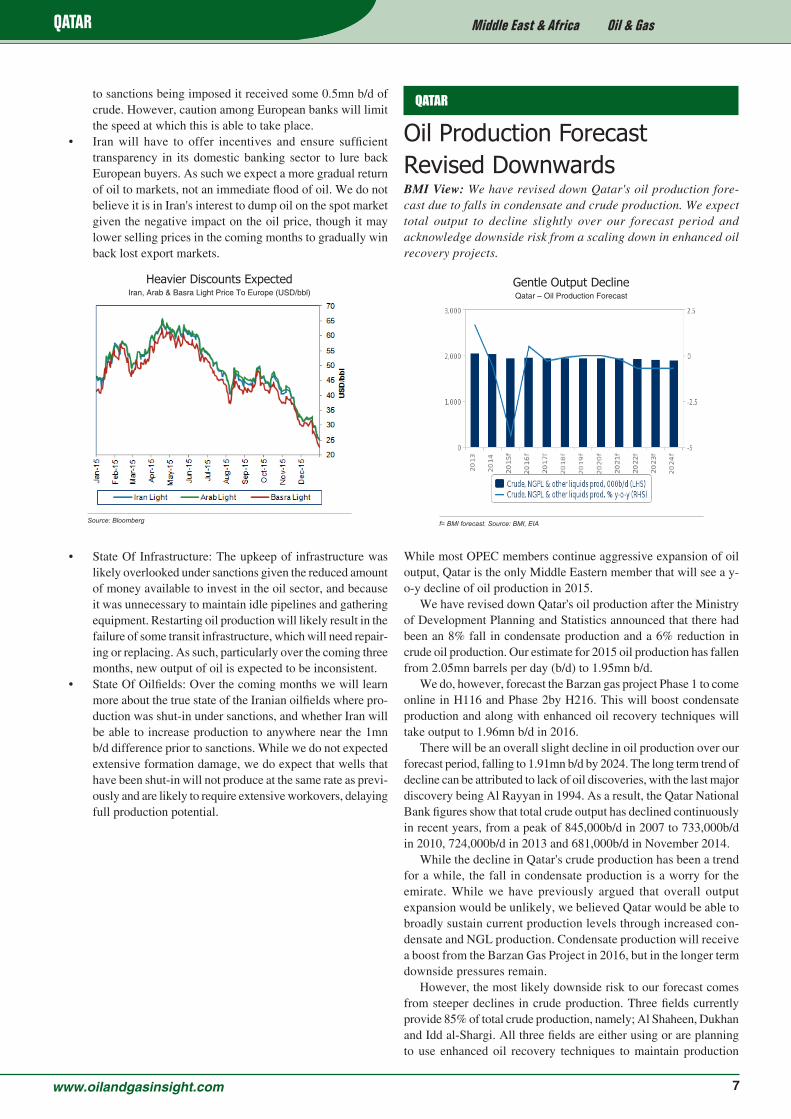
Oil Production Forecast Revised DownwardsBMI View: We have revised down Qatar's oil production fore-cast due to falls in condensate and crude production. We expect total output to decline slightly over our forecast period and acknowledge downside risk from a scaling down in enhanced oil recovery projects.
While most OPEC members continue aggressive expansion of oil output, Qatar is the only Middle Eastern member that will see a y-o-y decline of oil production in 2015.
We have revised down Qatar's oil production after the Ministry of Development Planning and Statistics announced that there had been an 8% fall in condensate production and a 6% reduction in crude oil production. Our estimate for 2015 oil production has fallen from 2.05mn barrels per day (b/d) to 1.95mn b/d.
We do, however, forecast the Barzan gas project Phase 1 to come online in H116 and Phase 2by H216. This will boost condensate production and along with enhanced oil recovery techniques will take output to 1.96mn b/d in 2016.
There will be an overall slight decline in oil production over our forecast period, falling to 1.91mn b/d by 2024. The long term trend of decline can be attributed to lack of oil discoveries, with the last major discovery being Al Rayyan in 1994. As a result, the Qatar National Bank figures show that total crude output has declined continuously in recent years, from a peak of 845,000b/d in 2007 to 733,000b/d in 2010, 724,000b/d in 2013 and 681,000b/d in November 2014.
While the decline in Qatar's crude production has been a trend for a while, the fall in condensate production is a worry for the emirate. While we have previously argued that overall output expansion would be unlikely, we believed Qatar would be able to broadly sustain current production levels through increased con-densate and NGL production. Condensate production will receive a boost from the Barzan Gas Project in 2016, but in the longer term downside pressures remain.
However, the most likely downside risk to our forecast comes from steeper declines in crude production. Three fields currently provide 85% of total crude production, namely; Al Shaheen, Dukhan and Idd al-Shargi. All three fields are either using or are planning to use enhanced oil recovery techniques to maintain production
Heavier Discounts ExpectedIran, Arab & Basra Light Price To Europe (USD/bbl)
Source: Bloomberg
Gentle Output DeclineQatar – Oil Production Forecast
f= BMI forecast. Source: BMI, EIA
8 www.oilandgasinsight.com
Middle East & Africa Oil & GasQAtAr
levels. However with capex levels being slashed again in 2016, these programmes look vulnerable. A scaling down or cancellation of enhanced oil recovery projects will lead to much higher decline rates at the fields, feeding through into lower-than-expected crude production, that any gains in condensate or NGL production would struggle to offset.
Price Concessions Mark New Asian LNG Contract PrecedentsBMI View: The large price concessions offered by Rasgas to Petronet have set a new precedent in Qatar's negotiations with its Asian buyers. They reflect structural changes in the global LNG market that will fundamentally reconfigure the pricing formula and contractual terms in Asian LNG contracts.
Qatari major RasGas – a joint venture between ExxonMobil and state-owned Qatar Petroleum – has offered substantial price con-
cessions in its two long-term liquefied natural gas (LNG) supply contracts with Indian firm Petronet. The two contracts are for 5.0mn tonnes per annum (mtpa) and 2.5mtpa – equivalent to 6.8bn cubic metres (bcm) and 3.4bcm – and expire in 2028 and 2030 respectively.
In 2015, Petronet imported significantly below its contracted minimum take or pay quantity, incurring a USD1.5bn penalty. RasGas has agreed to waive the penalty, in addition to revising the contract pricing formula. The price revision has occurred outside of a contractual price review process and is unprecedented in Qatar's negotiations with its Asian buyers. The scale of the revision is also significant. Comments from Indian oil minister Dharmendra Pradhan suggest a price reduction of c. 50%, from USD12.0-13.0/mn British thermal units (mnBTU) to USD6.0-7.0/mnBTU.
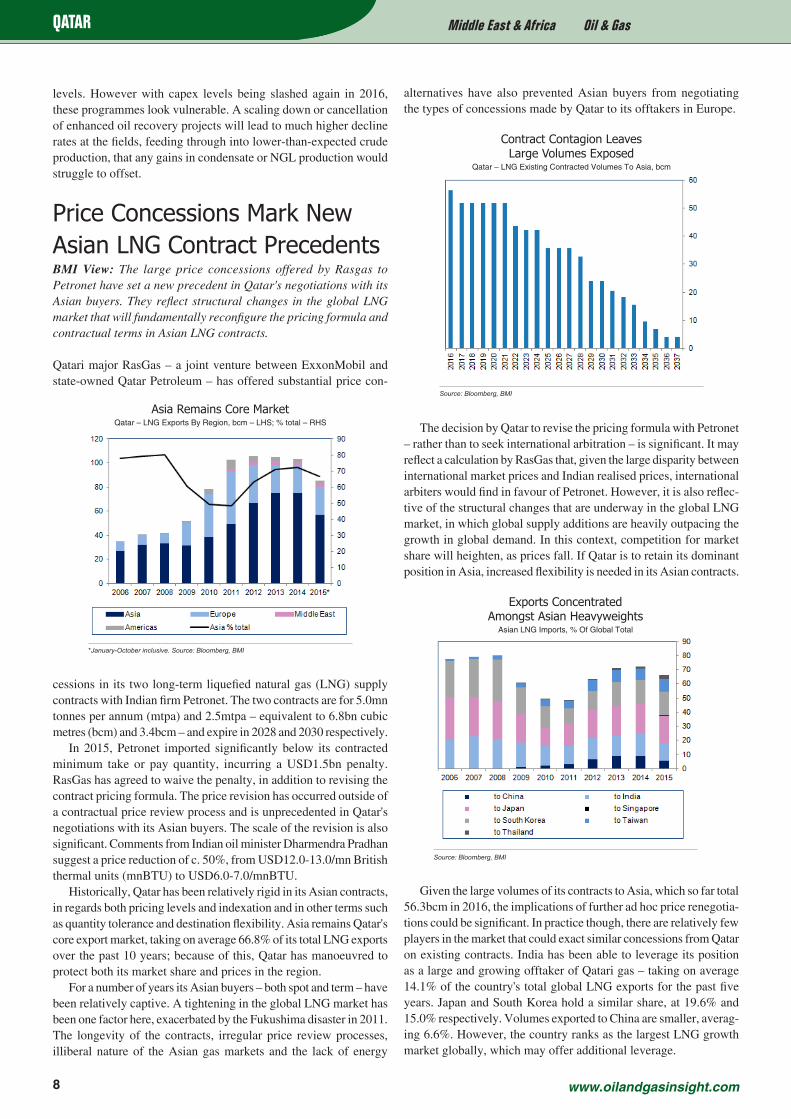
Historically, Qatar has been relatively rigid in its Asian contracts, in regards both pricing levels and indexation and in other terms such as quantity tolerance and destination flexibility. Asia remains Qatar's core export market, taking on average 66.8% of its total LNG exports over the past 10 years; because of this, Qatar has manoeuvred to protect both its market share and prices in the region.
For a number of years its Asian buyers – both spot and term – have been relatively captive. A tightening in the global LNG market has been one factor here, exacerbated by the Fukushima disaster in 2011. The longevity of the contracts, irregular price review processes, illiberal nature of the Asian gas markets and the lack of energy
alternatives have also prevented Asian buyers from negotiating the types of concessions made by Qatar to its offtakers in Europe.
The decision by Qatar to revise the pricing formula with Petronet – rather than to seek international arbitration – is significant. It may reflect a calculation by RasGas that, given the large disparity between international market prices and Indian realised prices, international arbiters would find in favour of Petronet. However, it is also reflec-tive of the structural changes that are underway in the global LNG market, in which global supply additions are heavily outpacing the growth in global demand. In this context, competition for market share will heighten, as prices fall. If Qatar is to retain its dominant position in Asia, increased flexibility is needed in its Asian contracts.
Given the large volumes of its contracts to Asia, which so far total 56.3bcm in 2016, the implications of further ad hoc price renegotia-tions could be significant. In practice though, there are relatively few players in the market that could exact similar concessions from Qatar on existing contracts. India has been able to leverage its position as a large and growing offtaker of Qatari gas – taking on average 14.1% of the country's total global LNG exports for the past five years. Japan and South Korea hold a similar share, at 19.6% and 15.0% respectively. Volumes exported to China are smaller, averag-ing 6.6%. However, the country ranks as the largest LNG growth market globally, which may offer additional leverage.
Asia Remains Core Market Qatar – LNG Exports By Region, bcm – LHS; % total – RHS
*January-October inclusive. Source: Bloomberg, BMI
Exports Concentrated Amongst Asian Heavyweights
Asian LNG Imports, % Of Global Total
Source: Bloomberg, BMI
Contract Contagion Leaves Large Volumes Exposed
Qatar – LNG Existing Contracted Volumes To Asia, bcm
Source: Bloomberg, BMI
9www.oilandgasinsight.com
Middle East & Africa Oil & GaslIByA
© 2016 Business Monitor International Ltd. All rights reserved.All information, analysis, forecasts and data provided by Business Monitor International Ltd is for the exclusive use of subscribing persons or organisa-tions (including those using the service on a trial basis). All such content is copyrighted in the name of Business Monitor International Ltd, and as such no part of this content may be reproduced, repackaged, copied or redistributed without the express consent of Business Monitor International Ltd.All content, including forecasts, analysis and opinion, has been based on information and sources believed to be accurate and reliable at the time of publishing. Business Monitor International Ltd makes no representation of warranty of any kind as to the accuracy or completeness of any information provided, and accepts no liability whatsoever for any loss or damage resulting from opinion, errors, inaccuracies or omissions affecting any part of the content.
Analysts: Marina Petroleka, Christopher Haines,
Emma Richards, Mara Roberts Duque, Peter Lee,
Charles Swabey
Sub-Editor: Himanshu Bhandari
Subscriptions Manager: Yen Ly
Production: Fauzia Borah Isahaque
Copy Deadline: 19 January 2016
Other, smaller players would struggle to force a revision to the existing price formulae. As such, we expect the main changes to accrue through the negotiation of new LNG contracts, with only isolated concessions offered to the buyers referenced above. Con-cessions in new contracts will also extend beyond pricing formula to issues such as volume and destination flexibility, price reopen-ers and the method of indexation (see 'LNG Contract Concessions Inescapable', October 2 2015).
Finally, it is worth noting that the price renegotiations on existing contracts may benefit Qatar, as well its Asian buyers. The details of the new pricing formula for Petronet have not been made public. However, it is highly probable that the revision includes a reduction in the monthly moving average, from the previous 60-month aver-age of JCC crude. What is less clear is whether the slope to crude (ie, the percentage indexation to crude) has also been altered. It is possible that, given the slump in oil prices, RasGas has been able to negotiate a higher slope, in return for a faster moving average. Given the length of the contracts, this would benefit the company post-2018, as crude prices begin to recover.
LIBYA
Exports Face Rising HeadwindsBMI View: Libya will struggle to maintain its share in the global crude market, due to rising competition for buyers and the inse-curity of its supply.
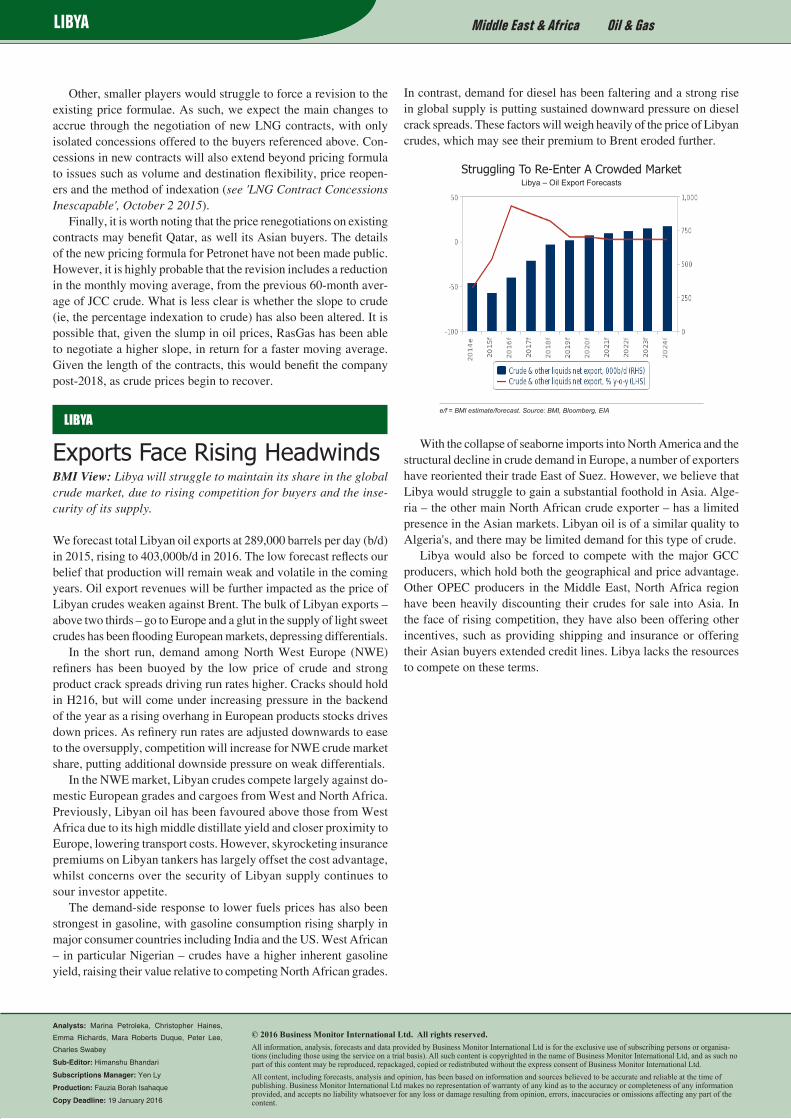
We forecast total Libyan oil exports at 289,000 barrels per day (b/d) in 2015, rising to 403,000b/d in 2016. The low forecast reflects our belief that production will remain weak and volatile in the coming years. Oil export revenues will be further impacted as the price of Libyan crudes weaken against Brent. The bulk of Libyan exports – above two thirds – go to Europe and a glut in the supply of light sweet crudes has been flooding European markets, depressing differentials.
In the short run, demand among North West Europe (NWE) refiners has been buoyed by the low price of crude and strong product crack spreads driving run rates higher. Cracks should hold in H216, but will come under increasing pressure in the backend of the year as a rising overhang in European products stocks drives down prices. As refinery run rates are adjusted downwards to ease to the oversupply, competition will increase for NWE crude market share, putting additional downside pressure on weak differentials.
In the NWE market, Libyan crudes compete largely against do-mestic European grades and cargoes from West and North Africa. Previously, Libyan oil has been favoured above those from West Africa due to its high middle distillate yield and closer proximity to Europe, lowering transport costs. However, skyrocketing insurance premiums on Libyan tankers has largely offset the cost advantage, whilst concerns over the security of Libyan supply continues to sour investor appetite.
The demand-side response to lower fuels prices has also been strongest in gasoline, with gasoline consumption rising sharply in major consumer countries including India and the US. West African – in particular Nigerian – crudes have a higher inherent gasoline yield, raising their value relative to competing North African grades.
In contrast, demand for diesel has been faltering and a strong rise in global supply is putting sustained downward pressure on diesel crack spreads. These factors will weigh heavily of the price of Libyan crudes, which may see their premium to Brent eroded further.
With the collapse of seaborne imports into North America and the structural decline in crude demand in Europe, a number of exporters have reoriented their trade East of Suez. However, we believe that Libya would struggle to gain a substantial foothold in Asia. Alge-ria – the other main North African crude exporter – has a limited presence in the Asian markets. Libyan oil is of a similar quality to Algeria's, and there may be limited demand for this type of crude.
Libya would also be forced to compete with the major GCC producers, which hold both the geographical and price advantage. Other OPEC producers in the Middle East, North Africa region have been heavily discounting their crudes for sale into Asia. In the face of rising competition, they have also been offering other incentives, such as providing shipping and insurance or offering their Asian buyers extended credit lines. Libya lacks the resources to compete on these terms.
Struggling To Re-Enter A Crowded MarketLibya – Oil Export Forecasts
e/f = BMI estimate/forecast. Source: BMI, Bloomberg, EIA