bm410-25 per eval and act port mgmt 27nov05
DESCRIPTION
pomTRANSCRIPT

Performance Evaluation and Active Portfolio
ManagementOr figuring out if you or your manager is good or just lucky!
Bm410: Investments

Objectives
A. Understand active portfolio management and performance evaluation
B. Understand how to calculate risk adjusted rates of return
C. Decompose returns into components attributable to asset allocation and securities selection

A. Active Portfolio Management and Performance Evaluation
Why are these two topics so important?• Active Portfolio Management and Performance
Evaluation are very difficult tasks and are critical to investing
• Very few have done it well• They are very complicated subjects
• Theoretically correct measures are difficult to construct
• Different statistics or measures are appropriate for different types of investment decisions and portfolios

Active Portfolio Management and Performance Evaluation (continued)
How are these topics viewed?• Academics and industry view them from different
areas• Industry and academic measures are different--
sometimes extremely different, with different results
The key area is measuring performance• Most performance measurement is for a buy and
hold strategy, or at best, a steady state• Active management complicates this process, for
it is by definition changing

Active Portfolio Management and Performance Evaluation (continued)
The nature of active management leads to very challenging measurement problems• Remember, managers may be buying and selling at
any point in time• What are asset classes?
What about risk? • Risk is more complex than just variance or standard
deviation• Is it upside or downside?

Active Portfolio Management (continued)
What is Active Portfolio Management?• The process of using current, historical, and
publicly available data to actively manage a portfolio in an effort to:
• Earn investment returns in excess of the manager’s specified benchmark (or benchmark, bogey, target) after all costs, including transactions costs, taxes, management, and other fees
• Earn consistent excess returns period after period--and not just from luck

Active Portfolio Management (continued)
Are markets totally efficient?• This is a critical question
• Some managers outperform the market for extended periods, but not others. Why?
• While the abnormal performance in some instances may not be large, it is too large to be attributed solely to noise
• Evidence remains that anomalies, such as the turn of the year, exist
• The evidence suggests that there is a role for active portfolio management in inefficient markets
• It even suggests there is a role in efficient markets

Active Portfolio Management (continued)
What are abnormal returns?• Abnormal returns are investment returns which,
after fees and transactions costs, are in excess of: • A specified benchmark portfolio
• Can be a specified index (S&P 500, sector, or another real or proxy portfolio)
• A market proxy adjusted for risk• A market model / adjusted index model
• A reward to risk measure, such as the Sharpe Measure: E (rp-rf) / p

Active Portfolio Management (continued)
What major factors lead to abnormal returns?• 1. Superior Market timing (or asset allocation)
• Shifting assets between a poor-performing asset class and a better performing asset class to outperform a specified benchmark which includes both asset classes
• 2. Superior selection (or stock or asset selection_• Picking sectors, industries, or companies within
a specified benchmark which outperform that specified benchmark

1. Superior Market Timing Ability
What is superior market timing ability?• A process where the manager gains abnormal returns
from adjusting the portfolio for movements in the market
• The manager shifts among stocks, money market instruments and bonds based on their expectations for returns from each asset class
What are the results of superior market timing?• Higher returns with lower risk• With perfect forecasting abilities, the portfolio
behaves like an option• However, no one has perfect forecasting abilities

Superior Market Timing (continued)
With perfect market timing ability (PMTA)• What would your actions have been since 1970-2002?
• Switch to T-Bills in 73, 74, 77, 78, 81, 90, 00, 01, 02• No negative returns or losses
• Average S&P500 Return: 10.8% PFA 16.7% • Standard Deviation 17.5% 11.0%
• Results with perfect timing?• You would have had a 54% increase in mean return• You would have a 37% lower standard deviation of
returns

Superior Market Timing (continued)
With imperfect forecasting ability• How would you judge performance?
• Long horizon necessary to judge the ability• Judge proportions of correct calls• Judge both bull markets and bear market calls
• What is the evidence from the real world: “Market Timing Also Stumps Most Pros”
• By the time there is enough information to judge to value added, most portfolio managers have retired, written books, or gone back to being teachers

2. Superior Selection Ability
What is superior selection ability?• The ability of a manager to build an investment
portfolio which generates abnormal returns through buying undervalued stocks, sectors or industries and selling overvalued stocks, sectors or industries
Does this require total active management?• A portfolio manager might balance funds in both an
active portfolio and in a passive portfolio• The goal is to overweight/buy actively managed
funds when they outperform the benchmark, and run passively when actively managed funds under-perform

Questions
Any questions on active management?

B. Calculate Risk-adjusted Performance
How do you determine whether a portfolio manager is generating abnormal returns?• Is it just returns?
Should you also be concerned about risk?• It is not just returns that matters—they must be
adjusted for risk. There are a number of recognized performance
measures available:• Sharp Index• Treynor Measure• Jensen’s Measure
Risk Adjusted Performance: Sharpe
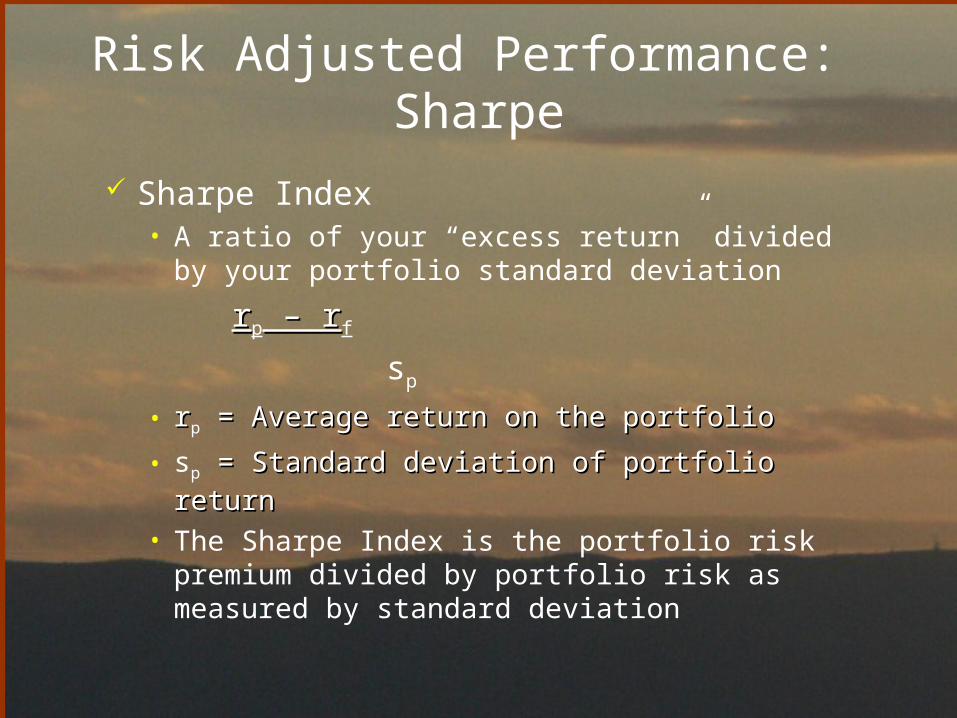
Sharpe Index• A ratio of your “excess return” divided by your
portfolio standard deviation
rrp – r – rf
sp • rrp = Average return on the portfolio = Average return on the portfolio• sp = Standard deviation of portfolio return= Standard deviation of portfolio return• The Sharpe Index is the portfolio risk premium
divided by portfolio risk as measured by standard deviation

Risk Adjusted Performance: Treynor
Treynor Measure • This is similar to Sharpe but it uses the portfolio
beta instead of the portfolio standard deviation
rrp – r – rf
ßßp
rrp = Average return on the portfolio = Average return on the portfolio
rrf = Average risk free rate = Average risk free rate
ßßp = Weighted average b for portfolio = Weighted average b for portfolio • It is the portfolio risk premium divided by portfolio
risk as measured by beta

Risk Adjusted Performance: Jensen
Jensen’s Measure• This is the ratio of your portfolio return less CAPM
determined portfolio return
• ap = rp - [ rf + ßp (rm – rf) ]ap = Alpha for the portfolio
rp = Average return on the portfolio
ßp = Weighted average Beta
rf = Average risk free rate
rm = Avg. return on market index port. It is portfolio performance less expected portfolio
performance from CAPM

Risk Adjusted Performance (continued)
Which Measure is Appropriate? Are there some general guidelines?• Generally, if the portfolio represents the entire
investment for an individual, Sharpe Index compared to the Sharpe Index for the market is best
• If many alternatives are possible, or this is only part of the portfolio, use the Jensen or the Treynor measure.
• Of these two, the Treynor measure is more complete because it adjusts for risk

Risk Adjusted Performance (continued)
Are their limitations of risk adjustment measures?• Yes, very much so. The assumptions underlying
measures limit their usefulness• Know the key assumptions and be careful!
• When the portfolio is being actively managed, basic stability requirements are not met
• Be careful• Practitioners often use benchmark portfolio
comparisons and comparisons to other managers to measure performance
• This is largely because they are easier

Risk Adjusted Performance Problem
Consider the following data for a particular sample period: Portfolio P Market• Average return 35% 28%• Beta 1.2 1.0• Standard Deviation 42% 30%
Calculate the following performance measures for P and the market: Sharpe, Jensen (alpha), and Treynor. The T-bill rate during the period was 6%. By which measures did P outperform the market.
Answer
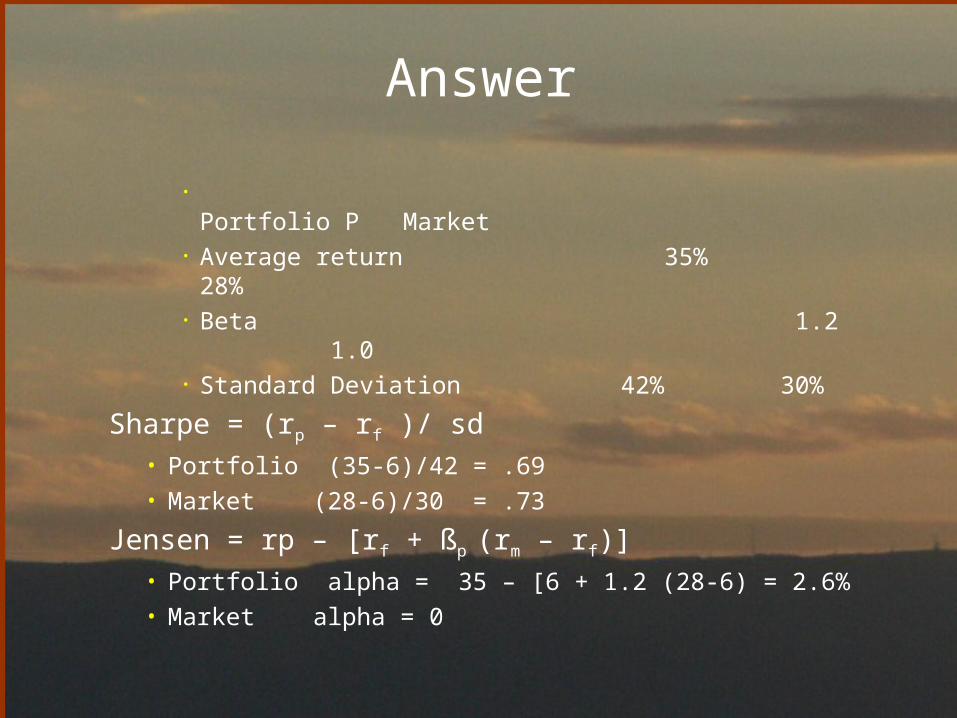
• Portfolio P Market• Average return 35% 28%• Beta 1.2 1.0• Standard Deviation 42% 30%
Sharpe = (rp – rf )/ sd• Portfolio (35-6)/42 = .69• Market (28-6)/30 = .73
Jensen = rp – [rf + ßp (rm – rf)]• Portfolio alpha = 35 – [6 + 1.2 (28-6) = 2.6%• Market alpha = 0

Answer
• Portfolio P Market• Average return 35% 28%• Beta 1.2 1.0• Standard Deviation 42% 30%
Treynor = (rp – rf )/ ßp
• Portfolio (35-6)/1.2 = 24.2• Market (28-6)/1.0 = 22.0
The portfolio outperformed the market in terms of the Jensen’s alpha and the Treynor measure, but not the Sharpe ratio.

Questions
• Any questions on risk-adjusted performance measures?

C. Portfolio Attribution and Decomposing Portfolio Returns
What is Portfolio Attribution?• Portfolio attribution is the process of decomposing
portfolio returns into components, generally attributable to asset allocation and securities selection (although other components can be added as well)
What is the importance of these components?• These components are related to specific elements
of portfolio performance What are examples of some of these components?
• Broad Allocation, security choice, industry, trading, etc.

Portfolio Attribution (continued)
How do you determine portfolio attribution?• 1. Set up a ‘Benchmark’ or ‘Bogey’ portfolio which
includes all relevant asset classes• Use indexes for each component• Use target weight structure
• 2. Compare your portfolio returns in each asset class to the benchmark returns of each index
• 3. Calculate your attribution

Why is it important to attribute performance to the portfolio’s components?• It can explain the difference in return based on
component weights or selection• It can summarize the performance differences into
appropriate categories What happens if you don’t perform portfolio
attribution?• You will not know why you are performing as you
are?• You will not know how to improve
Portfolio Attribution (continued)

Portfolio Attribution Problem
Consider the following information regarding the performance of a money manager during a recent month. The equity index is the S&P500, Bonds the Salomon Brothers Index, and cash is the Lehman Cash.
• Asset Class Actual Actual Benchmark Benchmark• Return Weight Weight Return• Equity Fund 2.0% .70 .60 2.5%• Bond Fund 1.0% .20 .30 1.2%• Cash Fund 0.5% .10 .10 0.5%a. What was the managers return in the month? What
was the over/underperformance?

Answer
Asset Class Actual Actual Benchmark Benchmark Return Weight Weight ReturnEquity 2.0% .70 .60 2.5%Bonds 1.0% .20 .30 1.2%Cash 0.5% .10 .10 0.5%a. What was the managers return in the month? What
was the over or underperformance?The managers return was (2.0%*.7) + (1.0%*.2) +
(.5%*.1) or 1.65%. The index return was (2.5%*.6) + (1.2%*.3) +
(.5%*.1) or 1.91%. the total underperformance was .26% for the portfolio or 1.65%-1.91%.

Portfolio Attribution Problem
Asset Class Actual Actual Benchmark Benchmark Return Weight Weight ReturnEquity 2.0% .70 .60 2.5%Bonds 1.0% .20 .30 1.2%Cash 0.5% .10 .10 0.5%
b. What was the contribution of security selection to relative performance?
c. What was the contribution of asset allocation to relative performance? Confirm that the sum of selection and allocation contributions equals her total excess return relative to the bogey.

Answer Part B
b) What was the contribution of security selection to relative performance?
(1) (2) (1*2)Market Diff. Ret. Man. Port. Wgt. ContributionEquity -0.5% .70 -0.35%Bonds -0.2% .20 -0.04%Cash 0.0% .10 0.00% Contribution of Security Selection -0.39%
(1) Fund return less index return (2.0%-2.5%)(2) Actual weight of the managed portfolio(1*2) Contribution of asset class security selection
to the portfolio

Problem Part C
c. What was the contribution of asset allocation to relative performance? Confirm that the sum of selection and allocation contributions equals her total excess return relative to the bogey. (3) (4) (3*4)Market Excess Weight Index-BM ContributionEquity 10% .59% 0.059%Bonds -10% -.71% 0.071%Cash 0% -1.41% 0.000%
Contribution of Asset Allocation 0.130%(3) Weight of actively managed fund less benchmark weight (- is
underweight)(4) Asset class return less total portfolio return (equity is 2.50-1.91
or .59%, bond is 1.20-1.91=-.71)(3*4) Contribution of the asset class to the total portfolio

Overall Attribution Results
• The actively managed portfolio under performed the benchmarks by .26% or 26 basis points (1.65%-1.91%). This underperformance was a combination of a -.39% contribution to security selection and a .13% contribution from asset allocation.
• While the manager picked the asset classes that performed the best, she didn’t do as well picking the stocks. She needs to work on stock selection or just index that part of the portfolio construction process.

Portfolio Attribution Summary
Performance Evaluation and Active Portfolio Management are very difficult tasks• Very few have done it well
Active management is a difficult topic• While some active managers have proven their
ability to deliver consistent excess returns, the numbers are few
Finding adequate statistics to evaluate performance is critical• Understand the assumptions on which the statistics
are based

Questions
Any questions on portfolio attribution?

Review of Objectives
A. Do you understand the importance of performance evaluation and active portfolio management?
B. Do you understand how to calculate risk adjusted rates of return?
C. Do you understand how to decompose returns into components attributable to asset allocation and securities selection?