b&m european value retail s.a. preliminary results...
TRANSCRIPT

30 May 2018
B&M European Value Retail S.A.
Preliminary Results Announcement
Strong Growth from UK’s Leading General Merchandise Value Retailer B&M European Value Retail S.A. (“the Group”), the UK’s leading multi-price value retailer, today announces its interim results for the 53 weeks to 31 March 2018. HIGHLIGHTS ● Group revenues1 increased by 22.4% to £2,976.3m (2017: £2,430.7m), 22.0% at constant currency2 for the 52 week comparable period to the previous year ● UK B&M store fascia Like-for-Like revenue4 growth of 4.7% for the year ● Group profit before tax increased by 25.4% to £229.3m for the 53 week period (2017: £182.9m) ● UK B&M store fascia Adjusted EBITDA1&3 growth of 17.2% to £261.7m (2017: £223.2m), with a 29bps increase in margin to 10.2% of revenue ● The 53rd week added some £53.5m and £3.2m to Group revenues and profit before tax respectively ● Group Adjusted Profit Before Tax1&3 increased by 16.5% to £221.5m (2017: £190.2m), diluted earnings per share 18.6p (2017: £14.3p) ● Cash generated from operations of £242.0m for the 53 week period (2017: £210.9m), Year-end Net Debt of £535.3m and net debt to EBITDA of 1.92x, which equates to 1.72x excluding the capital expenditure incurred to date on the Southern distribution centre (2017: 1.71x) ● Recommended final dividend5 increased by 23.1% to 4.8p per share (FY17: 3.9p) to be paid on 6 August 2018, bringing the full year ordinary dividend to 7.2p per share, being an increase of 24.1%
● 47 gross new B&M UK stores opened in the period (39 net) and at least a further 45 net new stores are planned for this financial year as we benefit from the availabilty of attractive new store opportunities ● Heron Foods acquisition integrated and delivered excellent performance in the 8 months of ownership generating £11.7m Adjusted EBITDA1&3 and it is proving to be an effective platform
for the introduction of frozen & chilled foods into B&M, which is now in 72 B&M stores ● Learning the lessons in Germany with rapid pace of transition towards the B&M model under the new Jawoll management team. Jawoll Adjusted EBITDA1&3 reduced to £5.6m; targeting a return to EBITDA growth by Jawoll in the current financial year ● Large new, 1m sq ft Southern distribution centre now under construction in Bedford and when commissioned by Spring 2020 it will support UK expansion needs for the foreseeable future

● Pleasing start to Q1 trading across the Group, with 3.1% Like-for-Like in B&M fascia stores in the UK excluding the Easter week
¹ Unless otherwise stated figures presented in this announcement are for the 52 weeks ended 24 March 2018, which is comparable with the previous year rather than the statutory reported 53 week period. See the table below in relation to the statutory 53 week basis figures. 2 Constant currency comparison involves restating the prior year Euro revenues using the same exchange rate as used to translate the current year Euro revenues. 3 The Directors consider adjusted figures to be more reflective of the underlying business performance of the Group and believe that this measure provides additional useful information for investors on the Group’s performance. Further details can be found in note 3. 4 Like-for-like revenues relate to the B&M estate only and include each store’s revenue for that part of the current period that falls at least 14 months after it opened; compared with its revenue for the corresponding part of the previous period. This 14 month approach has been used as it excludes the two month halo period which new stores experience following opening. 5 Dividends are stated as gross amounts before deduction of Luxembourg withholding tax which is currently 15%. 6 Net capital expenditure includes the purchase of property, plant and equipment, intangible assets and proceeds of sale of any of those items.
Simon Arora, Chief Executive, said, “B&M has delivered another set of strong results by doing what we do best, which is providing great value week-in, week-out on the things customers buy regularly for their homes and families. None of our success could have been achieved without the hard work and dedication of the thousands of B&M colleagues across the Group and on behalf of the Board I would like to thank them for all their efforts. The B&M model is highly relevant for the current difficult economic environment, with its strong position in the value and convenience areas of retailing where physical stores are winning. The business is well placed for continued profitable, long-term growth. In a retail sector beset by structural challenges B&M’s unique, disruptive model stands out as a success story.” Financial Results
FY 2018
(52 weeks)
FY 2017
(52 weeks)
Change
FY2018
Statutory
Total Group Revenues B&M Heron Jawoll Total
2,566.0
210.0
200.3
2,976.3
2,252.3
-
178.4
2,430.7
13.9%
-
12.3%
22.4%
2,619.5
210.0
200.3
3,029.8
Number of Stores Group
927
612
51.5%
927

B&M Heron Foods Jawoll
576
265
86
537
-
75
7.3%
-
14.7%
576
265
86
Adjusted EBITDA³ B&M Heron Foods Jawoll
279.0
261.7
11.7
5.6
234.9
223.2
-
11.7
18.8%
17.2%
-
-51.9%
283.3
265.9
11.7
5.6
Adjusted EBITDA %³
9.4%
9.7%
-29bps
9.4%
Profit Before Tax
226.1
182.9
23.6%
229.3
EPS
18.3
14.3
28.0%
18.6
Adjusted Profit Before Tax³
221.5
190.2
16.5%
224.8
Adjusted Diluted EPS³
17.8
14.9
19.5%
18.0
Ordinary Dividends⁵
7.2p
5.8p
24.1%
7.2p
Analyst Meeting & Webcast An Analyst Meeting in relation to the final results will be held on Wednesday 30 May at 08:00 am (UK) by invitation only at: Bank of America Merrill Lynch 2 King Edward Street London EC1A 1HQ The meeting can be accessed live via a dial-in facility on: UK & International: +44 (0) 330 336 9105 US: +1 323 794 2093 Participant Pin Code: 5916871

A simultaneous audio webcast and presentation slides will be available via the B&M corporate website at www.bandmretail.com Enquiries: B&M European Value Retail S.A. For further information please contact +44 (0) 151 728 5400 Simon Arora, Chief Executive Paul McDonald, Chief Financial Officer Steve Webb, Investor Relations Director [email protected] Media For media please contact +44 (0) 207 379 5151 Maitland Daniel Yea [email protected] This announcement contains statements which are or may be deemed to be ‘forward-looking statements’. Forward-looking statements involve risks and uncertainties because they relate to events and depend on events or circumstances that may or may not occur in the future. All forward-looking statements in this announcement reflect the Company’s present view with respect to future events as at the date of this announcement. Forward-looking statements are not guarantees of future performance and actual results in future periods may and often do differ materially from those expressed in forward-looking statements. Except where required by law or the Listing Rules of the UK Listing Authority, the Company undertakes no obligation to release publicly the results of any revisions to any forward-looking statements in this announcement that may occur due to any change in its expectations or to reflect any events or circumstances arising after the date of this announcement. Notes to editors B&M European Value Retail S.A. is a variety retailer with 576 stores in the UK operating under the “B&M” brand and 265 stores under the “Heron Foods” brand, and 86 stores in Germany primarily operating under the “Jawoll” brand as at 31 March 2018. It was admitted to the FTSE 250 index in June 2015. The B&M Group was founded in 1978 and listed on the London Stock Exchange in June 2014. For more information please visit www.bmstores.co.uk
Chief Executive’s Review Overview In a retail industry which is undergoing profound structural change, B&M continues to prosper. In part, this is because our model is one of those disruptive changes to the old order which are fundamentally reshaping the industry. Of the three key trends in modern retailing; the growing importance of the internet, the rapid expansion of the value retail sector and the increasingly pervasive presence of convenience retailing, B&M is participating in two of these three main trends as customer shopping habits evolve. We are already the UK’s leading general merchandise value retailer and, with the successful addition of Heron Foods to the Group, we have also become a participant in the growth of the convenience sector. While we keep the option under review, and we are increasing our investment in digital marketing, we have chosen not to participate in online retailing principally because we believe it would add significant costs to our low cost model and also because, in general, the products and the ways in which our customers buy from us simply do not lend themselves to transacting online. For more than a decade now, B&M has been able to grow rapidly alongside the

increasing influence of the internet on the wider retail sector and I am confident that, given the uniquely competitive nature of our model, we can continue to do so. Strategic development B&M’s strategy for driving sustainable growth in revenues, earnings and free cash flow has four key elements and the business has made further progress during the year with each of these priorities: 1. Delivering great value to our customers; 2. Investing in new stores; 3. Developing our international business; and 4. Investing in our people and infrastructure. Delivering great value to our customers Our business model is all about delivering great value to customers week-in, week-out on the things they buy regularly for their homes and families. Our broad product category coverage means that they have plenty of reasons to keep coming back regularly to our stores. We sell a wide but disciplined range of only the best-selling products, in areas from food to DIY and from homewares to stationery, at everyday low prices which are consistently and significantly below those offered by both specialist and general retailers. With inflation having returned to the UK retail sector last year, spurred by the devaluation of Sterling particularly against the US Dollar in the Summer of 2016, and with shoppers noticing prices increasing in their usual stores, many new customers have come to B&M over the last 18 months, either because they enjoy a bargain or because they need a bargain. B&M has tried hard to mitigate the impact of the rising cost of imported products on prices in its stores and, as a result, customers have continued to reward B&M, either by shopping with us for the first time or by buying more from us when they visit. Newness in our ranges is an essential feature of B&M’s customer appeal. Our ranges are constantly changing so that customers can always find something new and different on our shelves. We are also an increasingly seasonal retailer and flex a significant proportion of our in-store space in the course of a year. For example, some 20% of a typical store’s space will be given to toys and Christmas decorations from October to December and to garden and outdoor leisure products from March to August. In these categories, our ranges and prices are seen by customers as powerful reasons to visit our stores and they have become destination categories for B&M. We saw a good performance in the 2017 Spring/Summer garden and outdoor leisure season. Frustratingly, our 2018 Spring/Summer ranges have seen a slow start due to the exceptionally cold March weather. The disappointing fourth quarter held back what would have otherwise been a very strong second half. The Christmas seasonal period was particularly strong in the year, and it was particularly pleasing to see solid like-for-like revenue growth in the third quarter on top of the outstanding performance achieved in the prior year. DIY and pet care also saw strong growth during the year alongside the continued outperformance of our food and grocery categories. Investing in new stores Making our offering accessible to the hundreds of catchments which do not already have one of our stores remains a top priority for us. In the UK we opened 47 new B&M fascia stores and, net of 8 relocations and closures, we finished the 2017/18 financial year with 576 B&M stores. Taking advantage of a limited number of opportunities to relocate older, smaller, lower contribution stores, which are coming to the end of leases, with larger, modern, high

contribution stores is now a regular part of B&M's expansion programme. There are still a relatively small number of stores in our portfolio for which such a relocation would be an attractive alternative to a lease renewal. The performance of the latest cohort of new stores continues to be excellent, reinforcing our confidence in the strong returns available from the long-term opportunity we see for B&M to expand to a network of at least 950 B&M fascia stores across the UK in the years ahead. With the acquisition of Heron Foods in August 2017, the Group purchased a second UK format and fascia for expansion. With its roots in the North of England and with a high returning store model, Heron Foods has significant scope for expansion outside its heartland region, just as B&M itself did a few years ago. At the moment Heron Foods is pursuing an organic expansion programme of 15 to 20 new stores per annum until the Group’s large new Southern distribution centre in Bedford, which will have multi-temperature chambers, comes on stream in 2020. This new capacity will enable an acceleration in Heron Foods’ rate of store expansion across a broader geography in the future, subject of course to availability of attractive sites. In Germany, Jawoll is continuing to expand with 12 new stores opened during the financial year (being 11 net after one relocation). This was a slower rate of expansion than originally planned, reflecting the priority of the new management team in Germany which, for the time being, is focused instead on the accelerated transition of Jawoll’s operating and product sourcing model to become much closer to that of B&M’s in the coming months. Developing our international business From a strategic perspective, we see the long-term opportunity for the development of a pan-European general merchandise value retail sector in the years ahead, mirroring the structural shift that has taken place in North America over the last few decades, as being very exciting. Multi-country retail formats are beginning to emerge in Europe and we believe the B&M model can be one of these. Our German business, Jawoll, has had a challenging year in which we saw its Adjusted EBITDA³ fall by 52% to £5.6m (2017: £11.7m). Initially, the poor seasonal weather in the first half of the financial year heavily impacted the plant and gardening ranges, which are a key strength and footfall driver of the business. The end of the year was also challenging following the snow and cold weather spells in March having a similar negative effect on the important Easter start to the gardening season. There has also been some natural disruption arising out of the transitioning from the previous management team led by the minority shareholder to a new team which has been appointed by the Group. The new team is tasked with accelerating the transition from the previous business model to the B&M model. We are learning the lessons of not applying sooner in Germany the twin aspects of the B&M model which allow it to be so disruptive in the UK, being in particular a limited, highly disciplined product assortment and a high proportion of general merchandise sourced direct from factories in Asia. Consequently, the pace of change picked up in the final quarter of the year driven by a desire to clear older stock ahead of a substantial increase in the proportion of Jawoll’s product offer being sourced through B&M’s supply chain in the months ahead. These significant changes will continue to disrupt Jawoll’s performance in the first half of this financial year but we anticipate improvement beginning to come through as the year progresses. We are targeting a return to profit growth by Jawoll in the current financial year, weighted towards the second half of that period. Investment in our people and infrastructure Investing ahead of growth in the capability of our teams and in the key infrastructure we need to support growth, continue to be high priorities. At store level, we recognise that the highly delegated style of our store ordering makes the development of our store teams a priority. We pride ourselves on our store learning and development teams, with a Step-Up Programme to develop talent for the future as we continue

to grow our store network. Across our business, we recognise the importance of recruiting talented colleagues. We are helped in this regard by our status as a retailer with strong growth, and a business therefore where personal development and career opportunities are fully available. For example, we take pride in the fact that the strong majority of our Store Managers and Deputy Managers are internal appointments and promotions. In terms of infrastructure, we have taken significant strides in the UK to prepare the business for further expansion. We are continuing to roll-out our new warehouse management system to our largest distribution centres, having trialled the system in a single distribution centre last year. Where we have implemented the new system it has improved both picking accuracy and productivity in our supply chain logistics. We have also now obtained consents for a major new 1m sq ft distribution centre for the South of the UK, in Bedford. When complete, this new facility will provide sufficient additional capacity to support our expanding store network for the foreseeable future, both for B&M itself and for Heron Foods as it builds up its own network from its heartland in the North of England. The costs of running the new centre will be largely funded by the reduced mileage cost incurred by our lorry fleet which is currently servicing our stores in the South from our existing facilities in the North-West. We also ultimately intend, when the facility has been built and commissioned, to enter into a sale and leaseback which will release the capital we have invested in it. Corporate social responsibility B&M’s presence in local towns and communities helps to create new jobs each time we open a new store and it extends our reach to more new customers who want or need a bargain on everyday purchases for their households. This helps limited spending budgets go further. Our Heron Foods and Jawoll stores similarly serve the communities in which those stores are located and where new ones are opened each year. We also recognise the important part we have to play in relation to other aspects of our operations and their impacts in relation to colleagues, suppliers, the wider community socially and the environment. Some of the points I would like to highlight this year include: • the creation of 1,200 new local jobs in the UK and Germany together, mainly through our store expansion; • the development and training of our own talent through our Step-Up Programme promoting 194 colleagues to B&M Deputy and Store Manager positions; • the adoption of a new diversity policy under which we plan to bring forward female candidates to build further on our gender mix on the Board and the executive management committee in the future; • our recycling of high levels of supply chain waste, with 99.4% of the Group's trade packaging waste being recycled; and • proudly supporting for a second year the Mission Christmas charity appeal through sponsorship and our stores in participating towns being used as collection points for presents donated for children for the appeal. Outlook We look forward to the year ahead and into the longer term with confidence. We have a winning, high returning business model, a clear and deliverable strategy for growth and talented, experienced management and operational teams to put our plans into effect. In the current challenging and competitive environment there are of course uncertainties but there are also opportunities; some retailers are finding it more difficult to keep pace with a rapidly changing industry and are downsizing and some others are exiting the market altogether. These moves provide opportunities for B&M to grow its share of the market in some key categories. They also encourage a continued flow of existing store assets onto the market, some of which offer further scope for us to expand into geographic areas where B&M is still under-represented. This constant flow of existing retail space onto the market is also

maintaining downward pressure on retail rents, which is a helpful factor given that we operate a wholly leasehold store estate. All our fascias including, importantly, B&M in the UK, have delivered a pleasing trading performance in the early weeks of the new financial year. Excluding the Easter week B&M UK like-for-like revenue grew by 3.1% in the first 8 weeks of the first quarter. Whilst there are five weeks still to go to the end of the period, we are confident of a solid outcome for the quarter. On behalf of the Board, I would like to thank all our colleagues in stores, distribution centres and offices across the business for their hard work this year. Their commitment is at the heart of B&M’s success. Simon Arora Chief Executive Officer 30 May 2018 Financial Review Accounting period The FY18 accounting period represents the 53 trading weeks to 31 March 2018 and the comparative FY17 period represents trading for the 52 weeks to 25 March 2017. Throughout the financial review and unless otherwise stated, the FY18 commentary will refer to the unaudited 52 week period to 24 March 2018, to better reflect the underlying performance of the business. Revenue The Group revenue in FY18 was £2,976.3m (FY17: £2,430.7m), this represents an increase of 22.4% and on a constant currency basis, a 22.0% increase². In the UK, B&M revenues increased by 13.9% to £2,566.0m, principally driven by the new store opening programme, including both the annualisation of revenues from the 38 net new store openings in FY17 and the 39 net new store openings in FY18. There were 47 gross new store openings in the year, and 8 closures, with 5 of the closures being relocations. The 47 openings contributed £128.4m of revenues in FY18, and the stores continue to have attractive returns on investment, and where appropriate, we will continue to take advantage of relocation opportunities that allow us to open modern, large stores that allow our customers access to our full product offering. Sales in the like-for-like store estate4 grew by 4.7% (FY17: 3.1%) with sales in the first three quarters being particularly strong. During this period we have benefitted from a more inflationary environment in the economy, and in particular on grocery products. One of the features has been the strong performance of grocery as the UK consumer structurally continues to seek out value. The like-for-like in the fourth quarter was slower, with the quarter having been impacted by the winter weather. The like-for-like continues to benefit from the operational improvements through the supply chain. In the UK we also generated £210.0m of revenues following the acquisition of Heron Foods in August 2017. Convenience stores in the UK have performed well and we have seen a strong like-for-like performance, with the business benefitting from extended ranges from the B&M supply chain. Under our period of ownership we have opened 9 net new stores, taking the store estate to 265 and we are planning to open at least 15 to 20 stores in FY19. In our German business Jawoll, revenues grew to £200.3m, which was a 12.3% increase over the £178.4m achieved in FY17. In local currency revenues increased by 6.8% which was

driven by the 11 net new stores opened in the year and the annualisation of the 19 stores opened in FY17. The statutory Group revenue was £3,029.8m which represents an increase of 24.6% against the prior year. Gross margin Our gross margin decreased by 86 basis points to 33.9% (FY17: 34.8%). In the B&M UK business the margin decreased by 69 basis points, impacted by the strength of the grocery sales and some additional markdown activity as we adjusted to new rates of sales on some general merchandise products where retail prices had increased following the impact of US Dollar inflation. The margin was additionally impacted by 14 basis points as a result of the Heron Foods product offer with grocery, chilled and frozen products having a lower percentage margin. In our German business, margins reduced by 100 basis points as we accelerated the clearance of products ahead of the new products arriving from the B&M Far East supply chain, and following the change of management we are accelerating this move towards product being supplied from the B&M Far East supply chain. Operating costs and adjusted EBITDA³ As an everyday low price value retailer we remain committed to ensuring that our costs are carefully managed but also recognising that we need to continue to invest strategically to allow us to continue to grow the business. In the B&M UK business, operating costs, excluding depreciation and adjusting costs, grew by 9.4% to £608.5m and while costs as a percentage of revenues decreased by 97 basis points to 23.7%, with the business benefitting from the operational leverage on the fixed cost base following the strong like-for-like performance, efficiencies within logistics and continued control of store wages. The absolute cash increase in costs was principally driven by the new store opening programme, from both the new stores opened in the year and the annualisation of costs from the new stores opened in FY17 and the variable operating costs required to service the new stores. The Group incurred further costs of £55.5m excluding depreciation and adjusting items in relation to Heron Foods for the 8 month period since the acquisition. In Germany, costs excluding depreciation and adjusting costs increased by 22.3% to £67.1m (FY17: £54.9m). This reflected the increase in costs as a result of the 11 net new stores opened in the year and the annualisation of the stores opened in FY17. We report an adjusted EBITDA³ to allow investors to understand better the underlying performance of the business. The items that we have adjusted are detailed in note 3, they totalled £4.9m in FY18 (FY17 £3.4m). In the B&M UK business the adjusted EBITDA³ increased by 17.2% to £261.7m (FY17: £223.2m) and in Germany adjusted EBITDA3 decreased by 51.9% to £5.6m. An additional £11.7m, of adjusted EBITDA was generated from the 8 months of ownership of Heron Foods. The overall Group adjusted EBITDA3 increased in the year by 18.8% to £279.0m (FY2017: £234.9m) and on an unadjusted basis EBITDA increased by 18.4% to £274.2m (FY2017: £231.5m). Financing costs The net interest charge in the year was £12.2m (FY17: £22.6m) representing a decrease of 46.0%. The interest cost can be split between the underlying cost of £21.6m (FY17: £18.7m) which was an increase of 15.3% reflecting the full year impact of the refinancing that was undertaken in February 2017. The underlying charge can be analysed between bank, high yield bond,

finance lease interest and interest receivable of £20.1m (FY17: £17.3m) and amortised fees of £1.5m (FY17: £1.4m). Interest income on an unadjusted basis amounted to £9.4m (FY17: £(3.7)m) and comprised a £10.1m revaluation in the put/call option relating to the 20% shareholding in Jawoll that is not owned by the Group (FY17: £0.2m) and a £0.7m expense relating to the accounting for the deferred consideration following the Heron Foods acquisition. The deferred consideration cost will be £1.2m in a full year. Additionally, in FY17 there was a £3.7m cost which related to fees associated with the Group's previous bank and debt facilities which was written off. Following the acquisition of Heron Foods we kept the existing Heron Foods loan and overdraft facilities in place in order to maximise the liquidity within the Group. Profit before tax The statutory profit before tax was £229.3m, which compares to £182.9m in FY17. We also report an adjusted profit before tax to allow investors to understand better the operating performance of the business (see note 3). The adjusted profit before tax3 was £221.5m (FY17: £190.2m) which reflected a 16.5% increase. Taxation The tax charge in the year was £43.5m (£38.9m in FY17) and the effective rate was 19.7% which was lower than FY17, principally as a result of the acquisition of Heron Foods and a greater proportion of the Group’s profits being taxed at the UK Corporation Tax rate. We expect the tax rate going forward to reflect the mix of the impact of the tax rates in the countries in which we operate being 19% in the UK and 30% in Germany, with an effective rate of 19.8% in FY19. As a Group we are committed to paying the right tax in the territories in which we operate. In the UK the total tax paid was £258.8m. This is mostly those taxes which are ultimately borne by the company amounting to £143.2m which includes corporation tax, customs duties, business rates, employers national insurance contributions and stamp duty and land taxes. The balance of £115.6m are taxes we collect from customers and employees on behalf of the UK Exchequer which includes Value Added Tax, Pay As You Earn and employee national insurance contributions. Profit after tax and earnings per share The profit after tax was £185.8m compared to £144.0m in FY17 and the fully diluted earnings per share was 18.6p (FY2017: 14.3p), being an increase of 30.0%. On an adjusted profit after tax basis³, which we consider to be a better measure of performance due to the reasons outlined above, it was £177.7m which was a 18.6% increase over last year (FY17: £149.9m) and the adjusted fully diluted earnings per share3 was 17.8p (FY17: 14.9p), being an increase of 19.5%. Investing activities There was a net cash outflow of £107.5m following the acquisition of Heron Foods in August 2017 and there is a further £12.8m of deferred consideration due in FY20, which we anticipate will be payable. The Group net capital expenditure6 during the year was £114.1m, and was principally driven by the new store programme across the three fascias, with a capital expenditure of £45.9m, £8.2m and £5.0m respectively in B&M, Heron Foods and Jawoll. There was also capital expenditure by the Group of £55.0m on the Southern distribution centre. The Group continues to invest in its store estate and an additional £18.0m was incurred on maintenance expenditure, which includes £3.6m on the B&M UK estate rolling out a frozen

and chilled product offer to 60 stores. The overall maintenance expenditure represented 0.6% of revenues and included other in-store investments and IT investments. As a result of the Heron Foods acquisition and the higher capital intensive nature of the Heron Foods estate, we expect this to increase to 0.7% in FY19. In the UK, B&M Retail has acquired land at a capital cost of £55.0m for a new UK distribution centre in Bedford in the South of the UK. The planned opening date for the distribution centre will be early 2020 and the facility will be capable of servicing 350 stores as well as having frozen and chilled food capability. In order to maintain its capital light model the Group intends to enter into a sale and leaseback of the facility. Net debt and cashflow As a Group we continue to be strongly cash generative and the cash flow from operations increased by 14.8% to £242.0m (FY17: £210.9m) including £15.7m from Heron Foods in the 8 months following the acquisition. The cash generation reflects the continued growth in the Group’s EBITDA and the attractive cash paybacks from the new store opening programme, combined with the Group’s working capital control, with working capital as a percentage of revenues being 8.9% (FY17:9.2%). During the year the Group paid £63.0m of dividends. The Group’s net debt in the year was increased to £535.3m (FY17: £401.9m) and the net debt to adjusted EBITDA³ has marginally increased to 1.92 times (FY17: 1.71 times). This remains comfortably within our 2.25 times leverage target, and excluding the costs incurred on the new Southern distribution centre, the leverage would have reduced to 1.72 times. The Board adopted a long-term capital allocation policy in 2016 to provide a framework to help investors understand how the Group will continue to balance the funding requirements of a growth business like B&M with the desire to return surplus capital to shareholders. The Board will continue to evaluate opportunities to invest and support the growth of the business along with the scope for any incremental return of capital to shareholders in the context of that framework. New Accounting Standards There are two new accounting standards that will apply to the Group from the financial year commencing 1 April 2018. IFRS 9 (Financial Instruments) introduces a new impairment model on expected loss and limited changes to the classification and measurements of financial assets. IFRS 15 (Revenue from Contracts with Customers) is in relation to some changes to the recognition of revenues. We have completed an assessment of both of these new standards and we do not consider that the adoption of either standard will have a material impact in relation to the accounting of the Group. IFRS 16 which relates to the new lease accounting standard, will apply to the financial statements of the Group for the financial year 2019/20. The adoption of this new standard will have a significant impact on the consolidated Statement of Financial Position and Income Statement of the Group, given that we have in excess of 900 property leases of stores and distribution centres in the UK and Germany. Dividends The Group has a dividend policy which targets a pay-out ratio of between 30 to 40% of net income on a normalised tax basis. The Group generally pays the interim and final dividends for each financial year approximately in proportions of one-third and two-thirds respectively of the total annual dividend. The Group is strongly cash generative and its capital policy is to allocate cash surpluses in the following order of priority:

1. the roll-out of new stores with a strong payback profile; 2. ordinary dividend cover to shareholders; 3. mergers & acquisition opportunities; and 4. returns of surplus cash to shareholders. The above list is a summary of the main items, but it is not an exhaustive list as other factors may arise from time to time which require investment to support the long-term growth objectives of the Group. The parent company of the Group is an investment holding company which does not carry on retail commercial trading operations. Its distributable reserves are derived from intra-group dividends originating from its subsidiaries. As the parent company is a Luxembourg registered company the Board is permitted, subject to using distributable profits first, to have recourse to the company’s share premium account as a distributable reserve. It remains the Groups policy though generally to have recourse to distributable profits from within the Group, and accordingly, ahead of interim dividends, and also ahead of the year end in relation to final dividends, the Board reviews the levels of dividend cover in the parent company to maintain sufficient levels of distributable profits in the parent company for each of those dividends. The Group’s consolidated balance sheet position as at 31 March 2018 includes distributable profit reserves of £327.1m. The vast majority of these reserves have been generated by and are on the balance sheet of the principal trading subsidiary of the Group in the UK, B&M Retail Limited. There are intermediate holding companies in the Group structure between B&M Retail Limited and the Group’s ultimate parent company, but those intermediate holding companies do not carry on retail trading business operations and there are no dividend blocks of any material amounts in any year from expenses which those companies may incur. The Board is satisfied that as the Group remains strongly cash generative it is in a very good position to fund and maintain its dividend policy. The principal risks of the Group and in particular those relating to competition, economic environment, commodity prices, supply chain, infrastructure and international expansion are relevant to the ability of the Group to maintain its dividend policy in the future. The Group however maintains strategies to mitigate those risks and the Board believes the Group has a robust and resilient business model through the combination of having a value led product assortment which competes across a very broad section of the retail markets in our chosen locations. In the last year the Group has continued to invest to support the growth of the business with particular highlights being the acquisition by the Group of Heron Foods with an enterprise value of £122.5m and also the acquisition of the site in Bedford for the development of a 1 million sq ft Southern distribution centre which will also include further frozen and chilled storage capacity for the Group. In 15 months’ time when the construction phase of the Southern distribution centre has been completed, it is intended to release the cash investment made in that project back to the Group by a sale and leaseback of the distribution centre. Notwithstanding those investments the Group has maintained its dividend this year at the higher end of its dividend policy. An interim dividend of 2.4p per share was paid in December 2017 and it is proposed to pay a final dividend of 4.8p per share. Subject to approval of the dividend by shareholders at the AGM on 30 July 2018, the final dividend of 4.8p per share5 is to be paid on 6 August 2018 to shareholders on the register of the Company at the close of business on 29 June 2018. The ex-dividend date will be 28 June 2018. Paul McDonald Chief Financial Officer 30 May 2018

Consolidated Statement of Comprehensive Income
Period ended 53 weeks ended 31
March 2018 52 weeks ended 25
March 2017 Note £’000 £'000 Revenue 2,4 3,029,802 2,430,660 Cost of sales (2,000,927) (1,586,324)
Gross profit 1,028,875 844,336 Administrative expenses (789,072) (639,833)
Operating profit 5 239,803 204,503 Share of profits in associates 13 1,711 1,005
Profit on ordinary activities before net finance costs and tax 3 241,514 205,508 Finance costs 6 (23,948) (24,110) Finance income 6 182 241 Gain on revaluation of financial instrument 6,20 11,568 1,279
Profit on ordinary activities before tax 229,316 182,918 Income tax expense 11 (43,511) (38,885)
Profit for the period 2 185,805 144,033
Attributable to non-controlling interests (78) 1,107 Attributable to owners of the parent 185,883 142,926 Other comprehensive income for the period Items which may be reclassified to profit and loss: Exchange differences on retranslation of subsidiary and associate investments 205 7,479 Fair value movement as recorded in the hedging reserve (15,659) (1,667) Items which will not be reclassified to profit and loss: Actuarial gain on the defined benefit pension scheme 21 16 Tax effect of other comprehensive income 11 2,470 324
Total comprehensive income for the period 172,842 150,185
Attributable to non-controlling interests 29 119 2,082 Attributable to owners of the parent 172,723 148,103 Earnings per share Basic earnings per share attributable to ordinary equity holders (pence) 12 18.6 14.3 Diluted earnings per share attributable to ordinary equity holders (pence) 12 18.6 14.3
The accompanying accounting policies and notes form an integral part of these consolidated financial statements.

Consolidated Statement of Financial Position
The accompanying accounting policies and notes form an integral part of these consolidated financial statements. This consolidated statement of financial position was approved by the Board of Directors and authorised for issue on 29 May 2018 and signed on their behalf by: Simon Arora, Chief Executive Officer.
As at Note
31 March 2018
£’000
25 March 2017
£’000 Assets
Non-current Goodwill 14 929,718 841,691 Intangible assets 14 120,962 103,693 Property, plant and equipment 15 308,653 165,748 Investments in associates 13 5,140 5,669 Other receivables 17 3,187 2,413 Deferred tax asset 11 5,654 824
1,373,314 1,120,038
Current assets Cash and cash equivalents 18 90,816 155,551 Inventories 16 558,690 462,119 Trade and other receivables 17 34,042 35,398 Other financial assets 20 - 410
683,548 653,478
Total assets 2,056,862 1,773,516
Equity Share capital 23 (100,056) (100,000) Share premium (2,474,249) (2,472,482) Merger reserve 1,979,131 1,979,131 Retained earnings (327,073) (204,077) Luxembourg legal reserve (10,000) (10,000) Put/call option reserve 13,855 13,855 Hedging reserve 14,532 1,350 Foreign exchange reserve (7,833) (7,825) Non-controlling interest (13,692) (13,573)
(925,385) (813,621)
Non-current liabilities Interest bearing loans and borrowings 21 (558,426) (543,725) Finance lease liabilities 25 (7,306) (6,469) Other financial liabilities 20 (19,209) (17,886) Other liabilities 19 (87,130) (76,961) Deferred tax liabilities 11 (24,495) (18,845) Provisions 22 (379) (922)
(696,945) (664,808)
Current liabilities Interest bearing loans and borrowings 21 (47,212) - Overdrafts 18 (6,112) - Trade and other payables 19 (336,072) (267,815) Finance lease liabilities 25 (1,870) (994) Other financial liabilities 20 (16,666) (2,070) Income tax payable (19,677) (19,339) Provisions 22 (6,923) (4,869)
(434,532) (295,087)
Total liabilities (1,131,477) (959,895)
Total equity and liabilities (2,056,862) (1,773,516)

Consolidated Statement of Changes in Shareholders’ Equity
Share
capital Share
premium Retained earnings
Hedging reserve
Legal reserve
Merger reserve
Foreign exch.
reserve
Put/call option reserve
Non- control. interest
Total Share-
holders’ equity
£'000 £’000 £'000 £’000 £’000 £’000 £'000 £’000 £’000 £'000
Balance at 26 March 2016 100,000 2,577,668 115,898 - 614 (1,979,131) 1,273 (13,855) 11,883 814,350
Allocation to legal reserve - (6,776) (2,610) - 9,386 - - - - -
Dividend payments to owners - (98,410) (52,590) - - - - - - (151,000)
Release of non-controlling interest - - 224 - - - - - (392) (168)
Effect of share options - - 254 - - - - - - 254
Total transactions with owners - (98,410) (52,112) - - - - - (392) (150,914)
Profit for the period - - 142,926 - - - - - 1,107 144,033
Other comprehensive income - - (25) (1,350) - - 6,552 - 975 6,152
Total comprehensive income for the period - - 142,901 (1,350) - - 6,552 - 2,082 150,185
Balance at 25 March 2017 100,000 2,472,482 204,077 (1,350) 10,000 (1,979,131) 7,825 (13,855) 13,573 813,621
Dividend payments to owners - - (63,013) - - - - - - (63,013)
Effect of share options 56 1,767 112 - - - - - - 1,935
Total transactions with owners 56 1,767 (62,901) - - - - - - (61,078)
Profit for the period - - 185,883 - - - - - (78) 185,805
Other comprehensive income - - 14 (13,182) - - 8 - 197 (12,963)
Total comprehensive income for the period - - 185,897 (13,182) - - 8 - 119 172,842
Balance at 31 March 2018 100,056 2,474,249 327,073 (14,532) 10,000 (1,979,131) 7,833 (13,855) 13,692 925,385
The accompanying accounting policies and notes form an integral part of these consolidated financial statements.

Consolidated Statement of Cash Flows
Period ended
53 weeks ended 31 March
2018
52 weeks ended 25 March
2017
Note £’000 £'000
Cash flows from operating activities
Cash generated from operations 24 241,993 210,873
Income tax paid (43,996) (31,759)
Net cash flows from operating activities 197,997 179,114
Cash flows from investing activities
Purchase of property, plant and equipment 15 (111,268) (49,160)
Purchase of intangible assets 14 (3,362) (2,796)
Business acquisitions net of cash acquired 7 (106,436) (2,374)
Sale of shares in Home Focus Group 13 310 -
Proceeds from sale of property, plant and equipment 554 1,542
Finance income received 182 137
Dividends received from associates 13 1,149 -
Net cash flows from investing activities (218,871) (52,651)
Cash flows from financing activities
Repayment of bank loans 21 - (140,000)
Receipt of High Yield Bonds 21 - 250,000
Net receipt of Group revolving bank loans 45,000 -
Net repayment of Heron revolving bank loans (9,790) -
Finance costs paid (20,192) (14,983)
Receipt from exercise of employee share options 1,320 -
Capitalised fees on refinancing (1,647) (5,208)
Acquisition of non-controlling interest in BestFlora 29 - (175)
Dividends paid to owners of the parent 32 (63,013) (151,000)
Repayment of finance lease (1,651) (694)
Net cash flows from financing activities (49,973) (62,060)
Net increase in cash and cash equivalents (70,847) 64,403
Cash and cash equivalents at the beginning of the period 155,551 91,148
Cash and cash equivalents at the end of the period 84,704 155,551
Cash and cash equivalents comprise:
Cash at bank and in hand 18 90,816 155,551
Overdrafts (6,112) -
84,704 155,551
The accompanying accounting policies and notes form an integral part of these consolidated financial statements.

Notes to the Consolidated Financial Statements
1 General information and basis of preparation The consolidated financial statements have been prepared in accordance with International Financial Reporting Standards issued by the International Accounting Standards Board (IASB) as adopted by the European Union. The Group’s trade is general retail, with trading taking place in the UK and Germany. The Group has been listed on the London Stock Exchange since June 2014. The consolidated financial statements have been prepared under the historical cost convention as modified by the revaluation of financial assets and financial liabilities at fair value through profit or loss. The measurement basis and principal accounting policies of the Group are set out below and have been applied consistently throughout the consolidated financial statements. The consolidated financial statements are presented in pounds sterling and all values are rounded to the nearest thousand (£’000), except when otherwise indicated. The consolidated financial statements cover the 53 week period from 26 March 2017 to 31 March 2018. This is a different period to the parent company stand alone accounts (from 1 April 2017 to 31 March 2018), this exception is permitted under article 330 (2) of the Luxembourg company law of 10 August 1915 as amended as the management believe that;
the consolidated financial statements are more informative when they cover the same period as used by the main operating entity, B&M Retail Ltd; and
that it would be unduly onerous to rephase the year end in this subsidiary to match that of the parent company.
We note that the year end for B&M Retail Ltd, in any year, would not be more than six days prior to the parent company year end. B&M European Value Retail S.A. (the “Company”) is the head of the Group and there is no consolidation that takes place above the level of this company. The principal accounting policies of the Group are set out below. Basis of consolidation The Group financial statements consolidate the financial statements of the Company and its subsidiary undertakings, together with the Group's share of the net assets and results of associated undertakings, for the period from 26 March 2017 to 31 March 2018. Acquisitions of subsidiaries are dealt with by the acquisition method of accounting. The results of companies acquired are included in the consolidated statement of comprehensive income from the acquisition date. During the year, on 2 August 2017, the Group acquired Heron Food Group Limited (“Heron”), a convenience retailer incorporated in the UK. Heron has been consolidated in the Group accounts from this date. For more details see note 7. During the year the Group has incorporated two new entities, Retail Industry Apprenticeships Limited (incorporated in the UK) and Bedford DC Investments Limited (incorporated in Jersey). Both have been consolidated from their incorporation date. See note 26 for a full list of the constituent Group entities. A Group company, Meltore Limited, was disposed of during the prior year. Meltore Limited was a dormant entity in the prior year and the disposal has had no significant effect on the consolidated financial statements.

Control is achieved when the Group is exposed, or has rights, to variable returns from its involvement with the investee and has the ability to affect those returns through its power over the investee. Specifically, the Group controls an investee if and only if the Group has:
power over the investee (i.e. existing rights that give it the current ability to direct the relevant activities of the investee),
exposure, or rights, to variable returns from its involvement with the investee, and,
the ability to use its power over the investee to affect its returns. When the Group has less than a majority of the voting or similar rights of an investee, the Group considers all relevant facts and circumstances in assessing whether it has power over an investee, including:
the contractual arrangements with the other vote holders of the investee,
rights arising from other contractual arrangements, and,
the Group’s voting rights and potential voting rights.
The Group re-assesses whether or not it controls an investee if facts and circumstances indicate that there are changes to one or more of the three elements of control. Consolidation of a subsidiary begins when the Group obtains control over the subsidiary and ceases when the Group loses control of the subsidiary. Assets, liabilities, income and expenses of a subsidiary acquired or disposed of during the year are included in the statement of comprehensive income from the date the Group gains control until the date the Group ceases to control the subsidiary, excluding the situations as outlined in the basis of preparation.
Going concern After consideration of forecasts and budgets covering the next 12 month period, the directors have determined that it is appropriate to continue to use the going concern basis for production of these consolidated financial statements. Note also that viability and going concern statements have been made in the ‘Principal risks and uncertainties’ section of this annual report.
Revenue Revenue is recognised to the extent that it is probable that economic benefits will flow to the Group and the revenue can be reliably measured, regardless of when the payment is being made. Revenue is measured at the fair value of the consideration received or receivable. Revenue is the total amount receivable by the Group for goods supplied, in the ordinary course of business, excluding VAT and trade discounts, and after deducting returns and relevant vouchers and offers. Store retail turnover is recognised at the initial point of sale of goods to customers, when the risks and rewards of the ownership of the goods have been transferred to the buyer. Other administrative expenses Administrative expenses contain all running costs of the business, except those relating to inventory (which are expensed through cost of sales), tax, interest and other comprehensive income. Transport and warehouse costs are included in this caption. Elements which are unusual and significant may be separated as a separate line item, this would include items such as material restructuring costs.
Goodwill Goodwill is initially measured at cost, being the excess of the fair value of consideration transferred over the fair value of the net identifiable assets acquired and liabilities assumed at the date of acquisition.

After initial recognition, goodwill is measured at cost less any accumulated impairment losses. For the purpose of impairment testing, goodwill acquired in a business combination is, from the acquisition date, allocated to the relevant cash-generating units (CGUs) that are expected to benefit from the combination. Goodwill is tested for impairment at each year end and at any time where there is any indication that goodwill may be impaired. Internally generated goodwill is not recognised as an asset.
Segment reporting Operating segments are reported in a manner consistent with internal reporting provided to the chief operating decision maker. The chief operating decision maker has been identified as the executive directors of the Group. The executive directors are responsible for assessing the performance of the business for the purpose of making decisions about resources to be allocated.
Business combinations
Business combinations are accounted for using the acquisition method. The cost of an acquisition is measured as the aggregate of the consideration transferred, measured at the acquisition date fair value. Acquisition-related costs are expensed depending on their nature with costs of raising finance amortised over the term of the relevant element of finance provided and the remainder expensed when incurred.
Brands Brands acquired as part of a business combination are initially recognised at fair value and subsequently reviewed at least annually for impairment or whenever events or changes in circumstances indicate that their carrying amount may not be recoverable. Where the carrying value of an asset exceeds its recoverable amount (i.e. the higher of value in use and fair value less costs to sell), the asset is written down accordingly, and charged to administration expenses. Unless specifically time limited, brands are considered to have an indefinite life on the basis that they form part of the cash generating units within the Group which will continue in operation indefinitely, with no foreseeable limit to the period over which they are expected to generate net cash inflows. Where a brand is time limited, it is amortised over the period specified in the corresponding agreement.
Intangible assets
Intangible assets acquired separately, including computer software, are measured on initial recognition at cost comprising the purchase price and any directly attributable costs of preparing the asset for use. Following initial recognition, assets are carried at cost less accumulated amortisation and accumulated impairment losses. Amortisation begins when an asset is available for use and is calculated on a straight line basis to allocate the cost of the asset over its estimated useful life as follows: Computer software acquired - 4 years
Property, plant and equipment Property, plant and equipment is carried at cost less accumulated depreciation and accumulated impairment losses. Cost comprises purchase price and directly attributable costs. Unless significant or incurred as part of a refit programme, subsequent expenditure will usually be treated as repairs or maintenance and expensed to the income statement. Subsequent costs are included in the asset’s carrying amount or recognised as a separate asset, as appropriate, only when it is probable that future economic benefits associated with the item will flow to the Group and the cost of the item can be measured reliably. The carrying amount of the replaced part is derecognised.

Freehold land is not depreciated. For all other property, plant and equipment, depreciation is calculated on a straight line basis to allocate cost, less residual value of the assets, over their estimated useful lives as follows.
Depreciation Depreciation is provided on all other items of property, plant and equipment and the effect is to write off the carrying value of items by equal instalments over their expected useful economic lives. It is applied at the following rates: Leasehold buildings - Life of lease (max 50 years) Freehold buildings - 2-4% straight line Plant, fixtures and equipment - 10% - 25% straight line Motor vehicles - 12.5% - 33% straight line Residual values and useful lives are reviewed annually and adjusted prospectively, if appropriate. There has been a minor change to the policy since the prior year regarding the rates for motor vehicles. This is due to the newly acquired company, Heron, who operate with a different fleet profile to the existing members of the Group. This therefore has no effect on the motor vehicles included in property, plant and equipment at the prior year end. An item of property, plant and equipment is derecognised upon disposal or when no future economic benefits are expected from its use or disposal. Any gain or loss arising on derecognition of the asset (calculated as the difference between the net disposal proceeds and the carrying amount of the asset) is included in the statement of comprehensive income when the asset is derecognised.
Investments in associates Associates are those entities over which the Group has significant influence but which are neither subsidiaries nor interests in joint ventures. Investments in associates are recognised initially at cost and subsequently accounted for using the equity method. However any goodwill or fair value adjustment attributable to the Group’s share of associates is included in the amount recognised as investment in associates. All subsequent changes to the share of interest in the equity of the associate are recognised in the Group’s carrying amount of the investment. Changes resulting from the profit or loss generated by the associate are reported in “share of profits of associates” in the consolidated income statement and therefore affect net results of the Group. These changes include subsequent depreciation, amortisation and impairment of the fair value adjustments of assets and liabilities. Items that have been recognised directly in the associate’s other comprehensive income are recognised in the consolidated other comprehensive income of the Group. However, when the Group’s share of losses in an associate equals or exceeds its interest in the associate the Group does not recognise further losses, unless it has incurred obligations or made payments on behalf of the associate. If the associate subsequently reports profits, the investor resumes recognising its share of those profits only after its share of the profits equals the share of losses not recognised. Unrealised gains on transactions between the Group and its associates are eliminated to the extent of the Group’s interest in the associates. Unrealised losses are also eliminated unless the transaction provides evidence of an impairment of the asset transferred. Amounts reported in the consolidated financial statements of associates have been adjusted where necessary to ensure consistency with the accounting policies adopted by the Group.
Impairment of non-financial assets

The Group assesses at each reporting date whether there is an indication that an asset may be impaired. If any indication exists, or when annual impairment testing for an asset is required (for goodwill or indefinite life assets), the Group estimates the asset’s recoverable amount. Indications of impairment might include (for goodwill and the brand assets, for instance) a significant impairment to the like for like sales of established stores, sustained negative publicity or a drop off in visits to our website and social media accounts. An asset’s recoverable amount is the higher of an asset’s or CGU’s fair value less costs to sell and its value in use. It is determined for an individual asset, unless the asset does not generate cash inflows that are largely independent of those from other assets or groups of assets. Where the carrying amount of an asset or CGU exceeds its recoverable amount, the asset is considered impaired and is written down to its recoverable amount. In assessing value in use, the estimated future cash flows are discounted to their present value using a pre-tax discount rate that reflects current market assessments of the time value of money and the risks specific to the asset or CGU. The Group bases its impairment calculation on detailed budgets and forecasts which are prepared separately for each of the Group’s CGU’s to which the individual assets are allocated. These budgets and forecast calculations cover a period of five years. For longer periods, a long-term growth rate is calculated and applied to project future cash flows after the fifth year. Impairment losses of continuing operations, including impairment of inventories, are recognised in the income statement in those expense categories consistent with the function of the impaired asset. For assets excluding goodwill and acquired brands with indefinite lives, an assessment is made at each reporting date as to whether there is any indication that previously recognised impairment losses may no longer exist or may have decreased. If such indication exists, the Group estimates the asset’s or CGU’s recoverable amount. A previously recognised impairment loss is reversed only if there has been a change in the assumptions used to determine the asset’s recoverable amount since the last impairment loss was recognised. The reversal is limited so that the carrying amount of the asset does not exceed its recoverable amount, nor exceed the carrying amount that would have been determined, net of depreciation, had no impairment loss been recognised for the asset in prior years. Such reversal is recognised in the income statement, except for impairment of goodwill which is not reversed.
Leases The determination of whether an arrangement is, or contains, a lease is based on the substance of the arrangement at the inception date. The arrangement is assessed for whether fulfilment of the arrangement is dependent on the use of a specific asset or assets or the arrangement conveys a right to use the asset or assets even if that right is not explicitly specified in an arrangement. The economic ownership of a leased asset is transferred to the lessee if the lessee bears substantially all the risks and rewards related to the ownership of the leased asset. The related asset is recognised at the time of inception of the lease at the fair value of the leased asset, or, if lower, the present value of the minimum lease payments plus incidental payments, if any, to be borne by the lessee. A corresponding amount is recognised as a finance leasing liability. The interest element of leasing payments represents a constant proportion of the capital balance outstanding and is charged in the income statement over the period of the lease. A leased asset is depreciated over the useful life of the asset. However, if there is no reasonable certainty that the Group will obtain ownership by the end of the lease term, the asset is depreciated over the shorter of the estimated useful life of the asset and the lease term.

All other leases are regarded as operating leases and the payments made under them are charged to the statement of comprehensive income on a straight line basis over the lease term. Lease premiums and incentives Lease premiums and lease incentives (as reverse lease premiums) are required to be spread over the term of the lease (as an element of the rent charge), with the resulting balance on the statement of financial position recorded in receivables or payables as appropriate. Favourable and unfavourable leases Upon acquisition of a subsidiary a fair value review is performed to determine if certain leases held are favourable or unfavourable to the business when compared to an estimate of the underlying market rate. To the extent that a lease is determined to be favourable or unfavourable a balance is recognised in receivables or payables and then released over the remaining lease term as part of the rent charge for that lease.
Onerous leases The Group carries a property provision which is recognised on specific sites within the Group’s leasehold property portfolio where an exit can be reasonably expected to occur, and a lease is considered onerous. A lease is considered onerous when the economic benefits of occupying the leased properties are less than the obligations payable under the lease. The amount held covers any costs expected to accrue before the end of the contract, netted against any income, as well as a portion related to any dilapidation expense which may arise.
Inventories Inventories are valued at the lower of cost and net realisable value, after making due allowance for obsolete and slow moving items. Net realisable value is the estimated selling price in the ordinary course of business, less estimated costs of completion and the estimated costs to sell. We do not include transport and distribution costs in our valuation of inventory.
Share options The Group operates share option schemes, with the first such scheme commencing in August 2014. The schemes have been accounted for under the provisions of IFRS 2, and accordingly have been fair valued on their inception date using appropriate methodology (the Black Scholes and Monte Carlo models). A cost is recorded through the income statement in respect of the number of options outstanding and the fair value of those options. A corresponding credit is made to the retained earnings reserve and the effect of this can be seen in the statement of changes in equity. See note 10 for more details.
Taxation Current income tax Current income tax assets and liabilities for the current period are measured at the amount expected to be recovered from or paid to the taxation authorities. The tax rates and tax laws used to compute the amount are those that are enacted or substantively enacted, at the reporting date, in the countries where the Group operates and generates taxable income. Tax is recognised in the income statement, except to the extent that it relates to items recognised in other comprehensive income or directly in equity. In this case, the tax is also recognised in other comprehensive income or directly in equity, respectively. Deferred tax Deferred tax is provided using the liability method on temporary differences between the tax bases of assets and liabilities and their carrying amounts for financial reporting purposes at the reporting date. Deferred tax liabilities are recognised for all taxable temporary differences, except:

• When the deferred tax liability arises from the initial recognition of goodwill or an asset or liability in a transaction that is not a business combination and, at the time of the transaction, affects neither the accounting profit nor taxable profit or loss.
• In respect of taxable temporary differences associated with investments in subsidiaries, associates and interests in joint ventures, when the timing of the reversal of the temporary differences can be controlled and it is probable that the temporary differences will not reverse in the foreseeable future.
Deferred tax assets are recognised for all deductible temporary differences, carry forward of unused tax credits and unused tax losses, to the extent that it is probable that taxable profit will be available against which the deductible temporary differences, and the carry forward of unused tax credits and unused tax losses can be utilised, except: • When the deferred tax asset relating to the deductible temporary difference arises from the initial
recognition of an asset or liability in a transaction that is not a business combination and, at the time of the transaction, affects neither the accounting profit nor taxable profit or loss.
• In respect of deductible temporary differences associated with investments in subsidiaries, associates and interests in joint ventures, deferred tax assets are recognised only to the extent that it is probable that the temporary differences will reverse in the foreseeable future and taxable profit will be available against which the temporary differences can be utilised.
The carrying amount of deferred tax assets is reviewed at each reporting date and reduced to the extent that it is no longer probable that sufficient taxable profit will be available to allow all or part of the deferred tax asset to be utilised. Unrecognised deferred tax assets are re-assessed at each reporting date and are recognised to the extent that it has become probable that future taxable profits will allow the deferred tax asset to be recovered. Deferred tax assets and liabilities are measured at the tax rates that are expected to apply in the year when the asset is realised or the liability is settled, based on tax rates (and tax laws) that have been enacted or substantively enacted at the reporting date.
Financial instruments The Group uses derivative financial instruments such as forward currency contracts, fuel swaps and interest rate swaps to reduce its foreign currency risk, commodity price risk and interest rate risk. Derivative financial instruments are recognised at fair value. The fair value is derived using an internal model and supported by valuations by third party financial institutions. Where a derivative financial instrument is designated as a hedge of the variability in cash flows of a recognised asset or liability, or a highly probable forecast transaction, the effective part of any gain or loss on the derivative financial instrument is recognised directly in the hedging reserve. Any ineffective portion of the hedge is recognised immediately in the income statement. Effectiveness of the derivatives subject to hedge accounting is assessed at inception of the derivative, when the derivative matures and at each reporting period end date between. Where a hedge of a forecast transaction subsequently results in the recognition of a non-financial asset, such as an item of inventory, we remove the associated gains and losses recognised in other comprehensive income and include them in the initial cost of that asset. When a hedging instrument expires or is sold, terminated or exercised, or the entity revokes designation of the hedge relationship but the hedged forecast transaction is still expected to occur, the cumulative gain or loss at that point remains in equity and is recognised in accordance with the above policy when the transaction occurs. If the hedged transaction is no longer expected to take place, the cumulative unrealised gain or loss recognised in equity is recognised in the income statement immediately.
Financial assets Initial recognition and measurement The classification of financial instruments is determined at initial recognition. The Group has the following types of financial assets: Trade and other receivables and cash which are classified within the IAS 39

definition of loans and receivables and derivative contracts which are classified within the IAS 39 definition of fair value through profit and loss. All financial assets are recognised when the Group becomes a party to the contractual provisions of the instrument. All financial assets are initially recognised at fair value plus transaction costs other than for financial assets carried at fair value through profit or loss. The Group does not have any held-to-maturity or available-for-sale financial assets. Subsequent measurement The subsequent measurement of financial assets depends on their classification as described below: Loans and receivables Loans and receivables are non-derivative financial assets with fixed or determinable payments that are not quoted in an active market. After initial measurement, such financial assets are subsequently measured at amortised cost using the effective interest rate method (EIR), less impairment. Amortised cost is calculated by taking into account any discount or premium on acquisition and fees or costs that are an integral part of the EIR. The EIR amortisation and the losses arising from impairment are recognised in profit and loss. Financial assets at fair value through profit or loss Financial assets at fair value through profit or loss include derivative financial instruments entered into by the Group that are not designated as hedging instruments in hedge relationships as defined by IAS 39. Financial assets at fair value through profit or loss are carried in the statement of financial position at fair value with changes in fair value recognised in profit and loss. Derecognition A financial asset (or, where applicable, a part of a financial asset or part of a group of similar financial assets) is derecognised when the rights to receive cash flows from the asset have expired and the entity has transferred its rights to receive cash flows from the asset or has assumed an obligation to pay the received cash flows in full and either (a) the entity has transferred substantially all the risks and rewards of the asset, or (b) the entity has neither transferred nor retained substantially all the risks and rewards of the asset, but has transferred control of the asset. Impairment of financial assets The Group assesses at each reporting date whether there is any objective evidence that a financial asset or a group of financial assets is impaired. A financial asset or a group of financial assets is deemed to be impaired if, there is objective evidence of impairment as a result of one or more events that has occurred after the initial recognition of the asset (an incurred ‘loss event’) and that loss event has an impact on the estimated future cash flows of the financial asset or the group of financial assets that can be reliably estimated.
Financial liabilities Initial recognition and measurement Financial liabilities within the scope of IAS 39 are classified as financial liabilities at fair value through profit or loss or other financial liabilities. The entity determines the classification of its financial liabilities at initial recognition. All financial liabilities are recognised initially at fair value. Financial liabilities at fair value through profit or loss Financial liabilities at fair value through profit or loss include financial derivatives held for trading. Financial liabilities are classified as held-for-trading if they are acquired for the purpose of selling in the near term. This category includes derivative financial instruments entered into by the Group. Gains or losses on liabilities held-for-trading are recognised in profit and loss. Other financial liabilities After initial recognition, interest bearing loans and borrowings, trade and other payables and other liabilities are subsequently measured at amortised cost using the effective interest rate method. Gains and losses are recognised in the income statement when the liabilities are derecognised as well as through the effective interest rate method (EIR) amortisation process.

Amortised cost is calculated by taking into account any discount or premium on acquisition and fees or costs that are an integral part of the EIR. The EIR amortisation is included in finance costs. Derecognition A financial liability is derecognised when the obligation under the liability is discharged or cancelled or expires. Fair value of financial instruments The fair value of financial instruments that are traded in active markets at each reporting date is determined by reference to mark-to-market valuations obtained from the relevant bank (bid price for long positions and ask price for short positions), without any deduction for transaction costs.
Cash and cash equivalents
Cash and cash equivalents comprise cash at bank and in hand, less bank overdrafts.
Equity Equity comprises the following:
"Share capital" represents the nominal value of equity shares;
"Share premium" represents the excess of the consideration made for the shares, over and above the nominal valuation of those shares;
“Legal reserve” representing the statutory reserve required by Luxembourg law as an apportionment of profit within each Luxembourg company (up to 10% of the standalone share capital);
“Hedging reserve” representing the fair value of the derivatives held by the Group at the period end that are accounted for under hedge accounting and that represent effective hedges;
"Merger reserve" representing the reserve created during the reorganisation of the Group in 2014;
"Retained earnings reserve" represents retained profits;
"Put/call option reserve" representing the initial valuation of the put/call option held by the Group over the non-controlling interest of J.A. Woll Handels GmbH (Jawoll);
"Foreign exchange reserve'' represents the cumulative differences arising in retranslation of the subsidiaries results;
"Non-controlling interest" representing the portion of the equity which belongs to the non-controlling interest in the Group’s subsidiaries.
Foreign currency translation These consolidated financial statements are presented in pounds sterling. The following Group companies have a functional currency of pounds sterling;
B&M European Value Retail S.A.
B&M European Value Retail 1 S.à r.l. (Lux Holdco)
B&M European Value Retail Holdco 1 Ltd (UK Holdco 1)
B&M European Value Retail Holdco 2 Ltd (UK Holdco 2)
B&M European Value Retail Holdco 3 Ltd (UK Holdco 3)
B&M European Value Retail Holdco 4 Ltd (UK Holdco 4)
Bedford DC Investments Limited
EV Retail Ltd
B&M Retail Ltd
Opus Homewares Ltd
Retail Industry Apprenticeships Ltd
Heron Food Group Ltd
Heron Foods Ltd
Cooltrader Ltd
Heron Properties (Hull) Ltd
The following Group companies have a functional currency of the Euro;
B&M European Value Retail 2 S.à r.l. (SBR Europe)
B&M European Value Retail Germany GmbH (Germany Holdco)
J.A. Woll Handels GmbH (Jawoll)
Jawoll Vertriebs GmbH The Group companies whose functional currency is the Euro have been consolidated into the Group via retranslation of their accounts in line with IAS 21 Effects of Changes in Foreign Exchange Rates. The assets and liabilities are translated into pounds sterling at the year end exchange rate. The revenues and expenses are translated into pounds sterling at the average monthly exchange rate during the period. Any resulting foreign exchange difference is cumulatively recorded in the foreign exchange reserve with the annual effect being charged/credited to other comprehensive income. Transactions entered into by the company in a currency other than the currency of the primary economic environment in which it operates (the "functional currency") are recorded at the rates ruling when the transactions occur. Foreign currency monetary assets and liabilities are translated at the rates ruling at the balance sheet date. Exchange differences arising on the retranslation of unsettled monetary assets and liabilities are recognised immediately in profit or loss.
Pension costs
The Group operates a defined contribution scheme and contributions are charged to profit or loss in the period in which they are incurred.
Provisions
Provisions are recognised when a present obligation (legal or constructive) exists as a result of a past event and where it is probable that an outflow of resources embodying economic benefits will be required to settle the obligation and the amount can be reliably estimated. Provisions are discounted where the time value of money is considered to be material.
Critical judgements and key sources of estimation uncertainty
The key assumptions concerning the future and other key sources of estimation uncertainty at the reporting date, that have a significant risk of causing a material adjustment to the carrying amounts of assets and liabilities within the next financial year, are described below. The Group based its assumptions and estimates on parameters available when the financial information was prepared. Existing circumstances and assumptions about future developments, however, may change due to market changes or circumstances arising beyond the control of the Group. Such changes are reflected in the assumptions when they occur. Investments in Associates Multi-lines International Company Ltd (Multi-lines), which is 50% owned by the Group, has been considered by management as a judgement to be an associate rather than a subsidiary or a joint venture. Under IFRS 10 control is determined by:
Power over the investee.
Exposure, or rights, to variable returns from its involvement with the investee.
The ability to use its power over the investee to affect the amount of the investor’s returns.
Although 50% owned, B&M Group does not have voting rights or substantive rights. Therefore the level of power over the business is considered to be more in keeping with that of an associate than a joint-venture, and hence it has been treated as such within these consolidated financial statements. Put/call options on Jawoll non-controlling interest

The purchase agreement for Jawoll included call and put options over the shares not purchased by the Group, representing 20% of Jawoll. The options are arranged such that it is considered likely that either the call or put option will be taken at the exercise date in 2019. The exercise price of the options contains an uncertain variable element and as such the risk and rewards of the options are considered to remain with the non-controlling interest. The purchase of the non-controlling interest will be recognised upon exercise of one of the options (see note 20). A financial liability has been recognised carried at fair value to represent the expected exercise price, with the corresponding debit entry to the put/call option reserve. Management have estimated the future measurement inputs in arriving at this value, using knowledge of current performance, expected growth and planned strategy. Any subsequent movements in the liability will be recognised in profit or loss.
Standards and Interpretations applied and not yet applied by the Group
New standards and interpretations
At the date of authorisation of these Consolidated Financial Statements, the following standards and interpretations, relevant to the Group, which have not been applied to these financial statements, were in issue, but not yet effective:
Title Key Issues Effective Date Impact on B&M European Value Retail S.A.
IFRS 15 Revenue from Contracts with Customers
The new standard is a single global revenue standard that contains a single model that applies to two approaches, being at point in time and over time. For complex transactions with multiple components, variable consideration or extended periods, application of the standard can lead to revenue being accelerated or deferred in comparison to current IFRS.
Periods beginning after 1 January 2018, deferred from 1 January 2017.
Management do not consider that this standard will have a material impact on the accounts.
IFRS 9 Financial Instruments
IFRS 9 was introduced in 2014 as a complete standard including the requirements previously issued and the additional amendments to introduce a new expected loss impairment model and limited changes to the classification and measurement requirements for financial assets.
Periods beginning after 1 January 2018.
Management do not consider that this standard will have a material impact on the accounts.
IFRS 16 Leases IFRS 16 was issued in January 2016 and is effective from 1 January 2019, eliminating the classification of leases as operating leases or finance leases and setting out a single lease accounting model.
Periods beginning after 1 January 2019.
Significant impact on Statement of Financial Position and Income Statement presentation and measurement which is currently under review, more detail follows below.
At the date of the authorisation of these financial statements, the following standards and interpretations which have not been applied in these financial statements were in issue but are either not yet effective or have not been adopted by the EU:
• Amendments to IFRS 2 Classification and Measurement of Share-based Payment Transactions. • Amendments to IAS 7 Disclosure Initiative. • Amendments to IAS 12 Recognition of Deferred Tax Assets for Unrealised Losses. • Amendments to IFRS 10 and IAS 28 Sale or Contribution of Assets between an Investor and
its Associate or Joint Venture. • Annual Improvements 2014–2016 Cycle.
Other than as mentioned in the above, the Group does not currently expect that adoption of the other standards and amendments listed will have a significant effect on the consolidated results or financial position of the Group.
IFRS 16 Leases
IFRS 16 Leases will be applicable for periods starting after 1 January 2019 and will apply to the Group’s accounts commencing 31 March 2019. This standard will significantly affect the presentation of the Group financial statements as we have over 900 active property leases (primarily related to the Group’s store estate) as well as a smaller commitment for other operating leases.
The Group has considered the implications of IFRS 16 on the Group’s consolidated results and has developed a model to account for changes required to be made by the new standard.
Whilst the detailed data has not been audited, the overall model has been reviewed by the Group auditors including the assumptions and the calculations within the model.
At this stage, and subject to several factors, including the ongoing tax consultation with HMRC, the

accounting definition of the retrospective application of cash flows and auditor approval, we expect to use the modified retrospective approach. This will lead to a significant brought forward retained earnings adjustment representing the recognition of a liability that exceeds the recognised asset.
Specifically;
Our Statement of Financial Position will include a liability equal to the present value of all future lease commitments and a corresponding right-of-use asset. Due to discounting it is expected that the liability will be significantly in excess of the asset. Our current gross operating lease commitment is £1,257.8m, £1,239.1m of which is in relation to property leases (see note 25). Our net deferred property liability (currently £98.8m) would be also be derecognised.
Our Statement of Comprehensive Income will have a significantly reduced rental charge, but increased amortisation and interest charge related to the unwinding of the lease liability. Overall the amortisation and interest increase is expected to exceed the reduction in rent in the first years of application. Our current rental charge is £150.5m, £140.9m of which relates to property leases (see note 25).
There will also be subsequent knock-on effects to the presentation of the Statement of Cash Flows.

2 Segmental information
IFRS 8 (“Operating segments”) requires the Group’s segments to be identified on the basis of internal reports about the components of the Group that are regularly reviewed by the chief operating decision maker to assess performance and allocate resources across each reporting segment. For management purposes, the Group is organised into three reportable segments, being the UK B&M segment, the UK Heron segment and the German retail segment. The UK Heron segment has been active since the acquisition of Heron Food Group in August 2017, the UK B&M segment was previously reported as the UK Retail segment. Items that fall into the corporate category include those related to the Luxembourg or associate entities, Group financing, corporate transactions, any tax adjustments and items we consider to be adjusting (see note 3). The chief operating decision maker has been identified as the executive directors who monitor the operating results of the retail segments for the purpose of making decisions about resource allocation and performance assessment. The average euro rate for translation purposes was €1.1336/£ during the year, with the year end rate being €1.1410/£ (2017: €1.1915/£ and €1.1559/£, respectively).
53 week period to 31 March 2018 UK B&M
UK Heron
Germany Retail Corporate Total
£’000 £’000 £’000 £’000 £’000 Revenue 2,619,488 210,008 200,306 - 3,029,802 EBITDA (note 3) 266,269 11,746 5,621 (5,240) 278,396 Depreciation and amortisation (26,485) (6,001) (4,392) (4) (36,882) Net finance income/(costs) 109 (481) (370) (11,456) (12,198) Income tax expense (45,580) (1,000) (258) 3,327 (43,511) Segment profit/(loss) 194,313 4,264 601 (13,373) 185,805 Total assets 1,718,328 204,162 127,078 7,294 2,056,862 Total liabilities (361,834) (56,909) (27,287) (685,447) (1,131,477) Capital expenditure (including intangible) (45,986) (8,610) (4,987) (55,047) (114,630)
52 week period to 25 March 2017 UK
B&M UK
Heron Germany
Retail Corporate Total £’000 £’000 £’000 £’000 £’000 Revenue 2,252,265 - 178,395 - 2,430,660 EBITDA (note 3) 223,722 - 11,677 (3,876) 231,523 Depreciation and amortisation (22,277) - (3,734) (4) (26,015) Net finance income/(costs) 107 - (280) (22,417) (22,590) Income tax expense (40,310) - (2,406) 3,831 (38,885) Segment profit/(loss) 161,241 - 5,257 (22,465) 144,033 Total assets 1,640,398 - 126,040 7,078 1,773,516 Total liabilities (325,372) - (27,399) (607,124) (959,895) Capital expenditure (including intangible) (44,492) - (7,464) - (51,956)

3 Reconciliation of non-IFRS measures from the statement of comprehensive income
EBITDA, adjusted EBITDA and Adjusted Profit are non-IFRS measures and therefore we provide a reconciliation from the statement of comprehensive income below.
Period to
53 weeks ended 31 March
2018
52 weeks ended 25 March
2017 £’000 £’000 Profit on ordinary activities before interest and tax 241,514 205,508 Add back depreciation and amortisation 36,882 26,015
EBITDA 278,396 231,523 Reverse the effect of derivatives recorded within cost of sales (509) 1,479 Reverse the effect of derivatives recorded within administrative expenses 4,334 1,890 Remove costs associated with the acquisition of Heron 1,049 -
Adjusted EBITDA 283,270 234,892 Depreciation and amortisation (36,882) (26,015) Net adjusted finance costs (see note 6) (21,596) (18,726)
Adjusted profit before tax 224,792 190,151 Adjusted tax (44,437) (40,273)
Adjusted profit for the period 180,355 149,878
Attributable to non-controlling interests (78) 1,095 Attributable to owners of the parent 180,433 148,783
The adjusting items are the effects of derivatives, one off refinancing fees and the effects of revaluing or unwinding balances related to the acquisition of subsidiaries, such as the call/put option held over the non-controlling interest of our German operation. Significant project costs may also be included if incurred, as they have been this year in relation to the acquisition of Heron (see note 7). Adjusted tax represents the tax charge per the statement of comprehensive income as adjusted only for the effects of the other adjusting items detailed above.
The segmental split in EBITDA and Adjusted EBITDA reconciles as follows;
53 week period to 31 March 2018 UK B&M
UK Heron
Germany Retail Corporate Total
£’000 £’000 £’000 £’000 £’000 Profit before interest and tax 239,784 5,745 1,229 (5,244) 241,514 Add back depreciation and amortisation 26,485 6,001 4,392 4 36,882
EBITDA 266,269 11,746 5,621 (5,240) 278,396 Reverse the effects of derivatives - - - 3,825 3,825 Reverse fees expensed on acquisition - - - 1,049 1,049
Adjusted EBITDA 266,269 11,746 5,621 (366) 283,270
52 week period to 25 March 2017 UK
B&M UK
Heron Germany
Retail Corporate Total £’000 £’000 £’000 £’000 £’000 Profit before interest and tax 201,445 - 7,943 (3,880) 205,508 Add back depreciation and amortisation 22,277 - 3,734 4 26,015
EBITDA 223,722 - 11,677 (3,876) 231,523 Reverse the effects of derivatives - - - 3,369 3,369
Adjusted EBITDA 223,722 - 11,677 (507) 234,892
Adjusted EBITDA and related measures are not measures of performance or liquidity under IFRS and should not be considered in isolation or as a substitute for measures of profit, or as an indicator of the Group’s operating performance or cash flows from operating activities as determined in accordance with IFRS.

4 Reconciliation of the 52-week results from the 53-week adjusted results
In the commentary accompanying these accounts management consider that presenting an adjusted 52-week result is helpful to the users of this annual report in order to directly compare like for like periods. Therefore we present a reconciliation to an adjusted 52-week statement of comprehensive income derived from the adjusted 53-week statement of comprehensive income by removing the final week of the financial year. The sales and gross margin were directly taken from the specific week 53 figures and other costs were apportioned accordingly by considering the final accounting month of the year. The adjusting items are those detailed in note 3.
53-weeks to
31 March 2018 £’000
Week 53 £’000
52 weeks to 24 March 2018
£’000
52 weeks to 25 March 2017
£’000
Adjusted
Revenue 3,029,802 53,528 2,976,274 2,430,660 Cost of sales (2,001,437) (35,366) (1,966,071) (1,584,845)
Gross Profit 1,028,365 18,162 1,010,203 845,815 Administrative expenses (781,977) (14,668) (767,309) (636,938)
Profit before net finance costs and tax 246,388 3,494 242,894 208,877 Add back depreciation and amortisation 36,882 727 36,155 26,015
EBITDA 283,270 4,221 279,049 234,892 Depreciation and amortisation (36,882) (727) (36,155) (26,015) Net finance costs (21,596) (246) (21,350) (18,726)
Profit before tax 224,792 3,248 221,544 190,151 Tax (44,437) (633) (43,804) (40,273)
Profit after tax 180,355 2,615 177,740 149,878
Attributable to non-controlling interests (78) - (78) 1,095 Attributable to owners of the parent 180,433 2,615 177,818 148,783
The 53rd week only materially affects the UK B&M segment. The Germany retail segment reports annual figures and the UK Heron segment reports on a 52 week basis and the results only include the post acquisition period from August 2017. Therefore we also present a reconciliation of the 52 week profit and loss UK B&M segment figures as follows:
53-weeks to
31 March 2018 £’000
Week 53 £’000
52 weeks to 24 March 2018
£’000
52 weeks to 25 March 2017
£’000
UK B&M segment
Revenue 2,619,488 53,528 2,565,960 2,252,265 EBITDA 266,269 4,221 262,048 223,722 Depreciation and amortisation (26,485) (727) (25,758) (22,277) Net finance income/(costs) 109 2 107 107 Income tax expense (45,580) (664) (44,916) (40,310) Segment profit 194,313 2,832 191,481 161,242
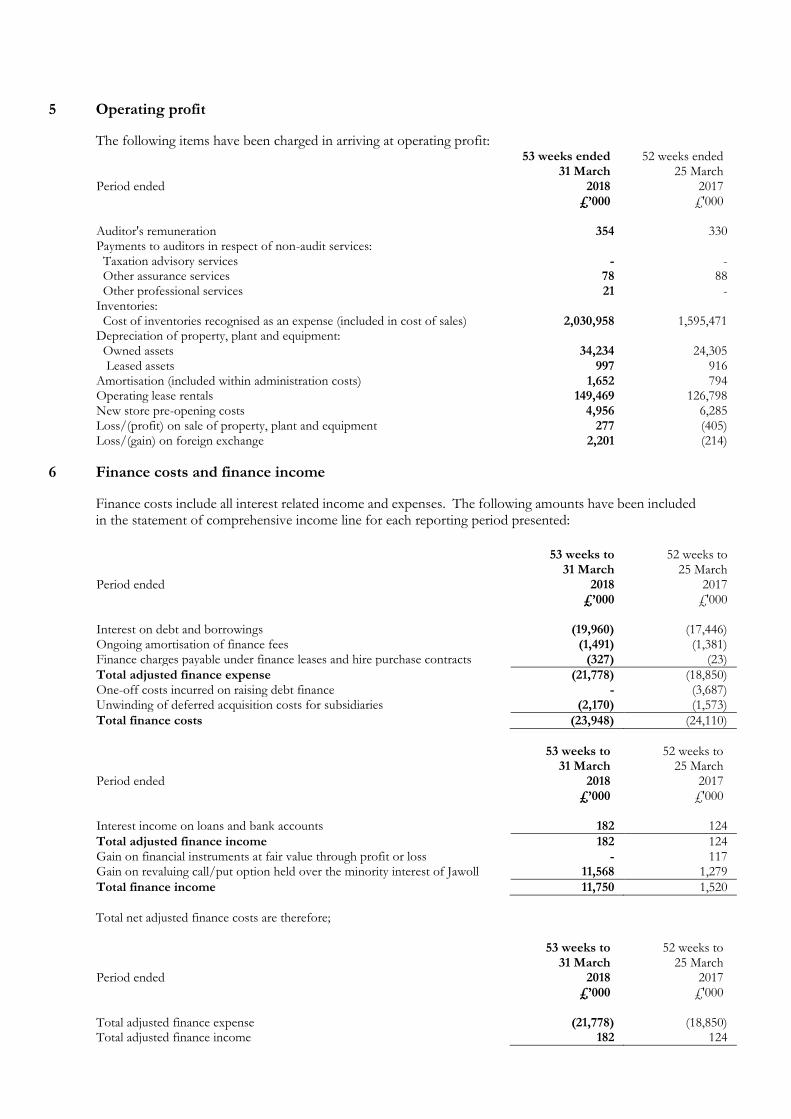
5 Operating profit
The following items have been charged in arriving at operating profit:
Period ended
53 weeks ended 31 March
2018
52 weeks ended 25 March
2017 £’000 £'000 Auditor's remuneration 354 330 Payments to auditors in respect of non-audit services: Taxation advisory services - - Other assurance services 78 88 Other professional services 21 - Inventories: Cost of inventories recognised as an expense (included in cost of sales) 2,030,958 1,595,471 Depreciation of property, plant and equipment: Owned assets 34,234 24,305 Leased assets 997 916 Amortisation (included within administration costs) 1,652 794 Operating lease rentals 149,469 126,798 New store pre-opening costs 4,956 6,285 Loss/(profit) on sale of property, plant and equipment 277 (405) Loss/(gain) on foreign exchange 2,201 (214)
6 Finance costs and finance income
Finance costs include all interest related income and expenses. The following amounts have been included in the statement of comprehensive income line for each reporting period presented:
Period ended
53 weeks to 31 March
2018
52 weeks to 25 March
2017 £’000 £'000 Interest on debt and borrowings (19,960) (17,446) Ongoing amortisation of finance fees (1,491) (1,381) Finance charges payable under finance leases and hire purchase contracts (327) (23)
Total adjusted finance expense (21,778) (18,850) One-off costs incurred on raising debt finance - (3,687) Unwinding of deferred acquisition costs for subsidiaries (2,170) (1,573)
Total finance costs (23,948) (24,110)
Period ended
53 weeks to 31 March
2018
52 weeks to 25 March
2017 £’000 £'000 Interest income on loans and bank accounts 182 124
Total adjusted finance income 182 124 Gain on financial instruments at fair value through profit or loss - 117 Gain on revaluing call/put option held over the minority interest of Jawoll 11,568 1,279
Total finance income 11,750 1,520
Total net adjusted finance costs are therefore;
Period ended
53 weeks to 31 March
2018
52 weeks to 25 March
2017 £’000 £'000 Total adjusted finance expense (21,778) (18,850) Total adjusted finance income 182 124

Total net adjusted finance costs (21,596) (18,726)
7 Business Combination
On 2 August 2017 the Group acquired Heron Food Group Limited (“Heron”), a discount convenience retailer incorporated in the UK. The transaction has been accounted for via the acquisition method of accounting. The Group purchased 100% of the share capital, for a fair value of £122.5m, which breaks down as follows: £’000 Initial cash consideration 112,123 Fair value of deferred consideration 10,422
Total 122,545
The deferred consideration represents a cash amount of £12.8m payable in 2019 based upon certain conditions that management do not consider the final amount to be reasonably sensitive to (see note 20). An exercise carried out by the business has fair valued this at the acquisition date at £10.4m and this will be unwound through the P&L to the full value of £12.8m by August 2019. The fair values of the identifiable assets and liabilities of Heron on the date of the acquisition were: Assets £’000 Heron brand asset 14,178 Favourable lease contracts 1,385 Other intangible assets 1,305 Property, plant and equipment 67,299 Inventories 13,835 Receivables and other assets 8,081 Cash 8,315
Total assets 114,398
Liabilities Unfavourable lease contracts (9,984) Creditors and accruals (32,395) Provisions (1,538) Corporation and deferred tax (4,107) Finance leases (3,199) Overdraft (2,628) Bank loans (25,582)
Total liabilities (79,433)
Net assets acquired 34,965 Fair value of consideration 122,545 Goodwill recognised on acquisition 87,580
None of the receivables recognised were considered irrecoverable at the acquisition date. Fees of £1.0m were incurred during the acquisition all of which have been expensed through the P&L, and which are treated as adjusting for the purposes of note 3. The goodwill largely relates to the growth potential of the business, the current location of the stores and the existing workforce. None of the elements which make up goodwill can, or are not material enough to be recognised as a separate intangible asset. The effect the acquisition has had on the P&L can be seen in the segment note (note 2). Had the company been bought at the start of the year it would have contributed an estimated extra £108.6m to revenue and £3.4m to operating profit under their local accounting policies (FRS 102 compliant).

The balance on the consolidated statement of cash flows reconciles as follows: £’000 Initial cash consideration 112,123 Cash acquired (8,315) Overdraft acquired 2,628
Net cash for acquisitions 106,436
On 1 August 2016 the business acquired the trade and assets of a small chain of German stores (Knüller).
The details of the assets acquired are as follows: €’000 Property, plant & equipment 50 Cash (floats) 50 Inventory 1,204
Total assets acquired 1,304 Purchase price paid 2,879 Goodwill recognised 1,575
The goodwill recognised represents the stores location and customer base and it was not possible to separate this out further into material separately identifiable and recognisable intangible assets. It has been considered for impairment as part of the overall impairment test carried out annually by the Group (see note 11). The purchase price paid net of the cash acquired was €2,829k and this translates to £2,374k as shown on the consolidated statement of cash flows. The business was incorporated directly into the German entities, with the stores reopening as rebranded Jawoll stores. The Group considers that the transaction is immaterial for further disclosure
8 Employee remuneration
Expense recognised for employee benefits is analysed below:
Period ended
53 weeks to 31 March
2018
52 weeks to 25 March
2017 £’000 £'000 Wages and salaries 347,027 277,054 Social security costs 16,945 12,907 Pensions - defined contribution plans 1,424 1,022
365,396 290,983
There are £221k of defined contribution pension liabilities owed by the Group at the period end (2017: £73k). The Group has one employee who is a member of a defined benefit scheme (2017: one employee). The liability held on the balance sheet at the year end was £250k (2017: £267k). The scheme is considered immaterial to the Group and the effect of the year end actuarial valuation can be seen within other comprehensive income.

The average monthly number of persons employed by the Group during the period was:
Period ended
53 weeks to 31 March
2018
52 weeks to 25 March
2017 Sales staff 30,758 25,418 Administration 1,284 639
32,042 26,057
9 Key management remuneration
Key management personnel and Directors' remuneration includes the following:
Period ended
53 weeks to 31 March
2018
52 weeks to 25 March
2017 £’000 £'000 Directors' remuneration: Short term employee benefits 3,067 2,177 Benefits accrued under the share option scheme 226 124
3,293 2,301
Key management expense (includes Directors’ remuneration): Short term employee benefits 7,103 4,648 Benefits accrued under the share option scheme 280 124 Pension 4 -
7,387 4,772
Amounts in respect of the highest paid director emoluments: Short term employee benefits 2,049 1,393 Benefits accrued under the share option scheme - -
2,049 1,393
The emoluments disclosed above are of the directors and key management personnel who have served as a director within any of the Group companies.
10 Share Options
As of 31 March 2018, the Group operates two share option schemes, both of which split down to various tranches. Details of these schemes follow. 1) The Company Share Option Plan (CSOP) scheme The CSOP scheme was adopted by the Group as a Schedule 4 CSOP Scheme on 29 March 2014. No grant under this scheme can be made more than 10 years after this date. Eligibility Employees and executive directors of the Group are eligible for the CSOP and the awards are made at the discretion of the remuneration committee. Limits & Pricing A fixed number of options offered to each participant, with the pricing set as the close price on the grant date. The options offered to each individual cannot exceed a total value of £30,000 measured as the option price multiplied by the number of options awarded, with the whole scheme limited to 10% of the share capital in issue. Vesting & Exercise

The awards vest on the third anniversary of grant, subject to the following condition: In order for an option to be eligible for vesting, the underlying UK EBITDA in the last financial year that ended prior to the third anniversary of the grant should not be less than 130% of the underlying UK EBITDA in the last financial year that ended before the grant was made. Once vested the award can be exercised up until the tenth anniversary of the grant. Tranches To the end of March 2018 there have been four tranches of the CSOP, details are as follows:
Tranche 1 Tranche 2 Tranche 3 Tranche 4
Date of grant 1 Aug 2014 11 Aug 2014 17 Dec 2015 19 Aug 2016 Option price 271.5p 267.0p 286.0p 276.8p Options granted 596,646 104,860 10,489 21,676 Fair value of each option at date of grant 83p 81p 79p 50p Options outstanding at 26 March 2016 504,571 67,410 10,489 - Granted - - - 21,676 Forfeited (44,196) (7,490) - - Exercised - - - - Options outstanding at 25 March 2017 460,375 59,920 10,489 21,676 Granted - - - - Forfeited (22,098) - - - Exercised (427,228) (59,920) - - Options outstanding at 31 March 2018 11,049 - 10,489 21,676
No options have lapsed in either period. 2) Long-Term Incentive Plan (LTIP) Awards The LTIP was adopted by the board on 29 May 2014. No grant under this scheme can be made more than 10 years after this date. Eligibility Employees and executive directors of the Group are eligible for the LTIP and the awards are made at the discretion of the remuneration committee. Limits & Pricing A fixed number of options offered to each participant, with the pricing set at £nil. The options offered to each individual cannot exceed a total value of 100% (200% under exceptional circumstances) of the participants base salary where the value is measured as the market value of the shares on grant multiplied by the number of options awarded, with the whole scheme limited to 10% of the share capital in issue. Vesting & Exercise The share options vest on the third anniversary of the grant date, subject to a set of conditions as follows: LTIP 2014:
The Total Shareholders Return (TSR) must exceed 15%, where the TSR is a measure of the change in share price and dividends paid in the vesting period.
The underlying UK EBITDA in the Financial Year ended March 2017 is at least 130% greater than the underlying UK EBITDA in the Financial Year ended March 2014.
LTIP 2015, 2016, 2017A:
50% of the awards are subject to a TSR performance condition, where the Group’s TSR over the vesting period is compared with a comparator group. The awards vest on a sliding scale where the full 50% is awarded if the Group falls in the upper quartile, 12.5% vests if the Group falls exactly at the median, and 0% below that.

50% of the awards are subject to an EPS performance target. The awards vest on a sliding scale based upon the Earnings per share as follows: Award EPS as at 50% paid at 12.5% paid at LTIP 2015 March-18 19.0p 15.0p LTIP 2016 March-19 22.5p 17.5p LTIP 2017A March-20 24.0p 19.0p
Below the 12.5% boundary, no options vest.
LTIP 2017/B1, 2017/B2, 2018/B1:
Group EBITDA must be positive in each year of the LTIP.
The awards also have an employee performance condition attached.
Vested awards can be exercised up to the tenth anniversary of grant.
Tranches To the end of March 2018 there have been seven awards of the LTIP, with the details as follows. Note that the LTIP 2015, LTIP 2016 and LTIP 2017A have been split into the element subject to the TSR (50%) and the element subject to the EPS (50%) since these were valued separately.
2014 2015-TSR 2015-EPS 2016-TSR 2016-EPS
Date of grant 1 Aug 2014 5 Aug 2015 5 Aug 2015 18 Aug 2016 18 Aug 2016 Nil price options granted 200,000 40,616 40,616 122,385.5 122,385.5 Fair value of each option at date of grant 134p 210p 341p 164p 254p Options outstanding at 26 March 2016 112,963 40,616 40,616 - - Granted - - - 122,385.5 122,385.5 Forfeited (38,889) - - - - Exercised - - - - - Options outstanding at 25 March 2017 74,074 40,616 40,616 122,385.5 122,385.5 Granted - - - - - Forfeited - - - - - Exercised (74,074) - - - - Options outstanding at 31 March 2018 - 40,616 40,616 122,385.5 122,385.5 Core Valuation Assumptions Risk Free Rate 1.39% 0.92% 0.92% 0.09% 0.09% Expected Life (Years) 3 5 5 5 5 Volatility 25% 24% 24% 26% 26% Dividend Yield 0% 0.95% 0.95% 1.73% 1.73%
2017A-TSR 2017A-EPS 2017/B1 2017/B2 2018/B1
Date of grant 7 Aug 2017 7 Aug 2017 7 Aug 2017 14 Aug 2017 23 Jan 2018 Nil price options granted 40,610 40,610 287,963 101,654 19,264 Fair value of each option at date of grant 272p 351p 361p 360p 400p Options outstanding at 25 March 2017 - - - - - Granted 40,610 40,610 287,963 101,654 19,264 Forfeited - - (16,072) - - Exercised - - - - - Options outstanding at 31 March 2018 40,610 40,610 271,891 101,654 19,264 Core Valuation Assumptions Risk Free Rate 0.52% 0.52% 0.25% 0.25% 0.25% Expected Life (Years) 5 5 3 3 3 Volatility 32% 32% 32% 32% 32% Dividend Yield 1.4% 1.4% 1.4% 1.4% 1.4%

No options have lapsed in either period. A total of 561,222 options have been exercised in the year, a further 11,049 options have vested and are eligible to be exercised. (2017: both nil). The options have been satisfied by the issue of new share capital. In the year, £615k has been charged to profit & loss in respect to the share option schemes (2017: £254k). At the end of the year the outstanding share options were valued at £788k (2017: £675k).
11 Taxation
The relationship between the expected tax expense based on the standard rate of corporation tax in the UK of 19% (2017: 20%) and the tax expense actually recognised in the statement of comprehensive income can be reconciled as follows:
Period ended
53 weeks to 31 March
2018
52 weeks to 25 March
2017 £’000 £'000 Current tax expense 44,039 40,186 Deferred tax credit (528) (1,301)
Total tax expense recorded in profit and loss 43,511 38,885
Current tax credit in other comprehensive income (54) - Deferred tax (credit)/expense in other comprehensive income (2,416) (324)
Total tax (credit)/expense recorded in other comprehensive income (2,470) (324)
Result for the year before tax 229,316 182,918 Expected tax charge at the standard tax rate 43,570 36,584 Effect of : Expenses not deductible for tax purposes 2,440 2,615 Income not taxable (2,709) (734) Foreign operations taxed at local rates 790 985 Changes in the rate of corporation tax 55 (1,027) Adjustment in respect of prior years (485) 382 Other (150) 80
Actual tax expense 43,511 38,885
Deferred taxation
Statement of financial position 31 March
2018 25 March
2017 £’000 £'000 Accelerated tax depreciation (4,671) (819) Relating to intangible brand assets (18,339) (17,473) Fair valuing of assets and liabilities (asset) 5,030 607 Fair valuing of assets and liabilities (liability) (1,035) (82) Movement in provision 11 85 Relating to share options 206 98 Held over gains on fixed assets (450) (471) Other temporary differences (asset) 407 34 Other temporary differences (liability) - -
Net deferred tax liability (18,841) (18,021) Deferred tax asset 5,654 824 Deferred tax liability (24,495) (18,845)

Statement of comprehensive income
53 weeks to 31 March
2018
52 weeks to 25 March
2017 £’000 £'000 Accelerated tax depreciation 129 (267) Relating to intangible brand assets 107 802 Fair valuing of assets and liabilities 2,278 1,054 Movement in provision (75) 3 Relating to share options 108 58 Held over gains on fixed assets 21 (68) Other temporary differences 376 43
Net deferred tax credit 2,944 1,625 Total deferred tax in profit or loss 528 1,301 Total deferred tax in other comprehensive income 2,416 324
The Group offsets tax assets and liabilities if and only if it has a legally enforceable right to set off current tax assets and current tax liabilities and the deferred tax assets and deferred tax liabilities relate to income taxes levied by the same tax authority.
12 Earnings per share
Basic earnings per share amounts are calculated by dividing the net profit or loss for the financial period attributable to ordinary equity holders of the parent by the weighted average number of ordinary shares outstanding at each period end. Diluted earnings per share amounts are calculated by dividing the net profit attributable to ordinary equity holders of the parent by the weighted average number of ordinary shares outstanding during each year plus the weighted average number of ordinary shares that would be issued on conversion of any dilutive potential ordinary shares into ordinary shares. Adjusted (and adjusted 52 week) basic and diluted earnings per share are calculated in the same way as above, except using adjusted \ adjusted 52-week profit attributable to ordinary equity holders of the parent, as defined in notes 3 and 4. There are share option schemes in place (see note 10) which have a dilutive effect on both periods presented. The following reflects the income and share data used in the earnings per share computations:
Period ended 31 March 2018
25 March 2017
£’000 £'000
Profit for the period attributable to owners of the parent 185,833 142,926
Adjusted profit for the period attributable to owners of the parent 180,433 148,783
Adjusted 52 week profit for the period attributable to owners of the parent 177,818 148,783
Thousands Thousands
Weighted average number of ordinary shares for basic earnings per share 1,000,353 1,000,000
Effect of dilution:
Employee share options 298 148
Weighted average number of ordinary shares adjusted for the effect of dilution 1,000,651 1,000,148
Pence Pence
Basic earnings per share 18.6 14.3
Diluted earnings per share 18.6 14.3
Adjusted basic earnings per share 18.0 14.9
Adjusted diluted earnings per share 18.0 14.9
Adjusted 52 week basic earnings per share 17.8 14.9

Adjusted 52 week basic earnings per share 17.8 14.9
13 Investments in associates
Period ended 31 March
2018 25 March
2017 £’000 £'000 Net book value Carrying value at the start of the period 5,669 3,995 Dividends received (1,149) - Share of profits in associates since the prior year valuation exercise 1,919 1,005 Impairment of holding in Home Focus Group (208) - Sale of 20% holding in Home Focus Group (310) - Effect of foreign exchange on translation (781) 669
Carrying value at the end of the period 5,140 5,669
The Group has a 50% (2017: 50%) interest in Multi-lines International Company Ltd, a company incorporated in Hong Kong. The principal activity of the company is the purchase and sale of goods. The Group also holds 20% (2017: 40%) of the ordinary share capital of Home Focus Group Ltd, a company incorporated in Republic of Ireland and whose principal activity is retail sales. Neither entity has discontinued operations or other comprehensive income, except that on consolidation both entities have a foreign exchange translation difference. During the year the Group sold 20% of the holding in Home Focus Group for €350k. The remaining 20% holding is also subject to a contract of sale in December 2020 for the same amount, therefore the remaining stake was revalued to €350k with a resulting impairment which has been recognised in profit and loss. Home Focus is considered immaterial for further disclosure.
Period ended 31 March
2018 25 March
2017 £’000 £'000 Multi-lines Non-current assets 1,106 1,409 Current assets 36,004 36,109 Non-current liabilities - - Current liabilities (25,555) (26,010)
Net assets 11,555 11,508
Revenue 169,244 128,976 Profit 3,805 2,767
The figures for Multi-lines show 12 months to December 2017 (2017: 12 months to December 2016), being the period used in the valuation of the associate.

14 Intangible assets Goodwill Software Brands Other Total £'000 £'000 £'000 £’000 £'000 Cost or valuation At 27 March 2016 837,450 3,123 98,396 1,363 940,332 Additions due to purchase of Knüller 1,322 - - - 1,322 Additions - 1,596 1,200 - 2,796 Disposals - (132) - - (132) Effect of retranslation 2,919 33 451 131 3,534
At 25 March 2017 841,691 4,620 100,047 1,494 947,852 Additions due to purchase of Heron 87,580 1,305 14,178 - 103,063 Additions - 1,612 1,750 - 3,362 Disposals - (289) - - (289) Effect of retranslation 447 3 68 20 538
At 31 March 2018 929,718 7,251 116,043 1,514 1,054,526 Accumulated amortisation / impairment At 27 March 2016 - 963 - 745 1,708 Charge for the year - 574 - 220 794 Disposals - (132) - - (132) Effect of retranslation - 20 - 78 98
At 25 March 2017 - 1,425 - 1,043 2,468 Charge for the year - 1,436 13 203 1,652 Disposals - (289) - - (289) Effect of retranslation - 3 - 12 15
At 31 March 2018 - 2,575 13 1,258 3,846
Net book value at 31 March 2018 929,718 4,676 116,030 256 1,050,680
Net book value at 25 March 2017 841,691 3,195 100,047 451 945,384
Impairment review of intangible assets held with indefinite life The Group holds the following assets with indefinite life:
Segment 31 March
2018 31 March
2018 25 March
2017 25 March
2017 Goodwill Brand Goodwill Brand £’000 £’000 £’000 £’000 UK B&M 807,496 95,650 807,496 94,900 UK Heron 87,533 14,178 - - Germany retail 34,642 5,215 34,195 5,147
Not all items in the brand classification have indefinite life as some are time limited. The brand intangible assets that have been identified as having indefinite life are designated as such as management believe that these assets will hold their value for an indefinite period of time. In each case the goodwill and brand assets have been allocated to one group of CGUs, being the store estate within the specific segment to which those assets relate. The UK Heron assets are a new addition in the year (2017: Germany acquired assets of a small chain of stores, increasing their goodwill balance) see note 7 for more details. The Group performs impairment tests at each period end. The impairment test involves assessing the net present value (NPV) of the expected cash flows in relation to the stores within each CGU according to a number of assumptions to calculate the value in use (VIU) for the group of CGUs. The German balances are held in Euros, the underlying balances being €39.5m for Goodwill and €6.0m for the brands (2017: same). Since the cashflows that support the carrying values are also primarily in Euros, the impairment test for the German retail segment has been carried out in that currency.

In each case, the results of the impairment tests identified that the VIU was significantly in excess of the carrying value of assets within the group of CGUs at the period end dates. No indicators of impairment were noted. The key assumptions used were
(i) The Group’s discount rate, calculated via an internal model. (ii) The inflation rate for expenses, which has been based upon the consumer price index for the
relevant country. (iii) The like for like sales growth, a prudent estimate made by management.
The values for the assumptions were:
As at 31 March
2018 25 March
2017 Discount rate (B&M) 10.7% 8.0% Discount rate (Heron) 11.5% N/A Discount rate (Germany) 13.2% 8.0% Inflation rate for expenses (UK) 3.6% 2.3% Inflation rate for expenses (Germany) 1.7% 1.6% Like for like sales growth (B&M) 2.0% 3.0% Like for like sales growth (Heron) 3.0% N/A Like for like sales growth (Germany) 2.0% 2.5%
These assumptions are held for five years in the forecast and then a perpetuity is performed over the year five figures, effectively assuming no further like for like growth, or inflation after that point. In order to demonstrate the sensitivity of the assumptions, it was calculated that the Group would first be required to recognise an impairment at (all other assumptions being held equal); UK B&M UK Heron Germany
31 March
2018 25 March
2017 31 March
2018 25 March
2017 31 March
2018 25 March
2017 Discount rate 46.1% 45.6% 34.5% N/A 88.8% >100% Inflation rate for expenses 17.6% 19.8% 14.1% N/A 18.8% 22.8% Like for like sales (6.8)% (8.5)% (4.3)% N/A (9.5)% (11.9)%

15 Property, plant & equipment
Land and buildings Motor vehicles
Plant, fixtures and equipment Total
£'000 £'000 £'000 £'000 Cost or valuation At 27 March 2016 34,750 3,525 142,982 181,257 Acquisition of Knüller - - 42 42 Additions 7,971 681 40,508 49,160 Remeasurement of finance leases 2,539 - - 2,539 Disposals (847) (758) (547) (2,152) Effect of retranslation 1,837 37 925 2,799
At 25 March 2017 46,250 3,485 183,910 233,645 Acquisition of Heron 31,388 5,787 30,124 67,299 Additions 58,097 4,493 48,678 111,268 Disposals (506) (1,313) (4,180) (5,999) Effect of retranslation 306 5 164 475
At 31 March 2018 135,535 12,457 258,696 406,688 Accumulated depreciation At 27 March 2016 8,523 1,550 33,134 43,207 Charge for the period 3,941 694 20,586 25,221 Disposals (26) (457) (531) (1,014) Effect of retranslation 247 9 227 483
At 25 March 2017 12,685 1,796 53,416 67,897 Charge for the period 4,607 1,559 29,065 35,231 Disposals (181) (1,106) (3,880) (5,167) Effect of retranslation 41 2 31 74
At 31 March 2018 17,152 2,251 78,632 98,035
Net book value at 31 March 2018 118,383 10,206 180,064 308,653
Net book value at 25 March 2017 33,565 1,689 130,494 165,748
The carrying value of assets held under finance lease and hire purchase contracts at 31 March 2018 was £7.5m (2017: £6.7m) and total depreciation charged on these assets during the period was £1.0m (2017: £0.9m). The assets held under hire purchase contracts are pledged as security for the related finance lease and hire purchase liabilities. Under the terms of the loan and notes facilities in place at 31 March 2018, fixed and floating charges were held over £99.6m of the net book value of land and buildings, £9.7m of the net book value of motor vehicles and £167.5m of the net book value of the plant, fixtures and equipment. (2017: £13.8m, £1.4m, £119.7m respectively). A significant addition was made to the land & buildings category in relation to the southern warehouse. At the year end the balance in relation to this stood at £55.0m (2017: £nil). The warehouse is undergoing a building phase and has not yet been brought into use and is therefore not yet depreciated. The intention is that the asset will undergo a sale & leaseback process near to or at completion. A further £0.5m of assets in the Land & Buildings category relates to other assets under construction (2017: £nil). Included within land and buildings is land with a cost of £62.6m (2017: £2.3m) which is not depreciated.
16 Inventories
As at 31 March
2018 25 March
2017 £'000 £’000 Goods for resale 558,690 462,119

Included in the amount above was a net charge of £1.3m related to inventory provisions (2017: £3.5m net charge). In the period to 31 March 2018 £2,031m (2017: £1,595m) was recognised as an expense for inventories.
17 Trade and other receivables
31 March
2018 25 March
2017 £’000 £’000 Non-current Lease premiums 2,150 2,413 Favourable leases 1,037 -
3,187 2,413
Current Trade receivables 3,221 3,447 Deposits on account 1,575 6,451 Provision for impairment (160) (18)
Net trade receivables to non-related parties 4,636 9,880 Prepayments 27,165 23,525 Related party receivables 410 1,335 Lease premiums 324 567 Favourable leases 183 - Other receivables 1,324 91
34,042 35,398
Trade receivables are stated initially at their fair value and then at amortised cost as reduced by appropriate allowances for estimated irrecoverable amounts. The carrying amount is determined by the directors to be a reasonable approximation of fair value. The following table sets out an analysis of provisions for impairment of trade and other receivables:
Period ended 31 March
2018 25 March
2017 £’000 £’000 Provision for impairment at the start of the period (18) (51) Impairment during the period (145) (17) Utilised/released during the period 3 50
Balance at the period end (160) (18)
Trade receivables are non-interest bearing and are generally on terms of 30 days or less.
There were no significant balances within debtors at either March 2018 or March 2017 and as such there is no specific concentration of credit risk.
The following table sets out a maturity analysis of trade receivables, including those which are past due but not impaired:
As at 31 March
2018 25 March
2017 £’000 £’000 Neither past due nor impaired 2,086 2,873 Past due less than one month 651 452 Past due between one and three months 230 93 Past due for longer than three months 254 29
Balance at the period end 3,221 3,447

18 Cash and cash equivalents
As at 31 March
2018 25 March
2017 £’000 £'000 Cash at bank and in hand 90,816 155,551 Overdrafts (6,112) -
Cash and cash equivalents 84,704 155,551
As at 31 March 2018 the Group had available £89.0m of undrawn committed borrowing facilities (2017: £128.7m).
19 Trade and other payables
As at 31 March
2018 25 March
2017 £’000 £’000 Non-current Accruals 250 897 Reverse lease premium 78,859 76,064 Unfavourable leases 8,021 -
87,130 76,961
Current Trade payables 264,224 199,901 Other tax and social security payments 7,845 1,869 Accruals and deferred income 28,251 39,832 Reverse lease premium 14,446 10,791 Unfavourable leases 1,165 - Related party trade payables 12,345 6,472 Other payables 7,796 8,950
336,072 267,815
Trade payables are generally on 30 day terms and are not interest bearing. The carrying value of trade payables approximates to their fair value. For further details on the related party trade payables, see note 28.
20 Other financial assets and liabilities
Other financial assets
As at 31 March
2018 25 March
2017 £’000 £'000
Current financial assets at fair value through profit and loss: Foreign exchange forward contracts - 61 Fuel swap contracts - 232 Current financial assets at fair value through other comprehensive income: Foreign exchange forward contracts - 117
Total current other financial assets - 410
Total other financial assets - 410
Financial assets through profit or loss reflect the fair value of those derivatives that are not designated as hedge relationships but are nevertheless intended to reduce the level of risk for expected sales and purchases.

Other financial liabilities
As at 31 March
2018 25 March
2017 £’000 £'000 Non-current financial liabilities at fair value through profit and loss: Put/call options over the non-controlling interest of Jawoll 8,076 17,886 Deferred consideration in relation to the purchase of Heron 11,133 -
Total non-current other financial liabilities 19,209 17,886
Current financial liabilities at fair value through profit and loss: Foreign exchange forward contracts 923 287 Current financial liabilities at fair value through other comprehensive income: Foreign exchange forward contracts 15,743 1,783
Total current other financial liabilities 16,666 2,070
Total other financial liabilities 35,875 19,956
The put/call options over the non-controlling interest in Jawoll arose as part of the acquisition of the entity. The valuation at year end reflects management’s latest projections for the final amount to be exchanged at the year end foreign exchange rate. The option matures in 2019 and the carrying value has been discounted to present value.
The deferred consideration relates to the acquisition of Heron. The valuation at year end reflects management’s expectation that the full amount of £12.8m will be payable in 2019. The carrying value has been discounted to present value.
The other financial liabilities through profit or loss reflect the fair value of those foreign exchange forward contracts that are not designated as hedge relationships but are nevertheless intended to reduce the level of risk for expected sales and purchases.
Fair value hierarchy
The Group uses the following hierarchy for determining and disclosing the fair value of financial instruments by valuation technique:
Level 1: quoted (unadjusted) prices in active markets for identical assets or liabilities.
Level 2: other techniques for which all inputs which have a significant effect on the recorded fair value are observable, either directly or indirectly.
Level 3: techniques which use inputs that have a significant effect on the recorded fair value that are not based on observable market data.
As at the reporting dates, the Group held the following financial instruments carried at fair value on the balance sheet:
Total Level 1 Level 2 Level 3
£’000 £’000 £’000 £’000 31 March 2018 Foreign exchange contracts (16,666) - (16,666) - Put/call options on Jawoll non-controlling interest (8,076) - - (8,076) Deferred Consideration in relation to Heron (11,133) - - (11,133) 25 March 2017 Foreign exchange contracts (1,892) - (1,892) - Fuel swap contract 232 - 232 - Put/call options on Jawoll non-controlling interest (17,886) - - (17,886)

The put/call option and deferred consideration were valued with reference to the sale and purchase agreements underpinning the relevant acquisition. The key variable in determining the fair value of these balances is the forecast EBITDA, respectively of Jawoll and Heron, as prepared by management.
The movement in the valuation of the call/put option reconciles as follows:
Period ended
53 weeks to 31 March
2018
52 weeks to 25 March
2017 £’000 £'000 Opening value 17,886 16,041 Unwinding of the call/put option valuation 1,459 1,573 Adjustment to the valuation of the call/put option (11,568) (1,279) Effect of foreign exchange 299 1,551
Closing value 8,076 17,886
As the valuation is a multiple of German EBITDA, it is sensitive to the movement in the projection of this value and a 5% movement in EBITDA would therefore effect a 5% change in the valuation.
The valuation is also sensitive to the Group discount rate. As an indication the sensitivities (all other inputs being held equal) to a change in the year end discount rates are as follows:
As at Change in discount rate
31 March
2018
25 March
2017
£’000 £’000
Effect on profit before tax +50bps 61 160
-50bps (62) (162)
The movement in the valuation of deferred consideration reconciles as follows:
Period ended
53 weeks to 31 March
2018
52 weeks to 25 March
2017 £’000 £'000 Opening value - - Recognised on acquisition of Heron 10,422 - Unwinding of the deferred consideration balance 711 -
Closing value 11,133 -
The balance is not considered sensitive to the main valuation input of Heron’s EBITDA, since a 5% increase or decrease in management’s estimate would not change the value recognised. The discount rate used is that considered to be fair at the acquisition date. If it were it to move by 0.5% the effects would be:
As at Change in discount rate
31 March
2018
25 March
2017
£’000 £’000
Effect on profit before tax +50bps 78 -
-50bps (65) -
The other instruments have been valued by the issuing bank, using a mark to market method. The bank has used various inputs to compute the valuations and these include inter alia the relevant maturity date and strike rates, the current exchange rate, fuel prices and LIBOR levels.

21 Financial liabilities – borrowings
As at 31 March
2018 25 March
2017 £’000 £'000 Current Revolving facility bank loan 45,000 - Heron loan facilities – Melton 807 - Heron loan facilities – Offset 605 Heron loan facilities – Term 800 -
47,212 -
Non-current High yield bond notes 247,558 246,815 Term facility bank loans 297,288 296,910 Heron loan facilities – Melton 5,243 - Heron loan facilities – Offset 3,967 - Heron loan facilities – Term 4,370 -
558,426 543,725
The Group refinanced during the prior year, repaying the previous loan facilities, totalling £440.0m, and replacing them with a new loan facility of £300.0m and high yield bond notes released by the parent entity of £250.0m. Details of maturities and interest rates are included in the table below. The term facility bank loans and high yield bond notes are held at amortised cost and were initially capitalised in February 2017 with £3.2m and £3.3m (respectively) of fees attributed to them. The Heron loan facilities were brought into the Group as part of the acquired balance sheet on 2 August 2017. All are held with Handelsbanken and are carried at their gross cash amount. Further details are in the maturity table below. The maturities of the loan facilities and finance leases (also see note 25) are as follows.
Interest rate Maturity
31 March 2018
25 March 2017
% £’000 £’000 Finance leases 1.2-7.0% 2018-37 9,176 7,463 Revolving facility loan 2.00% + LIBOR Apr-18 45,000 - Term facility bank loan A 2.25% + LIBOR Jul-21 - 300,000 Term facility bank loan A 2.00% + LIBOR Jul-21 300,000 - High yield bond notes 4.125% Feb-22 250,000 250,000 Heron loan facilities – Melton 2.25% + LIBOR Jul-25 6,050 - Heron loan facilities – Offset 2.45% + LIBOR Sep-22 4,572 - Heron loan facilities – Term 2.50% + LIBOR Dec-21 5,170 -
619,968 557,463
Term loan A and the high yield bond notes have carrying values which include transaction fees allocated on inception.

22 Provisions
Property
provisions £’000
Other £’000
Total £’000
At 27 March 2016 2,602 4,214 6,816 Provided in the period 1,367 2,770 4,137 Utilised during the period (374) (1,857) (2,231) Released during the period (1,855) (1,092) (2,947) Effect of retranslation 16 - 16
At 25 March 2017 1,756 4,035 5,791 Brought in on acquisition of Heron 1,538 - 1,538 Provided in the period 1,280 2,264 3,544 Utilised during the period (1,198) (1,807) (3,005) Released during the period (538) (31) (569) Effect of retranslation 3 - 3
At 31 March 2018 2,841 4,461 7,302 Current liabilities 2018 2,462 4,461 6,923 Non-current liabilities 2018 379 - 379 Current liabilities 2017 834 4,035 4,869 Non-current liabilities 2017 922 - 922
The property provision relates to the expected future costs on specific leasehold properties. This is inclusive of onerous leases and dilapidations on these properties. The timing in relation to utilisation is dependent upon the individual lease terms. The other provisions principally relate to disputes concerning insurance liability claims. A prudent amount has been set aside for each claim as per legal advice received by the Group. These claims are individually non-significant and average £8.4k per claim (£8.3k in 2017).
23 Share capital
As at 31 March
2018 25 March
2017 Allotted, called up and fully paid £’000 £'000 B&M European Value Retail S.A. 1,000,561,222 ordinary shares of 10p each (2017: 1,000,000,000) 100,056 100,000
100,056 100,000
Ordinary shares Each ordinary share ranks pari passu with each other ordinary share and each share carries one vote. The Group parent is authorised to release up to a maximum of 2,971,661,000 (2017: 2,972,222,222) ordinary shares. B&M European Value Retail S.A. has released 561,222 shares during the period in relation to exercised employee and director share options, see note 10.

24 Cash generated from operations
Period ended
53 weeks ended 31 March
2018
52 weeks ended 25 March
2017 £'000 £'000
Profit before tax 229,316 182,918
Adjustments for:
Net interest expense 12,198 22,590
Depreciation 35,231 25,221
Amortisation of intangible assets 1,652 794
Profit on remeasurement of finance leases - (317)
Loss / (profit) on disposal of property, plant and equipment 277 (405)
Loss on share options 615 254
Change in inventories (79,099) (99,662)
Change in trade and other receivables (1,168) (6,666)
Change in trade and other payables 39,377 84,575
Change in provisions 1,511 (1,042)
Share of profit from associates (1,711) (1,005)
Non-cash foreign exchange effect from retranslation of subsidiary cashflows (31) 249
Loss resulting from fair value of financial derivatives 3,825 3,369
Cash generated from operations 241,993 210,873
25 Commitments
Operating leases The vast majority of the Group’s operating lease commitments relate to the property comprising its store network. At the year-end over 95% of these leases expire in the next 15 years (2017: >95%) The leases are separately negotiated and no subgroup is considered to be individually significant nor to contain individually significant terms. The Group was not subject to non-trivial contingent rent agreements at the year end date. The following table sets out the total future minimum lease payments under non-cancellable operating leases, taking account of lease premiums.
As at 31 March
2018 25 March
2017 £’000 £'000 Not later than one year 154,508 133,696 Later than one year and not later than five years 554,293 484,814 Later than five years 548,974 494,478
1,257,775 1,112,988
The lease and sublease payments recognised as an expense in the periods were as follows:
As at 31 March
2018 25 March
2017 £’000 £'000
Lease payments 150,512 127,369 Sublease receipts (1,043) (571)
149,469 126,798

Finance leases All of the Group’s finance leases related to buildings used in the operation of the German and UK Heron businesses. Future minimum lease payments under finance leases and hire purchase contracts together with the present value of the net minimum lease payments are as follows: As at 31 March 2018 25 March 2017
Minimum payments
PV of minimum payments
Minimum payments
PV of minimum payments
£'000 £'000 £'000 £'000 Not later than one year 2,121 1,870 1,227 994 Later than one year and not later than five years 6,507 6,047 4,791 4,227 Later than five years 1,260 1,259 2,295 2,242
9,888 9,176 8,313 7,463
Capital commitments There were £44.1m of contractual capital commitments not provided within the Group financial statements as at 31 March 2018 (2017: £3.5m). This figure includes an estimated £40.7m in relation to the build and fit out of the southern warehouse which, whilst the majority is not yet committed, is considered very likely to be incurred. The southern warehouse is expected to undergo a sale & leaseback around the date of completion.
26 Group information and ultimate parent undertaking
The financial results of the Group include the following entities.
Company name Country Date of incorporation
Percent held within the Group Principal activity
B&M European Value Retail S.A. Luxembourg May 2014 Parent Holding company B&M European Value Retail 1 S.à r.l. Luxembourg November 2012 100% Holding company Bedford DC Investment Ltd Jersey June 2017 100% Property development B&M European Value Retail Holdco 1 Ltd UK December 2012 100% Holding company B&M European Value Retail Holdco 2 Ltd UK December 2012 100% Holding company B&M European Value Retail Holdco 3 Ltd UK November 2012 100% Holding company B&M European Value Retail Holdco 4 Ltd UK November 2012 100% Holding company B&M European Value Retail 2 S.à r.l. Luxembourg September 2012 100% Holding company EV Retail Limited UK September 1996 100% Holding company B&M Retail Limited UK March 1978 100% General retail Opus Homewares Limited UK April 2003 100% Dormant Retail Industry Apprenticeships Ltd UK June 2017 100% Employment services Heron Food Group Ltd UK August 2002 100% Holding company Heron Foods Ltd UK October 1978 100% Convenience retail Cooltrader Ltd UK September 2012 100% Dormant Heron Properties (Hull) Ltd UK February 2003 100% Dormant B&M European Value Retail Germany GmbH Germany November 2013 100% Holding company J.A. Woll Handels GmbH Germany November 1987 80% General retail Jawoll Vertriebs GmbH I Germany September 2007 80% General retail
Changes during the year The Group acquired four businesses comprising the Heron Food Group as detailed in note 7. Retail Industry Apprenticeships Ltd and Bedford DC Investment Ltd were incorporated and are fully owned by the Group. BestFlora was fully incorporated into the other Germany entities and disposed of. Also see the associates section below. Changes during the prior year Meltore Limited, previously a dormant 100% owned subsidiary of EV Retail Limited, has been disposed of and is no longer a member of the Group. Jawoll acquired the non-controlling interest in BestFlora GmbH, and now owns 100% (previously 75%) of that entity (the percent held within the group increased from 60% to 80%). Neither of these transactions has had nor will have significant accounting effects for the Group.

Associates
The Group has a 50% interest in Multi-lines International Company Limited, a company incorporated in Hong Kong and a 20% (40% prior to December 2017) interest in Home Focus Group Limited, a company incorporated in the Republic of Ireland following the acquisition of SBR Europe on 6 March 2013. The share of profit/loss from the associates is included in the statement of comprehensive income, see note 13. Ultimate parent undertaking The directors of the Group consider the parent and the ultimate controlling related party of this Group to be B&M European Value Retail SA, registered in Luxembourg.
27 Financial risk management
The Group uses various financial instruments, including bank loans, related party loans, finance company loans, cash, equity investment, derivatives and various items, such as trade receivables and trade payables that arise directly from its operations. The main risks arising from the Group's financial instruments are market risk, currency risk, cash flow interest rate risk, credit risk and liquidity risk. The directors review and agree policies for managing each of these risks and they are summarised below. The existence of these financial instruments exposes the Group to a number of financial risks, which are described in more detail below. In order to manage the Group's exposure to those risks, in particular the Group's exposure to currency risk, the Group enters into forward foreign currency contracts. No transactions in derivatives are undertaken of a speculative nature.
Market risk
Market risk encompasses three types of risk, being currency risk, fair value interest rate risk and commodity price risk. Commodity price risk is not considered material to the business as the Group is able to pass on pricing changes to its customers. Despite the impact of price risk not being considered material, the Group has previously engaged in swap contracts over the cost of fuel in order to minimise the impact of any volatility. The sensitivity to these contracts for a reasonable change in the year end fuel price is as follows
As at Change in fuel price
31 March
2018
25 March
2017
£’000 £’000
Effect on profit before tax +5% - 159
-5% - (151)
This has been calculated by taking the spot price of fuel at the year end, applying the change indicated in the table, and projecting this over the life of the contract assuming all other variables remain equal. The Group's policies for managing fair value interest rate risk are considered along with those for managing cash flow interest rate risk and are set out in the subsection entitled "interest rate risk" below.
Currency risk
The Group is exposed to translation and transaction foreign exchange risk arising from exchange rate fluctuation on its purchases from overseas suppliers. In relation to translation risk, this is not considered material to the business as amounts owed in foreign currency are short term of up to 30 days and are of a relatively modest nature. Transaction exposures, including those associated with forecast transactions, are hedged when known, principally using forward currency contracts.

All of the Group's sales are to customers in the UK and Germany and there is no currency exposure in this respect. A proportion of the Group's purchases are priced in US Dollars and the Group generally uses forward currency contracts to minimise the risk associated with that exposure.
Foreign currency sensitivity
The following table demonstrates the sensitivity to a reasonably possible change in US Dollar period end exchange rates with all other variables held constant.
The impact on the Group’s profit before tax and other comprehensive income (net of tax) is largely due to changes in the fair value of our foreign exchange derivatives and revaluation of creditors and deposits held on account with our US Dollar suppliers.
As at Change in USD rate
31 March
2018
25 March
2017
£’000 £’000
Effect on profit before tax +2.5% (588) (885)
-2.5% 618 931
Effect on other comprehensive income +2.5% (10,150) (9,403)
-2.5% 10,671 7,919
The following table demonstrates the sensitivity (net of tax) to a reasonably possible change in the Euro period end exchange rates with all other variables held constant. The effect on other comprehensive income is due to the foreign exchange reserve on retranslation of the Group’s subsidiaries that have the Euro as a functional currency.
As at Change in Euro rate
31 March
2018
25 March
2017
£’000 £’000
Effect on profit before tax +2.5% 18 (4)
-2.5% (19) 9
Effect on other comprehensive income +2.5% (2,012) (1,997)
-2.5% 2,115 2,101
These calculations have been performed by taking the year end translation rate used on the accounts and applying the change noted above. The balance sheet valuations are then directly calculated. The valuation of the foreign exchange derivatives are projected based upon the spot rate changing and all other variables being held equal.
Interest rate risk Interest rate risk is the risk of variability of the Group cash flows due to changes in the interest rate. The Group is exposed to changes in interest rates as the Group’s bank borrowings are subject to a floating rate based on LIBOR.
The Group’s interest rate risk arises mainly from long-term borrowings. Borrowings issued at variable rates expose the Group to cash flow interest rate risk. The Group’s exposure to interest rate fluctuations is not considered to be material, however the Group has in the past used interest rate swaps to minimise the impact.
If LIBOR interest rates had been 50 basis points higher/lower throughout the year with all other variables held constant, the effect upon calculated pre-tax profit for the year would have been:
As at Basis point increase /
decrease
31 March
2018
25 March
2017
£’000 £’000

Effect on profit before tax +50 (1,716) (1,891)
-50 1,716 1,891
This sensitivity has been calculated by changing the interest rate for each interest payment and accrual made by the Group over the period, by the amount specified in the table above, and then calculating the difference that would have been required. Credit risk Credit risk is the risk that a counterparty will not meet its obligations under a financial instrument or customer contract, leading to a financial loss. The Group's principal financial assets are cash and trade receivables. The credit risk associated with cash is limited as the main counterparty is a UK clearing bank with a high credit rating (A- long term and A-1 short term (standard & poor), (2017: A, A-2 respectively). The principal credit risk arises therefore from the Group's trade receivables. Credit risk is further limited by the fact that the vast majority of sales transactions are made through the store registers, direct from the customer at the point of purchase, leading to a low trade receivables balance.
In order to manage credit risk, the directors set limits for customers based on a combination of payment history and third party credit references. Credit limits are reviewed by the credit controller on a regular basis in conjunction with debt ageing and collection history. Provisions against bad debts are made where appropriate.
Liquidity risk
Any impact on available cash and therefore the liquidity of the Group could have a material effect on the business as a result.
The Group’s borrowings are subject to quarterly banking covenants against which the Group has had significant headroom to date with no anticipated issues based upon forecasts made. Short term flexibility is achieved via the Group’s rolling credit facility. The following table shows the liquidity risk maturity of financial liabilities grouping based on their remaining period at the balance sheet date. The amounts disclosed are the contractual undiscounted cash flows:
Within 1 year Between 1 and 2 years
Between 2 and 5 years
More than 5 years
Total
£’000 £’000 £’000 £’000 £’000
31 March 2018
Interest bearing loans 66,273 21,109 587,778 2,099 677,259
Forward foreign exchange contracts 16,666 - - - 16,666
Trade Payables 276,570 - - - 276,570
Call/put option (Jawoll) - 9,637 - - 9,637
Deferred consideration (Heron) - 12,800 - - 12,800
25 March 2017
Interest bearing loans 19,433 19,433 603,738 - 642,603
Forward foreign exchange contracts 2,070 - - - 2,070
Trade payables 206,373 - - - 206,373
Call/put option (Jawoll) - 20,862 - - 20,862

Fair value
The fair value of the financial assets and liabilities of the group are not materially different from their carrying value. Refer to the table below. These all represent financial assets and liabilities measured at amortised cost except where stated as measured at fair value through the profit and loss.
As at
31 March
2018
25 March
2017
Financial assets £’000 £’000
Fair value through profit and loss
Forward foreign exchange contracts - 61
Fuel price swap - 232
Fair value through other comprehensive income
Forward foreign exchange contracts - 117
Loans and receivables
Cash and cash equivalents 90,816 155,551
Trade receivables 5,046 11,215
Other receivables 1,324 91
Financial liabilities
Fair value through profit and loss
Forward foreign exchange contracts 923 287
Put/call options over the non-controlling interest of Jawoll 8,076 17,886
Deferred consideration in relation to the purchase of Heron 11,133 -
Fair value through other comprehensive income
Forward foreign exchange contracts 15,743 1,783
Amortised cost
Overdraft 6,112 -
Interest-bearing loans and borrowings 603,426 543,725
Trade payables 276,569 206,373
Other payables 7,796 8,950
28 Related party transactions
The Group has transacted with the following related parties over the periods:
Multi-lines International Company Limited, a supplier, and Home Focus Group, a customer, have been associates of the Group since March 2013.
Ropley Properties Ltd, Triple Jersey Ltd, TJL UK Ltd, Rani Investments and Multi Lines International (Properties) Ltd, all landlords of properties occupied by the group, are directly or indirectly owned by director Simon Arora, his family, or his family trusts (together, the Arora related parties). David Heuck, a director of Heron is the landlord of a property occupied by the Group (Comprising the Heron related parties). Jawoll Immobilien GmbH, Stern Grundstück Entwicklungs GmbH, DS Grundstücks GmbH and Silke Stern are all landlords of properties occupied by the Group and are related by virtue of connection to a shareholder of J.A.Woll-Handels GmbH (together, the German related parties). Some of these are held under finance lease, as detailed below. The following table sets out the total amount of trading transactions with related parties included in the statement of comprehensive income, including the P&L impact of any finance leases;

Period ended
31 March 2018
£’000
25 March 2017
£'000 Sales to associates of the Group Home Focus Group Limited 2,408 2,503
Total sales to related parties 2,408 2,503
Purchases from associates of the Group Multi-lines International Company Ltd 146,360 121,351
Purchases from parties related to key management personnel
Multi-Lines International (Properties) Ltd 151 154
David Heuck 28 -
DS Grundstücks GmbH 794 759
Jawoll Immobilien GmbH 550 524
Rani Investments 194 192 Ropley Properties Ltd 2,976 2,811 Silke Stern 157 148
Stern Grundstück Entwicklungs 620 591 TJL UK Ltd 675 42 Triple Jersey Ltd 12,666 10,250
Total purchases from related parties 165,171 136,822
Included in the current year figures above are 6 leases of new stores and 2 renewals of existing stores, entered into by Group companies during the current period with the Arora related parties (2017: 6 new, or extensions to existing, leases and no renewals). The total expense on these leases in the period was £1,778k (2017: £763k). There were also 4 conditionally exchanged leases with Arora related parties in the current period with long stop completion dates (2017: 2), and no expense is incurred under them until they are completed. The following table sets out the total amount of trading balances with related parties outstanding at the period end. Note that the receivables balance held with Multi-lines International is with our German operation (a deposit on account) and the payables balance is with our UK operation.
As at
31 March 2018
£’000
25 March 2017
£’000 Trade receivables from associates of the Group Home Focus Group Ltd 316 706 Multi-lines International Company Ltd 94 629
Total related party trade receivables 410 1,335
Trade payables to associates of the Group Multi-lines International Company Ltd 9,680 3,385 Trade payables to companies owned by key management personnel Rani Investments 40 - Ropley Properties Ltd 643 850 TJL UK Ltd 3 85 Triple Jersey Ltd 1,979 2,152
Total related party trade payables 12,345 6,472
Outstanding trade balances at the balance sheet dates are unsecured and interest free and settlement occurs in cash. There have been no guarantees provided or received for any related party trade receivables or payables.
The business has not recorded any impairment of trade receivables relating to amounts owed by related parties at 31 March 2018 (2017: no impairment). This assessment is undertaken each year through examining the financial position of the related party and the market in which the related party operates. The future operating lease commitments on the Arora related party properties are;

As at 31 March
2018 25 March
2017 £’000 £'000
Not later than one year 16,308 14,544 Later than one year and not later than five years 65,565 57,704 Later than five years 85,934 76,341
167,807 148,589
The future operating lease commitments on the German related party properties are;
As at 31 March
2018 25 March
2017 £’000 £'000 Not later than one year 877 578 Later than one year and not later than five years 2,438 561 Later than five years - -
3,315 1,139
The future operating lease commitments on the Heron related party properties are;
As at 31 March
2018 25 March
2017 £’000 £'000 Not later than one year 43 - Later than one year and not later than five years 170 - Later than five years 397 -
610 -
The balances remaining on the finance lease asset and liabilities at each year end is as follows:
As at
31 March 2018
£’000
25 March 2017
£'000 Finance lease assets from parties related to key management personnel
DS Grundstücks GmbH 2,084 2,386
Jawoll Immobilien GmbH 1,020 1,161 Silke Stern 497 632
Stern Grundstück Entwicklungs 2,213 2,520
Total assets held under finance lease from related parties 5,814 6,699
Finance lease liabilities with parties related to key management personnel
DS Grundstücks GmbH 2,262 2,531
Jawoll Immobilien GmbH 1,170 1,332 Silke Stern 577 733
Stern Grundstück Entwicklungs 2,410 2,707
Total finance lease liabilities held with related parties 6,419 7,303
All related party finance leases are on properties occupied by the German business. During the prior year six of these properties were extended, resulting in a profit of £317k on remeasurement. The Group disposed of part of the holding in Home Focus Group during the year, and received dividends from Multi-Lines International Company Limited. See note 13 for further information on the Group’s associates.
For further details on the transactions with key management personnel, see note 9 and the remuneration report.

29 Non-controlling interest
Non-controlling interest balances are valued on acquisition as a proportion of the fair value of net assets to which the non-controlling interest relates. Post acquisition the non-controlling interest is valued as the original value plus/minus the comprehensive income/loss owed to the non-controlling interest and minus any dividend paid to the non-controlling interest. There exists a non-controlling interest in Jawoll, an 80% subsidiary of B&M European Value Retail Germany GmbH, which was created on purchase of that company in April 2014. The percentage has not changed over the period of ownership. In the 53 weeks to 31 March 2018, £119k has been accrued to the non-controlling interest in Jawoll (52 weeks 2017: £2,082k), and no dividends have been paid (2017: no dividends). The summarised financial information of the subsidiary is as follows:
Period ended 31 March
2018 £’000
Period ended 25 March
2017 £’000
Revenue 200,306 178,395 EBITDA 5,621 11,677 Profit after tax 859 5,908 Net cashflow 4,240 (3,586)
As at
31 March 2018
£’000
25 March 2017
£’000 Non-current assets 38,756 38,062 Current assets 54,961 55,334 Non-current liabilities (7,357) (9,248) Current liabilities (20,310) (19,026)
Net assets 66,050 65,122
There previously existed an additional non-controlling interest in BestFlora GmbH, which was a 75% subsidiary of Jawoll at the start of the prior year. This company was incorporated into the group in April 2014. In December 2016 Jawoll purchased the remaining 25% share and therefore this additional non-controlling interest no longer exists. During the prior year £nil was accrued to this non-controlling interest and £nil was paid out in dividends. Jawoll bought out the non-controlling interest for €210k, when it had a book value on the Group accounts of €476k. There was therefore a profit recognised in reserves of €266k, which has translated to £224k for these accounts. The effects of this transaction can be seen in the Statement of Changes in Equity. BestFlora is considered immaterial for further disclosure.
30 Capital management
For the purpose of the Group’s capital management, capital includes issued capital and all other equity reserves attributable to the equity holders of the parent. The primary objective of the Group’s capital management is to maximise the shareholder value. In order to achieve this overall objective, the Group’s capital management, amongst other things, aims to ensure that it meets financial covenants attached to the interest-bearing loans and borrowings that define capital structure requirements. Breaches in meeting the financial covenants would permit the bank to immediately call loans and borrowings. There have been no breaches in the financial covenants of any interest-bearing loans and borrowing in the current or prior period.

The Group manages its capital structure and makes adjustments in light of changes in economic conditions and the requirements of the financial covenants. To maintain or adjust the capital structure, the Group may adjust the dividend payment to shareholders, return capital to shareholders or issue new shares. The Group uses the following definition of net debt: External interest bearing loans and borrowings less cash and short-term deposits. The interest bearing loans figure used is the gross amount of cash borrowed at that time, as opposed to the carrying value under the amortised cost method, and includes finance leases.
As at
31 March 2018
£’000
25 March 2017
£'000 Interest bearing loans and borrowings 619,968 557,463 Less: Cash and short term deposits - overdrafts (84,704) (155,551)
Net debt 535,264 401,912
31 Post balance sheet events
There have been no material events between the balance sheet date and the date of issue of these accounts.
32 Dividends An interim dividend of 2.4 pence per share (£24.0m) was paid in December 2017. A final dividend of 4.8 pence per share (£48.0m), giving a full year dividend of 7.2 pence per share (£72.0m), is proposed. Relating to the prior year: A special dividend of 10.0 pence per share (£100.0m) was paid in July 2016. An interim dividend of 1.9 pence per share (£19.0m) was paid in December 2016. A final dividend of 3.9 pence per share (£39.0m), giving a full year (non-special) dividend of 5.8 pence per share (£58.0m), was paid in August 2017.
33 Contingent liabilities and guarantees
As at 31 March 2018 and 25 March 2017, B&M European Value Retail S.A., B&M European Value Retail 1 S.à r.l., B&M European Value Retail 2 S.à r.l., B&M European Value Retail Holdco 1 Ltd, B&M European Value Retail Holdco 2 Ltd, B&M European Value Retail Holdco 3 Ltd, B&M European Value Retail Holdco 4 Ltd, EV Retail Ltd and B&M Retail Ltd are all guarantors to both the loan and notes agreements which are formally held within B&M European Value Retail SA. The amounts outstanding as at the period end were £345.0m for the loans (2017: £300m), with the balance held in B&M European Value Retail Holdco 4 Ltd, and £250.0m for the notes, with the balance held in B&M European Value Retail S.A. As at 31 March 2018, Heron Food Group Limited and Heron Foods Ltd are guarantors to the loans which are formally held within Heron Foods Ltd. The amount outstanding at the year end was £15.8m, with the balance held in Heron Foods Ltd.
34 Directors The directors that served during the period were: Name Peter Bamford – (appointed as Chairman on 1 March 2018)

Sir T Leahy – (retired from the Board on 1 March 2018) S Arora (CEO) P McDonald (CFO) T Hübner R McMillan K Guion H Brouwer D Novak - (retired from the Board 18 January 2018) All directors served for the whole period except where indicated above.
Statement of Directors’ Responsibilities The Directors are responsible for preparing the Annual Report and the Group and Company financial statements in accordance with applicable law and regulations. Company law requires the Directors to prepare Group and Company financial statements for each financial year. Under that law they are required to prepare the Group financial statements in accordance with International Financial Reporting Standards (“IFRSs”) as adopted by the EU and applicable law and have prepared the Company financial statements in accordance with Luxemburg legal and regulatory requirements regarding the preparation of annual accounts (“Lux GAAP”). Under company law the Directors must not approve the financial statements unless they are satisfied that they give a true and fair view of the state of affairs of the Group and Company and of their profit or loss for that period. In preparing each of the Group and Company financial statements, the Directors are required to: • select suitable accounting policies and then apply them consistently; • make judgments and estimates that are reasonable and prudent; • present the financial statements and policies in a manner that provides relevant, reliable, comparable and
understandable information; • state whether they have been prepared in accordance with IFRSs as adopted by the EU; • provide additional disclosures when compliance with the specific requirements in IFRSs or in accordance
with Lux GAAP are insufficient to enable users to understand the impact of particular transactions, other events and conditions on the entity’s financial position and financial performance; and
• prepare the financial statements on the going concern basis unless it is inappropriate to presume that the Group and the Company will continue in business.
The Directors are responsible for keeping adequate accounting records that are sufficient to show and explain the Company’s transactions and disclose with reasonable accuracy at any time the financial position of the Company and enable them to ensure that its financial statements comply with company law. They have general responsibility for taking such steps as are reasonably open to them to safeguard the assets of the Group and to prevent and detect fraud and other irregularities. The Directors are responsible for preparing the Annual Report in accordance with applicable laws and regulations. Having taken advice from the Audit & Risk Committee the Directors consider the Annual Report and the financial statements taken as a whole, provides the information necessary to assess the Group’s performance, business model and strategy and is fair, balanced and understandable. The Directors are responsible for the maintenance and integrity of the corporate and financial information included on the Company’s website. The financial statements are published on the Company’s website. Legislation in Luxembourg governing the preparation and dissemination of financial statements may differ from legislation in other jurisdictions. We confirm that to the best of our knowledge: • the consolidated financial statements of B&M European Value Retail S.A. (“Company”) presented in this Annual Report and established in conformity with International Financial Reporting Standards as adopted in the European Union give a true and fair view of the assets, liabilities, financial position, cash flows and profits of the Company and the undertakings included within the consolidation taken as a whole;

• the annual accounts of the Company presented in this Annual Report and established in conformity with the Luxembourg legal and regulatory requirements relating to the preparation of annual accounts give a true and fair view of the assets, liabilities, financial position and profits of the Company; • the Strategic Report includes a fair review of the development and performance of the business and position of the Company and the undertakings included within the consolidation taken as a whole, together with a description of the principal risks and uncertainties it faces; and • this Annual Report (including the financial statements), taken as a whole, is fair, balanced and understandable and provides the information necessary for shareholders to assess the Company’s performance, business model and strategy. Approved by order of the Board. Simon Arora Chief Executive Officer Paul McDonald Chief Financial Officer 30 May 2018