bluk139-evans february 6, 2008 16:7 · la plata, argentina. bluk139-evans february 6, 2008 16:7...
TRANSCRIPT


BLUK139-Evans February 6, 2008 16:7
Frozen Food Science and Technology
i
Frozen Food Science and Technology. Edited by Judith A. Evans
© 2008 Blackwell Publishing Ltd, ISBN: 978-1-4051-5478-9

BLUK139-Evans February 6, 2008 16:7
Frozen Food Science and Technology
Edited by
Judith A. EvansFood Refrigeration and Process Engineering Research Centre (FRPERC)University of Bristol, UK
iii
BLUK139-Evans February 6, 2008 16:7
C© 2008 by Blackwell Publishing Ltd
Blackwell Publishing editorial offices:
Blackwell Publishing Ltd, 9600 Garsington Road, Oxford OX4 2DQ, UK
Tel: +44 (0)1865 776868
Blackwell Publishing Professional, 2121 State Avenue, Ames, Iowa 50014-8300, USA
Tel: +1 515 292 0140
Blackwell Publishing Asia Pty Ltd, 550 Swanston Street, Carlton, Victoria 3053, Australia
Tel: +61 (0)3 8359 1011
The right of the Authors to be identified as the Authors of this Work has been asserted in accordance with the
Copyright, Designs and Patents Act 1988.
All rights reserved. No part of this publication may be reproduced, stored in a retrieval system, or transmitted,
in any form or by any means, electronic, mechanical, photocopying, recording or otherwise, except as
permitted by the UK Copyright, Designs and Patents Act 1988, without the prior permission of the publisher.
Designations used by companies to distinguish their products are often claimed as trademarks. All brand names
and product names used in this book are trade names, service marks, trademarks or registered trademarks of
their respective owners. The Publisher is not associated with any product or vendor mentioned in this book.
This publication is designed to provide accurate and authoritative information in regard to the subject matter
covered. It is sold on the understanding that the Publisher is not engaged in rendering professional services. If
professional advice or other expert assistance is required, the services of a competent professional should be
sought.
First published 2008 by Blackwell Publishing Ltd
ISBN: 978-1-4051-5478-9
Library of Congress Cataloging-in-Publication Data
Frozen food science and technology / edited by Judith A. Evans.
p. cm.
Includes bibliographical references and index.
ISBN-13: 978-1-4051-5478-9 (hardback : acid-free paper)
ISBN-10: 1-4051-5478-0 (hardback : acid-free paper) 1. Frozen foods.
I. Evans, Judith A. (Judith Anne), 1962-
TP372.3.F768 2008
664′.02853–dc22
2007033156
A catalogue record for this title is available from the British Library
Set in 10/12 pt Times by Aptara Inc., New Delhi, India
Printed and bound in Singapore by C.O.S Printers Pte Ltd
The publisher’s policy is to use permanent paper from mills that operate a sustainable forestry policy, and
which has been manufactured from pulp processed using acid-free and elementary chlorine-free practices.
Furthermore, the publisher ensures that the text paper and cover board used have met acceptable environmental
accreditation standards.
For further information on Blackwell Publishing, visit our website:
www.blackwellpublishing.com
iv
BLUK139-Evans February 6, 2008 16:7
Contents
Contributors viiPreface ix
1 Thermal Properties and Ice Crystal Development in Frozen Foods 1Paul Nesvadba
2 Effects of Freezing on Nutritional and Microbiological Properties of Foods 26Mark Berry, John Fletcher, Peter McClure, Joy Wilkinson
3 Modelling of Freezing Processes 51Q. Tuan Pham
4 Specifying and Selecting Refrigeration and Freezer Plant 81Andy Pearson
5 Emerging and Novel Freezing Processes 101Kostadin Fikiin
6 Freezing of Meat 124Steve James
7 Freezing of Fish 151Ola M. Magnussen, Anne K. T. Hemmingsen, Vidar Hardarsson,Tom S. Nordtvedt, Trygve M. Eikevik
8 Freezing of Fruits and Vegetables 165Cristina L.M. Silva, Elsa M. Goncalves,Teresa R. S. Brandao
9 Freezing of Bakery and Dessert Products 184Alain LeBail, H. Douglas Goff
10 Developing Frozen Products for the Market and the Freezing ofReady-Prepared Meals 205Ronan Gormley
11 Frozen Storage 224Noemi E. Zaritzky
BLUK139-Evans February 6, 2008 16:7
vi Contents
12 Freeze Drying 248Andy Stapley
13 Frozen Food Transport 276Girolamo Panozzo
14 Frozen Retail Display 303Giovanni Cortella
15 Consumer Handling of Frozen Foods 325Onrawee Laguerre
Index 347

BLUK139-Evans February 6, 2008 16:7
Contributors
Mark BerryUnilever Plc, SharnbrookBedfordshire, United Kingdom
Teresa R.S. BrandaoEscola Superior de BiotecnologiaUniversidade Catolica PortuguesaPorto, Portugal
Giovanni CortellaDepartment of Energy TechnologiesUniversity of UdineUdine, Italy
Trygve M. EikevikNorwegian University of Scienceand Technology, Trondheim, Norway
Kostadin FikiinRefrigeration Science and TechnologyTechnical University of SofiaBulgaria
John FletcherUnilever Plc, SharnbrookBedfordshire, United Kingdom
H. Douglas GoffDepartment of Food ScienceUniversity of GuelphGuelph, Ontario, Canada
Elsa M. GoncalvesDepartamento de Tecnologia dasIndustrias AlimentaresInstituto Nacional de Engenharia,Tecnologia e InovacaoLisboa, Portugal
Ronan GormleyAshtown Food Research Centre(Teagasc) Ashtown, DublinIreland
Vidar HardarssonSINTEF Energy ResearchTrondheim, Norway
Anne K.T. HemmingsenSINTEF Energy ResearchTrondheim, Norway
Steve JamesFood Refrigeration and ProcessEngineering Research Centre(FRPERC), LangfordNorth Somerset, United Kingdom
Onrawee LaguerreRefrigerating Process Research UnitCemagref,Antony, France
Alain LeBailENITIAA (Ecole NationaleD’Ingenieurs desTechniques des Industries Agricoles etAlimentaires), UMR GEPEA,Nantes, France
Ola M. MagnussenSINTEF Energy ResearchTrondheim, Norway
Peter McClureUnilever Plc, SharnbrookBedfordshire, United Kingdom

BLUK139-Evans February 6, 2008 16:7
viii Contributors
Paul NesvadbaRubislaw Consulting LtdAngusfield AvenueAberdeen, United Kingdom
Tom S. NordtvedtSINTEF Energy ResearchTrondheim, Norway
Girolamo PanozzoConstruction Technologies Institute – ItalianNational Research Council (ITC-CNR)Padova, Italy
Andy PearsonStar Refrigeration, GlasgowUnited Kingdom
Q. Tuan PhamSchool of Chemical Sciences andEngineeringUniversity of New South WalesSydney, Australia
Cristina L.M. SilvaEscola Superior de BiotecnologiaUniversidade Catolica PortuguesaPorto, Portugal
Andy StapleyDepartment of ChemicalEngineeringLoughborough UniversityUnited Kingdom
Joy WilkinsonUnilever Plc, SharnbrookBedfordshire,United Kingdom
Noemi E. ZaritzkyCIDCA (Centro de Investigacion yDesarrollo en Criotecnologıade Alimentos),Universidad Nacionalde La Plata,La Plata, Argentina

BLUK139-Evans February 6, 2008 16:7
Preface
Freezing is one of the oldest and most commonly used means of food preservation. It hasbeen known to be an extremely effective means of preserving food for extended periodssince Paleolithic and Neolithic times, when man used ice and snow to cool food. The coolingeffect of salt and ice was first publicly discussed in 1662 by the chemist Robert Boyle, butthis technology was certainly known in Spain, Italy and India in the sixteenth century. Themanufacture of ice in shallow lakes using radiant ‘night cooling’ and the preservation of iceand snow in ice houses was a common practice in large country houses in the Victorian times.Ice was a product only for the privileged, and iced desserts were extremely fashionable anda sign of great wealth.
In more temperate climates the preservation of ice and snow was obviously difficult, andit was only with artificial cooling that frozen food became available more widely. In 1755William Cullen first made ice without any natural form of cooling by vapourising water at lowpressure. This was followed by Jacob Perkins in 1834 who made the first ice-making machineoperating on ethyl ether. In the following 30 years refrigeration technology developed rapidly,spearheaded by the likes of Joule and Kelvin, and the first patents related to freezing of foodwere filed. In 1865 the first cold storage warehouse in New York was built which used brinefor cooling. In 1868 a ship’s cold air machine was used on board the Anchor line’s Circassianand Strathlevan ships that transported meat from New York to Glasgow. This was rapidlyfollowed in the 1880s by the transport of meat from Australia and New Zealand to London.
In the late nineteenth century, refrigeration and the freezing of food underwent rapiddevelopments in terms of the freezing processes and the refrigerants used. In 1880 ammoniawas first used as a refrigerant and in 1882 the first plate freezer was developed. Althoughfreezing was an extremely important technology, and a vital means of exporting meat forthe troops in World War I, it was only after the war that refrigeration machinery underwentmassive developments to improve reliability and efficiency.
In 1928 refrigeration was changed forever when Thomas Midgley invented CFCs (Freons).These were hailed as wonder chemicals and were claimed at the time to be efficient andenvironmentally harmless. Around the same time (1929) Clarence Birdseye began developingfrozen meals. His original intention (that another inventor, a Frenchman called Charles Tellier,had in 1869) was to use freezing to dry foods that would have long-term stability and could bereconstituted by the housewife. When this method was found to produce poor quality results,Birdseye reverted to the fast freezing of food. Uniquely, he understood the beneficial impactof fast freezing on the quality of foods that had until that time often been frozen at slow rates.
Developments in freezing and frozen foods technology developed rapidly in the later halfof the twentieth century. With changes in consumers’ lifestyles the need for conveniencefood increased and, coupled with the development of low-cost refrigeration technologies,all households could have access to a freezer to store food. At the end of the twentiethcentury the market for frozen food was increasing at about 10% per year with approximately25% of refrigerated food being frozen. This growth has since slowed slightly but sales of

BLUK139-Evans February 6, 2008 16:7
x Preface
certain frozen foods such as fish and seafood are growing. Growth of frozen fish in Russia isreported to be 17% per year (Cold Chain Experts Newsletter, January, 2006) and the BritishFrozen Food federation has recently reported that sales by value increased by 3% in 2005/6(Refrigeration and Air Conditioning, November, 2006).
Successful freezing can now preserve food almost in its original form. This makes itpossible to preserve and transport food worldwide. As freezing prevents growth of microbes,frozen food can be stored for long periods; there is no need to use preservatives or additivesto extend shelf life. Freezing allows flexibility in manufacture and supply and means thatfood can be preserved at near its optimum quality for distribution and transportation.
This book describes the current technologies to preserve food and the best practices toensure production of safe, high-quality frozen food. It also points to some new technologiesthat are already making waves and are likely to cast an even greater impact on the frozenfood industry in the future.
One of the largest upheavals in the refrigeration industry in the last 30 years was caused bythe realisation that the chemicals invented by Thomas Midgley are harmful to the environment.The phasing out of CFCs (chlorofluorocarbons) and introducing their replacements – HCFCs(hydrofluorocarbons) – as part of the Montreal and Kyoto protocols, have brought about aparadigm shift in the chemicals used as refrigerants. Many older refrigerants with low ODP(ozone depletion potential) and GWP (global warming potential) have been, or are being,re-evaluated so as to raise their refrigeration potential making use of the modern machinery.For example, the refrigeration technology used on board the first ships, that brought meatto the UK from America and Australasia, was based on the use of air as the refrigerant.This technology, although effective, was based on large and inefficient machinery that couldnot compete once newer equipment came into the market. With modern compact, efficientturbo-machinery these disadvantages were overcome and air could once again be used as acompetitive refrigerant.
As well as addressing these refrigeration issues, the book examines many interestingnew freezing technologies such as pressure shift freezing. Although not yet a commercialreality for large-scale production, the possibility of a rapidly frozen product with minimalcell disruption is an exciting prospect for the future.
I hope that you will find that this book provides a comprehensive source of information onfreezing and frozen storage of food. Our aim is to provide readers with in-depth knowledgeof current and emerging refrigeration technologies and how these technologies can be usedto optimise the quality of frozen food. An impressive group of authors, each an expert in theirparticular field, have contributed to this book. I would like to thank each of them for theirhelp in developing a practical and comprehensive guide to freezing and frozen foods.
Judith Evans
BLUK139-Evans March 5, 2008 16:14
1 Thermal Properties and Ice CrystalDevelopment in Frozen Foods
Paul Nesvadba
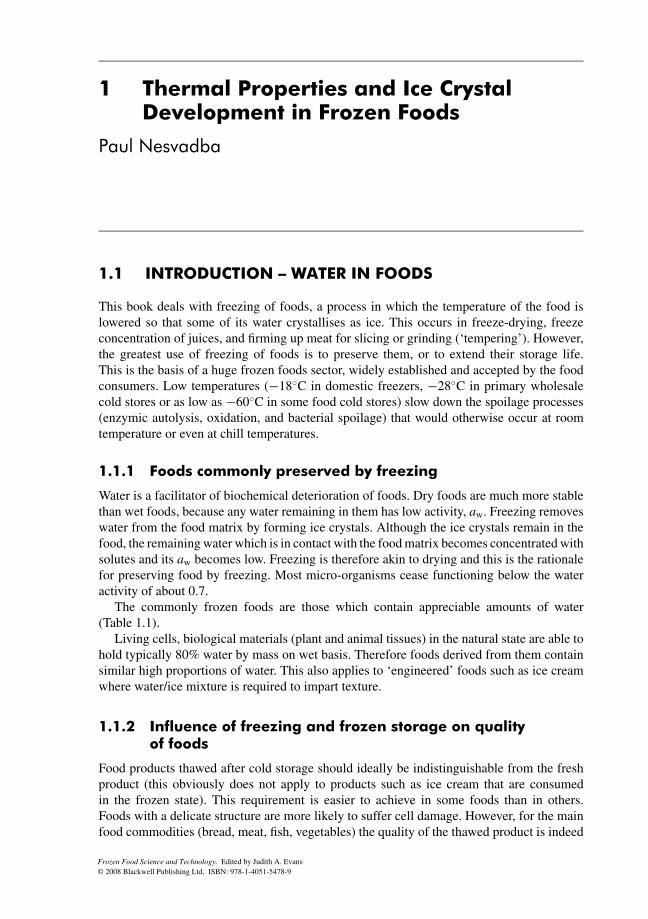
1.1 INTRODUCTION – WATER IN FOODS
This book deals with freezing of foods, a process in which the temperature of the food islowered so that some of its water crystallises as ice. This occurs in freeze-drying, freezeconcentration of juices, and firming up meat for slicing or grinding (‘tempering’). However,the greatest use of freezing of foods is to preserve them, or to extend their storage life.This is the basis of a huge frozen foods sector, widely established and accepted by the foodconsumers. Low temperatures (−18◦C in domestic freezers, −28◦C in primary wholesalecold stores or as low as −60◦C in some food cold stores) slow down the spoilage processes(enzymic autolysis, oxidation, and bacterial spoilage) that would otherwise occur at roomtemperature or even at chill temperatures.
1.1.1 Foods commonly preserved by freezing
Water is a facilitator of biochemical deterioration of foods. Dry foods are much more stablethan wet foods, because any water remaining in them has low activity, aw. Freezing removeswater from the food matrix by forming ice crystals. Although the ice crystals remain in thefood, the remaining water which is in contact with the food matrix becomes concentrated withsolutes and its aw becomes low. Freezing is therefore akin to drying and this is the rationalefor preserving food by freezing. Most micro-organisms cease functioning below the wateractivity of about 0.7.
The commonly frozen foods are those which contain appreciable amounts of water(Table 1.1).
Living cells, biological materials (plant and animal tissues) in the natural state are able tohold typically 80% water by mass on wet basis. Therefore foods derived from them containsimilar high proportions of water. This also applies to ‘engineered’ foods such as ice creamwhere water/ice mixture is required to impart texture.
1.1.2 Influence of freezing and frozen storage on qualityof foods
Food products thawed after cold storage should ideally be indistinguishable from the freshproduct (this obviously does not apply to products such as ice cream that are consumedin the frozen state). This requirement is easier to achieve in some foods than in others.Foods with a delicate structure are more likely to suffer cell damage. However, for the mainfood commodities (bread, meat, fish, vegetables) the quality of the thawed product is indeed
Frozen Food Science and Technology. Edited by Judith A. Evans
© 2008 Blackwell Publishing Ltd, ISBN: 978-1-4051-5478-9
BLUK139-Evans March 5, 2008 16:14
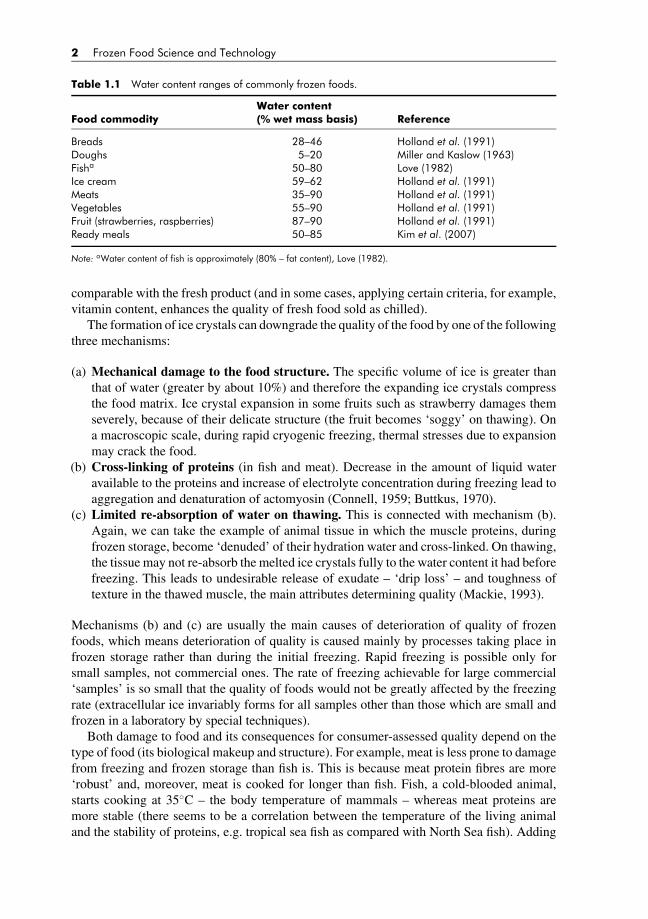
2 Frozen Food Science and Technology
Table 1.1 Water content ranges of commonly frozen foods.
Water contentFood commodity (% wet mass basis) Reference
Breads 28–46 Holland et al. (1991)Doughs 5–20 Miller and Kaslow (1963)Fisha 50–80 Love (1982)Ice cream 59–62 Holland et al. (1991)Meats 35–90 Holland et al. (1991)Vegetables 55–90 Holland et al. (1991)Fruit (strawberries, raspberries) 87–90 Holland et al. (1991)Ready meals 50–85 Kim et al. (2007)
Note: aWater content of fish is approximately (80% – fat content), Love (1982).
comparable with the fresh product (and in some cases, applying certain criteria, for example,vitamin content, enhances the quality of fresh food sold as chilled).
The formation of ice crystals can downgrade the quality of the food by one of the followingthree mechanisms:
(a) Mechanical damage to the food structure. The specific volume of ice is greater thanthat of water (greater by about 10%) and therefore the expanding ice crystals compressthe food matrix. Ice crystal expansion in some fruits such as strawberry damages themseverely, because of their delicate structure (the fruit becomes ‘soggy’ on thawing). Ona macroscopic scale, during rapid cryogenic freezing, thermal stresses due to expansionmay crack the food.
(b) Cross-linking of proteins (in fish and meat). Decrease in the amount of liquid wateravailable to the proteins and increase of electrolyte concentration during freezing lead toaggregation and denaturation of actomyosin (Connell, 1959; Buttkus, 1970).
(c) Limited re-absorption of water on thawing. This is connected with mechanism (b).Again, we can take the example of animal tissue in which the muscle proteins, duringfrozen storage, become ‘denuded’ of their hydration water and cross-linked. On thawing,the tissue may not re-absorb the melted ice crystals fully to the water content it had beforefreezing. This leads to undesirable release of exudate – ‘drip loss’ – and toughness oftexture in the thawed muscle, the main attributes determining quality (Mackie, 1993).
Mechanisms (b) and (c) are usually the main causes of deterioration of quality of frozenfoods, which means deterioration of quality is caused mainly by processes taking place infrozen storage rather than during the initial freezing. Rapid freezing is possible only forsmall samples, not commercial ones. The rate of freezing achievable for large commercial‘samples’ is so small that the quality of foods would not be greatly affected by the freezingrate (extracellular ice invariably forms for all samples other than those which are small andfrozen in a laboratory by special techniques).
Both damage to food and its consequences for consumer-assessed quality depend on thetype of food (its biological makeup and structure). For example, meat is less prone to damagefrom freezing and frozen storage than fish is. This is because meat protein fibres are more‘robust’ and, moreover, meat is cooked for longer than fish. Fish, a cold-blooded animal,starts cooking at 35◦C – the body temperature of mammals – whereas meat proteins aremore stable (there seems to be a correlation between the temperature of the living animaland the stability of proteins, e.g. tropical sea fish as compared with North Sea fish). Adding
BLUK139-Evans March 5, 2008 16:14
Thermal Properties and Ice Crystal Development in Frozen Foods 3
cryoprotectants to food reduces deterioration in frozen storage. The section ‘Glassy State’discusses this further.
The ability to determine the quality of frozen foods rapidly in their frozen state, withouthaving to thaw the food for analysis, is of great significance. Kent et al. (2001, 2004, 2005)developed a microwave method for this. If, in a certain situation, this instrumental methodcannot be used, a sensory assessment panel is used. The quality attributes of thawed foodsare sensory (appearance, odour, flavour, texture – in cooked products). The attributes that aredirectly connected with water in foods are water-holding capacity and drip loss.
In the UK, frozen–thawed fish cannot legally be presented for sale as fresh for the qualitychanges freezing causes. This raises the question of enforcement of the law. Apart fromthe biochemical methods which are slow (Kitamikado et al., 1990; Salfi et al., 1986), it ispreferable to use rapid physical and, in particular, electrical methods that have been developedfor fish quality measurement but are also useful to check whether the fish had been frozen atall (Jason and Richards, 1975; Rehbein, 1992).
Another legal issue is ‘added water’. During freezing of fish fillets, water sprayed ontheir surface creates a layer of ice that provides some protection against oxidation in frozenstorage. On the other hand, the temptation may be to add too much of water because fish issold by weight. For this problem, rapid methods to detect the amount of water added havebeen developed (Kent et al., 2001; Daschner and Knochel, 2003).
Consumers often ask whether thawing and refreezing is detrimental to food quality. Theanswer is that when done properly (hygienically, thus preventing microbial contaminationduring thawing), the effect of multiple freezing on quality (e.g. increased drip) is usually notvery serious (Oosterhuis, 1981).
1.1.3 Water-binding capacity (or water-holding ability) of foods
Food holds water by several mechanisms. It may be cells holding the water either withcell membranes or between cells and in pores by capillary forces. Such water could beexpressed (removed) by pressing. Water binds to hydrophilic components of foods (proteins,carbohydrates, salts and micronutrients) by van der Waals forces including hydrogen bonding.
Interaction of water with fats (lipids) is small because fats are hydrophobic, not readilysoluble in water. On the cellular level, exclusion of water from cells is regulated by boththe permeability of cell (or micelle) lipid bilayers and osmotic mechanisms. The molecularforce in the hydration shell around proteins increases from the outer to the inner hydrationlayer. The most tightly bound water may not be removed by freezing; this water is called‘unfreezable water’.
The methods to measure water-binding capacity of foods have great commercial andscientific significance. Trout (1988) reviewed the following methods for measuring water-holding capacity of foods: the press, centrifugal, capillary suction, filter paper, small-scalecook yield test and NMR.
1.2 FREEZING OF FOODS
1.2.1 Freezing curves
Freezing of food starts when the food is placed in contact with a cold medium, which can besolid (for example, heat exchanger plates at −30 to −40◦C, solid carbon dioxide (dry ice) at

BLUK139-Evans March 5, 2008 16:14
4 Frozen Food Science and Technology
Tem
pera
ture
Time
T0
Tf
Ts
Te
A
t1
B C
Fig. 1.1 A schematic plot of temperatures in food during freezing, showing the starting temperature,T0, the initial freezing temperature, Tf, the temperature to which the food may supercool, Ts, the freezingplateau B–C and the equilibrium temperature, Te.
−78.5◦C), liquid (immersion in a cooling mixture or cryogenic fluid such as liquid nitrogenat −196◦C) or gas (a stream of air, gaseous nitrogen or CO2). The surface of the food coolsfaster than the centre of the food because the heat from the interior of the food has to reachthe surface by conduction.
Figure 1.1 shows a typical temperature record during freezing. The temperature at thesurface of the food may show supercooling (point A (t1, Ts)) before increasing momentarily toapproximately the initial freezing temperature Tf, and thereafter continuing along the ‘thermalarrest’ plateau (the B–C part) as transfer of the latent heat of freezing of water (334 kJ/kg forpure free water) from the food begins. The first ice crystals are formed between A and B andfurther crystals are formed all the way to the final temperature Te where the temperature ofthe food equilibrates to the temperature of the cooling medium. No further rapid increase inthe amount of ice occurs except for the slow accretion discussed in section 1.2.4.
1.2.2 Supercooling
Below its initial freezing point, a liquid is said to be supercooled. This is a metastable state ofthe liquid; the liquid can continue to be in this state for a very long time, before nucleation of thefirst crystal takes place. Following this the crystals grow and spread throughout the volumerapidly. Pure water (free of impurities such as dust particles that would act as nucleationcentres) can be supercooled to around −40◦C. At lower temperatures water freezes dueto homogeneous ice nucleation and growth. In foods the degree of supercooling is muchsmaller than in pure water because of heterogeneous ice nucleation. Supercooling is importantin nature since this is one of the mechanisms by which living plants and animals copewith sub-zero temperatures or minimize the damage of their tissue that ice formation cancause.
BLUK139-Evans March 5, 2008 16:14
Thermal Properties and Ice Crystal Development in Frozen Foods 5
1.2.3 Ice nucleation and growth
Ice crystals come to existence as nuclei (seeds) of a critical size that subsequently grow. Thecritical size is that at which growth of the nucleus results in reduction of surface energy σ ascompared with the increase in Gibbs free energy γ due to increase in volume (for a sphericalice crystal of radius r , this happens when σr2 < γ r3).
Nucleation can be homogeneous or heterogeneous. Homogeneous nucleation occurs onlyin homogeneous particle-free liquids and happens due to random fluctuations of molecules(the random clusters of molecules momentarily assume the configuration of ice and actas seeds). In solid foods the nucleation is heterogeneous, with the cell surfaces acting asnucleation sites. The probability of nucleation at a site is enhanced if the molecular structureof the surface resembles that of ice, i.e. matches the lattice size of the ice crystal and actsas a template. This happens notably with ice nucleation active (INA) proteins found in somebacteria and plants (Govindarajan and Lindow, 1988).
1.2.4 Ice fraction frozen out
Pure water freezes at 0◦C (save for the phenomenon of supercooling), but water solutions(in food sodium chloride or other salt solutions) have a lower freezing point, the depressionbeing approximated by Raoult’s equation (Miles et al., 1997). During cooling below Tf, theextracellular region forms ice first and then the intracellular region begins to change state.This can be attributed to the fact that the cell (typical diameter 50 μm) membrane preventsgrowth of external ice into the region inside the cell (called intracellular region) making theintracellular region supercooled (∼ −8◦C).
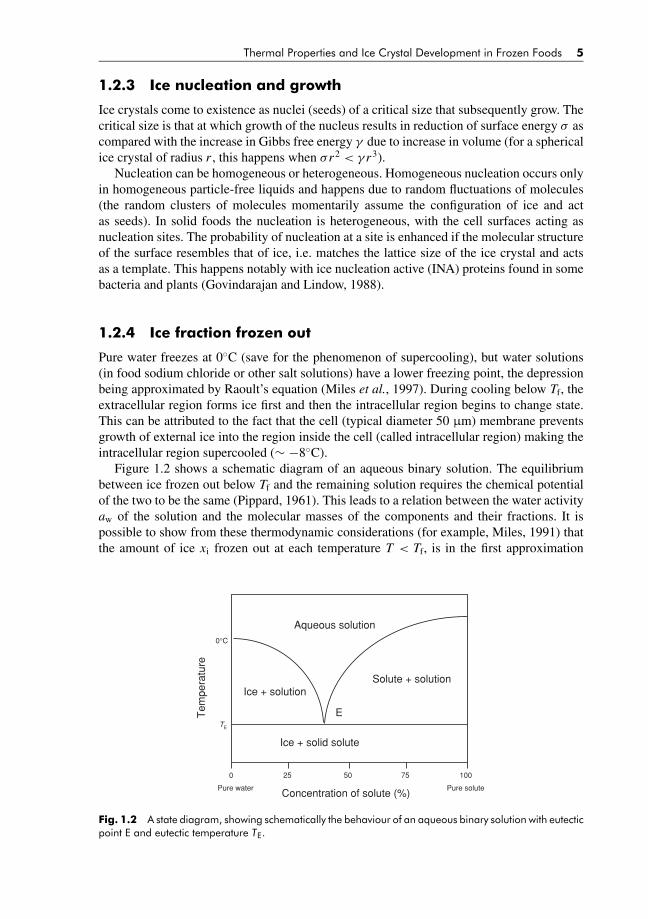
Figure 1.2 shows a schematic diagram of an aqueous binary solution. The equilibriumbetween ice frozen out below Tf and the remaining solution requires the chemical potentialof the two to be the same (Pippard, 1961). This leads to a relation between the water activityaw of the solution and the molecular masses of the components and their fractions. It ispossible to show from these thermodynamic considerations (for example, Miles, 1991) thatthe amount of ice xi frozen out at each temperature T < Tf, is in the first approximation
Aqueous solution
Solute + solution Ice + solution
0°C
Tem
pera
ture
TE
E
Pure water Pure solute
Ice + solid solute
Concentration of solute (%)
0 1005025 75
Fig. 1.2 A state diagram, showing schematically the behaviour of an aqueous binary solution with eutecticpoint E and eutectic temperature TE.

BLUK139-Evans March 5, 2008 16:14
6 Frozen Food Science and Technology
(assuming an ideal binary solution and small temperature differences Tf − T ) given by
xi = (xw − xu)(1 − Tf/T ) (1.1)
where Tf and T are in degrees Celsius, xw is the total water content of the food and xu isthe unfreezable water content. The last one is typically 5% and includes the so-called boundwater, so that xu > xb where xb is the content of bound water.
The term ‘bound water’ is not understood well and not defined clearly. Fennema (1985)defines it in practical terms as
. . . water which exists in the vicinity of solutes and other non-aqueous constituents, exhibits reduced
molecular mobility and other significantly altered properties as compared with “bulk water” in the
same system, and does not freeze at −40◦C.
This definition has two desirable attributes. One, it produces a conceptual picture of boundwater, and two, it provides a realistic approach to quantifying the bound water. Water un-freezable at −40◦C can be measured with equally satisfying results by either proton NMRor calorimetric procedures.
Figure 1.3 shows the graph of xi for Tf = −1◦C and xu = 5%. Riedel (1957, 1978)made the first systematic experimental determination of the ice fraction xi by calorimetricmeasurements. Other experimental investigations, for example by NMR, confirm that theapproximation of xi by equation (1.1) is acceptable for engineering purposes such as thecalculation of thermal properties of frozen food, requiring accuracy of about ±10% (Novikov,1971).
Equation 1.1 is derived from thermodynamic considerations (see for example Miles(1991)) that do not take into account the fact that even at constant temperature the fraction ofice increases with time, as was observed, for example, by Kent (1975). The time dependence isdue to kinetically hindered mobility of the water molecules. Frozen food is not an equilibrium
0
10
20
30
40
50
60
70
80
−45 −40 −35 −30 −25 −20 −15 −10 −5 0
Temperature (°C )
Ice fra
ctio
n (%
)
Fig. 1.3 Proportion of water frozen out in food as a function of temperature, calculated for a food withwater content xw of 80% and unfreezable water content xu of 5%.
BLUK139-Evans March 5, 2008 16:14
Thermal Properties and Ice Crystal Development in Frozen Foods 7
Aqueous solution
Glass
Ice + solution
0°C
Tem
pera
ture
Tg
Pure water Pure solute Concentration of solute (%)
0 1005025 75
Tg
Tm
Cg
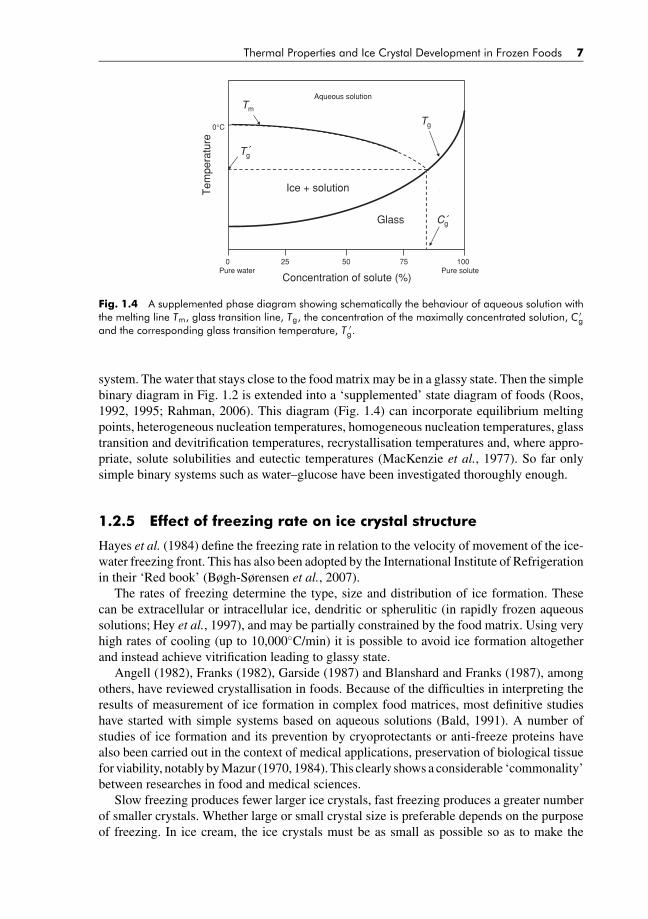
Fig. 1.4 A supplemented phase diagram showing schematically the behaviour of aqueous solution withthe melting line Tm, glass transition line, Tg, the concentration of the maximally concentrated solution, C ′
gand the corresponding glass transition temperature, T ′
g.
system. The water that stays close to the food matrix may be in a glassy state. Then the simplebinary diagram in Fig. 1.2 is extended into a ‘supplemented’ state diagram of foods (Roos,1992, 1995; Rahman, 2006). This diagram (Fig. 1.4) can incorporate equilibrium meltingpoints, heterogeneous nucleation temperatures, homogeneous nucleation temperatures, glasstransition and devitrification temperatures, recrystallisation temperatures and, where appro-priate, solute solubilities and eutectic temperatures (MacKenzie et al., 1977). So far onlysimple binary systems such as water–glucose have been investigated thoroughly enough.
1.2.5 Effect of freezing rate on ice crystal structure
Hayes et al. (1984) define the freezing rate in relation to the velocity of movement of the ice-water freezing front. This has also been adopted by the International Institute of Refrigerationin their ‘Red book’ (Bøgh-Sørensen et al., 2007).
The rates of freezing determine the type, size and distribution of ice formation. Thesecan be extracellular or intracellular ice, dendritic or spherulitic (in rapidly frozen aqueoussolutions; Hey et al., 1997), and may be partially constrained by the food matrix. Using veryhigh rates of cooling (up to 10,000◦C/min) it is possible to avoid ice formation altogetherand instead achieve vitrification leading to glassy state.
Angell (1982), Franks (1982), Garside (1987) and Blanshard and Franks (1987), amongothers, have reviewed crystallisation in foods. Because of the difficulties in interpreting theresults of measurement of ice formation in complex food matrices, most definitive studieshave started with simple systems based on aqueous solutions (Bald, 1991). A number ofstudies of ice formation and its prevention by cryoprotectants or anti-freeze proteins havealso been carried out in the context of medical applications, preservation of biological tissuefor viability, notably by Mazur (1970, 1984). This clearly shows a considerable ‘commonality’between researches in food and medical sciences.
Slow freezing produces fewer larger ice crystals, fast freezing produces a greater numberof smaller crystals. Whether large or small crystal size is preferable depends on the purposeof freezing. In ice cream, the ice crystals must be as small as possible so as to make the
BLUK139-Evans March 5, 2008 16:14
8 Frozen Food Science and Technology
product as creamy and smooth as possible. However, to concentrate liquid food products,large crystals are easier to separate from the freeze concentrate (Fellows, 2000). In freezedrying (Chapter 12) it is usually desirable to produce a small number of large crystals in orderto accelerate the subsequent sublimation process (Fellows, 2000).
When freezing commences, water that is present in the food migrates to join the growingice crystals. When plant or animal tissues are frozen rapidly (in laboratory conditions, insufficiently small or thin samples), water does not translocate across the cell membrane andsmall, uniformly distributed ice crystals are formed within the cell.
In commercial food freezing, the rates of freezing are usually too slow to form intracellularice. In foods that are frozen slowly, large ice crystals form and ice fills the extracellularspace causing dehydration of the cells. The ice crystals force the cells or tissue fibres apart.Although foods that are quick (flash) frozen produce small ice crystals, these ice crystalsmay grow larger over time through a process known as recrystallisation or Ostwald ripening(Smith and Schwartzberg, 1985). Recrystallisation occurs in frozen foods because largercrystals are thermodynamically more stable (they have a relatively smaller surface energy).Recrystallisation is aided by temperature gradients in the products during freezing or thawing,or temperature fluctuations during extended frozen storage (Chapter 11), distribution (whenproducts are in transit) or domestic storage (home frost-free freezer temperatures may rise toalmost 0◦C during defrost cycles) (Chapter 15).
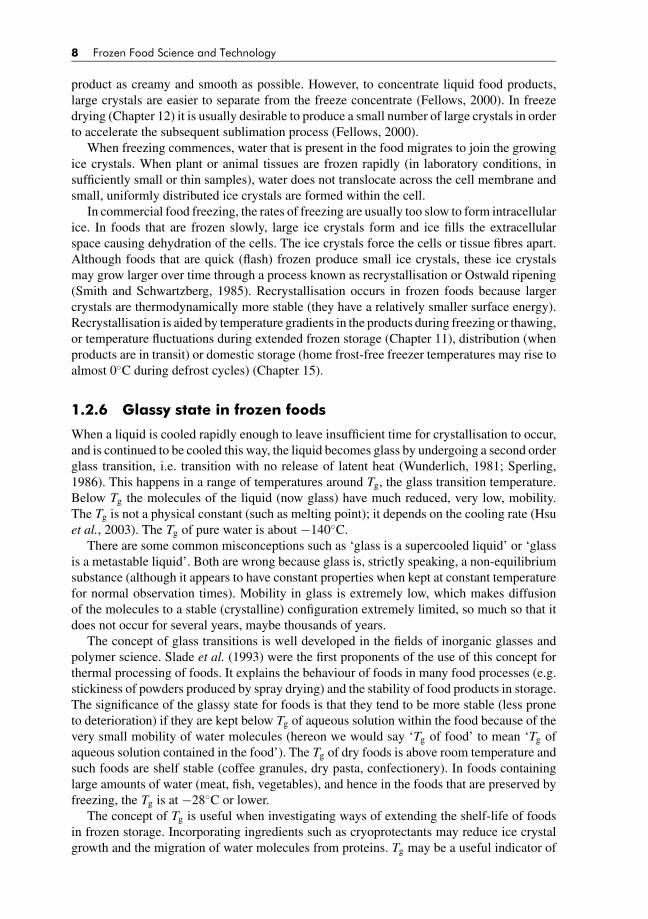
1.2.6 Glassy state in frozen foods
When a liquid is cooled rapidly enough to leave insufficient time for crystallisation to occur,and is continued to be cooled this way, the liquid becomes glass by undergoing a second orderglass transition, i.e. transition with no release of latent heat (Wunderlich, 1981; Sperling,1986). This happens in a range of temperatures around Tg, the glass transition temperature.Below Tg the molecules of the liquid (now glass) have much reduced, very low, mobility.The Tg is not a physical constant (such as melting point); it depends on the cooling rate (Hsuet al., 2003). The Tg of pure water is about −140◦C.
There are some common misconceptions such as ‘glass is a supercooled liquid’ or ‘glassis a metastable liquid’. Both are wrong because glass is, strictly speaking, a non-equilibriumsubstance (although it appears to have constant properties when kept at constant temperaturefor normal observation times). Mobility in glass is extremely low, which makes diffusionof the molecules to a stable (crystalline) configuration extremely limited, so much so that itdoes not occur for several years, maybe thousands of years.
The concept of glass transitions is well developed in the fields of inorganic glasses andpolymer science. Slade et al. (1993) were the first proponents of the use of this concept forthermal processing of foods. It explains the behaviour of foods in many food processes (e.g.stickiness of powders produced by spray drying) and the stability of food products in storage.The significance of the glassy state for foods is that they tend to be more stable (less proneto deterioration) if they are kept below Tg of aqueous solution within the food because of thevery small mobility of water molecules (hereon we would say ‘Tg of food’ to mean ‘Tg ofaqueous solution contained in the food’). The Tg of dry foods is above room temperature andsuch foods are shelf stable (coffee granules, dry pasta, confectionery). In foods containinglarge amounts of water (meat, fish, vegetables), and hence in the foods that are preserved byfreezing, the Tg is at −28◦C or lower.
The concept of Tg is useful when investigating ways of extending the shelf-life of foodsin frozen storage. Incorporating ingredients such as cryoprotectants may reduce ice crystalgrowth and the migration of water molecules from proteins. Tg may be a useful indicator of

BLUK139-Evans March 5, 2008 16:14
Thermal Properties and Ice Crystal Development in Frozen Foods 9
the effectiveness of the cryoprotectant. Examples of cryoprotectants are monosaccharides,disaccharides, glycerol, sorbitol, phosphate salts, ascorbic acid, carboxymethyl cellulose,gums and trehalose (Anese and Gormley, 1996; Love, 1966; Krivchenia and Fennema, 1988).
Mackie (1993) outlines the possible mechanisms of cryoprotection in proteinaceous foodssuch as fish:
(a) Preferential exclusion of the cryoprotectant from the protein (Tamiya et al., 1985;Arakawa and Timasheff, 1985; Carpenter and Crowe, 1988). According to this theory thepresence of the cryoprotectant increases the chemical potential of both the protein andthe cryoprotectant. As a result the protein is stabilised against dissociation and denatura-tion as these would lead to greater thermodynamically unfavourable contact surface areabetween the protein and the cryoprotectant.
(b) Preferential hydration of protein molecule via functional –OH or ionic groups, therebyreducing the amount of water removed from the protein on freezing (Matsumoto andNoguchi, 1992).
(c) Decreased molecular mobility in the unfrozen phase surrounding the protein, due to theincreased viscosity and formation of a glassy state (Levine and Slade, 1988).
According to the hypothesis of Levine and Slade, adding a cryoprotectant should ideallyraise Tg above the storage temperature. This would restrict functioning of the deteriorativeprocesses to a minimum (Goff, 1994). Above Tg the food matrix is usually described as‘rubbery’. Its kinetics follows the William–Landel–Ferry (WLF) equation rather than theArrhenius law. Even if no cryoprotectant is used, the Tg of the product ‘as is’ may providea guide for the economically optimal storage temperature. In Japan −60◦C is used for thestorage of sensitive high-value products such as tuna species for ‘sushi’ and ‘sashimi’ raw fishproducts. Whether such a general idea applies to all foods has been questioned (Orlien, 2003;Orlien et al., 2003) but nevertheless it provides a useful framework to test the effectivenessof cryoprotectants and stimulates further research in this area.
The Tg hypothesis has been validated so far by many studies: on carbohydrate systems,such as dairy desserts, ice creams and some vegetables (Reid, 1990; Reid et al., 1994, 1995;Roos and Karel, 1991; Roos, 1995) and on systems with globular proteins. It is not yet clearwhether the theory applies to the myosin helical protein systems as well, fish muscle forexample (Jensen et al., 2003). Herrera and Mackie (2004) and Herrera et al. (2000) foundthat maltodextrins and low molecular weight carbohydrates can inhibit TMAO-demethylasein fish in frozen storage. Rey-Mansilla et al. (2001) carried out similar work on fish andHansen (2004) on pork.
Unlike in medicine (dealing with small samples such as semen, eggs or embryos), the useof cryoprotectants in frozen food technology has been limited due to the difficulties in incor-porating cryoprotectants into large samples of food. The process of putting cryoprotectantsinto food is too slow to rely solely on diffusion, as has been found to happen in strawberry,which necessitates comminution (mincing into small particles), such as the process of makingsurimi. The other problem (in non-sweet foods) is that the taste of the cryoprotectant canmake the food sweet.
Most foods are multi-phase with complex structure and this makes investigation and in-terpretation of glass transition in them difficult (Roos, 1995). The glass transition is detectedfrom changes in various physical properties associated with changes in molecular mobilityand viscosity. These effects are seen in dielectric, mechanical, and thermodynamic proper-ties (enthalpy, free volume, heat capacity and thermal expansion coefficient) (White andCakebread, 1966; Wunderlich, 1981; Sperling, 1986). Differential scanning calorimetry
BLUK139-Evans March 5, 2008 16:14
10 Frozen Food Science and Technology
(DSC), and especially the new rapid scanning DSC (Saunders et al., 2004), is the most com-mon method used to determine Tg. DSC detects the change in heat capacity cp occurring overthe transition temperature range (Wunderlich, 1981; Kalichevsky et al., 1992; Roos, 1995).
1.3 THAWING OF FROZEN FOODS
Superficially, thawing is the reversal of freezing (energy is supplied to the food in order tomelt the ice crystals). However, thawing is more difficult an operation than freezing (andunfortunately mostly left to the consumer at the end of the supply chain). Thawing is difficultand requires care for three reasons:
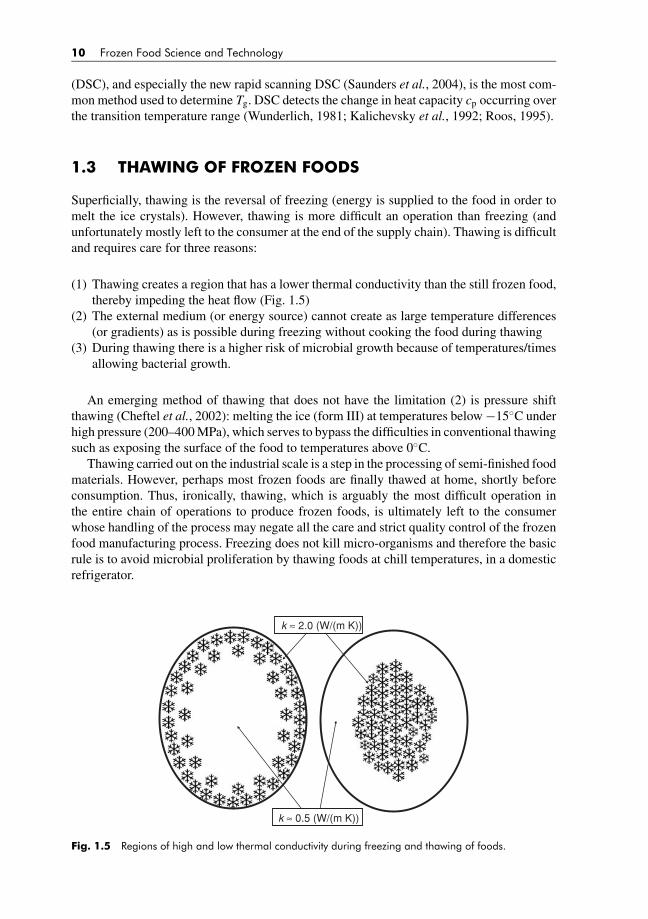
(1) Thawing creates a region that has a lower thermal conductivity than the still frozen food,thereby impeding the heat flow (Fig. 1.5)
(2) The external medium (or energy source) cannot create as large temperature differences(or gradients) as is possible during freezing without cooking the food during thawing
(3) During thawing there is a higher risk of microbial growth because of temperatures/timesallowing bacterial growth.
An emerging method of thawing that does not have the limitation (2) is pressure shiftthawing (Cheftel et al., 2002): melting the ice (form III) at temperatures below −15◦C underhigh pressure (200–400 MPa), which serves to bypass the difficulties in conventional thawingsuch as exposing the surface of the food to temperatures above 0◦C.
Thawing carried out on the industrial scale is a step in the processing of semi-finished foodmaterials. However, perhaps most frozen foods are finally thawed at home, shortly beforeconsumption. Thus, ironically, thawing, which is arguably the most difficult operation inthe entire chain of operations to produce frozen foods, is ultimately left to the consumerwhose handling of the process may negate all the care and strict quality control of the frozenfood manufacturing process. Freezing does not kill micro-organisms and therefore the basicrule is to avoid microbial proliferation by thawing foods at chill temperatures, in a domesticrefrigerator.
k ≈ 2.0 (W/(m K))
k ≈ 0.5 (W/(m K))
Fig. 1.5 Regions of high and low thermal conductivity during freezing and thawing of foods.

BLUK139-Evans March 5, 2008 16:14
Thermal Properties and Ice Crystal Development in Frozen Foods 11
While cooking the food, thawing can sometimes be combined with heating in the oven(either conventional or microwave) if dehydration of the surface is prevented. If it is possibleto divide a piece of frozen food into smaller pieces (for example, to separate the slices ofbread from a sliced frozen loaf), the rate of heat transfer is quadrupled for each halving ofthe thickness. This follows from the solution of the heat conduction equation.
Thawing by microwaves has the disadvantage that the electromagnetic waves are preferen-tially absorbed in the unfrozen (thawed) region of the food. Thawing by ultrasound (domesticthawers have been developed in Japan) is in principle better than thawing by microwaves be-cause ultrasound is absorbed in the compressible frozen region (Miles et al., 1999). A goodcontact between the food and the ultrasonic source has to be ensured by immersion in water,thus it is suitable only for wet foods of regular shape, which is a disadvantage also of thawingby electric current (ohmic heating).
1.4 THERMOPHYSICAL PROPERTIES DURING FREEZING,THEIR MEASUREMENT AND APPLICATION
Data on thermal properties of foods are essential to design and control the thermal processingof foods and thereby ensure quality and microbiological safety of foods. It is often a difficulttask to use the measurement methods correctly and apply the knowledge of thermal processesin industrial applications.
The principal feature of the thermal properties in the frozen range is that they dependstrongly on temperature. This is because of the large differences between the properties ofice and liquid water and because of the varying proportion of ice below the initial freezingpoint, as shown in Fig. 1.3. Figures 1.6, 1.7, 1.8 and 1.9 show graphs of the properties offoods used in heat transfer modelling: density, specific heat capacity, enthalpy and thermalconductivity, respectively.
1.4.1 Specific heat capacity, enthalpy
Water has quite a large specific heat capacity, cp, (4.18 J/g ◦C at 20◦C) compared withother substances. Ice has a smaller cp than water, about 2 J/g ◦C. The latent heat of freezing
960
970
980
990
1000
1010
1020
1030
1040
−40 −35 −30 −25 −20 −15 −10 −5 0 5
Temperature (°C)
Dens
ity (
kg/m
3)
Fig. 1.6 Density of food as a function of temperature calculated with Tf = −1◦C, xw = 0.8, xprotein =0.05, xfat = 0.075, xcarbohydrate = 0.075 and xu = 0.05.

BLUK139-Evans March 5, 2008 16:14
12 Frozen Food Science and Technology
0
50
100
150
200
−45 −35 −25 −15 −5 5
Temperature (°C)
Speci
fic h
eat ca
paci
ty (
kJ/
kg K
)
Fig. 1.7 Specific heat capacity of food as a function of temperature, calculated with Tf = −1◦C, xw =0.8, xprotein = 0.05, xfat = 0.075, xcarbohydrate = 0.075 and xu = 0.05.
(or melting) of water (or ice), L, is also large compared with other substances: 334 J/g at1 bar, 0◦C. Because of the large values of cp and latent heat of water, the energy required forfreezing and thawing of foods is large and it increases with increasing water content of food.
Specific heat capacity (and enthalpy), being ‘additive’ properties, can be calculated by asimple ‘mixing’ formula:
cp =∑
xk · cpk (1.2)
where cp is specific heat capacity of food, xk are the mass fractions of the components (water,ice, protein, carbohydrate, fat, etc.), and cpk are the specific heat capacities of the componentsat constant pressure. This additive property and independence of structure makes heat capacitymuch easier to predict than thermal conductivity which depends on the structure of the food.
For frozen foods, x and cp for water and ice in equation (1.2) vary with temperature;therefore a term has to be added to take into account the specific heat capacity variation dueto the changes in proportion of ice: L(T ) · (dxi/dT ) (assuming constant pressure). In Fig. 1.7the steep peak of cp at the initial freezing point followed by a small, stable value through theremaining part of freezing is due to the latent heat contribution from the gradually frozen-outice, as shown in Fig. 1.3.
The cp of foods can be estimated by assuming that the food is a binary solution andusing function xi(T ), approximated for example by equation (1.1). The cp as a function oftemperature then has the form
cp(T ) = cs(1 − xw) + cwxw(1 − xi) + cixi + Lxw(dxi/dt) (1.3)
where the indices s, w and i represent the solid component (dry solid content), water andice, respectively, c is specific heat capacity and x is mass fraction. Table 1.2 shows thecontributions of the sensible and latent heats in equation (1.2), calculated using xi(T ) fromequation (1.1).

BLUK139-Evans March 5, 2008 16:14
Tab
le1.2
Con
trib
utio
nsof
the
sens
ible
and
late
nthe
ats
toth
eto
tals
peci
fiche
atca
paci
tyof
food
.
Tem
pera
ture
Wa
ter
L(T
)aFo
od
L(T
)bc p
“sen
sib
le’’
c p“l
ate
nt’
’c p
tota
lT
(◦C
)c p
w(k
J/k
g◦ C
)(k
J/k
g)
(kJ/
kg
)x i
(kg
/kg
)(k
J/k
g◦ C
)(k
J/k
g◦ C
)(k
J/k
g◦ C
)
204.
182c
0.00
03.
747d
0.00
03.
747d
154.
186c
0.00
03.
742d
0.00
03.
742d
104.
192c
0.00
03.
739d
0.00
03.
739d
54.
202c
0.00
03.
735d
0.00
03.
735d
0(w
ater
)4.
217c
0.00
03.
730d
0.00
03.
730d
0(ic
e)2.
06e
333.
633
40.
000
3.73
0d0.
000
3.73
0d
−133
20.
000
3.77
019
9.23
203.
00−2
330
0.37
53.
765
49.5
053
.26
−530
8.5
323
0.60
03.
762
7.77
11.5
3−1
028
4.8
313
0.67
53.
761
1.88
5.64
−15
261.
630
20.
700
3.76
10.
814.
57−2
01.
94e
241.
429
10.
713
3.76
00.
444.
20−2
2f23
4.8
287
0.71
63.
760
0.36
4.12
−40
1.82
e24
50.
731
3.75
90.
093.
85−6
01.
68e
196
0.73
83.
761
0.03
3.79
−80
1.54
e14
30.
741
3.76
10.
013.
77−1
001.
39e
870.
743
3.76
10.
013.
77
Not
e:Va
lues
used
ineq
uatio
n(1
.1):
x w=
0.8,
x u=
0.05
,T f
=−1
◦ C.
Valu
esus
edin
equa
tion
(1.3
):c w
(t)=
0.00
3019
T2
+0.
0586
T+
4.28
5,m
ean
valu
esfo
rsu
perc
oole
dw
ater
,Ras
mus
sen
etal
.(19
73).
Sour
ces:
aD
orse
y(1
940)
,p.6
17.
bRi
edel
(197
8).L
(T)=
334.
1+
2.05
T−
0.00
419
T2.
cKa
yean
dLa
by(1
986)
,p.5
8.d
CO
STH
ERM
prog
ram
with
x w=
0.8,
x pro
tein
=0.
05,
x car
bohy
drat
e=
0.07
5,x f
at=
0.07
5.e
Inte
rnat
iona
lCrit
ical
Tabl
es(1
933)
.ci(t
)=0.
0067
T+
2.07
3.fTr
iple
poin
tofw
ater
/ice
I/ic
eIII
.
13

BLUK139-Evans March 5, 2008 16:14
14 Frozen Food Science and Technology
0
50
100
150
200
250
300
350
400
−45 −35 −25 −15 −5 5
Temperature (°C )
Ent
halp
y (k
J/kg
)
Fig. 1.8 Enthalpy of food as a function of temperature, calculated with Tf = −1◦C, xw = 0.8, xprotein =0.05, xfat = 0.075, xcarbohydrate = 0.075 and xu = 0.05.
1.4.2 Enthalpy
Enthalpy H is the heat content taken with reference to a convenient fixed temperature Tref,usually −40◦C (below the range of temperatures usually considered in modelling the be-haviour of frozen foods, or 0◦C or sometimes the initial freezing point temperature Tf wherethe change of slope occurs between the frozen and unfrozen ranges, Fig. 1.8). Enthalpy is theintegral of the function cp between Tref and a given temperature:
H (T ) =∫ T
Tref
cp(T ′)dT ′ (1.4)
The function H (T ) is more suitable than cp(T ) for use in computer modelling programsbecause it does not have the sharp peak at Tf. Using the enthalpy method helps us bypassthe problem of ‘jumping’ the peak when advancing the time to the next level in numericalsolutions of the heat equation (Albasiny, 1956).
1.4.3 Thermal conductivity
Thermal conductivity of water-containing food is again dominated by the contribution ofwater and ice, because these have higher thermal conductivities than the food matrix (the drymatter) (Wang and Brennan, 1992). Table 1.3 shows the values of thermal conductivity ofwater and ice at normal pressure. In comparison, the thermal conductivities of proteins, fatsand carbohydrates are significantly smaller, in the range 0.17–0.20 W/(m K) at 0◦C (Choiand Okos, 1986).
To estimate the values of thermal conductivity of frozen foods, some assumptions andapproximations must be made about the structure of the food and the disposition of thevarious components dispersed in the food, including any air spaces in porous foods, andthe direction (parallel or perpendicular) of heat flow relative to the layers of the compo-nents. The simplified models for this are the parallel, perpendicular and dispersed spheres

BLUK139-Evans March 5, 2008 16:14
Thermal Properties and Ice Crystal Development in Frozen Foods 15
Table 1.3 Thermal conductivity k of water and ice at normalpressure (1 bar).
Temperature (◦C) k (W/(m K)) Reference
40 0.620 a20 0.587 a10 0.620 a
0 (water) 0.554 a0 (ice) 2.25 b
−10 2.35 c−15 2.41 c−20 2.47 c−40 2.73 c−50 2.85 b
−100 3.95 b−150 5.70 b
Sources:aInternational Critical Tables (1933) k = 0.587{1 + 0.00281∗
(T − 20)} 0 < T < 80◦C.bRatcliffe (1962) ‘most probable’ values from measured datacRatcliffe (1962) fitted function k = 780/Tk − 0.615(Tk > 120 K is tem-perature in kelvin).
(Maxwell–Eucken models (Eucken 1932, 1940; Miles et al., 1983; Miles and Morley, 1997)).Figure 1.9 shows the thermal conductivity of food calculated using the parallel model andassuming that the major phase is aqueous binary solution of the same composition and initialfreezing point as described in Section 1.4.1. The parallel model has the form
k =∑ εi
ki(1.5)
where εi = ρ(xi/ρi) is the volume fraction of the components of the food with overall densityρ (Miles et al., 1983). More complex modelling requires numerical methods for the solutionof heat flow equation in dispersed systems (Sakiyama et al., 1990).
0
0.5
1
1.5
2
2.5
−40 −35 −30 −25 −20 −15 −10 −5 0 5
Temperature (°C)
Therm
al c
ond
uctiv
ity (
W/(
m K
))
Fig. 1.9 Thermal conductivity of food as a function of temperature, calculated with Tf = −1◦C, xw =0.8, xprotein = 0.05, xfat = 0.075, xcarbohydrate = 0.075 and xu = 0.05.
BLUK139-Evans March 5, 2008 16:14
16 Frozen Food Science and Technology
1.4.4 Density
Water expands by about 10% on freezing and thus with increasing amount of ice formedbelow the initial freezing point, the food tends to expand (its density decreases, Fig. 1.6) astemperature decreases. This creates thermal stresses and can lead to cracks in the food as thecentre freezes last, expands and exerts pressure on the surrounding frozen region.
The basic method of measurement of density is from volume and mass, using a densitybottle (pyknometer) for solids and fluids. There is a distinction between bulk and density(assembly of particles, e.g. peas of homogeneous product – density of one pea) and for suchassemblies a suitable displacement method determines the volume (Mohsenin, 1970).
1.4.5 Thermal diffusivity
Thermal diffusivity, a = k/(ρ · cp), is easier to measure than thermal conductivity k andspecific heat capacity cp (Eunson and Nesvadba, 1984). Therefore thermal conductivity canbe indirectly determined using thermal diffusivity if the specific heat capacity and densityare known, using the equation k = ρ · a · cp (Nesvadba, 1982).
1.4.6 Surface heat transfer coefficient
For modelling of food freezing (for example, predicting the freezing or thawing times), apartfrom the thermal properties of the food it is necessary to have an estimate of the surfaceheat transfer coefficient. The surface heat transfer coefficient h is not an intrinsic property ofthe food, but reflects the conditions at the boundary between the food and the external heattransfer medium. It is very important in heat transfer calculations (Hallstrom et al., 1988).Uncertainties in the surface heat transfer coefficient are usually greater than uncertainties inthermal properties of foods and propagate into the calculated temperatures to a greater extent(Meffert, 1983).
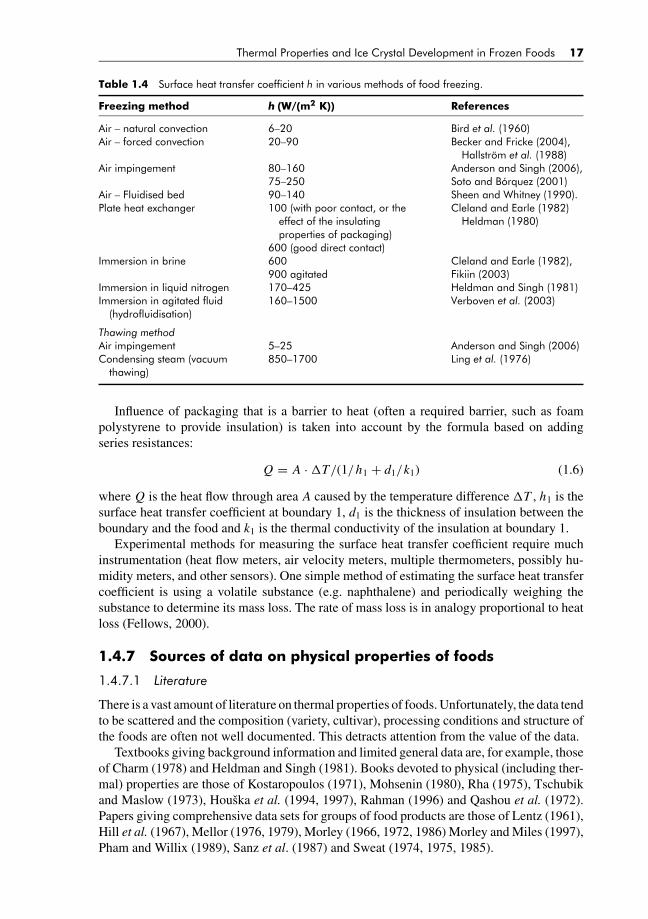
In freezing by an external medium (for example, cold air blowing over the food) the rateof heat transfer from the food to the medium depends on the velocity of the moving medium,the shape and surface roughness of the food and other factors. The various factors are verydifficult to account for mathematically and instead their overall effect is quantified by thesurface heat transfer coefficient h, defined by q = h(Ts − Te), where q (W/m2) is the heattransferred per unit area of the food surface per unit time and Ts and Te are the temperaturesof the food surface and the medium, respectively. The dimension of h is therefore W/(m2 K).Table 1.4 gives the value of h for various types of freezing.
The surface heat transfer coefficient is correlated with the parameters of the flow ofthe external heat transfer medium through similarity relationships, involving dimensionlessReynolds (Re) and Nusselt (Nu) numbers and their correlations (Krokida et al., 2002; Zogzaset al., 2002). Over 400 equations relevant to food processing have been collected in the EUPECO project by van Beek, VeerKamp, and Pol (1997), which make the basis of the predictivesoftware program SURFHEAT (Liu et al., 1997). It was apparent that it is difficult to determinethe values of h experimentally because different laboratories obtained different values fornominally the same experimental conditions. Similarly, in industry it is not possible to predictthe average value of h without referring to a particular plant as the turbulence and velocityof air can vary. For this reason h is usually determined as a fitting parameter minimisingthe difference between experimental and measured temperatures (Everington, 1997). Having‘calibrated’ the particular plant, the derived value of h can then be used for calculations fora different food product.
BLUK139-Evans March 5, 2008 16:14
Thermal Properties and Ice Crystal Development in Frozen Foods 17
Table 1.4 Surface heat transfer coefficient h in various methods of food freezing.
Freezing method h (W/(m2 K)) References
Air – natural convection 6–20 Bird et al. (1960)Air – forced convection 20–90 Becker and Fricke (2004),
Hallstrom et al. (1988)Air impingement 80–160
75–250Anderson and Singh (2006),Soto and Borquez (2001)
Air – Fluidised bed 90–140 Sheen and Whitney (1990).Plate heat exchanger 100 (with poor contact, or the
effect of the insulatingproperties of packaging)
600 (good direct contact)
Cleland and Earle (1982)Heldman (1980)
Immersion in brine 600900 agitated
Cleland and Earle (1982),Fikiin (2003)
Immersion in liquid nitrogen 170–425 Heldman and Singh (1981)Immersion in agitated fluid
(hydrofluidisation)160–1500 Verboven et al. (2003)
Thawing methodAir impingement 5–25 Anderson and Singh (2006)Condensing steam (vacuum
thawing)850–1700 Ling et al. (1976)
Influence of packaging that is a barrier to heat (often a required barrier, such as foampolystyrene to provide insulation) is taken into account by the formula based on addingseries resistances:
Q = A · �T/(1/h1 + d1/k1) (1.6)
where Q is the heat flow through area A caused by the temperature difference �T , h1 is thesurface heat transfer coefficient at boundary 1, d1 is the thickness of insulation between theboundary and the food and k1 is the thermal conductivity of the insulation at boundary 1.
Experimental methods for measuring the surface heat transfer coefficient require muchinstrumentation (heat flow meters, air velocity meters, multiple thermometers, possibly hu-midity meters, and other sensors). One simple method of estimating the surface heat transfercoefficient is using a volatile substance (e.g. naphthalene) and periodically weighing thesubstance to determine its mass loss. The rate of mass loss is in analogy proportional to heatloss (Fellows, 2000).
1.4.7 Sources of data on physical properties of foods
1.4.7.1 Literature
There is a vast amount of literature on thermal properties of foods. Unfortunately, the data tendto be scattered and the composition (variety, cultivar), processing conditions and structure ofthe foods are often not well documented. This detracts attention from the value of the data.
Textbooks giving background information and limited general data are, for example, thoseof Charm (1978) and Heldman and Singh (1981). Books devoted to physical (including ther-mal) properties are those of Kostaropoulos (1971), Mohsenin (1980), Rha (1975), Tschubikand Maslow (1973), Houska et al. (1994, 1997), Rahman (1996) and Qashou et al. (1972).Papers giving comprehensive data sets for groups of food products are those of Lentz (1961),Hill et al. (1967), Mellor (1976, 1979), Morley (1966, 1972, 1986) Morley and Miles (1997),Pham and Willix (1989), Sanz et al. (1987) and Sweat (1974, 1975, 1985).

BLUK139-Evans March 5, 2008 16:14
18 Frozen Food Science and Technology
1.4.7.2 Equations and software for predicting thermal properties of foods
Several computer programs are available for estimating the thermal properties of foodsfrom their proximate chemical composition and density. The most widely distributed isCOSTHERM. Hans Pol of the Spelderholt Institute in the Netherlands wrote the first versionof this program based on the work of Miles et al. (1983) during the EU project COST90.Miles and Morley (1997) updated COSTHERM in the EU project CIPA-CT93-0240. Theyre-examined the models for thermal conductivity and the initial freezing point. The accuracyof the predictive equations is about ±10%, sufficient for most food engineering calculations.The predictive equations are valid over the temperature range from –40◦C to about +90◦C.
1.4.7.3 Offline and online databases of physical properties of foods
Adam (1969) published the first major bibliography resulting from accumulation of data onphysical properties of agro-food materials. The European effort included the EU concertedaction projects COST90 and COST90bis (Jowitt et al., 1983). Further work by Houska etal. (1994, 1997) has consolidated the methods of measurement and predictive equationsrelating the physical properties of agro-food materials to the composition and structure ofthe materials and their processing conditions. Singh (1995) has produced predictive softwarecontaining a database, available as a PC program. A larger database has been constructed byNesvadba et al. (2004) and is available at www.nelfood.com.
1.4.7.4 Measurements of physical properties of foods relevant to freezing
Measurements (as opposed to modelling) are the primary source of data. Nesvadba (1982)and Ohlsson (1983) reviewed the measurement techniques for thermal properties of foods.Other transient techniques are still being developed, evaluated and standardised (Evitherm,2003).
1.4.7.4.1 Measurement of specific heat capacity and enthalpyFor direct measurement of specific heat capacity or enthalpy some form of calorimetry(Riedel, 1957, 1978) has to be used. DSC is a convenient and rapid technique for measuring thespecific heat capacity and phase transitions of small samples (up to 50 mg). Inhomogeneousfoods must be homogenized in order to obtain homogeneous samples and valid analyticalmeasurements. Fortunately, homogenisation is usually possible because, unlike for thermalconductivity, altering the structure of the food (pore size, direction of tissue fibres) does notalter the specific heat capacity and latent heat. For small sample sizes (5–50 mg) the DSCgives reliable results rapidly. For larger samples (order of 100 g) adiabatic calorimetry is usedwith ‘home made’ (Lindsay and Lovatt, 1994) or commercial (Patrick, 2002) equipment.
1.4.7.4.2 Measurement of thermal conductivityMeasurements of thermal conductivity using steady state methods take considerable timesto equilibrate and although they have been used (Lentz, 1961; Willix et al., 1998) transienttechniques are preferred, of which the heated needle probe (Sweat, 1985) and the heatedplane source (Gustafsson, 1991) are the most useful methods for foods.
Figure 1.10 shows the heated probe method. After applying electric current to the heater,the temperature rise of the heated needle, when plotted against logarithm of time, is inverselyproportional to the thermal conductivity of the food in which the needle is placed. Care has tobe taken that the mathematical assumption of infinitely thin and long probe is satisfied (diam-eter should be at least 100 times smaller than the length of the probe (Salmon et al., 2003)).

BLUK139-Evans March 5, 2008 16:14
Thermal Properties and Ice Crystal Development in Frozen Foods 19
Heater
Thermocouple junction
Power supply
Voltmeter
Switch
Computer
Needle probe sheath
Fig. 1.10 Heated needle probe for thermal conductivity measurements. Thermocouple junction situatedat the middle of a long needle probe senses the temperature rise of the needle after switching on the heater.
1.4.7.4.3 Measurement of other relevant properties1.4.7.4.3.1 Water content. This is very important in foods and is usually determined gravi-metrically, although there exists a range of various other methods, surveyed by Steele andDang (1983).
1.4.7.4.3.2 Initial freezing point. This determines one of the ‘anchor points’ in the graphsof the thermal properties (Figs. 1.3 and 1.6–1.9). The freezing point is surprisingly difficult tomeasure. The problem is supercooling when approaching Tf from above and non-equilibriumeffects in water re-absorption when approaching Tf from below. Fennema (1973) discusses themethods used to extrapolate Tf from freezing curves. The official AOAC method for productssuch as milk uses the cryoscope, satisfying EC regulations for milk. DSC is a convenientmethod of determining the freezing point but it is expensive and also requires extrapolation.
1.5 APPLICATION OF PHYSICAL PRINCIPLES
Understanding of the physical phenomena of heat and mass transfer and ice formation infood freezing often provides immediate pointers to rapid solutions to problems or answers toquestions arising in the frozen food industry. The knowledge of numerical values of thermalproperties of foods and the surface heat transfer coefficient enables prediction (modelling)of freezing times and refrigeration energy loads.
Figure 1.5 shows an example of the usefulness of physics in aiding understanding offood freezing and thawing. Frozen food is about three times a better conductor of heat thanunfrozen food. During freezing a well-conducting external layer is created. During thawingthe opposite takes place: a poorly conducting region is created. This is one reason why thawingis much more difficult than freezing. The other reason is that during freezing, temperaturedifferences between the surface of the food and the external (cooling) medium can be higherthan in thawing.
BLUK139-Evans March 5, 2008 16:14
20 Frozen Food Science and Technology
Recognition of the water content as the main determinant of the amount of heat requiredto be removed during freezing and the fact that freezing time increases with the square ofproduct thickness are often good starting points for troubleshooting in the industry. Thefrozen food industry needs to predict freezing and thawing times of products that are newlyformulated, or have new dimensions or composite or layered structure (such as meat piesor ready meals). The knowledge of physical principles of freezing enables estimation ofthe power or energy required to freeze or thaw given amounts of food in given time and todesign freezers, thawers and other equipment used in frozen food technology. The necessarycalculations involve some kind of modelling of the food processing operation. These couldbe simple analytical models, but due to the temperature dependence of thermal propertiesin the freezing range it is usually necessary to use some form of numerical solution of theheat conduction equation. This can be provided by a range of ‘solvers’, from simple finitedifference algorithms to large commercial packages designed to cope with many situations.
HEATSOLV (Nesvadba, 1997) is an example of a simple program predicting food tem-peratures during freezing and thawing. An example of a large CFD (Computation FluidDynamics) package is COMSOL (2007). There are many other programs available, aimed atboth commercial and research markets (see Chapter 3).
In modelling the heat transfer it is necessary to determine the sensitivity of the predictedtemperatures to uncertainties in thermal properties and in the surface heat transfer coefficient.Often it is the surface heat transfer coefficient that carries the greatest uncertainty becausethe conditions on the boundary between the food and the external medium are difficult toquantify (Nicolaı and Baerdemaeker, 1996).
Modelling is of great value even if the surface heat transfer is not known a priori, be-cause the model can be ‘calibrated’ by repeated comparisons between the predicted andexperimentally measured temperatures in the food being processed.
REFERENCES
Adam, M. (1969). Bibliografie fyzikalnıch vlastnostı potravin [Bibliography of physical properties of food-stuffs]. Prague: VUPP – Food Research Institute, 1969.
Albasiny, E.L. (1956). The solution of non-linear heat conduction problems on the Pilot Ace. Conventionon digital computer techniques, The Institution of Electrical Engineers, 9–13 April, 1956. Woking andLondon: Unwin Brothers Ltd, p. 5.
Anderson, B.A. and Singh, R.P. (2006). Effective heat transfer coefficient measurement during air impinge-ment thawing using an inverse method. International Journal of Refrigeration 29(2), 281–293.
Anese, M. and Gormley, R. (1996). Effects of dairy ingredients on some chemical, physico-chemical andfunctional properties of minced fish during freezing and frozen storage, Lebensmittel Wissenschaft undTechnologie, 29, 151–157.
Angell, C.A. (1982). Supercooled water. In: F. Franks, ed. Water – A Comprehensive Treatise, Vol. 7, Waterin Aqueous Solutions at Subzero Temperatures. New York: Plenum Press, pp. 1–81.
Arakawa, T. and Timasheff, S.N. (1985). The stabilization of proteins by osmolytes. Biophysical Journal 47,411–414.
Bald, W.B. (1991). Ice crystal formation in idealised freezing systems. In: W.B. Bald, ed. Food Freezing:Today and Tomorrow. London: Springer-Verlag, pp. 67–80.
Becker, B.R. and Fricke, B.A. (2004). Heat transfer coefficients for forced-air cooling and freezing of selectedfoods. International Journal of Refrigeration 27(5), 540–551.
Bird, R.B., Stewart, W.E. and Lightfoot, E.N. (1960). In: Transport Phenomena. New York and London: JohnWiley.
Blanshard, J.M.V. and Franks, F. (1987). Ice crystallization and its control in frozen food systems. In: J.M.V.Blanshard and P. Lillford, eds. Food Structure and Behaviour London: Academic Press, pp. 51–56.
Bøgh-Sørensen, L. et al., eds. (International Institute of Refrigeration) (2007). Recommendations for theProcessing and Handling of Frozen Foods (“The Red Book”), 4th edn. Paris: IIR/IIF.

BLUK139-Evans March 5, 2008 16:14
Thermal Properties and Ice Crystal Development in Frozen Foods 21
Buttkus, H. (1970). Accelerated denaturation of myosin in frozen solution. Journal of Food Science 32,558–652.
Carpenter, J.F. and Crowe, J.H. (1988). The mechanism of cryoprotection of proteins by solutes. Cryobiology25, 244–255.
Charm, S.E. (1978), The Fundamentals of Food Engineering, 3rd edn. Westport, Connecticut, USA: AVIPublishing Company Inc.
Cheftel, J.C., Thiebaud, M. and Dumay, E. (2002). Pressure-assisted freezing and thawing: a review of recentstudies. High Pressure Research 22, 601–611.
Choi, Y. and Okos, M.R. (1986). Effects of temperature and composition on the thermal properties of foods. In:M. Le Maguer and P. Jelen, eds. Food Engineering and Process Applications, Vol. 1, Transport Phenomena.New York: Elsevier, pp. 93–101.
Cleland, A.C. and Earle, R.L. (1982). Freezing time prediction for foods – a simplified procedure. InternationalJournal of Refrigeration 5(3), 134–140.
COMSOL (2007). Multiphysics Modelling by COMSOL, http://www.comsol.com.Connell, J.J. (1959). Aggregation of myosin during frozen storage. Nature 183, 664–665.Daschner, F. and Knochel, R. (2003). Dielectric microwave sensors with multivariate calibration. Advances
in Radio Science 1, 9–13.Dorsey, N.E. (1940). Properties of Ordinary Water Substance. New York: Reinhold. [Citing on page 617
compilation by R. de Forcrand and L. Gay (1929) and observations by H.C. Dickinson and N.S. Osborne(1915)].
Everington, D.W. (1997). The commercial use of COSTHERM and HEATSOLV in the selection of freezingplant. In: Modelling of Thermal Properties and Behaviour of Foods During Production, Storage andDistribution. Proceedings of a conference, Prague, June, 1997, Food Research Institute Prague. pp. 28–33.
Evitherm (2003). Virtual Institute for Thermal Metrology. http://www.evitherm.org.Eucken, A. (1932). Die Warmeleitfahigkeit keramischer feuerfest Stoffe. Ihre Berechnung aus der
Warmeleitfahigkeit der Betstandteile. (Thermal conductivity of ceramic refractory materials. Its Calcula-tion from the Thermal Conductivity of Constituents), Forschung auf dem Gebiete des Ingenieurwesens,3B, VDI-Forschungsheft No. 353, VDI Verlag, Dusseldorf, March–April 1932, p. 16.
Eucken, A. (1940). Allgemeine Gesetzmassig keiten fur das Warmeleitvermogen veschiedener Stoffartenund Aggregatzustande, Forschung Gebiete Ingenieurwesens (Ausgabe A), 11, 6.
Eunson, C. and Nesvadba, P. (1984). Moisture and temperature dependence of thermal diffusivity of codminces, Journal of Food Technology, 19, 585–592.
Fellows, P. (2000). Food Processing Technology – Principles and Practice, 2nd edn. Cambridge, UK: Wood-head Publishing.
Fennema, O.R. (1973). Nature of the freezing process. In: O.R. Fennema, W.D. Powrie and E.H. Marth, eds.Low Temperature Preservation of Food and Living Matter. New York: Marcel Dekker, pp. 151–227.
Fennema, O.R. (1985). Water and Ice. In: Food Chemistry, 2nd edn. Marcel Dekker, pp. 23–67.Fikiin, K.A. (2003). Novelties of Food Freezing Research in Europe and Beyond. Published as the European
Commission’s Flair-Flow 4 Programme Synthetic Report, July 2003.Franks, F. (1982). The properties of aqueous solutions at subzero temperatures. In: F. Franks, ed. Water – a
Comprehensive Treatise, Vol. 7, Water in Aqueous Solutions at Subzero Temperatures. New York: PlenumPress, pp. 215–338.
Garside, J. (1987). General principles of crystallization. In: J.M.V. Blanshard and P. Lillford, eds. FoodStructure and Behaviour. London: Academic Press, pp. 35–99.
Goff, H.D. (1994). Measuring and interpreting the glass transition in frozen foods and model systems. FoodResearch International 27, 187–189.
Govindarajan, A.G. and Lindow, S.E. (1988). The size of bacterial ice-nucleation sites measured in situ by radi-ation inactivation analysis. Proceedings of the National Academy of Sciences of the USA, 85(5), 1334–1338.
Gustafsson, S.E. (1991). Transient plane source technique for thermal conductivity and thermal diffusivitymeasurements of solid materials. Rev. Sci. Instrum., 62, 797–804.
Hallstrom, B., Skjoldebrand, C. and Tragardh, C. (1988). Heat Transfer and Food Products. New York:Elsevier Applied Science.
Hansen, E. (2004). Chemical and Physical Changes in Pork during Freezing and Frozen Storage. PhD thesis,Department of Dairy and Food Science, The Royal Veterinary and Agricultural University, Frederiksberg,Denmark.
Hayes, L.J., Diller, K.R. and Lee, H.S. (1984). On the definition of an average cooling rate during cell freezing.Cryoletters 5, 97–110.
Heldman, D.R. (1980). Predicting of Food Freezing Rates. In: Food Process Engineering, Vol. 1, London:Applied Science Publishers Ltd.
BLUK139-Evans March 5, 2008 16:14
22 Frozen Food Science and Technology
Heldman, R.R. and Singh R.P. (1981). Food Process Engineering, 2nd edn., Westport, CT: AVI PublishingCompany.
Herrera, J.R. and Mackie, I.M. (2004). Cryoprotection of frozen-stored actomyosin of farmed rainbow trout(Oncorhynchus mykiss) by some sugars and polyols. Food Chemistry 84 (1) 91–97.
Herrera, J.R. et al. (2000). Inhibition of formaldehyde production in frozen-stored minced blue whiting(Micromesistius poutassou) muscle by cryostabilizers: An approach from the glassy state theory, Journalof Agricultural and Food Chemistry 48, 5256–5262.
Hey, J.M., Mehl, P.M. and MacFarlane, D.R. (1997). A combined DSC-optical video microscope for crys-tallization studies. Journal of Thermal Analysis 49, 991–998.
Hill, J.E., Leitman J.D. and Sunderland, J.E. (1967). Thermal conductivity of various meats. Food Technology21, 1143–1148.
Holland, B., Welch A.A., Unwin, I.D., Buss, D.M., Paul A.A., and Southgate, D.A.T., eds. (1991). McCanceand Widdowsons’ Composition of Foods, 5th edn. Cambridge: The Royal Society of Chemistry and Ministryof Agriculture, Fisheries and Food.
Houska, M., Adam, A., Celba, J., Havlıcek, Z., Jeschke, J., Kubesova, A., Neumannova, J., Pokorny, D.,Sestak, J. and Sramek, P. (1994). Thermophysical and Rheological Properties of Foods – Milk, MilkProducts and Semiproducts. Food Research Institute Prague, 200 p.
Houska, M., Adam, A., Celba, J., Havlıcek, Z., Jeschke, J., Kubesova, A., Neumannova, J., Nesvadba, P.,Pokorny, D., Sestak, J. and Sramek, P. (1997). Thermophysical and Rheological Properties of Foods –Meat, Meat Products and Semiproducts. Food Research Institute Prague, 285 p.
Hsu, C.-L., Heldman, D.R., Taylor, T.A. and Kramer, H.L. (2003). Influence of Cooling Rate on GlassTransition Temperature of Sucrose Solutions and Rice Starch Gel. Journal of Food Science 68(6), 1970–1975.
Jason, A.C. and Richards, J.C.S. (1975). The development of an electronic fish freshness meter. J. Phys. E.Sci. Instrum. 8, 826–830.
Jensen, K.N., Jørgensen, B.M. and Nielsen, J. (2003). Low-temperature transitions in cod and tuna determinedby differential scanning calorimetry. Lebensmittel-Wissenschaft und Technologie 36(3), 369–374.
Jowitt, R., Escher, F., Hallstrom, B., Meffert, H.F. Th., Spiess, W.E.L. and Vos, G., eds. (1983). PhysicalProperties of Foods. London and New York: Applied Science Publishers.
Kalichevsky, M.T., Jaroszkiewicz, E.M., Ablett, S., Blanshard, J.M.V. and Lillford, P.J. (1992). The glasstransition of amylopectin measured by DSC, DMTA and NMR. Carbohydrates and Polymers 18, 77–88.
Kaye, G.W.C. and Laby, T.H. (1986). Tables of Physical and Chemical Constants, 15th edn. London:Longman.
Kent, M. (1975). Fish muscle in the frozen state: time dependence of its microwave dielectric properties.Journal of Food Technology 10, 91–102.
Kent, M., Knochel, R., Daschner, F. and Berger, U.-K. (2001). Composition of foods including added waterusing microwave dielectric spectra. Food Control 12(7), 467–482.
Kent, M., Oehlenschlager, J., Mierke-Klemeyer, S., Knochel, R., Daschner, F. and Schimmer, O. (2004).Estimation of the quality of frozen cod using a new instrumental method. European Food Research andTechnology 219(5) 540–544.
Kent, M., Knochel, R., Barr, U.-K., Tejada, M. and Nunes, L. (2005). A New Method for Measurement of theQuality of Seafood. Shaker Verlag GmbH, Germany.
Kim, Y., Singh, M. and Kays, S.E. (2007). Near-infrared spectroscopic analysis of macronutrients and energyin homogenized meals. Food Chemistry xxx (in press, available online).
Kitamikado, M., Yuan, C.S. and Ueno, R. (1990). An enzymatic method designed to differentiate betweenfresh and frozen-thawed fish. Journal of Food Science 55, 74–76.
Kostaropoulos, A.E. (1971). Die Warme- und Temperaturleitfahigkeit gestrockneter Lebensmittel. [Thermalconductivity and diffusivity of dried foodstuffs]. University of Karlsruhe, Faculty of Chemical Engineering,Dissertation, 1971.
Krivchenia, M. and Fennema, O.R. (1988). Effect of cryoprotectants on frozen turbot fillets and comparisonwith whitefish fillets. Journal of Food Science 53, 1004–1008, 1050.
Krokida, M.K., Zogzas, N.P. and Maroulis, Z.B. (2002). Heat transfer coefficient in food processing: Com-pilation of literature data. International Journal of Food Properties 5(2), 435–450.
Lentz, C.P. (1961). Thermal conductivity of meats, fats, gelatin gels and ice. Food Technology 15, 243–247.Levine, H. and Slade, L. (1988). Principle of “cryostabilization” technology from structure/property relation-
ships of carbohydrate/water systems – A review, Cryo-Letters 9, 21–63.Lindsay, D.T. and Lovatt, S.J. (1994). Further enthalpy values of foods measured by an adiabatic calorimeter.
Journal of Food Engineering 23(4), 609–620.
BLUK139-Evans March 5, 2008 16:14
Thermal Properties and Ice Crystal Development in Frozen Foods 23
Ling, A.C., Lund, D.B. and Lightfoot, E.N. (1976). Estimation of the surface heat transfer coefficient withthe presence of noncondensable gases. Journal of Food Science 41(6), 1345–1348.
Liu, M., Allen, A.R., van Beek, G., Pol, H. and Nesvadba P. (1997). Prediction of the Surface Heat TransferCoefficients in Food Processing using SURFHEAT, in: Proceedings of Conference/Workshop/PracticalInstruction Course Modelling of Thermal Properties and Behaviour of Foods during Production, Storageand Distribution, Prague, 23–25 June, 1997. Published by the Food Research Institute Prague, pp. 72–82.
Love, R.M. (1966). The freezing of animal tissue. In: H.T. Meryman, ed. Cryobiology, New York: AcademicPress, pp. 317–405.
Love, R.M. (1982). Basic Facts about Fish. In: A. Aitken, I.M. Mackie, J.H. Merritt and M.L. Windsor, eds.Fish Handling and Processing, 2nd edn. Edinburgh: Ministry of Agriculture Fisheries and Food, TorryResearch Station, HMSO, pp. 2–19.
MacKenzie, A.P., Derbyshire, W. and Reid, D.S. (1977). Non-equilibrium freezing behaviour of aqueous sys-tems. Philosophical Transactions of the Royal Society of London. Series B, Biological Sciences, 278(959),167–189. Lecture in: A Discussion on Water Structure and Transport in Biology, March 29, 1977, TheRoyal Society, London.
Matsumoto, J.J. and Noguchi, S.F. (1992). Cryostabilization of protein in surimi. In: Lanier, T.C. and Lee,C.M., Editors, 1992. Surimi technology, Marcel Dekker, New York, pp. 357–388.
Mackie, I.M. (1993). The effect of freezing on fish proteins. Food Review International 9, 575–610.Mazur, P. (1970). Cryobiology: The freezing of biological systems. Science 168, 939–949.Mazur, P. (1984). Freezing of living cells: Mechanisms and implications. American Journal of Physiology
247, C125–C142.Meffert, H.F. Th. (1983). History, aims, results and future of thermophysical properties work within COST90.
In: Jowitt R. et al., eds. Physical Properties of Foods, Chapter 15. London and New York: Applied SciencePublishers, pp. 229–267.
Mellor, J.D. (1976). Thermophysical properties of foodstuffs: Introductory Review. Bulletin of the Interna-tional Institute of Refrigeration 56, 51.
Mellor, J.D. (1979). Thermophysical properties of foodstuffs: Part 3 – Measurement. Bulletin of InternationalInstitute of Refrigeration 59, 551–564.
Miles, C.A., van Beek, G. and Veerkamp, C.H. (1983). Calculation of Thermophysical Properties of Foods.In: R. Jowitt, F. Escher, B. Hallstrom, H.F.Th. Meffert, W.E.L. Spiess and G. Vos, eds. Physical Propertiesof Foods. New York: Applied Science Publishers. pp. 269–312.
Miles, C.A. (1991). The thermophysical properties of frozen foods. In: W.B. Bald, ed. Food Freezing: Todayand Tomorrow. London: Springer-Verlag, pp. 45–65.
Miles, C.A. and Morley, M.J. (1997). Estimation of the Thermal Properties of Foods: a Revision of Some of theEquations Used in COSTHERM. In: Proceedings of a Conference/Workshop/Practical Instruction Course:Modelling of Thermal Properties and Behaviour of Foods during Production, Storage and Distribution,23–25 June, 1997, Food Research Institute Prague, pp. 135–143.
Miles, C.A., Mayer, Z., Morley, M.J. and Houska, M. (1997). Estimating the initial freezing point of foodsfrom composition data. International Journal of Food Science & Technology 32, 389–400.
Miles, C.A., Morley, M.J. and Randell, M. (1999). High power ultrasonic thawing of frozen foods. Journalof Food Engineering 39(2), 151–159.
Miller, B.S. and Kaslow, H.D. (1963). Determination of moisture by NMR and oven methods in wheat, flour,doughs and dried fruit. Food Technology 17(5), 142.
Mohsenin, N.N. (1970). Physical Properties of Plant and Animal Materials, Vol. 1. London: Gordon andBreach Science Publishers.
Mohsenin, N.N. (1980). Thermal properties of foods and agricultural materials. New York: Gordon andBreach Science Publishers.
Morley, M.J. (1966). Thermal conductivity of muscle, fats and bones. Journal of Food Technology 1, 303–311.Morley, M.J. (1972). Thermal Properties of Meat – Tabulated Data. Special report No. 1, Agricultural
Research Council, Meat Research Institute, Langford, Bristol.Morley, M.J. (1986). Derivation of physical properties of muscle tissue from adiabatic pressure-induced
temperature measurements. Journal of Food Technology 21, 269–277.Morley, M.J. and Miles, C.A. (1997). Modelling the thermal conductivity of starch-water gels. Journal of
Food Engineering 33, 1–14.Nesvadba, P. (1982). Methods for the measurement of thermal conductivity and diffusivity of foodstuffs.
Journal of Food Engineering 1, 93–113.Nesvadba, P. (1997). Results of the EU PECO project “Modelling of Thermal Properties and Behaviour of
Foods during Production, Storage and Distribution”, In: P. Nesvadba and M. Houska, eds. Proceeding of
BLUK139-Evans March 5, 2008 16:14
24 Frozen Food Science and Technology
a Conference/Workshop/Practical Instruction Course: Modelling of Thermal Properties and Behaviour ofFoods during Production, Storage and Distribution, Prague, 23–25 June, 1997, Food Research InstitutePrague, pp. 155–161.
Nesvadba, P., Houska, M., Wolf, W., Gekas, V., Jarvis, D., Sadd, P.A. and Johns, A.I. (2004). Database ofPhysical Properties of Agro-Food Materials. Journal of Food Engineering 61(4), 497–503.
Nicolaı, B.M. and De Baerdemaeker, J. (1996). Sensitivity Analysis with Respect to the Surface Heat TransferCoefficient as Applied to Thermal Process Calculations. Journal of Food Engineering 28, 21–33.
Novikov, V.M. (1971). Production of frozen fish. In: V.M. Novikov, Trn. from Russian. Handbook of Fish-ery Technology, Vol. 1. [Spravochnik Tekhnologa Rybnoi Promyshlennosti., Moscow, 1971.]. New Delhi:Amerind Publishing, pp. 267–390.
Ohlsson, T. (1983). The Measurement of Thermal Properties. In: R. Jowitt, F. Escher, B. Hallstrom, H.F.Th.Meffert, W.E.L. Spiess and G. Vos, eds. Physical Properties of Foods. London and New York: AppliedScience Publishers, pp. 313–328.
Oosterhuis, J.J. (1981). Double freezing of plaice. Voedingsmiddelentechnologie 14(2), 11–15.Orlien, V. (2003). The Glass Transition Hypothesis – Significance for Chemical Stability in Food Systems.
PhD thesis, Department of Dairy and Food Science, The Royal Veterinary and Agricultural University,Frederiksberg, Denmark.
Orlien, V., Risbo, J., Mogens, L., Andersen, M.L. and Skibsted, L.H. (2003). The Question of High- or Low-Temperature Glass Transition in Frozen Fish. Construction of the Supplemented State Diagram for TunaMuscle by Differential Scanning Calorimetry. Journal of Agricultural and Food Chemistry 51(1), 211–217.
Patrick, A. (2002). Thermal Properties of Food Materials. T 2 PAC News (Temperature and ThermophysicalProperties Awareness Club of the National Physical Laboratory, UK), Issue 14, Spring 2002, 7–9. Down-loadable from http://www.npl.co.uk/tman/newsletters/t2pac newsletters archive/downloads/issue14.pdf
Pham, Q.T. and Willix, J. (1989). Thermal conductivity of fresh lamb meat, offals and fat in the range −40to +30◦C: measurements and correlations. Journal of Food Science 54(3), 508–515.
Pippard, A.B. (1961). Elements of classical thermodynamics. Cambridge: Cambridge University Press.Qashou, M.S., Vachou, R.I. and Touloukian, Y.S. (1972). Thermal conductivity of foods. Transactions of
ASHRAE 78, 165.Rahman, M.S. (1996). Food Properties Handbook. Boca Raton, FL: CRC Press.Rahman, M.S. (2006). State diagram of foods: Its potential use in food processing and product stability.
Trends in Food Science & Technology 17, 129–141.Rasmussen, D.H., MacKenzie, A.P., Angell, C.A. and Tucker, J.C. (1973). Anomalous heat capacities of
supercooled water and heavy water. Science 181, 342–344.Ratcliffe, E.H. (1962). The Thermal Conductivity of Ice: New Data on the Temperature Coefficient. Philo-
sophical Magazine 79, 1197–1203.Rehbein, H. (1992). Physical and biochemical methods for the differentiation between fresh and frozen-
thawed fish or fillets. Italian Journal of Food Science 4, 75–86.Reid, D.S. (1990). Optimizing the quality of frozen foods. Food Technology 44(7), 78–82.Reid, D.S., Kerr, W., and Hsu, J. (1994). The glass transition in the freezing process, Journal of Food
Engineering 22, 483–494.Reid, D.S., Hsu, J., and Ju, J. (1995). The importance of the glass transition to the temperature dependence
of the stability of frozen foods. In: The Proceedings of the 19th International Congress on Refrigeration,The Hague, Netherlands, Vol. 2, Paris: International Institute of Refrigeration, pp. 331–338.
Rey-Mansilla, M.D., Sotelo, C.G., Aubourg, S.P., Rehbein, H., Havemeister, W., Jørgensen, B.M. and Nielsen,M.K. (2001). Localization of formaldehyde production during frozen storage of European hake (Merlucciusmerluccius). European Food Research and Technology 213(1), 43–47.
Rha, C.K. (1975). Theory, determination and control of physical properties of food materials. Dordrecht,Holland: D. Reidel Publishing Company.
Riedel, L. (1957). Kalorimetrische Untersuchungen uber das Gefrieren von Fleisch. Kaltetechnik 9(2), 38–40.Riedel, L. (1978). Eine Formel zur berechnung der Enthalpie Fettarmer Lebensmittel in Abhangigkeit von
Wassergehalt und Temperatur. Chemie Mikrobiologie Technologie der Lebensmittel 5(5), 129–133.Roos, Y.H. (1992). Phase transitions and transformations in food systems. In: D.R. Heldman and D.B. Lund,
eds. Handbook of Food Engineering. New York: Marcel Dekker, p. 145.Roos, Y.H. (1995). Phase Transitions in Foods. London: Academic Press.Roos, Y.H. and Karel, M. (1991). Applying state diagrams to food processing and product development, Food
Technology 45 (12) 66–71.Sakiyama, T., Matsushita, Y., Shiinoki, Y. and Yano, T. (1990). Finite-element analysis on the effective thermal
conductivity of dispersed systems of spheres of various sizes. Journal of Food Engineering 11(4), 317–331.

BLUK139-Evans March 5, 2008 16:14
Thermal Properties and Ice Crystal Development in Frozen Foods 25
Salfi, V., Fucetola, F. and Pannunzio, G. (1986). A micromethod for the differentiation of fresh from frozenfish muscle. Journal of Food Science and Agriculture 36, 811–814.
Salmon, D., Hammerschmidt, U., van Haneghem, I.A., Kubicar, L., Gustafssson, S. and Tye, R. (2003). DraftStandard Test Protocol for Measurement of Thermophysical Properties of Materials using Contact Tran-sient Methods based on a Common Principle. National Physical Laboratory, Teddington, Middlesex, UK.
Sanz, P.D., Alonso, M.D. and Mascheroni, R.H. (1987). Thermophysical properties of meat products: Generalbibliography and experimental values. Transactions of ASAE 30 (1), 283–289, 296.
Saunders, M., Podluii, K., Shergill, S., Buckton, G. and Royall, P. (2004) The potential of high speed DSC(Hyper-DSC) for the detection and quantification of small amounts of amorphous content in predominantlycrystalline samples, International Journal of Pharmaceutics 274, 35–40.
Sheen, S. and Whitney, L.F. (1990). Modelling heat transfer in fluidized beds of large particles and itsapplications in the freezing of large food items. Journal of Food Engineering 12(4), 249–265.
Singh, R.P. (1995). Food Properties Database. Version 2.0 for WindowsTM. 2nd edn, Boca Raton, FL: CRCPress.
Slade, L. and Levine, H. (1991). Beyond water activity: Recent advances based on an alternative approach tothe assessment of food quality and safety. In: F.M. Clydesdale, ed. Critical Reviews in Food Science andNutrition, Vol. 30. Boston: CRC Press, pp. 115–359.
Slade, L., Levine, H., Ievolella, J. and Wang, M. (1993). The glassy state phenomenon in applications forthe food industry: Application of the food polymer science approach to structure-function relationships ofsucrose in cookie and cracker systems. J. Sci. Food Agric. 63, 133–176.
Smith, C.E. and Schwartzberg, H.G. (1985). Ice crystal size changes during ripening in freeze concentration.Biotechnology Progress 1, 111–120.
Soto, V. and Borquez, R. (2001). Impingement jet freezing of biomaterials. Food Control 12, 512–522.Sperling, L.H. (1986). Introduction to Physical Polymer Science. New York: John Wiley.Steele, D.J. and Dang, N.D.P. (1983). Instrumental methods for the measurement of moisture content in
foods: A survey of techniques and application. Scientific and Technical Survey No. 136, Leatherhead FoodResearch Association, Leatherhead, UK.
Sweat, V.E. (1974). Experimental values of thermal conductivity of selected fruits and vegetables. Journal ofFood Science 39, 1080–1083.
Sweat, V.E. (1975). Modelling of thermal conductivity of meats. Transactions of ASAE 18, 564–568.Sweat, V.E. (1985). Thermal properties of low- and intermediate-moisture food. Transactions of ASHRAE
91(2A), 369–389.Tamiya, T., Okahashi, N., Sakuma, R., Aoyama, T., Akahane, T. and Matomoto, J. (1985). Freeze denaturation
of enzymes and its prevention with additives. Cryobiology 22, 446–456.Trout, G.R. (1988). Techniques for measuring water-binding capacity in muscle foods – a review of method-
ology. Meat Science 23, 235–232.Tschubik, I.A. and Maslow, A.M. (1973). Warmephysikalische Konstanten von Lebensmitteln und Halbfab-
rikaten 1st edn. [Thermophysical Properties of Foodstuffs and Semi-Products, Translation from Russian].Leipzig: VEB Fachbuchverlag.
van Beek, G., VeerKamp, C.H., and Pol, H. (1997). Database of Surface Heat Transfer Coefficient Equations.Progress report of the EU PECO Project CIPA-CT93-0240 Modelling of Thermal Properties and Behaviourof Foods during Production, Storage and Distribution, European Commission, Brussels.
Verboven, P., Scheerlinck, N. and Nicolaı, B.M. (2003). Surface heat transfer coefficients to stationary spheri-cal particles in an experimental unit for hydrofluidisation freezing of individual foods. International Journalof Refrigeration 26(3), 328–336.
Wang, N. and Brennan, J.G. (1992). Thermal conductivity of potato as a function of moisture content. Journalof Food Engineering 17(2), 153–160.
White, G.W. and Cakebread, S.H. (1966). The glassy state in certain sugar-containing food products. Journalof Food Technology 1, 73–82.
Willix, J., Lovatt, S.J. and Amos, N.D. (1998). Additional thermal conductivity values of foods measured bya guarded hot plate. Journal of Food Engineering 37, 159–174.
Wunderlich, B. (1981). The basis of thermal analysis. In: E.A. Turi, ed. Thermal Characterization of PolymericMaterials, Chapter 2. New York: Academic Press. pp. 91–234.
Zogzas, N.P., Krokida, M.K., Michailidis, P.A. and Maroulis, Z.B. (2002). Literature data of heat transfercoefficients in food processing. International Journal of Food Properties 5(2), 391–417.
BLUK139-Evans January 23, 2008 17:24
2 Effects of Freezing on Nutritional andMicrobiological Properties of Foods
Mark Berry, John Fletcher, Peter McClure and Joy Wilkinson
2.1 INTRODUCTION
Freezing is a food preservation method that can potentially deliver a high degree of safety,nutritional value, sensory quality and convenience. The original advantages of freezing,compared to other preservation methods, were mainly in providing better quality vegetables,fish and meat at times and places distant from the point of harvest and slaughter. In addition toits value as a preservation method, freezing can supply pleasurable eating experiences. Thisis exemplified in ice cream, a product whose origins can be traced back to the seventeenthand eighteenth centuries where it was served as a luxury to the aristocracy (Clark, 2004), andwhich is now a global player in the frozen foods market. Although there is a legal definitionfor ‘ice cream’ in many countries, the authors are using a broader (more colloquial) use ofthe term to include ice cream, sorbets, water ices etc.
In the past, most frozen foods would have been cooked before consumption, providingan important contribution to microbiological safety. More recently, the focus has shifted toconvenience and a much wider range of foods are available, many that have been specificallydesigned to be preserved and distributed in the frozen state. These more ‘modern’ frozen foodsmay be pre-cooked meal components and whole meals that simply have to be re-heated beforeconsumption. In addition, many frozen cakes and desserts (including ice cream) are designedto be eaten on thawing or directly from the freezer without any consumer cooking step. Theremoval of any consumer cooking step has therefore made microbiological safety an essentialpre-requisite prior to freezing and determines processes before and during freezing. However,nutritional quality is an increasing concern for consumers and the challenge for the frozenfood industry is to maximise the retention of nutrients without compromising microbiologicalsafety.
The essential step in freezing is to lower the temperature of foods with the intention ofpreventing, or at least minimising, microbial and chemical changes. However, as noted inother chapters of this book, the freezing of natural and fabricated foods results in complexphysical and chemical changes. In summary, as the temperature is reduced below 0◦C thewater in foods begins to be converted into ice. As a result of this, the dissolved solutes becomeincreasingly concentrated in the remaining liquid water, thereby further lowering its freezingpoint. Depending on their physical structure and chemical composition, natural foods in thefrozen state may contain up to 8% water in the liquid phase. This liquid phase contains a com-plex mixture of cellular metabolites at non-physiologically high concentration. Furthermore,as ice crystals grow in natural food structures they may rupture intercellular and intracellu-lar walls and membranes, resulting in release and mixing of previously compartmentalisedsubstrates and enzymes. Therefore, although maintenance of foods at sub-zero temperatures
Frozen Food Science and Technology. Edited by Judith A. Evans
© 2008 Blackwell Publishing Ltd, ISBN: 978-1-4051-5478-9

BLUK139-Evans January 23, 2008 17:24
Effects of Freezing on Nutritional and Microbiological Properties of Foods 27
potentially reduces the rate of reactions with potentially deleterious consequences for safety,quality and nutrition, changes in the concentration of substrate and access to enzymes mayact to increase the rate of such reactions. Due to the physical and chemical changes that maycontinue to occur in the frozen state, a heat treatment before freezing is required for manyfoods, particularly vegetables (see below) to ensure preservation for an acceptable shelf-life.Heat treatment before freezing, commonly known as ‘blanching’, is primarily designed toinactivate enzymes that are responsible for deleterious changes in sensory quality. However,blanching also achieves the objective of preserving nutritional value, particularly for nutrientssuch as ascorbate (vitamin C) that are susceptible to enzymatic oxidation and degradation.The blanching step itself may have significant effects on nutrient retention and thereforethe impact of this and other process steps that occur before freezing must be considered inunderstanding the nutritional value of frozen foods. The early literature describing the factorsthat influence nutrient retention in frozen foods has been reviewed by Bender (1978, 1993).This review summarises the principles involved and draws attention to more recent studiesand to newer products entering the frozen food supply chain.
Micro-organisms of importance in foods are commonly separated into spoilage organ-isms and those with potential to cause human disease, pathogens. Preservation systems infoods tend to target prevention of growth of spoilage organisms and ensuring absence ofharmful levels of pathogens (or their toxins). Since freezing essentially halts the activity ofmicro-organisms, it can control microbiological spoilage for indefinite periods, provided thetemperatures are low enough (e.g. below −10◦C). However, many micro-organisms, likemany other biological systems, can survive freezing conditions and retain their ability tomultiply when conditions become comparatively more favourable. Although there are no‘hard and fast rules’ in relation to survival of pathogens under freezing, some groups oforganisms differ greatly in their susceptibility or resistance to the effects of freezing. Higherorganisms, such as protozoan parasites, are very sensitive to freezing and frozen storage andare destroyed. Gram-negative bacteria are more resistant than protozoa but tend to be moresusceptible than Gram-positive bacteria. Viruses retain their ability to infect host cells afterbeing frozen and bacterial spores are completely resistant to the effects of freezing. Mouldsand yeasts vary in their susceptibility to freezing and frozen storage. For public health, sur-vival of pathogens becomes an important consideration. Generally speaking, if frozen foodshave the potential to harbour pathogens at harmful levels, they will require further processing(e.g. cooking) to reduce these pathogens to levels that are not of concern to public health.Where low infectious dose organisms are concerned, the organism has to be eliminated fromthe frozen food completely.
Other factors that impact on the freezing effects include freezing rate, formulation of thefood/ingredient content, packaging material, dimensions of the pack, storage temperatures/time, thawing conditions and physiological state (e.g. growth phase) of the micro-organismduring cooling/freezing. Factors that affect resistance or susceptibility to freezing are dis-cussed in detail in a recent review by Archer (2004). The initial stage of freezing, where prod-uct is cooled to freezing temperatures may destroy or injure susceptible organisms throughcold-shock. Ice-crystal formation (intracellular and extracellular) is also known to physicallydamage cells and further cooling to the final storage temperature may induce further damage,where slow-freezing ice crystals concentrate soluble solids, affecting stability of proteinswithin microbial cells. Physical damage is often associated with membrane damage. Thishas been shown in virus particles (Herpes simplex virus) where freezing and thawing in-duced loss of integrity of the membrane glycoprotein structure and viral uncoating (Hansenet al., 2005). Under certain conditions, outflow of water from the cell, related to increase in
BLUK139-Evans January 23, 2008 17:24
28 Frozen Food Science and Technology
extracellular osmotic pressure and the membrane-lipid phase transition, can cause cell death(Dumont et al., 2003). It is also thought that oxidative stress may play a role in damage tothe cell during freezing and thawing. This has been proposed by Park et al. (1998) for Sac-charomyces cerevisiae and Stead and Park (2000) for Campylobacter coli. In S. cerevisiae,Tanghe et al. (2002) also proposed a role for aquaporin genes (AQY1 and AQY2), suggestingthat plasma membrane water transport activity is involved in determining freeze tolerancein yeast. Many organisms have evolved mechanisms that serve to minimise the freeze in-jury damage. For example, these organisms produce ice nucleation proteins, anti-nucleatingproteins and anti-freeze proteins, which in turn minimise freeze injury. The structures andfunctions of these different proteins have been reviewed by Kawahara (2002). The effects offreezing on pathogens and spoilage micro-organisms concerned with different food types aredescribed in more detail below.
This chapter aims to draw out the consequences of the freezing process on microbiologicalcontent and nutritional qualities of foods, looking in particular at the impact of processingbefore and during freezing. It comprises a review of the more recent literature and a summaryof an unpublished study from our own laboratory to illustrate the direction of some futuretrends in frozen foods.
2.2 MEAT, POULTRY AND FISH
2.2.1 Nutritional aspects
A wide variety of frozen meat, poultry and fish products are now available to the consumer.These range from simply prepared cuts of muscle, whole birds and intact fish to highlyprocessed products containing components derived from several animal tissues. In nutritionalterms meat, poultry and fish are particularly important dietary sources of protein and fat; ofthe minerals iron, zinc, magnesium and selenium (particularly from fish and other sea foods);of the B vitamins, vitamin A (found in liver) and vitamin D (found in oily fish species).
Following slaughter, muscle and other animal tissues undergo complex biochemicalchanges; these may arise from residual metabolic reactions, or be induced by microbialand/or oxidative spoilage. The objective of freezing is to slow, or to prevent post-mortemchanges that may adversely affect microbiological safety, sensory quality and nutritionalvalue. Although the process of freezing by itself does not have significant effects on nutrientlevels in meat, poultry and fish foods, it is less certain whether prolonged frozen storagecauses significant loss of potentially labile nutrients.
A recent study of frozen storage on protein and fat retention assessed the long-term stabilityof food samples gathered during clinical feeding trials (Phillips et al., 2001). A mixed foodsample was prepared from typical components in an American diet. Storage and thawingof these samples was carried out under ‘ideal’ conditions – in sealed containers, withouttemperature fluctuations and without any drip loss after thawing. Although these conditionsdo not represent normal domestic, or commercial practice, this study confirmed that levelsof protein, total fat and individual fatty acids were not significantly reduced by storage at−60◦C for up to 50 months.
Studies measuring the effects of frozen storage on animal tissues under more realisticconditions have mainly been directed towards determining effects on sensory quality, ratherthan on nutrient retention. Early studies on vitamin levels in muscles from pork, beef and
BLUK139-Evans January 23, 2008 17:24
Effects of Freezing on Nutritional and Microbiological Properties of Foods 29
poultry indicated that losses were of the order of 10–30% for niacin, pyridoxine, thiamine andriboflavin after storage times of up to a year (Westerman, 1952; Lee et al., 1954; Fennema,1975; Engler and Bowers, 1976). In a more recent systematic study, levels of thiamine,riboflavin and pyridoxine were measured in pork meat frozen stored for 12 months at –12◦Cand −24◦C (Mikkelsen et al., 1984). Losses compared with samples taken before freezingwere 10–20% for all the vitamins measured, but in this, as in earlier studies, a high variabilityfor estimates of loss and lack of consistency between samples and treatments was noted.Many published studies of nutrient loss on frozen storage do not discriminate between loss ofnutrients caused by chemical breakdown and physical loss of nutrients in the fluid that exudesfrom the meat during and after thawing. Following prolonged frozen storage of muscle foodsit has been observed that irreversible aggregation of the actin and myosin protein myofibrilsmay occur. This does not adversely affect the nutritional value of the protein, but may resultin a toughening of the meat texture and a reduction in the ability of the muscle structure tohold water. As a consequence, on thawing, frozen intact muscle may lose a significant amount(2–15%) of intracellular and intercellular fluids as so-called ‘drip-loss’. If this fluid is notincorporated into the food to be consumed it may represent a significant loss of water-solubleproteins, vitamins and minerals. Many factors may contribute to determining the magnitudeof drip loss; these include species, age of the animal, pre-slaughter handling of the animal,freezing rate and thawing rate.
Frozen meat, poultry and fish products stored in contact with air are susceptible to ox-idation; this may especially be a problem with fish and poultry that contain nutritionallysignificant amounts of polyunsaturated fatty acids. Polyunsaturated fatty acids (PUFAs) ofthe n-3 series, docosahexanoic acid (DHA) and eicosopentanoic acid (EPA) found in fishare particularly prone to oxidation, resulting in formation of volatile products that give riseto the aroma and taste characterised as ‘rancid’. Several recent studies have investigated theeffects of freezing and frozen storage on n-3 PUFA levels in fish. A significant reduction inthe total n-3 PUFA content was reported in Saithe (a lean fish) fillets stored at −20◦C for6 months (Dulavik et al., 1998). Similarly, levels of total n-3 PUFA were reduced in salmonfillets stored at −20◦C (Refsgaard et al., 1998) and levels of DHA and EPA were reduced insardine and mackerel fillets stored for 24 months (Rougerou and Person, 1991). In contrastto these reports of PUFA loss, Polvi et al. (1991) found no difference in total n-3 PUFAlevels in salmon fillets stored at the relatively high temperature of −12◦C for 3 months. Xinget al. (1993) also failed to see any losses of DHA and EPA in mackerel and cod fillets storedfrozen at −20◦C for 28 weeks.
As with many aspects of nutrient stability, the extent of n-3 PUFA loss from frozen fishby oxidation depends on several factors, e.g. access of oxygen to the muscle, handling beforefreezing and the type of muscle (dark muscle of fish suffers higher rates of iron-catalysedoxidation than white muscle). Although loss of nutritionally important n-3 PUFAs from frozenfish may undoubtedly occur on prolonged frozen storage, in practice this is not likely to bea serious cause for concern. The threshold for sensory detection of rancidity is very low andtherefore if frozen fish are consumed within the recommended period of storage, significantproportions of their original content of n-3 PUFAs will not have been lost to oxidation.
In summary, the scientific literature on the systematic effects of freezing and frozen storageon nutrient retention in meat, poultry and fish products is not extensive, it is often decadesold and often not of high quality. However, the available data combined with knowledge ofthe stability of the relevant nutrients in their isolated forms strongly suggest that freezing isan excellent method to preserve the nutritional values of meat, poultry and fish.

BLUK139-Evans January 23, 2008 17:24
30 Frozen Food Science and Technology
2.2.2 Micro-organisms associated with meat, poultry and fish
The micro-organisms associated with raw meat, poultry and fish are varied. They includebacteria, protozoa, viruses and for meats, less well-characterized agents such as prions whichcause transmissible spongiform encephalopathies. Many of the contaminating organismsare originally present on the external surface or in the respiratory or intestinal tracts ofhealthy animals. Contamination occurs and spreads during transport/holding prior to slaugh-ter/killing, during slaughtering and subsequent processing: hide/skin removal, cutting, debon-ing, evisceration, washing etc. The main microbial hazards of concern in frozen meat andpoultry include infectious Gram-negative bacteria such as salmonellae, Campylobacter spp.,pathogenic Escherichia coli and Yersinia enterocolitica, Gram-positive infectious bacteriasuch as Listeria monocytogenes, Gram-positive toxicogenic bacteria such as Staphylococcusaureus, Clostridium perfringens and C. botulinum, protozoal parasites such as Cryptosporid-ium spp., Giardia spp., Trichinella spiralis and Toxoplasma gondii. Some of these organismsare found in a wide variety of animal species and cause disease in these animals while thehost range of others is more restricted. The hazards that are associated with raw meat andpoultry and occur frequently have been discussed in more detail by McClure (2002). Some arepresent in relatively high numbers (e.g. levels of salmonella up to 103/g and Campylobacterspp. up to 106 colony forming units, CFU, per carcass in poultry) and this is an importantconsideration for risk assessment and controlling these hazards prior to consumption. Asfor meat and poultry, microbes of major concern in fish are infectious bacteria and includeSalmonella, Shigella, Listeria monocytogenes, Vibrio cholerae and other pathogenic vibriossuch as V. parahaemolyticus and V. vulnificus.
Micro-organisms associated with quality or spoilage defects in meat, poultry and fish in-clude pseudomonads, moulds, yeasts, and Gram-positive bacteria such as lactic acid bacteria,Brochothrix thermosphacta and micrococci. The density of occurrence of micro-organismson the skin of meat and poultry can be greater than 109/cm2. In addition to contamination onthe skin, further contamination can result from handling during slaughter, cutting, deboningand packaging, from knives, wash water, hands and clothing of workers and the hides/skinsof other animals. Methods for cleaning carcasses are usually ineffective but scalding and fastchilling prior to freezing can reduce numbers of contaminating micro-organisms significantly.
The micro-flora associated with fish and other seafoods typically reflects the flora of theenvironments in which these have been caught and harvested. As with meat and poultry,if the fish are healthy, then muscle tissue and internal organs are usually sterile althoughthe circulatory system of some shellfish is not ‘closed’. For example, the haemolymph ofcrabs commonly contains marine bacteria, such as vibrios, sometimes at high levels. Otherorganisms commonly associated with fish and shellfish include pseudomonads, Micrococcusspp., members of the Acinetobacter-Moraxella genera, corynebacteria, Geotrichum spp. andRhodotorula spp. Fish and shellfish associated with coastal waters and estuarine environ-ments tend to harbour a wider variety of organisms, including Bacillus spp., members of theEnterobacteriaceae and viruses. Salt-water fish and shellfish harbour halotolerant organisms.When fish are caught, they are often stored in chilled brines or ice, and if caught in salt-water,this dilutes the salt concentration allowing halotolerant micro-organisms, which usually pre-fer lower concentrations of salt for optimal growth, the opportunity to multiply quickly. Themicro-organisms from temperate waters are often psychrotrophic or psychrotolerant whilethose from tropical waters are not, so speed of chilling and low temperature of storage aftercapture can have a significant impact on the flora that develops before fish are frozen. In somesituations, shellfish, such as shrimp, are cooked soon after capture, so this destroys a large

BLUK139-Evans January 23, 2008 17:24
Effects of Freezing on Nutritional and Microbiological Properties of Foods 31
Table 2.1 Pathogenic organisms and their levels of concern, associated with different rawmaterials/processes relevant to frozen foods.
Pathogenic micro-organismsor their metabolites Level causing concern
Relevant foods and rawmaterials
Bacillus cereus – ingestion ofemetic toxin
High (e.g. >105 vegetativecells)
Meat, poultry, vegetables(especially rice), dairy (milk,cream)
Bacillus cereus (toxico-infection) High (e.g. >105 vegetativecells or spores)
As above
Campylobacter spp. – infection Low (e.g. 500 cells) Meat (beef, pork, lamb),poultry, dairy (milk)
Clostridium botulinum – ingestionof neurotoxins
High (e.g. >105 vegetativecells or spores)
Meat, vegetables, fish
Clostridium botulinum(toxico-infection, infant botulism)
Low (e.g. 100 vegetativecells or spores)
Honey, vegetables, meat
Clostridium perfringens(toxico-infection)
High (e.g. >10,000vegetative cells)
Meat, poultry, dairy (milk)
Escherichia coli (six pathogenictypes)
Low–high ((e.g. 10 cells to>106), depending onpathotype
Meat, fruit, vegetables, dairy(milk, cheese)
Listeria monocytogenes – infection Medium (e.g. >1000vegetative cells), low forimmunocompromisedindividuals
Meat, poultry, fish, ice cream,vegetables, fruit, dairy(milk, cheese)
Salmonella enterica (allsub-species/serotypes) – infection
Low–medium (e.g.10–10,000 cells)
Meat (beef, pork, lamb),poultry, fish, dairy (milk,cheese), bakery (eggs)
Staphylococcus aureus – ingestionof enterotoxin
High (e.g. >105 vegetativecells)
Meat, fish, bakery (process),dairy (milk, cheese)
Yersinia enterocolitica – infection Not known, probablymedium (>10,000 cells)
Meat (particularly pork),poultry, dairy (milk), bakery(eggs), vegetables
Vibrio spp. (V. cholerae, V.parahaemolyticus, V. vulnificus) –infection
Low–high (e.g.500–100,000 cells),depending onstrain/species, hostsusceptibility
Fish, shellfish
Giardia intestinalis (or lamblia) Low (e.g. 25–100 cysts) Fruit, salad vegetables,handled foods
Cryptosporidium parvum Low (e.g. 30–132 oocysts) Fruit, salad vegetablesCyclospora cayetanensis Not known, probably low Fruit, salad vegetablesTrichinella spp. (e.g. T. spiralis) Possibly low Meat (pork, horse)Toxoplasma gondii Probably low Meat (lamb, horse), poultryTaenia spp. Possibly low Meat (pork)Anisakis spp. Possibly low Fish
proportion of contaminating organisms (vegetative cells) but the handling of these (e.g.during shelling/peeling, sorting) post-cooking often means that contamination levels canreturn to previous levels and sometimes include other micro-organisms, such as E. coliand staphylococci. Levels on shrimp are typically 105–107 CFU/g at the time of arrivalat processing plants, and those from tropical waters may be higher. The key pathogenicmicro-organisms associated with foodstuffs, including fish and fish products are listed inTable 2.1. Some micro-organisms such as Photobacterium phosphoreum, Ph. histaminum,
BLUK139-Evans January 23, 2008 17:24
32 Frozen Food Science and Technology
Carnobacterium piscicola and Shewanella putrefaciens cause particular spoilage problemswith fish. From a safety perspective, algal toxins (produced in algal blooms) and scombroidpoisoning, resulting from bacterial production of biogenic amines (decarboxylation of parentcompounds such as amino acids) are additional concerns in seafood, and neither of theseis destroyed by consumer cooking. The same is true for other bacterial toxins such as bo-tulinum toxin and staphylococcal enterotoxins, which are not affected by freezing and frozenstorage.
2.2.3 Effects of freezing on micro-organisms associated withmeat, poultry and fish
The rate of freezing is known to influence the microbiological status of meat, poultry andfish and while it is generally the case that total numbers of micro-organisms decrease slightlyduring freezing, frozen storage and thawing, growth of some micro-organisms can occur attemperatures below 0◦C, with frequent reports of growth down to −5◦C and less frequentlydown to −10◦C (Larkin and Stokes, 1968). Frozen poultry meat shows rapid increases innumbers of spoilage micro-organisms when stored at −5◦C (Abu Ruwaida et al., 1996) andbetween −5 and −7◦C, where the main organisms of concern are psychrophilic yeasts andmoulds, causing whisker-like growth (e.g. Thamnidium spp.), black spots (e.g. Cladosporiumspp.) and white spots (e.g. Sporotrichum spp.). Generally speaking, temperatures below−10◦C are considered to effectively inhibit growth of micro-organisms associated with foods.Therefore, the rate of cooling is not only relevant to killing or ‘cidal’ effects on micro-organisms but is also important for preventing growth at sub-zero temperatures, and this isimportant to prevent spoilage of meat, poultry and fish.
The pattern of survival for different taxonomic groups during freezing and frozen storageof fish is similar to the pattern observed in meat and poultry, with Gram-negative bacteriasurviving less well than Gram-positive organisms, and spores showing little or no change innumbers. However, even though freezing inhibits the metabolism of micro-organisms duringfrozen storage, enzyme activity still continues. This is important in frozen fish where histi-dine decarboxylase activity results in histamine production, elevated levels of which exceedspoilage limits (ca. 5 ppm) or even safety limits (ca. 50 ppm), particularly if temperatureabuse occurs in the supply chain.
The cidal effects of freezing on different types of organisms vary dramatically. Spores ofbacteria and moulds remain largely unaffected by freezing although there is some evidencethat spores of C. botulinum are more susceptible to the effects of ionising radiation follow-ing frozen storage for 30 days at −75◦C (Lim et al., 2003). Spores are inert and extremelyresistant to different stresses and there is little damage afforded by freezing and repeatedfreeze–thaw cycling. Vegetative bacterial cells vary in their response to freezing. Some or-ganisms (e.g. E. coli, B. subtilis, Vibrio cholerae and some lactic acid bacteria) are capableof responding to lower temperature stress through production of cold-shock proteins (CSPsor cold-induced proteins, CIPs) and a gradual change to colder conditions has been shownto improve the survivability of E. coli (Bollman et al., 2001), L. monocytogenes (Bayleset al., 2000) and salmonellae (Jeffreys et al., 1998) that are frozen. There is a relativelylarge body of information on the survival of L. monocytogenes subjected to freezing under arange of conditions, showing variable responses and summarised by Archer (2004). Photo-bacterium phosphoreum, associated with spoilage of modified atmosphere-packed cod andsalmon, and histamine formation, is very sensitive to freezing and a single freeze–thaw cycle
BLUK139-Evans January 23, 2008 17:24
Effects of Freezing on Nutritional and Microbiological Properties of Foods 33
has been shown to dramatically increase shelf-life of these and similar products. However,significant histidine decarboxylase activity of halophilic histamine-forming bacteria can con-tinue after freezing even though cell counts are reduced by more than six log10 cycles (Fujiet al., 1994). There is some evidence that frozen storage of fish for more than 3–6 weeksresults in large reductions in levels of V. cholerae but there are also several studies reportingrecovery of vibrios, including V. cholerae and other potentially pathogenic species, fromfrozen seafood such as frozen raw shrimps and fish. Epidemiological evidence from a largecholera outbreak associated with ice also indicates survival of numbers high enough to causeinfection.
Freezing is known to cause sub-lethal damage to vegetative bacteria, such as salmonellae,campylobacters, L. monocytogenes and vibrios and that is why care must be taken wheninvestigating these effects, particularly when selective media are used to recover cells in thepresence of other micro-organisms. Agents in selective media used to recover specific types ofmicro-organisms often inhibit damaged cells of the target micro-organisms as well, as shownby Barrell (1988) and more recently by Chang et al. (2003). It is widely acknowledged thatinjured cells in foods may be capable of repair and for this reason, many methods for thedetection of pathogens in foods include a recovery step. It is generally concluded that, unlessspecific effects are shown, such as the effects of repeated freeze–thawing on some bacteria(such as salmonellae), freezing may have little or no effect on the numbers of viable vegetativebacteria.
There is also evidence that prior adaptation (e.g. storage at chill temperatures for only1.5 h) can have significant effects on survival of E. coli (Mihoub et al., 2003) and lactic acidbacteria (Sanders et al., 1999). It is also clear from the former study that some strains areintrinsically more resistant to cold shock injury than other strains, so any additional effectfrom prior adaptation becomes less important. This is also seen with other stresses such asexposure to low pH. The expression and repression of various proteins and their potentialinvolvement in survival to cold shock is discussed by Mihoub et al. (2003).
The absence of CSPs has been proposed as one possible reason for the relatively high sus-ceptibility of Campylobacter spp. to the effects of freezing (Park, 2002). A recent study byGeorgsson et al. (2006) has confirmed results from previous studies, reporting that Campy-lobacter levels in broilers decreased by between 0.7 and 2.9 log10 units after freezing and31-day storage. Numbers of faecal coliforms, often used as indicator organisms, in the samesamples remained largely unchanged. The significant die-off of Campylobacter is consistentwith previous studies (Humphrey and Cruikshank, 1986; Stead and Park, 2000; Moorheadand Dykes, 2002) which reported approximately 2–3 log10 decreases in numbers after freeze–thaw stress, although, again, there is strain-to-strain variability reported with some strainsshowing higher sensitivity to freezing (Chan et al., 2001).
Protozoan parasites are considered to be very sensitive to the effects of freezing and thisgenerally results in the elimination of their dormant or quiescent forms. The few data reportingthe effects on protozoan parasites known to be transmitted via foods are summarised byDawson (2005) and Nichols and Smith (2002). Survival for more than 4 weeks under certainfreezing conditions, such as slow freezing or freezing in high-osmolyte solutions, has beenreported. These data and other information from outbreaks of illness associated with otherfoods (e.g. ice cream and ice cubes) indicate that survival may occur over short periods,posing a risk in those foods contaminated with oocysts or cysts. Freezing is known to bean effective means to inactivate nematodes such as Anisakis simplex and Trichinella spp.;freezing is a legally accepted way of inactivating trichinae in pork meat (Murrell et al., 1986).Freezing and frozen storage also destroy fish parasites that are pathogenic to humans.

BLUK139-Evans January 23, 2008 17:24
34 Frozen Food Science and Technology
Transmission of viruses to humans is not generally considered to happen via meat and meatproducts, although caliciviruses (including Noroviruses and Sapoviruses) infect both humansand other animals. Recent evidence suggests that Norovirus infections often occur in calvesand sometimes in pigs and that some animal strains are genetically or antigenically related tohuman strains (Wang et al., 2006). The significance of this finding is unknown at the presenttime. More recently, a highly pathogenic (to birds) H5N1 virus was isolated from importedfrozen duck meat in Korea (Lu et al., 2003). Although this particular virus appeared to besubstantially less pathogenic for mammalian species, it has raised concern about the safety offrozen poultry coming from regions affected by the recent outbreaks of avian influenza aroundthe world, which originated in the Far East. In addition, limited data and information availablefrom studies with poliovirus survival in frozen foods, and epidemiological studies implicatingice with Norovirus-associated gastroenteritis, suggest that at least some viruses retain theirinfectivity following freezing and frozen storage. This is also true for viruses associatedwith shellfish, such as oysters, where outbreaks of Norovirus-related gastroenteritis havebeen linked to frozen products. Prion proteins, because of their innate stability, are likely toremain unchanged during freezing and frozen storage.
2.3 VEGETABLES AND FRUITS
2.3.1 Nutritional aspects
The terms ‘vegetable’ and ‘fruit’ in the context of nutrition do not have precise definitions.Plant foods that are commonly known as vegetables and fruits derive from culinary traditionsrather than a scientific definition and they consist of a remarkably diverse food group. Un-der the category of ‘vegetables and fruits’ humans regularly consume many different plantspecies and different plant tissues taken from roots, shoots, leaves, fruits, seeds and flowers.Commonly available frozen vegetables and fruits provide a correspondingly large array ofnutrients. The most important nutrients for human health and well being found in frozenvegetables and fruits are the vitamins A (as precursor carotenoids), C, K, folate; soluble andinsoluble dietary fibres; polyunsaturated fatty acids of the n-6 and n-3 family and the mineralspotassium and magnesium. In addition to these nutrients that are by definition essential forlife, dietary vegetables and fruits provide a host of other phytochemicals, consumption ofwhich may ensure long-term health and well-being of the consumer (Goldberg, 2003).
Compared to ‘fresh’ vegetables and fruits, there are generally small differences in themineral and fibre content of equivalent vegetables supplied as frozen (Polo et al., 1992;Nyman, 1995). However, for some particular fruits, significant changes in fibre profile havebeen reported, for example, in one variety of mango, cellulose, hemicellulose and lignincontents decreased by 50% during 12 months frozen storage (Cano and Marin, 1995).
There are several factors that can cause significant differences between the vitamin levelsin frozen vegetables and fruits, and fresh or otherwise preserved equivalents. The followingfour sections describe those factors.
2.3.1.1 Selection of cultivar and time of harvesting
Particular cultivars and harvest times are chosen to optimise the sensory quality of the produceand these may differ between those selected for freezing and those to be consumed as fresh,canned or dried food. The cultivar and harvest time may affect nutritional value (Shewfelt,
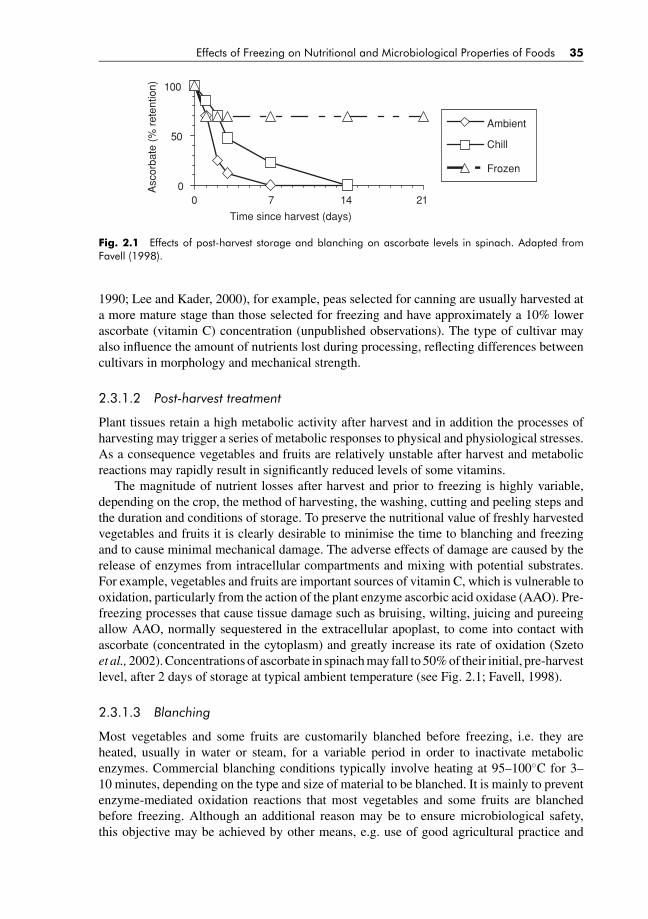
BLUK139-Evans January 23, 2008 17:24
Effects of Freezing on Nutritional and Microbiological Properties of Foods 35
0
50
100
0 7 14 21
Time since harvest (days)
Asc
orba
te (
% r
eten
tion)
Ambient
Chill
Frozen
Fig. 2.1 Effects of post-harvest storage and blanching on ascorbate levels in spinach. Adapted fromFavell (1998).
1990; Lee and Kader, 2000), for example, peas selected for canning are usually harvested ata more mature stage than those selected for freezing and have approximately a 10% lowerascorbate (vitamin C) concentration (unpublished observations). The type of cultivar mayalso influence the amount of nutrients lost during processing, reflecting differences betweencultivars in morphology and mechanical strength.
2.3.1.2 Post-harvest treatment
Plant tissues retain a high metabolic activity after harvest and in addition the processes ofharvesting may trigger a series of metabolic responses to physical and physiological stresses.As a consequence vegetables and fruits are relatively unstable after harvest and metabolicreactions may rapidly result in significantly reduced levels of some vitamins.
The magnitude of nutrient losses after harvest and prior to freezing is highly variable,depending on the crop, the method of harvesting, the washing, cutting and peeling steps andthe duration and conditions of storage. To preserve the nutritional value of freshly harvestedvegetables and fruits it is clearly desirable to minimise the time to blanching and freezingand to cause minimal mechanical damage. The adverse effects of damage are caused by therelease of enzymes from intracellular compartments and mixing with potential substrates.For example, vegetables and fruits are important sources of vitamin C, which is vulnerable tooxidation, particularly from the action of the plant enzyme ascorbic acid oxidase (AAO). Pre-freezing processes that cause tissue damage such as bruising, wilting, juicing and pureeingallow AAO, normally sequestered in the extracellular apoplast, to come into contact withascorbate (concentrated in the cytoplasm) and greatly increase its rate of oxidation (Szetoet al., 2002). Concentrations of ascorbate in spinach may fall to 50% of their initial, pre-harvestlevel, after 2 days of storage at typical ambient temperature (see Fig. 2.1; Favell, 1998).
2.3.1.3 Blanching
Most vegetables and some fruits are customarily blanched before freezing, i.e. they areheated, usually in water or steam, for a variable period in order to inactivate metabolicenzymes. Commercial blanching conditions typically involve heating at 95–100◦C for 3–10 minutes, depending on the type and size of material to be blanched. It is mainly to preventenzyme-mediated oxidation reactions that most vegetables and some fruits are blanchedbefore freezing. Although an additional reason may be to ensure microbiological safety,this objective may be achieved by other means, e.g. use of good agricultural practice and
BLUK139-Evans January 23, 2008 17:24
36 Frozen Food Science and Technology
chlorine wash. The advantages of blanching can be illustrated with reference to cauliflowerand spinach: if they are frozen without blanching they become unpalatable after only a fewmonths due to the development of ‘off’ flavours and odours caused primarily by oxidationof membrane lipids. If these vegetables are blanched before freezing they have a storage lifeof 18–24 months. The conditions of blanching are chosen so as to ensure inactivation of theenzymes responsible for oxidation while minimising loss of sensory quality and nutrients. Agreat deal of information has been published on losses of labile nutrients during blanching(for review see Clydesdale et al., 1991). Ascorbate is often used as an indicator of potentialnutrient loss because of its high solubility, sensitivity to heat and ease of measurement.Typical losses of ascorbate from vegetables during blanching are of the order 5–40% (Favell,1998; Bender, 1993) and the main mechanism of loss is by leaching into water. In general,nutrient losses are minimised if the raw material is not damaged physically before blanchingand if conditions are chosen that keep the temperature, duration of heat exposure and productto water ratio as low as is consistent with denaturing the enzymes responsible for oxidativespoilage.
2.3.1.4 Frozen storage
Bender (1993) has summarised the contradictory results of published studies designed toestimate the magnitude of vitamin loss during frozen storage of vegetables and fruits. Evenfor a particular vegetable, processed and stored under apparently similar conditions, the extentof ascorbate loss has been reported as negligible, or up to 40% after a year of frozen storage(Bender, 1993). As Bender comments, there are many possible sources of experimentalvariation that may lead to these different conclusions, most notably incomplete denaturationof oxidative enzymes during blanching. Since the review of Bender, no large-scale systematicstudy addressing this issue has been published. It may be concluded that if vegetables andfruits are adequately blanched and stored at conventional freezer temperatures without unduetemperature fluctuations they will still possess nutritionally valuable levels of potentiallylabile nutrients for a period of at least 12–18 months.
For fruits and other plant foods that are not blanched before freezing there is a potential forongoing metabolic activity that may influence nutritional value. For example, during frozenstorage the growth of ice crystals causes the rupture of cell walls allowing contact of AAO withits substrate ascorbate, leading to oxidation. This process may explain the continuing lossesof vitamin C seen during the 4-month frozen storage of orange–carrot juice (Cortes et al.,2005), and 12-month frozen storage of various berry fruits (De Ancos et al., 2000; Gonzalezet al., 2003; Skrupskis et al., 2003). Pasteurisation (e.g. for 2 min at 85◦C), which achievesthe same objective of enzyme denaturation as blanching does, inactivates AAO, leading togreater retention of vitamin C. Experiments conducted with mango juice indicated that aftera 6-month frozen storage, untreated juice lost 17.4% of its vitamin C, while pasteurised juicelost just 3.7% (Allah and Zaki, 1974). Another example of change in nutritional quality onfrozen storage is the change in sugar profile in papaya: sucrose levels decrease while fructoseand glucose levels increase, possibly due to continuing activity of invertase in the frozen fruit(Torija et al., 1998).
The choice of whether to blanch fruits and vegetables before freezing depends on a num-ber of factors. Vegetables are generally blanched since they contain high levels of lipoxyge-nases and other oxidative enzymes (Williams et al., 1986; Barrett and Theerakulkait, 1995),activity of which lead to rapid production of off flavours during frozen storage. Blanch-ing is performed to inactivate these enzymes. Blanching has the advantage of providing a
BLUK139-Evans January 23, 2008 17:24
Effects of Freezing on Nutritional and Microbiological Properties of Foods 37
microbiological decontamination step. It also has the advantage of ultimately reducing cook-ing time for the consumer and thereby increasing convenience. However, blanching is notalways a desirable technique as it can destroy the texture and appearance of many kindsof fruits and vegetables. Some fruits, especially the berry fruits, do not ordinarily producerancid off flavours during frozen storage, which means blanching can be avoided so long asother steps are enough to ensure microbiological safety (e.g. use of good agricultural practiceand hygienic handling). However, if blanching is not carried out, enzyme activity will not bedestroyed, leading to continuing loss of nutrients such as vitamin C during frozen storage. Away to mitigate this loss, if not stop it fully, is to limit the storage time. This approach willretain maximum possible nutritional value in the absence of blanching. Since properties offruits and vegetables vary, it is not possible to generalise in terms of the absolute require-ments for pre-treatment prior to frozen storage and the subsequent storage stability. Any newvegetable or fruit considered for frozen storage should therefore be tested for its requirementsboth for blanching and for nutrient stability.
2.3.2 Micro-organisms associated with vegetables and fruits
Vegetables are commonly contaminated with a variety of micro-organisms associated withthe soil. Prior to freezing, vegetables are prepared by cleaning and washing, to removesoil and debris, and trimmed and/or cut. Many vegetables are blanched to inactivate enzymeactivity during frozen storage and this also impacts on the microbiological quality, inactivatingvegetative cells, such as infectious bacteria. Further handling and cooling of the produce mayrecontaminate vegetables prior to freezing. However, frozen vegetables are not regardedas high-risk foods and are rarely associated with food-borne diseases, since pathogens areunable to proliferate at freezing temperatures and cooking is required prior to consumption.Although contamination with Enterobacteriaceae is commonplace, poor hygienic practiceis not the only cause of this since members of this family are commonly associated withplants and plant materials. Moulds are often found on vegetables and can be a good indicatorof quality. Lactic acid bacteria are usually present in the highest numbers, which can rangebetween 101 and 105 CFU/g. Occasionally, high spore loads can be found on crops thathave been sprayed with insecticides containing Bacillus thuringiensis. This bacterium isclosely related to the B. cereus subgroup and kills with protein crystals that are toxic toinsects. Care should be taken to ensure that insecticide preparations used for crops do notcontain enterotoxin-producing spore-formers (Yang et al., 2003) and strains used for thispurpose should be screened for this characteristic. Since B. thuringiensis cannot easily bedistinguished from B. cereus and microbiological criteria often include limits for numbersof B. cereus, use of such sprays can result in problematic situations, particularly if spraysused contain strains that may produce enterotoxin that is associated with B. cereus diarrhoealsyndrome.
Most fruits that are intended to be frozen are picked when ripe, since there is no opportunityfor ripening after they have been processed. In addition, frozen fruit is commonly consumedafter thawing, without heating. The micro-organisms associated with fruit include moulds,yeasts, protozoa, viruses and bacteria. Fruits, like vegetables, are usually washed (e.g. withchlorinated water) and some are particularly sensitive to handling, and are easily damaged.Some are hand picked and/or sorted and are thereby susceptible to contamination by humanpathogens. There are various preparations that are marketed for cleaning/decontaminatingfruits and vegetables and these have limited success in removing microbial contaminantsand/or inhibiting their growth. Unlike vegetables, blanching of fruits is not commonly applied,

BLUK139-Evans January 23, 2008 17:24
38 Frozen Food Science and Technology
except for fruits used in products that undergo further cooking before consumption, such asbakery products. Typical micro-organisms associated with fruits prior to freezing are thesame as those present on the raw material at harvesting and also include others introducedthrough further handling. The pathogens are listed in Table 2.1.
2.3.3 Effects of freezing on micro-organisms associated withvegetables and fruits
The main group of micro-organisms associated with frozen vegetables – lactic acid bacteria –remain largely unaffected by freezing, frozen storage and thawing. Bacterial spores alsoremain unaffected. The most significant micro-organisms in frozen fruits in terms of numberare moulds and yeasts. A key factor influencing the development of flora is pH and in manyfruits, this selects for yeasts and moulds that are better able to tolerate the low-pH conditionsand presence of organic acids. Bacteria such as infectious pathogens, if present, die offrelatively rapidly. Epidemiological studies of food-borne disease outbreaks have shown thatviruses survive in frozen fruits. One such study has been recently reported in Denmark, wherefrozen raspberries contaminated with Noroviruses sourced from Poland were identified as themost likely vehicle. In such situations, contamination is likely to arise from infected handlersand poor hygiene.
2.4 DAIRY
2.4.1 Nutritional aspects
Milk and cheese are important constituents of the diet. Their major contribution in nutritionalterms is as a source of calcium and protein.
Milk is a complete food that is able to sustain newborn mammals during their initial growthphase. Milk therefore contains an extensive range of minerals and vitamins, fats, sugars,proteins and functional proteins including immunoglobulins, α-lactalbumin, β-lactoglobulin,lactoferrin, lactoperoxidase, and a variety of growth factors (McIntosh et al., 1998; also seereviews in Shortt and O’Brien, 2004). Though commercially frozen milk is not an importantcommodity, freezing is used to store human milk to help vulnerable newborns. There havetherefore been a number of investigations into the effect of the freezing process and storage onthe nutrient content of human milk. The B vitamins biotin, niacin, and pantothenic acid werefound to be virtually unchanged up to 3 months of frozen storage, and similarly lysozymeand protease were unaffected (Friend et al., 1983). However, lactoperoxidase activity wasfound to decrease significantly while lipase activity increased slightly during 3 months ofstorage. Friend et al. (1983) found that the increase in lipase activity correlated with anincrease in the level of unesterified fatty acids, indicating that lipolysis was occurring. Thiseffect was most pronounced between 2 and 3 months of frozen storage and may also beresponsible for the decrease in the fat-soluble vitamins retinol and α-tocopherol observedin bovine milk frozen for longer time periods (Vidal-Valverde et al., 1992, 1993). Lengthof time in frozen storage appears to be critical for nutrient retention in human milk: Busset al. (2001) observed that approximately a third of vitamin C content was lost following1 month of storage, and two-thirds lost following storage for 2 months. They conclude thatvitamin C losses were due partly to lactoperoxidase activity. Immunological components,including cells and proteins, in human milk are very important for maintaining the health of

BLUK139-Evans January 23, 2008 17:24
Effects of Freezing on Nutritional and Microbiological Properties of Foods 39
newborns. Though macrophages and lymphocytes reduce during freezing, immunologicallyimportant proteins were found to be unaffected, though there may be denaturation effects onthawing (Lawrence, 1999). The effect of pasteurisation followed by freezing on nutrients inhuman milk indicated that though calcium, phosphorous, iron, copper and vitamin A werenot affected, there was a potential decrease in the bioavailability of zinc due to a redistributionwith a decrease in the whey fraction and an increase in the fat fraction (Goes et al., 2002).The main cause of the zinc redistribution was thought to be the pasteurisation process ratherthan the freezing process.
Cheese is not generally supplied in a frozen state and freezing in the cheese-makingindustry is used mainly as a method to maintain starter cultures (for example, see Gilliland,1981). Freezing of sheep milk cheese has been studied as a way to avoid the seasonal natureof the product but these studies have focussed on changes in sensory properties rather than onnutritional quality. Nine-month frozen storage of the Los Pedroches’ brand cheese and of aManchego-type cheese showed that proteolysis continued slowly during this time, resultingin higher amino acid contents (Tejada et al., 2002; Prados et al., 2006). Similar effects onproteolysis have also been noted for Port Salut Argentino cheese (Verdini et al., 2005). Frozenstorage of goats’ cheese has also been found to lead to changes in organic acids, with increasesin butyric, lactic, propionic, tartaric, and uric acids noted (Park et al., 2006).
2.4.2 Micro-organisms associated with dairy products
The main micro-organisms of concern in dairy produce such as milk and cheese are thespoilage bacteria and the pathogenic bacteria. These arise from contamination of raw ma-terials during milking, from the animals themselves (e.g. flora on the udder or in faecalmaterial), from contaminated equipment/handlers and from the milking environment (e.g.spore-forming bacteria). Milk from cows suffering mastitis or other diseases may containbacteria not normally found in milk from healthy animals, including S. aureus, pyrogenicstreptococci and actinomycetes, Brucella spp., mycobacteria, salmonellae, L. monocytogenes,Coxiella burnetii, and some viruses, including foot-and-mouth disease virus (FMDV). Mostmilk is pasteurised following transport/short-term storage at temperatures/times (e.g. 72◦Cfor 15 s) that inactivate vegetative cells, including infectious bacterial pathogens normallyassociated with milk, such as salmonellae, L. monocytogenes, pathogenic E. coli, campy-lobacters and Yersinia enterocolitica. The same type of inactivation is effected by holding atlower temperatures for longer times (e.g. 68◦C for 30 min) whereas ultra-high-temperature(UHT) treatment typically uses temperatures of around 149◦C for 2 seconds and this willinactivate mesophilic spore-forming bacteria, enabling such milk to be stored at ambienttemperature for long periods. A lower temperature/time combination, such as 138◦C for10 seconds, is used for extended shelf-life (referred to as ESL) milk, stored at chill for peri-ods in excess of 4 weeks. In these products, psychrotrophic spore-formers are inactivated butproducts are not commercially sterile. Some milk undergoes micro-filtration as an alternativeto pasteurisation, to remove infectious agents. Some raw milk may contain mycotoxins andis thought to result from animals ingesting contaminated feed.
The spoilage micro-organisms associated with milk include psychrotrophic bacteria suchas pseudomonads, Flavobacterium spp., Chromobacterium spp., Alcaligenes spp. and ther-mophilic spore-forming bacteria that survive pasteurisation. Other ingredients used in frozendesserts include butter, sugar chocolate, fruits, nuts and eggs. These are often added after milkhas been pasteurised and assurance of their safety is commonly provided by the suppliers ofthese materials, some of which (e.g. eggs, chocolate) have been known to be associated with
BLUK139-Evans January 23, 2008 17:24
40 Frozen Food Science and Technology
pathogens such as Salmonella or their toxins, such as S. aureus enterotoxin. Some microbi-ological contaminants, such as Listeria monocytogenes, are associated with wet equipmentand manufacturing environments and this poses a risk in the manufacture of ice cream. En-vironmental monitoring and effective cleaning and disinfection are critical for the safety ofthese products, particularly when considering post-process handling, e.g. freezing in blastfreezers and hardening tunnels.
2.4.3 Effects of freezing on micro-organisms associated withdairy products
The fate of different micro-organisms associated with dairy products generally follows thesame trends as already described for other foods. Dairy products that are frozen include icecream, yoghurts, ice milk, sherbet and other desserts. Ice cream may contain vegetable ornon-dairy animal fats and in that sense, are not ‘dairy’ products, but are considered in thissection for convenience. The thermal processes required for pasteurisation of ice cream arehigher than those specified for milk since they contain components, such as sugar, that areknown to increase the thermal tolerance of micro-organisms. Provided cooling and freezingare relatively rapid, no growth of survivors can take place and there would be no potential forspoilage of product, the major concern considering the most likely surviving micro-organisms.The normal temperature of storage of ice cream is ca. −25◦C in factory cold-stores and ca.−18◦C in distribution and retail, providing a typical shelf-life of 2 years. There have beenoccasional outbreaks of diseases linked to frozen dessert products such as ice cream, butthese are due to post-process contamination or inadequate pasteurisation, e.g. in home-madeice cream. As for other frozen products, infectious agents may survive longer at freezingtemperatures.
There are groups of dairy products that are first fermented, then frozen or supplementedwith live micro-organisms and then frozen. Fermented milks have existed for centuries;reports on the health benefits of these products were published as early as the beginning ofthe twentieth century. Yoghurts are typically fermented with defined species of lactic acidbacteria and more recently there has been a plethora of new product innovations launched inthe market that include live bacteria, such as lactic acid bacteria. Frozen products of interestinclude ice cream (fermented or simply containing added bacteria), frozen yoghurt, yoghurtice cream and soy desserts. The various health benefits claimed include establishment ofhealthy gut flora, inhibition of pathogens, improvement of resorption of food components,such as lactose, decreasing prevalence of allergy in susceptible individuals and enhancing theimmune system. These products are commonly considered to be beneficial for health and havebeen recently reviewed by Parvez et al. (2006). The bacterial strains used in probiotic (Greek‘for life’) products are generally considered as safe and there is no evidence of them causinginfections in humans but this possibility remains and therefore requires careful assessmentof new strains prior to use and continuous monitoring for any adverse effects.
Survival of probiotic bacteria in frozen foods is extremely important, if they are to retaintheir claimed functionality, although some beneficial effects of dead cells (e.g. enhancementof immune response) have also been reported. For that reason, a number of recent studies haveinvestigated survival of micro-organisms used as probiotics in an effort to identify strainsand/or conditions that lead to better survival during frozen storage. These include organismssuch as Streptococcus thermophilus (Hong and Marshall, 2001; Fonseca et al., 2001), L.delbruekii (Fonseca et al., 2001), Bifidobacterium lactis (Heenan et al., 2004; Haynes andPlayne, 2002), L. paracasei (Heenan et al., 2004; Haynes and Playne, 2002), L. acidophilus

BLUK139-Evans January 23, 2008 17:24
Effects of Freezing on Nutritional and Microbiological Properties of Foods 41
(Haynes and Playne, 2002; Godward et al., 2000; Heenan et al., 2004; Wang et al., 2005a;Salem et al., 2006) and L. rhamnosus (Heenan et al., 2004; Salem et al., 2006).
2.5 BAKERY
In terms of bakery products, the most important nutrient for consideration is the fortificationof flour with folic acid. Folic acid is linked to the prevention of neural tube defects (NTD)in the developing foetus and women of child-bearing age are advised to take supplements toincrease intake to a recommended level of 0.4 mg per day. However, since many pregnanciesare unplanned, voluntary advice in countries such as the UK has not led to a significantdecrease in NTD. Mandatory fortification of flour in the US and Canada since 1998 has led toa reported decrease in the incidence of NTD of 27–50% and the UK is currently consideringmaking fortification of flour mandatory (reviewed in Eichholzer et al., 2006). Folic acid,folates, and folacin are all terms used for a family of compounds with related biologicalactivity; they contain one or more linked molecules of glutamic acid. Commercially availablefolic acid contains a single glutamic group and has been found to be moderately stable toheat and atmospheric oxygen (Ottaway, 2002). Folate added to flour has been shown to bestable for up to a year at temperatures including freezing (Ranhotra and Keagy, 1995). Frozenstorage has also been found to maintain levels of naturally occurring folate found in foods suchas strawberries (Vahteristo et al., 1998). However, subsequent heating of folate-containingfoods can lead to losses of around 20% (Hoppner et al., 1973; Morgan, 1996).
2.5.1 Micro-organisms associated with bakery products
The raw materials used in bakery products include flour, water, milk, butter, salt, eggs andsugar and occasionally, processed products such as preserved fruits. The flora of flour is morediverse than the wheat from which the flour is made, resulting from contamination during pro-cessing. The micro-organisms associated with flour are primarily psychrotrophs, ‘flat sour’bacteria (organisms producing acid souring without significant gas production), thermophilicspore-forming bacteria, ‘rope’ bacilli, moulds and yeasts. The main safety concern is myco-toxin formation and this is controlled by maintaining the moisture content below 12%. Ofless concern is contamination with salmonellae and Bacillus cereus. Frozen bakery productsinclude par-baked doughs that are intended to be cooked by the consumer. Their processingusually ensures destruction of vegetative cells but bacterial spores remain unaffected, as dosome heat-stable metabolites, such as mycotoxins, staphylococcal enterotoxins and emetictoxin of B. cereus.
2.5.2 Effects of freezing on micro-organisms associated withbakery products
The micro-organisms remaining in frozen bakery products, such as bacterial spores andother micro-organisms that result from handling product prior to freezing generally remainunaffected during freezing and frozen storage. Since the majority of these products are cookedby the consumer, they pose little risk in terms of consumer safety and they rarely spoil, becauseof the way they are prepared, which leaves little opportunity for growth to occur. The mainarea of concern with these products is handling/storage of raw materials and intermediateproducts prior to factory cooking, and the speed of freezing.
BLUK139-Evans January 23, 2008 17:24
42 Frozen Food Science and Technology
2.6 FUTURE TRENDS
A preliminary study in our own technology programme (previously unpublished) is sum-marised below to illustrate the future trend of increasing the content of nutrients and healthingredients in frozen food.
2.6.1 Opportunities for design in ‘ice cream’ formulationsand recipes
Ice cream is often considered to address the consumer needs of fun, indulgence and refresh-ment (Clarke, 2004) rather than as a worthwhile contributor to nutrition. However, the recentdrive towards healthier foods has stimulated research into improving the nutrient content ofice cream and the consumer of the future will view ice cream in a very different way. The factthat ice cream is frozen may be less of a driver for providing a cold (and therefore refreshing)treat; and rather more to do with the convenience of having a ready supply (i.e. stably storedin terms of microbiological safety and nutrient content) of portioned food. Furthermore, incontrast to frozen fish, meat, and vegetables, which are ‘harvested’, ice cream is ‘designed’.In other words, there is a very large range of ingredient profiles that can be used to deliver aparticular taste, texture, or eating sensation. For example, the fat content can vary from 15%in super-premium ice cream to virtually zero in sorbets and water ices; radically differentingredients can be added from Belgian chocolate to fruit. Whereas there is a notable nutrientvalue of all dairy products (as discussed in the previous section), the ‘designer’ aspect of icecream recipes and ingredient profiles affords an exciting opportunity for adding many morenutrients than is the norm today (including those not traditionally associated with ice cream).In principle, almost any nutrient could be added (subject to constraints from the regulatoryauthorities). Finally, since ice cream can also be designed to have a particular portion-size, aphysiologically significant quantity of each nutrient can be added per portion.
2.6.2 Stability of nutrients during ice cream processingand storage
This is a new technical area because ice cream has traditionally been seen as an occasionalsweet treat, rather than a ‘pleasurable food’. Moreover, the frequency of ice cream consump-tion has been too low to have a significant impact (either positive or negative) on nutrition.For example, in many European countries, the average per capita consumption of ice creamis less than 10 litres per annum (Clarke, 2004). Therefore, little attention has been paid tothe nutrient content of ice cream either when freshly prepared, during processing, or afterstorage. The stability of most nutrients during frozen storage can reasonably be assumed to begood in the frozen state (because the low temperature slows the chemistry of deterioration),but the stability of nutrients during the ‘freezing process’ (i.e. ice cream processing) is almostcompletely unknown. The industrial process for producing ice cream comprises a numberof unit steps including: homogenisation, pasteurisation, ‘ageing’, freezing and aeration, and‘hardening’. Each of these processing steps could potentially damage nutrient quality. Partic-ularly relevant to this chapter is the freezing process itself, which is a dynamic and continuousprocess.
The most commonly used ‘freezer’ is more correctly described as a scrape surface heatexchanger (SSHE). This simultaneously aerates and freezes the ice cream mix and the
BLUK139-Evans January 23, 2008 17:24
Effects of Freezing on Nutritional and Microbiological Properties of Foods 43
resultant ice cream is typically extruded at about −5◦C. The introduction of air at this stagecould also promote the oxidative deterioration of susceptible nutrients. After extrusion, theice cream is passed through a ‘hardening tunnel’ (an enclosed chamber where extremely coldair is blown over the ice cream) before storage (typically around −25◦C). It is also impor-tant to note that there are several different processes that are used in the ice cream industry.For example, there is a process known as ‘quiescent-freezing’ where the mix (either aeratedor non-aerated) is frozen statically; typically in moulds that are immersed in a brine bath(calcium chloride solution) or a mixture of water and ethylene glycol at about −40◦C. Eachof these different processes has the potential for impacting on nutrient quality in a differentway, depending on the processing temperature and the amount of aeration. For more infor-mation on ice cream processing, the reader is referred to Clarke (2004) and to Marshall et al.(2003).
2.6.3 Preliminary investigation of nutrient stability duringfreezing and storage of ice cream
By way of example, we have investigated how vitamin D and anti-oxidants were affected bythe freezing process and by storage. We selected vitamin D because it is low in many diets,particularly in the winter (Lamberg-Allardt et al., 2001; Diamond et al., 2005). Moreover,there are very few commonly available foods or food ingredients that are rich in vitaminD (cod liver oil being one notable exception), therefore the option of adding vitamin Dto a ‘designed’ food like ice cream is attractive. We selected anti-oxidants because they arepotentially beneficial for reducing the risk of cardiovascular disease (Voutilainen et al., 2006);also a high intake of some anti-oxidants has been associated with healthy skin, particularlyin the context of reduced ultraviolet light-induced damage (Stahl et al., 2000; Boelsmaet al., 2001). Even though it is possible to get anti-oxidants from fruits and vegetables, quitelarge amounts have to be consumed to significantly increase the anti-oxidant level in bloodplasma. Therefore, it is attractive to add anti-oxidants (in the form of refined ingredients) toa ‘designed’ product. Moreover, there is a patent in the field (Tijburg and Weststrate, 1997)that describes a food containing a cocktail of anti-oxidants such as vitamin E, lycopene, andβ-carotene.
To assess the stability of these nutrients in ice cream, pilot scale samples were preparedwith nutritionally significant quantities of either vitamin D or anti-oxidants (lycopene and β-carotene). In brief, a SSHE (Technohoy MF75) was used to prepare aerated ice cream (50% airphase by volume). Aerated ice cream was prepared because, as noted above, many chemicalreactions that lead to deterioration of nutrients are oxidative. Therefore, this experimentalapproach was seen as a stringent test case. Nutrient content was measured at several stagesduring processing and storage (in the pre-mix, post-homogenisation, post-freezing, and afterstorage for 1 week and 4 weeks at −20◦C). It was found that nutrient stability was very highboth during ice cream processing and during subsequent storage (see Figs. 2.2 and 2.3).
Our preliminary study resulted in an interesting finding. It suggests that the processingtechnology used for industrial ice cream manufacture may well be suitable for designingfrozen portioned-foods that are more nutritious than is the norm for ice cream today. Wepropose that this is (at least partly) because the process readily lends itself to the addition ofnutrients that (according to our data) are robust enough to survive both aeration and freezing.This is in contrast to the processing of frozen fruits and vegetables where blanching and/orfrozen storage can lead to significant loss of nutrients.

BLUK139-Evans January 23, 2008 17:24
44 Frozen Food Science and Technology
0.0
1.0
2.0
3.0
4.0
5.0
6.0
7.0
8.0
Ice
crea
m p
re-m
ix
Post-h
omogen
isat
ion
Post-fr
eeze
r
1 wee
k st
orage
at −2
0°C
4 wee
ks s
tora
ge at
−20°C
Vit
amin
D3
(μg
)
θφ
ρ
Fig. 2.2 Stability of vitamin D3 during ice cream processing and storage. Amounts are given in micro-grams (μg) per 60 g portion of ice cream.
0.00
2.00
4.00
6.00
8.00
10.00
12.00
14.00
Ice
crea
m p
re-m
ix
Post-h
omogen
isat
ion
Post-fr
eeze
r
1 wee
k st
orage
at −2
0°C
4 wee
ks s
tora
ge at
−20°C
An
ti-o
xid
ant
(mg
)
β-CaroteneLycopene
Fig. 2.3 Stability of anti-oxidants during ice cream processing and storage. Amounts of anti-oxidant aregiven in milligrams (mg) per 60 g portion of ice cream. Values for β-carotene are given in hatched bars,values for lycopene are given in solid bars.
2.7 CONCLUSIONS
2.7.1 Microbiological aspects
It is clear that freezing and frozen storage cannot be relied upon to completely destroy allmicro-organisms in foods. However, some micro-organisms, such as protozoa, multi-cellularparasites and less robust bacteria, such as Campylobacter are more easily damaged andsignificant reductions in numbers can be seen in these organisms, many of which are capableof causing foodborne disease if present even in low numbers. These cidal effects are utilisedin HACCP plans for some foods, such as beef and pork products, to eliminate the larvae ofhelminths and adult forms of multi-cellular parasites. In some foods, such as fish intendedto be eaten raw, the use of freezing is mandated by regulatory authorities (Schantz, 1989).
BLUK139-Evans January 23, 2008 17:24
Effects of Freezing on Nutritional and Microbiological Properties of Foods 45
According to Stern et al. (2003) one of the major factors responsible for the reduction incases of poultry-borne campylobacteriosis in Iceland was the introduction of a programmefor freezing carcasses from Campylobacter-positive flocks. Since then Iceland has mandateda policy for the continued use of this procedure. Other countries in Europe, such as Denmarkand Norway, have also introduced controls for Campylobacter spp. that include freezing ofpoultry carcasses. To be able to use freezing as a control for unwanted micro-organismsin foods requires good data, including validation ‘in-product’ using sensitive methods ofrecovery/detection. A number of areas for future research have been identified by Archer(2004). While these were considered in relation to improved control of food-borne pathogens,many would also provide better understanding of factors that may be used to enhance survivalof beneficial micro-organisms in frozen products, such as probiotics. Enhancement of cidaleffects against bacteria has been demonstrated by a combination of rapid freezing and slowthawing (Bogh-Sorenson, 2000). Other recent developments that have the potential to impacton microbiological activity in products during freezing/frozen storage include:� Pre-freeze treatment with preservatives applied to the food (Saurel, 2002), such as
potassium lactate and sodium diacetate, that has been shown to extend the lag time ofL. monocytogenes (Yoon et al., 2004);� Infusion of carbohydrates, which can increase the glass transition temperature abovestorage temperature, increasing shelf-life;� Application of high-pressure (e.g. 40 MPa) freezing, inhibiting enzyme activity in frozenfish;� Application of high-pressure thawing, allowing enhanced kill or growth inhibition ofmicro-organisms (Haack and Heinz, 2000).
Combinations of factors that have been shown to increase the survival of beneficial bacteriainclude addition of inulin to probiotic-fermented ice cream (Akin, 2005). Some studies havealso provided a better understanding of the factors that influence survival, such as productionof cold-induced proteins (Wang et al., 2005b).
2.7.2 Nutritional aspects
It is increasingly recognised that consumption of vegetables and fruits significantly reducesthe risk of some cancers, of cardiovascular disease and many age-related degenerative dis-eases (Goldberg, 2003). This awareness has given rise to public health campaigns in manycountries to increase the amount of vegetables and fruits consumed. Awareness of the impor-tance of vegetables and fruit consumption naturally leads to the question whether preservedand processed produce can be expected to have the same health benefits as raw produce.Because of the wealth of data available showing the excellent nutrient retention of frozenvegetables and fruits compared to fresh equivalents, the US Food and Drug Administrationformally announced in 1998 that ‘because frozen fruits and vegetable products are nutrition-ally comparable to the raw versions they would likely have the same inherent beneficial effectsas the raw version’. Although it is by no means certain, it appears likely that the beneficialeffects of consuming vegetables and fruits are not just a consequence of their recognisednutrients. A large number of potentially beneficial compounds, the so-called phytonutrients,or non-nutrient phytochemicals, are found in vegetables and fruits. It is not yet clear whichparticular compounds, or even which group of phytochemicals could be responsible for healthbenefits, but if and when the protective agents are identified, it will be necessary to ascertain
BLUK139-Evans January 23, 2008 17:24
46 Frozen Food Science and Technology
the effects of freezing and associated processes on their retention in frozen vegetables andfruits.
In the past, the hallmark of frozen foods has been microbiological safety. The frozen foodindustry has focussed on the provision of microbiologically safe, convenient, and good valuefoods. In the future, nutritional qualities will play an ever-increasing role, ranking alongsidemicrobiological safety in its importance to the industry.
The continuing challenge for the frozen food industry is to obtain a balance between ac-ceptable sensory characteristics, convenience, microbiological safety and nutritional quality.
Acknowledgements
The authors gratefully acknowledge the expertise of their colleagues Ian D. Smith and BeateNicol who carried out the analytical measurements for vitamin D and anti-oxidants.
REFERENCES
Abu Ruwaida, A.S., Sawaya, W.N., Hussein, A.S., Baroon, Z. and Khalafawi, S. (1996). Incidence of mi-croorganisms affecting shelf-life, quality and safety of locally-produced frozen broiler chickens in Kuwait.Arab Gulf Journal of Scientific Research 14(3), 609–628.
Akin, M.S. (2005). Effects of inulin and different sugar levels on viability of probiotic bacteria and thephysical and sensory characteristics of probiotic fermented ice-cream. Milchwissenschaft Milk ScienceInternational 60(3), 297–301.
Allah, M.A.A. and Zaki, M.S.A. (1974). Preservation of mango juice by freezing and canning. Nahrung18(2), 207–216.
Archer, D.L. (2004). Freezing: an underutilized food safety technology? International Journal of Food Mi-crobiology 90(2), 127–138.
Barrell, R.A.E. (1988). The survival and recovery of Salmonella typhimurium phage type U285 infrozen meats and tryptone soya yeast extract broth. International Journal of Food Microbiology 6(4),309–316.
Barrett, D.M. and Theerakulkait (1995). Quality indicators in blanched, frozen, stored vegetables. FoodTechnology January, 62–65.
Bayles, D.O., Tunick, M.H., Foglia, T.A. and Miller, A.J. (2000). Cold shock and its effect on ribosomes andthermal tolerance in Listeria monocytogenes. Applied and Environmental Microbiology 66(10), 4351–4355.
Bender, A.E. (1978). Food Processing and Nutrition. Academic Press.Bender, A.E. (1993). Nutritional aspects of frozen foods in frozen food technology. In: C.P. Mallett, ed. Blackie
Academic and Professional, pp. 123–140.Boelsma, E., Hendriks, H.F.J. and Roza, L. (2001). Nutritional skin care: health effects of micronutrients and
fatty acids. American Journal of Clinical Nutrition 73, 853–864.Bogh-Sorenson, L. (2000). Maintaining safety in the cold chain. In: C. Kennedy, ed. Managing Frozen Foods.
Cambridge: Woodhead Publishing Ltd.Bollman, J., Ismond, A. and Blank, G. (2001). Survivalo of Escherichia coli O157:H7 in frozen foods: impact
of the cold shock response. International Journal of Food Microbiology 64(1–2), 127–138.Buss, I.H., McGill, F., Darlow, B.A. and Winterbourn, C.C. (2001). Vitamin C is reduced in human milk after
storage. Acta Paediatric 90, 813–815.Cano, M.P. and Marin, M.A. (1995). Effects of freezing preservation on dietary fibre content of mango
(Mangifera indica L.) fruit. European Journal of Clinical Nutrition 49(Suppl 3), S257–S260.Chan, K.F., Tran, H.L., Kanenaka, R.Y. and Kathariou, S. (2001). Survival of clinical and poultry-derived
isolates of Campylobacter jejuni at a low temperature (4◦C). Applied and Environmental Microbiology67(9), 4186–4191.
Chang, V.P., Mills, E.W. and Cutter, C.N. (2003). Comparison of recovery methods for freeze-injured Listeriamonocytogenes, Salmonella typhimurium, and Campylobacter coli, in cell suspensions and associated withpork surfaces. Journal of Food Protection 66(5), 798–803.

BLUK139-Evans January 23, 2008 17:24
Effects of Freezing on Nutritional and Microbiological Properties of Foods 47
Clarke, C. (2004). The Science of Ice Cream. Cambridge: The Royal Society of Chemistry.Clydesdale, F.M., Ho, C.T., Lee, C.Y., Mondy, N.J. and Shewfelt, R.L. (1991). Effects of post-harvest treatment
and chemical interaction on the bioavailability of ascorbic acid thiamine, vitamin A carotenoids andminerals. Critical Reviews in Food Science in Food Science and Nutrition 30, 599–638.
Dawson, D. (2005). Foodborne protozoan parasites. International Journal of Food Microbiology 103(2),207–227.
Cortes, C., Esteve, M.J., Frıgola, A. and Torregrosa, F. (2005). Changes in carotenoids including geometricalisomers and ascorbic acid content in orange-carrot juice during frozen storage. European Food Researchand Technology 221, 125–131.
De Ancos, B., Gonzalez, E.M. and Cano, M.P. (2000). Ellagic acid, vitamin C, and total phenolic contentsand radical scavenging capacity affected by freezing and frozen storage in raspberry fruit. Journal ofAgriculture and Food Chemistry 48, 4565–4570.
Derzelle, S., Hallet, B., Ferain, T., Delcour, J. and Hols, P. (2003). Improved adaptation to cold-shock,stationary-phase, and freezing stresses in Lactobacillus plantarum overproducing cold-shock proteins.Applied and Environmental Microbiology 69(7), 4285–4290.
Diamond, T.H., Eisman, J.A., Mason, R.S., Nowson, C.A., Pasco, J.A., Sambrook, P.N. and Wark, J.D. (2005).Vitamin D and adult bone health in Australia and New Zealand: a position statement. Medical Journal ofAustralia 182(6), 281–285.
Dulavik, B., Sorensen, N.K., Barstad, H., Horvil, O. and Olsen, R.L. (1998). Oxidative stability of frozenlight and dark muscles of Saithe (Pollachius virens). Journal of Food Lipids 5, 233–245.
Dumont, F., Mraechal, P.A. and Gervais, P. (2003). Influence of cooling rate on Saccharomyces cerevisiaedestruction during freezing: unexpected viability at ultra-rapid cooling rates. Cryobiology 46(1), 33–42.
Engler, P.P. and Bowers, J.A. (1976). B-vitamin retention in meat during storage and preparation. Journal ofthe American Dietetics Association 69, 253–257.
Eichholzer, M., Tonz, O. and Zimmermann, R. (2006). Folic acid: a public-health challenge. The Lancet 367,1352–1361.
Favell, D.J. (1998). A comparison of the vitamin C content of fresh and frozen vegetables. Food Chemistry62, 59–64.
Fennema, O. (1975). Effects of freeze preservation on nutrients. In: R.S. Harris and E. Karmas, eds. NutritionalEvaluation of Food Processing, 2nd edn. Westport, CT: AVI Publishing.
Fonseca, F., Beal, C. and Corrieu, G. (2001). Operating conditions that affect the resistance of lactic acidbacteria to freezing and frozen storage. Cryobiology 43(3), 189–198.
Friend, B.A., Shahani, K.M., Long, C.A. and Vaughn, L.A. (1983). The effect of processing and storage onkey enzymes, B vitamins, and lipids of mature human milk I: evaluation of fresh samples and effects offreezing and frozen storage. Pediatric Research 17, 61–64.
Fuji, T., Kurihara, K. and Okuzumi, M. (1994). Viability and histidine-decarboxylase activity of halophilichistamine-forming bacteria during frozen storage. Journal of Food Protection 57(7), 611–613.
Georgsson, F., fiorkesson, A.E., Geirsdottir, M., Reiersen, J., Stern, N. (2006). The influence of freezing andduration of storage on Campylobacter and indicator bacteria in broiler carcasses. Food Microbiology 23(7),677–683.
Gilliland, S.E. (1981). Factors affecting cottage cheese starter cultures. Cultured Dairy Products Journal16(1), 15–17.
Godward, G., Sultana, K., Kailasapathy, K., Peiris, P., Arumugaswamy, R. and Reynolds, N. (2000). Theimportance of strain selection on the variability and survival of probiotic bacteria in dairy foods. Milch-wissenschaft 55(8), 441–445.
Goes, H.C.A., Torres, A.G., Donangelo, C.M. and Trugo, N.M.F. (2002). Nutrient composition of bankedhuman milk in Brazil and influence of processing on zinc distribution in milk fractions. Nutrition 18,590–594.
Goldberg, G. (2003). Plants: Diet and Health. Blackwell Publishing.Gonzalez, E.M., de Ancos, B. and Cano, M.P. (2003). Relation between bioactive compounds and free radical-
scavenging capacity in berry fruits during frozen storage. Journal of the Science of Food and Agriculture83, 722–726.
Haack, E. and Heinz, V. (2000). Improvement of food safety by high pressure processing. II Studies on usein the meat industry. Fleischwirtshaft 81(6), 38–41.
Hansen, R.K., Zhai, S., Skepper, J.N., Johnston, M.D., Alpar, H.O. and Slater, N.K.H. (2005). Mechanismsof inactivation of HSV-2 during storage in frozen and lyophilized forms. Biotechnology Progress 21(3),911–917.
BLUK139-Evans January 23, 2008 17:24
48 Frozen Food Science and Technology
Haynes, I.N. and Playne, M.J. (2002). Survival of probiotic cultures in low-fat ice-cream. Australian Journalof Dairy Technology 57(1), 10–14.
Heenan, C.N., Adams, M.C., Hosken, R.W. and Fleet, G.H. (2004). Survival and sensory acceptability ofprobiotic microorganisms in a nonfermented frozen vegetarian dessert. Lebensmittel Wissenschaft undTechnologie 37(4), 461–466.
Hong, S.H. and Marshall, R.T. (2001). Natural exopolysaccharides enhance survival of lactic acid bacteria infrozen dairy desserts. Journal of Dairy Science 84(6), 1367–1364.
Hoppner, K., Lampi, B. and Perrin, D.E. (1973). Folacin activity of frozen convenience foods. Journal of theAmerican Dietetic Association 63(5), 536–539.
Humphrey, T.J. and Cruikshank, J.G. (1986). Injury and recovery in freeze or heat-damaged Campylobacterjejuni. Letters in Applied Microbiology 3, 81–84.
Jeffreys, A.G., Hark, K.M., Steffan, R.J., Foster, J.W. and Bej, A.K. (1998). Growth, survival and character-isation of CspA in Salmonella enteritidis following cold shock. Current Microbiology 36(1), 29–35.
Kawahara, H. (2002). The structures and functions of ice crystal-controlling proteins from bacteria. Journalof Bioscience and Bioengineering 94(6), 492–496.
Lamberg-Allardt, C.J.E., Outila, T.A., Karkkainen, M.U.M., Rita, H.J. and Valsta, L.M. (2001). Vitamin Ddeficiency and bone health in healthy adults in Finland: could this be a concern in other parts of Europe?.Journal of Bone Health and Mineral Research 16(11), 2066–2073.
Larkin, J. and Stokes, J.L. (1968). Growth of psychrophilic microorganisms at subzero temperatures. CanadianJournal of Microbiology 14, 97–101.
Lawrence, R.A. (1999). Storage of human milk and the influence of procedures on immunological componentsof human milk. Acta Paediatric 88, 14–18.
Lee, F.A., Brooks, R.F., Pearson, A.M., Miller, J.I. and Wanderstock, J. (1954). Effects of freezing rateon meat; appearance palatability and vitamin content. Journal of the American Dietetic Association 30,351–354.
Lee, S.K. and Kader, A.A. (2000). Preharvest and postharvest factors influencing vitamin C content ofhorticultural crops. Postharvest Biology and Technology 20, 207–220.
Lim, Y.H., Hamdy, M.K. and Toledo, R.T. (2003). Combined effects of ionizing-irradiation and differ-ent environments on Clostridium botulinum type E spores. International Journal of Food Microbiology89(2–3), 251–263.
Lu, X., Cho, D., Hall, H., Rowe, T., Sung, H., Kim, W., Kang, C., Mo, I., Cox, N., Klimov, A. and Katz, J.(2003). Pathogenicity and antigenicity of a new influenza A (H5N1) virus isolated from duck meat. Journalof Medical Virology 69(4), 553–559.
Marshall, R.T., Goff, H.D. and Hartel, R.W. (2003). Ice Cream, 6th edn. New York: Kluwer Academic/PlenumPublishers.
McClure, P.J. (2002). Microbiological hazard identification in the meat industry. In: M. Brown, ed. HACCPin the Meat Industry. Cambridge, England: Woodhead Publishing Ltd.
McIntosh, G.H., Royle, P.J., Le Leu, R.K., Regester, G.O., Johnson, M.A., Grinsted, R.L., Kenward, R.S.and Smithers, G.W. (1998). Whey proteins as functional food ingredients. International Dairy Journal 8,425–434.
Mihoub, F., Royle, P.J., Le Leu, R.K., Regester, G.O., Johnson, M.A., Grinsted, R.L., Kenward, R.S. andSmithers, G.W. (2003). Cold adaptation of Escherichia coli: microbiological and proteomic approaches.International Journal of Food Microbiology 89(2–3), 171–184.
Mikkelsen, K., Rasmussen, E.L. and Zinck, O. (1984). Retention of vitamins B1, B2, and B6 in frozen meats.In: P. Zeuthen, ed. Thermal Processing and Quality of Foods. Elsevier Applied Science, pp. 777–781.
Moorhead, S.M. and Dykes, G.A. (2002). Survival of Campylobacter jejuni on beef trimmings during freezingand frozen storage. Letters in Applied Microbiology 34, 72–76.
Morgan, W. (1996). Effects of processing and preparation of foods on folate content. Australian Journal ofNutrition and Dietetics 53, S31–S35.
Mullen, W., Stewart, A.J., Lean, M.E.J., Gardner, P., Duthie, G.G. and Crozier, A. (2002). Effect of freezingand storage on the phenolics, ellagitannins, flavonoids, and antioxidant capacity of red raspberries. Journalof Agriculture and Food Chemistry 50, 5197–5201.
Murrell, K.D., Fayer, R. and Dubey, J.P. (1986). Parasitic organisms. In: A.M. Pearson and T.R. Dutson, eds.Advances in Meat Research, Vol. 2. Westport,CT: AVI Publishing, pp. 311–377.
Nichols, R. and Smith, H. (2002). Parasites: Cryptosporidium, Giardia and Cyclospora as foodbornepathogens. In: C. de W. Blackburn and P.J. McClure, eds. Foodborne Pathogens Hazards, Risk Analy-sis and Control. Cambridge: Woodhead Publishing Ltd., pp. 453–478.

BLUK139-Evans January 23, 2008 17:24
Effects of Freezing on Nutritional and Microbiological Properties of Foods 49
Nyman, M. (1995). Effects of processing on dietary fibre content of vegetables. European Journal of ClinicalNutrition 49, S215–S218.
Ottaway, P.B. (2002). The stability of vitamins during food processing. In: C.J.K. Henry and C. Chapman,eds. The Nutrition Handbook for Food Processors, 1st edn. CRC Press, Woodhead Publishing Ltd.,pp. 247–264.
Park, J.I., Grant, C.M., Davies, M.J. and Dawes, I.W. (1998). The cytoplasmic Cu, Zn, superoxide dismutaseof Saccharomyces cerevisiae is required for resistance to freeze-thaw stress: generation of free radicalsduring freezing and thawing. Journal of Biological Chemistry 273(36), 22921–22928.
Park, S.F. (2002). The physiology of Campylobacter species and its relevance to their role as food bornepathogens. International Journal of Food Microbiology 74(3), 177–188.
Park, Y.W., Lee, J.H. and Lee, S.J. (2006). Effects of frozen and refrigerated storage on organic acid profilesof goat milk plain soft and Monterey Jack cheeses. Journal of Dairy Science 89, 862–871.
Parvez, S., Malik, K.A., Kang, S.A. and Kim, H.-Y. (2006). Probiotics and their fermented food products arebeneficial for health. Journal of Applied Microbiology 100(6), 1171–1185.
Phillips, K.M., Simpkins, A.H., Amanna, K.R., Wolf, W., Stewart, K.K., Clark, S., Kim, K.P., Beecher, G.R.and Holden, J. (2001). Long-term stability of nutrients in a frozen mixed food control material. FresniusJournal of Analytical Chemistry 370, 297–302.
Polo, M.V., Lagarda, M.J. and Farre, R. (1992). The effect of freezing on mineral content of vegetables.Journal of food Composition and Analysis 5, 77–83.
Polvi, S.M., Ackman, R.G., Lall, S.P. and Saunders, R.L. (1991). Stability of lipids and omega-3 fatty acidsduring frozen storage of Atlantic salmon. Journal of Food Processing and Preservation 15, 167–181.
Prados, R., Pino, A., Rincon, F., Vioque, M. and Fernandez-Salguero, J. (2006). Influence of the frozenstorage on some characteristics of ripened Manchego-type cheese manufactured with a powdered vegetablecoagulant and rennet. Food Chemistry 95, 677–682.
Ranhotra, G.S. and Keagy, P.M. (1995). Adding folic acid to cereal-grain products. Cereal Foods World 40,73–76.
Refsgaard, H.H.F., Brockhoff, P.B. and Jensen, B. (1998). Sensory and chemical changes in farmed Atlanticsalmon (Salmo salar) during frozen storage. Journal of Agricultural and Food Chemistry 46, 3473–3479.
Rougerou, A. and Person, O. (1991). Influence of preservation method on unsaturated fatty acids of nutritionalinterest in sardines and mackerels. Medicine et Nutrition 27, 353–358.
Salem, M.M.E., Fathi, F.A. and Awad, R.A. (2006). Production of functional ice cream. Deutsche LebensmittelRundschau 102(7), 326–330.
Sanders, J.W., Venema, G. and Kok, J. (1999). Environmental stress response in Lactococcus lactis. FEMSMicrobiological Reviews 23(4), 483–501.
Saurel, R. (2002). Use of vacuum technology to improve processed fruit and vegetables. In: W. Jongen, ed.Fruit and Vegetable Processing: Improving Quality. Cambridge: Woodhead Publishing Ltd., pp. 359–363.
Schantz, P.M. (1989). The dangers of eating fish raw. New England Journal of Medicine 320, 1143–1145.Shewfelt, R.L. (1990). Sources of variation in the nutrient content of agricultural commodities from the farm
to the consumer. Journal of Food Quality 13, 37–54.Shortt, C. and O’Brien, J., eds. (2004). Handbook of Functional Dairy Products. Boca Raton: CRC Press.Skrupskis, I., Aboltins, A. and Iljins, U. (2003). Durable storage possibility of fruit and berries. Acta Horti-
culturae 599, 719–724.Stahl, W., Heinrich, U., Jungmann, H., Sies, H. and Tronnier, H. (2000). Carotenoids and carotenoids plus
vitamin E protect against ultraviolet light-induced erythema in humans. American Journal of ClinicalNutrition 71, 795–798.
Stead, D. and Park, S.F. (2000). Roles of Fe superoxide dismutase and catalase in resistance of Campylobactercoli to freeze-thaw stress. Applied and Environmental Microbiology 66(7), 110–112.
Stern, N.J., Hiett, K.L., Alfredsson, G.A., Kristensson, K.G., Reierson, J., Hardardottir, H., Briem, H., Gun-narsson, E., Georgsson, F., Lowman, R., Berndtson, E., Lammerding, A.M., Paoli, G.M. and Musgrove,M.T. (2003). Campylobacter spp. in Icelandic poultry operations and human disease. Epidemiology andInfection 130, 20–32.
Szeto, Y.T., Tomlinson, B. and Benzie, I.F.F. (2002). Total antioxidant and ascorbic acid content of fresh fruitand vegetables: implications for dietary planning and food preservation. British Journal of Nutrition 87,55–59.
Tanghe, A., Van Dijck, P., Dumortier, F., Teunissen, A., Hohmann, S. and Thevelein, J.M. (2002). Aquaporinexpression correlates with freeze tolerance in baker’s yeast, and overexpression improves freeze tolerancein industrial strains. Applied and Environmental Microbiology 68(12), 5981–5989.
BLUK139-Evans January 23, 2008 17:24
50 Frozen Food Science and Technology
Tejada, L., Sanchez, E., Gomez, R., Vioque, M. and Fernandez-Salguero, J. (2002). Effect of freezing andfrozen storage on chemical and microbiological characteristics in sheep milk cheese. Journal of FoodScience 67(1), 126–129.
Tijburg, L.B.M. and Weststrate, J.A. (1997). Antioxidant comprising food products. European Patent, Pub-lication number EP 0 845 951 B1.
Torija, E., Dıez, C., Matallana, C., Camara, M., Camacho, E. and Mazarıo, P. (1998). Influence of freezingprocess on free sugars content of papaya and banana fruits. Journal of the Science of Food and Agriculture76, 315–319.
Vahteristo, L.T., Lehikoinen, K.E., Ollilainen, V., Koivistoinen, P.E. and Varo, P. (1998). Oven-baking andfrozen storage affect folate vitamer retention. Lebensmittel Wissenschaft und Technologie 31, 329–333.
Verdini, R.A., Zorrilla, S.E. and Rubiolo, A.C. (2005). Effects of the freezing process on proteolysis duringthe ripening of Port Salut Argentino cheeses. International Dairy Journal 15, 363–370.
Vidal-Valverde, C., Ruiz, R. and Medrano, A. (1992). Stability of retinol in milk during frozen and otherstorage conditions. Zeitschrift fur Lebensmittel-Untersuchung und-Forschung 195, 562–565.
Vidal-Valverde, C., Ruiz, R. and Medrano, A. (1993). Effects of frozen and other storage conditions on[alpha]-tocopherol content of cow milk. Journal of Dairy Science 76, 1520–1525.
Voutilainen, S., Nurmi, T., Mursu, J. and Rissanen, T.H. (2006). Carotenoids and cardiovascular health.American Journal of Clinical Nutrition 83, 1265–1271.
Wang, Y., Corrieu, G. and Beal, C. (2005a). Fermentation pH and temperature influence the cryotolerance ofLactobacillus acidophilus. Journal of Dairy Science 88(1), 21–29.
Wang, Y., Delette, M., Guillot, G. and Beal, C. (2005b). Influence of cooling temperature and duration oncold-adaptation of Lactobacillus acidophilus. Cryobiology 50(3), 294–307.
Wang, Q.-H., Souza, M., Funk, J.A., Zhang, W. and Saif, L.J. (2006). Prevalence of noroviruses andsapoviruses in swine of various ages determined by reverse transcription-PCR and microwell hybridizationassays. Journal of Clinical Microbiology 44(6), 2057–2062.
Westerman, B.D. (1952). B-complex vitamins in meat IV; influence of storage time and temperature onvitamins in pork roasts. Journal of the American Dietetics Association 28, 331–335.
Williams, D.C., Lim, M.H., Chen, A.O., Pangborn, R.M. and Whitaker, J.R. (1986). Blanching of vegetablesfor freezing – which indicator enzyme to choose. Food Technology June, 130–139.
Xing, Y., Yoo, Y., Kelleher, S.D., Nawar, W.W. and Hultin, H.O. (1993). Lack of changes in fatty acidcomposition of mackerel and cod during iced and frozen storage. Journal of Food Lipids 1, 1–14.
Yang, C.-Y., Pang, J.-C., Kao, S.-S. and Tsen, H.-Y. (2003). Enterotoxigenicity and cytotoxicity of Bacillusthuringiensis strains and development of a process for Cry1Ac production. Journal of Agricultural andFood Chemistry 51(1), 100–105.
Yoon, K.S., Burnette, C.N., Abou-Zeid, K.A. and Whiting, R.C. (2004). Control of growth and survivalof Listeria monocytogenes on smoked salmon by combined potassium lactate and sodium diacetate andfreezing stress during refrigeration and frozen storage. Journal of Food Protection 67(11), 2465–2471.

BLUK139-Evans January 23, 2008 17:26
3 Modelling of Freezing Processes
Q. Tuan Pham
3.1 INTRODUCTION
The mathematical modelling of food freezing processes poses special challenges. Thermo-physical properties such as specific heat and thermal conductivity change suddenly aroundthe freezing point, leading to highly non-linear partial differential equations that are diffi-cult to solve. In complex-shaped objects, the progress of the freezing front can be highlyunpredictable. Freezing is also associated with large and sudden volume changes, masstransfer, stress and cracking, cellular dehydration, supercooling, and ice nucleation and prop-agation, phenomena on which detailed studies are only beginning now. The main concernabout frozen storage is moisture migration both on the macro (weight loss) and micro scales(recrystallisation).
Methods that have been applied to model the freezing processes can be classified intoanalytical, empirical and numerical techniques. The choice of technique depends on theobjectives of the modellers and the technical means at their disposal. Analytical techniquesproduce exact results provided their underlying assumptions are fulfilled, which is rarely thecase. Their main usefulness is in providing benchmark results for the verification of othermethods. Empirical formulas are derived with the objective of providing quick answers, usingno more than a hand calculator or spreadsheet, with accuracy (usually 10%) enough for mostindustrial users. They can be used only in situations similar to those used to derive and validatethe formulas. Numerical methods can in principle provide exact or near-exact predictions foralmost any situation, although in practice their accuracy is limited by inadequate knowledgeof the problem’s parameters (product properties, geometry, flow characteristics). For complexproblems such as freezing with simultaneous heat and mass transfer, nucleation-controlledfreezing or the solidification of liquid products, numerical methods are always the first choice.There are now powerful numerical modelling software packages in the market, allowing non-expert users to model complicated situations. To use them successfully, however, a minimumbasic knowledge of heat, mass and momentum transfer and of the principles of numericalmodelling is still required of the user.
This chapter starts by reviewing the various types of methods used in modelling freezingprocesses that involve only heat transfer, the simplest type of freezing. It then addresses morecomplicated situations involving mass transfer on a macroscale (between food and environ-ment) or microscale (between cells and extracellular phase), supercooling and nucleation,high pressure, or fluid flow. As most readers will use commercial modelling software ratherthan write their own programs, the modelling of some freezing processes using commoncommercial software will be described. While trying to be as comprehensive as possible, it isassumed that the reader, whether college student or industrial user, wants practical guidance
Frozen Food Science and Technology. Edited by Judith A. Evans
© 2008 Blackwell Publishing Ltd, ISBN: 978-1-4051-5478-9
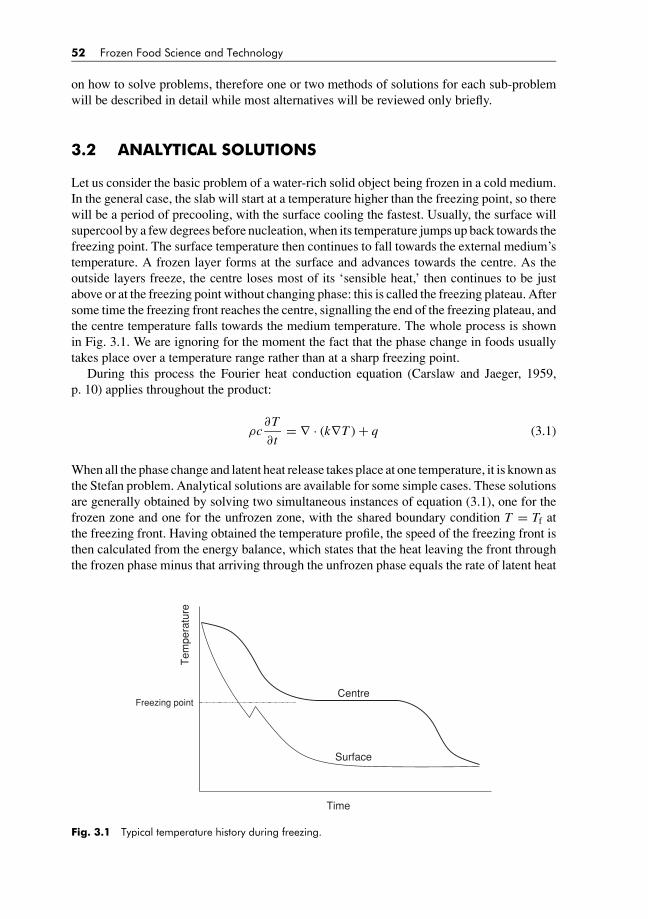
BLUK139-Evans January 23, 2008 17:26
52 Frozen Food Science and Technology
on how to solve problems, therefore one or two methods of solutions for each sub-problemwill be described in detail while most alternatives will be reviewed only briefly.
3.2 ANALYTICAL SOLUTIONS
Let us consider the basic problem of a water-rich solid object being frozen in a cold medium.In the general case, the slab will start at a temperature higher than the freezing point, so therewill be a period of precooling, with the surface cooling the fastest. Usually, the surface willsupercool by a few degrees before nucleation, when its temperature jumps up back towards thefreezing point. The surface temperature then continues to fall towards the external medium’stemperature. A frozen layer forms at the surface and advances towards the centre. As theoutside layers freeze, the centre loses most of its ‘sensible heat,’ then continues to be justabove or at the freezing point without changing phase: this is called the freezing plateau. Aftersome time the freezing front reaches the centre, signalling the end of the freezing plateau, andthe centre temperature falls towards the medium temperature. The whole process is shownin Fig. 3.1. We are ignoring for the moment the fact that the phase change in foods usuallytakes place over a temperature range rather than at a sharp freezing point.
During this process the Fourier heat conduction equation (Carslaw and Jaeger, 1959,p. 10) applies throughout the product:
ρc∂T
∂t= ∇ · (k∇T ) + q (3.1)
When all the phase change and latent heat release takes place at one temperature, it is known asthe Stefan problem. Analytical solutions are available for some simple cases. These solutionsare generally obtained by solving two simultaneous instances of equation (3.1), one for thefrozen zone and one for the unfrozen zone, with the shared boundary condition T = Tf atthe freezing front. Having obtained the temperature profile, the speed of the freezing front isthen calculated from the energy balance, which states that the heat leaving the front throughthe frozen phase minus that arriving through the unfrozen phase equals the rate of latent heat
Time
Tem
pera
ture
Centre
Surface
Freezing point
Fig. 3.1 Typical temperature history during freezing.

BLUK139-Evans January 23, 2008 17:26
Modelling of Freezing Processes 53
release: (k
dT
dn
)frozen
−(
kdT
dn
)unfrozen
= ρL fvf (3.2)
where n is the distance normal to the front and vf the velocity of the front (Fig. 3.2).Although their practical usefulness is limited, analytical solutions provide useful results
for checking the validity of numerical calculations. For the freezing of a semi-infinite body(half space) subjected to a step change in surface temperature, the analytical solution is givenin Carslaw and Jaeger (1959, p. 283). It can be used to calculate the approximate temperaturechange, heat load and freezing rate in the initial period of freezing, when the frozen layer isthin compared to the dimension of the product. The freezing of a corner region subjected tosimilar conditions has been solved analytically by Budhia and Kreith (1973). Plank’s (1913a,1913b) pseudo-steady state solution, which would apply to the hypothetical case of zerospecific heats, can be written in the following form (Pham, 1986a):
tPlank = ρL f R
Eh(Tf − Ta)
(1 + Bi
2
)(3.3)
where the shape factor E is 1 for slabs, 2 for infinite cylinders and 3 for spheres. For multi-dimensional regular shapes (infinite rectangular rods, finite cylinders, rectangular bricks),analytical expressions for E in the form of infinite series (McNabb et al., 1990a, 1990b) andplots (Hossain et al., 1992a) are also available.
An approximate solution has been derived for a sphere with non-zero specific heat, initiallyat the freezing temperature, using perturbation methods (Riley et al., 1974):
t = 3η2 − 2η3
6+ η2Ste
6− η2Ste2
45(1 − η)+ O(Ste3) (3.4)
where η = R − rf
Ris the dimensionless frozen thickness and Ste = cf (Tf − Ta)/L f is the
Stefan number. The equation is applicable for up to η ≈ 0.8, or 99% frozen fraction.
Unfrozen zoneFrozen zone
Freezing front
T profile
Heat fl
ow fr
om fr
ont
Heat flow to front
vf
n
Fig. 3.2 Energy balance at the freezing front.

BLUK139-Evans January 23, 2008 17:26
54 Frozen Food Science and Technology
3.3 EMPIRICAL FORMULAE
3.3.1 Freezing time
3.3.1.1 Simple shapes
Cleland and Earle (1977, 1979a, 1979b, 1982, 1984) were the first to take a systematicapproach to developing an empirical freezing time prediction method that takes into accountthe sensible heat effects, backed up by carefully collected data covering most of the range ofinterest to industry. Cleland and Earle’s final equation (1984) can be written as follows forthe three basic shapes (infinite slabs, infinite cylinders and spheres):
tf = ρ�H10
E(Tf − Ta)
(2P1 R
h+ 4P2 R2
kf
) [1 − 1.65Ste
kfln
(Tc − Ta
Tref − Ta
)](3.5)
whereP1 = 0.5[1.026 + 0.5808Pk + Ste(0.2296Pk + 0.1050)]P2 = 0.125[1.202 + Ste(3.41Pk + 0.7336)]
Pk = cu(Ti − Tf)
L f
Ste = cf(Tf − Ta)
L f
E is the shape factor (1 for slabs, 2 for infinite cylinders, 3 for spheres). Pk and Ste aredimensionless numbers which express the magnitude of precooling and post-cooling effects,respectively. Many other empirical freezing times methods have since been developed. Asurvey by Cleland (1990) lists 62 such methods, and many more have been proposed sincethen. Some of the methods can be considered semi-analytical, in that they are based onapproximate analytical reasoning and try to correlate experimental data with a minimum ofempirical parameters; among these are methods based on the addition of precooling, phasechange and post-cooling times by de Michelis and Calvelo (1982) and Pham (1984, 1986a).
The ultimate criterion for choosing an empirical correlation is that it should yield anacceptably accurate result with as little effort as possible. The most thorough validationof various methods against data was performed by Cleland (1990, p. 114) and Pham andWillix (1990). Cleland compared the predictions of six well-known methods to a compositedataset formed by merging the most reliable experimental data available, as well as to finitedifferences calculations. Pham and Willix tested four methods against a composite datasetconsisting of 280 previous data and 32 new data from their own tests. These systematiccomparisons showed that Pham’s methods (1984, 1986a) were the most accurate ones ofall the methods tested. Hossain et al. (1992a, 1992b, 1992c) have also shown that Pham’smethods give accurate results for complex shapes when combined with appropriate shapefactors.
Pham’s (1986a) method can be written as follows:
tf = R
Eh
(�H1
�T1+ �H2
�T2
) (1 + Bi
2
)(3.6)
where�H1 and�T1 are the specific enthalpy change and temperature difference, respectively,for the precooling period, and �H2 and �T2 those for the combined freezing—post-cooling
BLUK139-Evans January 23, 2008 17:26
Modelling of Freezing Processes 55
period, calculated from:
�H1 = Hi − Hfm = ρucu(Ti − Tfm) (3.6a)
�T1 = (Ti + Tfm)
2 − Ta(3.6b)
�H2 = Hfm − Hc = ρf[L f + cf(Tfm − Tc)] (3.6c)
�T2 = Tfm − Ta (3.6d)
Tfm is the ‘mean freezing temperature’ and the following equation is probably valid for mostwater-rich biological materials:
Tfm = 1.8 + 0.263Tc + 0.105Ta (3.6e)
It can be readily seen that equation (3.6) is an extension to Plank’s equation, equation (3.3),with the term �H1/�T1 representing the precooling time, �H2/�T2 representing the phasechange–post-cooling time, and the term 1 + Bi/2 representing the effect of internal resistanceto heat transfer. Tfm is a ‘mean freezing temperature’ which represents some kind of time-averaged product temperature during the combined phase change and post-cooling period. Inthe expression for Tfm, the term involving Tc expresses the effect of the post-cooling period onthe mean product temperature, while the term involving Ta can be interpreted as a correctionfor the temperature profile in the frozen product during the phase change and post-coolingperiods. The three constants in Tfm are the only empirical parameters in Pham’s method.
Equation (3.6) has been extended to the freezing of foodstuffs with variations in environ-mental conditions (Pham, 1986b) and to the asymmetric freezing of slabs (Pham, 1987a).
3.3.1.2 Multi-dimensional shapes
The freezing of an irregular shape can be approximated by that of an equivalent regular shape;for example, Illicali and Holacar (1990) approximated an ellipsoid by an equivalent sphere.The technique has also been frequently used on specific products such as lamb legs. Thisapproach is likely to be useful only when the variation in Biot number is not great, since theeffect of shape depends greatly on this parameter, and the deviation from the standard shapenot too large.
Based on the observation that, under the same conditions, the freezing time of a slab istwice that of an infinite cylinder with the same thickness/diameter and three times that of asphere, Cleland and Earle (1982) proposed that a similar ratio can be found for other shapes.They termed this ratio the ‘equivalent heat transfer dimensionality’, E . Thus:
tf (any shape) = tf (slab)
E(3.7)
For regular shapes (infinite rectangular rods, finite cylinders, rectangular bricks), analyticalexpressions for E were derived by McNabb et al. (1990a, 1990b) and reproduced in Hossainet al. (1992a) who also plotted them for Bi = 0.005–50 and aspect ratios up to 10. Simplifiedapproximate equations for shape factors for common cases have also been proposed and arelisted below. It should be kept in mind that these tend to be more accurate at moderate aspectratios and low to moderate Biot numbers.
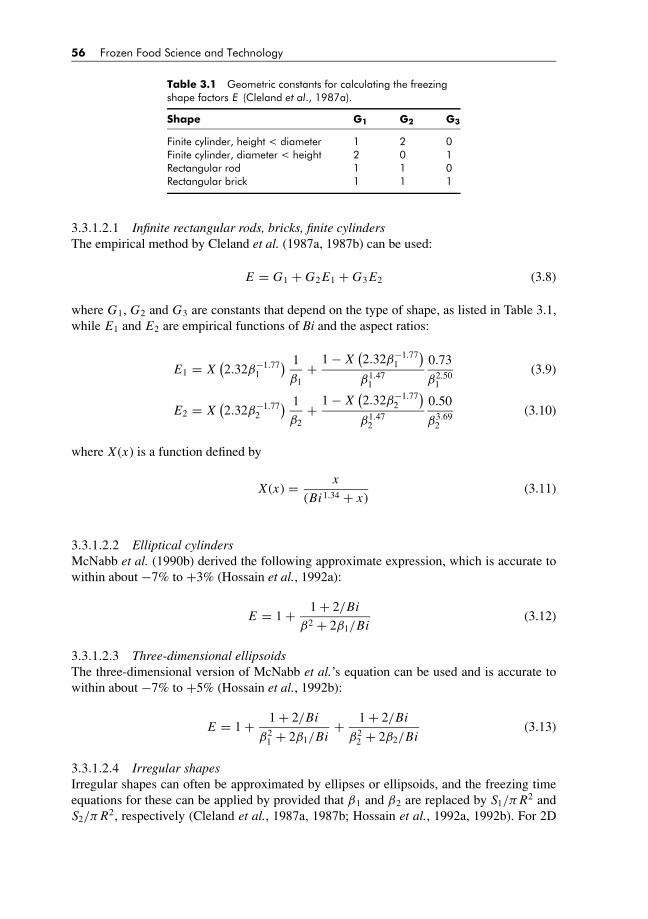
BLUK139-Evans January 23, 2008 17:26
56 Frozen Food Science and Technology
Table 3.1 Geometric constants for calculating the freezingshape factors E (Cleland et al., 1987a).
Shape G1 G2 G3
Finite cylinder, height < diameter 1 2 0Finite cylinder, diameter < height 2 0 1Rectangular rod 1 1 0Rectangular brick 1 1 1
3.3.1.2.1 Infinite rectangular rods, bricks, finite cylindersThe empirical method by Cleland et al. (1987a, 1987b) can be used:
E = G1 + G2 E1 + G3 E2 (3.8)
where G1, G2 and G3 are constants that depend on the type of shape, as listed in Table 3.1,while E1 and E2 are empirical functions of Bi and the aspect ratios:
E1 = X(2.32β−1.77
1
) 1
β1+ 1 − X
(2.32β−1.77
1
)β1.47
1
0.73
β2.501
(3.9)
E2 = X(2.32β−1.77
2
) 1
β2+ 1 − X
(2.32β−1.77
2
)β1.47
2
0.50
β3.692
(3.10)
where X (x) is a function defined by
X (x) = x
(Bi1.34 + x)(3.11)
3.3.1.2.2 Elliptical cylindersMcNabb et al. (1990b) derived the following approximate expression, which is accurate towithin about −7% to +3% (Hossain et al., 1992a):
E = 1 + 1 + 2/Bi
β2 + 2β1/Bi(3.12)
3.3.1.2.3 Three-dimensional ellipsoidsThe three-dimensional version of McNabb et al.’s equation can be used and is accurate towithin about −7% to +5% (Hossain et al., 1992b):
E = 1 + 1 + 2/Bi
β21 + 2β1/Bi
+ 1 + 2/Bi
β22 + 2β2/Bi
(3.13)
3.3.1.2.4 Irregular shapesIrregular shapes can often be approximated by ellipses or ellipsoids, and the freezing timeequations for these can be applied by provided that β1 and β2 are replaced by S1/π R2 andS2/π R2, respectively (Cleland et al., 1987a, 1987b; Hossain et al., 1992a, 1992b). For 2D
BLUK139-Evans January 23, 2008 17:26
Modelling of Freezing Processes 57
irregular shapes, S1 is the cross-sectional area and R is the smallest half-dimension. For 3Dirregular shapes, S1 represents the areas of the (approximately) smallest cross-section andS2 represents the cross-section through the smallest diameter orthogonal to the first. Somesubjective judgement has to be used for highly irregular or non-symmetrical shapes, and thinprotrusions may have to be ignored.
3.3.2 Freezing heat load
Knowledge of the dynamic product heat load is important for designing refrigeration systems.Commercial food freezing processes usually start with a precooling period before phasechange occurs. The dynamic heat load during the precooling period can be estimated followingPham (2001). For the phase-change period, the method of Lovatt et al. (1993a, 1993b) canbe used. A slightly simplified version of this method (lumping the freezing and post-coolingheat load together) will be presented here. By considering the movement of the freezing front,the following approximate equation for heat load is obtained:
Q = −�H2drf
dt
dVf
drf(3.14)
where �H2 is the latent + post-cooling heat as defined earlier, drf/dt is the freezing frontvelocity and dVf/drf the change of frozen volume with frozen depth. The former can becalculated from Plank’s (1913a) equation or Pham’s (1986a) equation:
drf
dt= −(Ta − Tf)
�H2r E−1f
[(1/h RE−1) − (
r2−Ef − R2−E/kf(2 − E)
)] (3.15)
while the latter is a function of geometry and can be calculated from
dVf
drf= Z
V
R
( rf
R
)Z−1(3.16)
The freezing time shape factor E can be calculated as before. For simple shapes (infiniteslabs, infinite cylinders and spheres), Z = E , while for other shapes
Z ≈ AR
V(3.17)
For very irregular shapes with protrusions AR/V may be larger than 3, which would giveunrealistic results, hence the following upper limit should be imposed:
Z ≤ 3
Lovatt et al.’s method has been validated against numerical computations and experimentaldata. The simplification presented in this chapter (lumping together the latent and post-coolingheat loads) is not expected to affect its validity, since the post-cooling load is small (10% orless) compared to the latent load.
BLUK139-Evans January 23, 2008 17:26
58 Frozen Food Science and Technology
3.4 NUMERICAL SOLUTION OF THECONDUCTION EQUATION
3.4.1 Discretisation of the conduction equation
The numerical solution of equation (3.1) involves two steps: discretising the space domainto obtain a set of ordinary differential equations (ODE) relating the nodal temperatures, thensolving this set of ODEs. The ODEs can be written in matrix form as
CdTdt
+ KT = f (3.18)
where T is a vector of nodal temperatures, C is the global capacitance matrix containingthe specific heat c, K the global conductance matrix containing the thermal conductivity k,and f the global forcing matrix containing known terms arising from heat generation andboundary conditions. The exact form of equation (3.18) depends on which method is usedfor discretising space. The most common such methods are finite difference (FDM), finiteelement (FEM) and finite volume (FVM).
FDM is most convenient and efficient for problems involving simple geometries. Forshapes that do not deviate too much from a regular geometry, the use of a boundary fitted grids(Thompson et al., 1982) extends the use of FDM, which is much faster than the unstructuredmeshes of FEM or FVM. FDM involves superimposing a grid of structured (arrayed) nodes onthe calculation domain. For each node, equation (3.1) is written down, with the temperaturegradients around each node calculated by central differences. When all such equations areput together, we obtain the matrix equation (3.18).
With FDM there are problems in discretising a Neumann (Newton’s cooling law) boundarycondition. The surface flux applies at the surface node itself, while the flux on the inner sideof the surface node applies at a point �x/2 away, causing an asymmetric situation. Anotherpractical problem is that with very high heat transfer coefficients, the temperature of thesurface nodes may be subjected to instabilities due to the excessive surface heat flux. Theboundary condition is handled better by the control-volume formulation of FDM (actually anFVM method), where the solid is first divided into control volumes and the nodes are placedin the middle of each control volume.
Having obtained a set of ODEs in time relating the nodal temperatures (equation (3.18)),solution will proceed in a series of time steps starting from the known initial conditions:
CTNew − T
�t= −KT + f (3.19)
On the right-hand side of equation (3.19), some time-averaged value of the nodal temperaturesmust be used, such as:
T = αTNew(1 − α)T (3.20)
where the superscript ‘New’ refers to temperatures at the end of the time step. α is a parametervarying between 0 and 1. The most popular stepping method is Crank–Nicolson (α = 0.5)in view of its combination of unconditional stability and second-order accuracy (Crank andNicolson, 1947). The Lees three-level scheme (1976) is also popular in the food freezingliterature and is often believed to be particularly suited for handling variable properties.
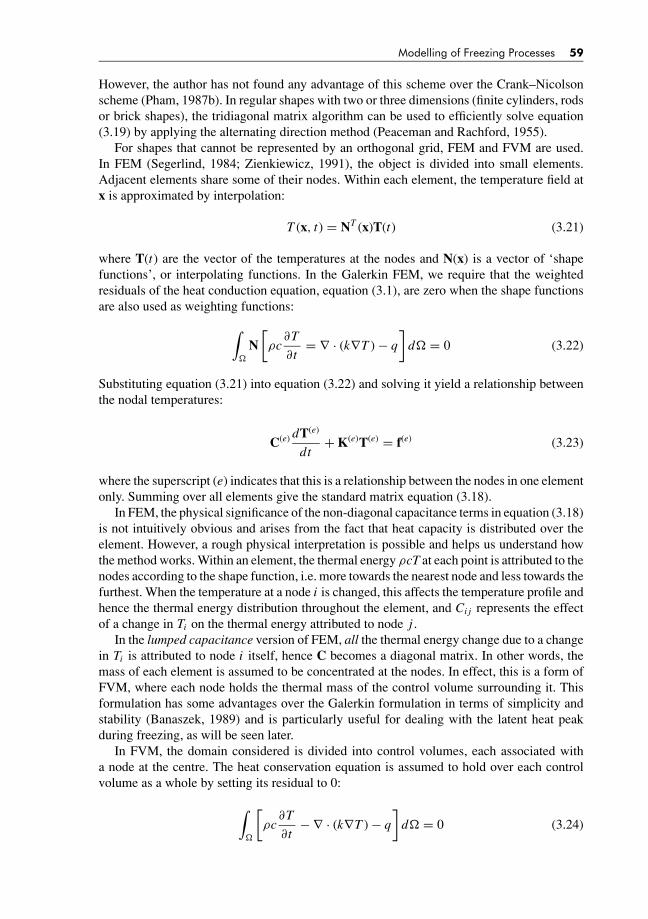
BLUK139-Evans January 23, 2008 17:26
Modelling of Freezing Processes 59
However, the author has not found any advantage of this scheme over the Crank–Nicolsonscheme (Pham, 1987b). In regular shapes with two or three dimensions (finite cylinders, rodsor brick shapes), the tridiagonal matrix algorithm can be used to efficiently solve equation(3.19) by applying the alternating direction method (Peaceman and Rachford, 1955).
For shapes that cannot be represented by an orthogonal grid, FEM and FVM are used.In FEM (Segerlind, 1984; Zienkiewicz, 1991), the object is divided into small elements.Adjacent elements share some of their nodes. Within each element, the temperature field atx is approximated by interpolation:
T (x, t) = NT (x)T(t) (3.21)
where T(t) are the vector of the temperatures at the nodes and N(x) is a vector of ‘shapefunctions’, or interpolating functions. In the Galerkin FEM, we require that the weightedresiduals of the heat conduction equation, equation (3.1), are zero when the shape functionsare also used as weighting functions:∫
N[ρc
∂T
∂t= ∇ · (k∇T ) − q
]d = 0 (3.22)
Substituting equation (3.21) into equation (3.22) and solving it yield a relationship betweenthe nodal temperatures:
C(e) dT(e)
dt+ K(e)T(e) = f(e) (3.23)
where the superscript (e) indicates that this is a relationship between the nodes in one elementonly. Summing over all elements give the standard matrix equation (3.18).
In FEM, the physical significance of the non-diagonal capacitance terms in equation (3.18)is not intuitively obvious and arises from the fact that heat capacity is distributed over theelement. However, a rough physical interpretation is possible and helps us understand howthe method works. Within an element, the thermal energy ρcT at each point is attributed to thenodes according to the shape function, i.e. more towards the nearest node and less towards thefurthest. When the temperature at a node i is changed, this affects the temperature profile andhence the thermal energy distribution throughout the element, and Ci j represents the effectof a change in Ti on the thermal energy attributed to node j .
In the lumped capacitance version of FEM, all the thermal energy change due to a changein Ti is attributed to node i itself, hence C becomes a diagonal matrix. In other words, themass of each element is assumed to be concentrated at the nodes. In effect, this is a form ofFVM, where each node holds the thermal mass of the control volume surrounding it. Thisformulation has some advantages over the Galerkin formulation in terms of simplicity andstability (Banaszek, 1989) and is particularly useful for dealing with the latent heat peakduring freezing, as will be seen later.
In FVM, the domain considered is divided into control volumes, each associated witha node at the centre. The heat conservation equation is assumed to hold over each controlvolume as a whole by setting its residual to 0:∫
[ρc
∂T
∂t− ∇ · (k∇T ) − q
]d = 0 (3.24)

BLUK139-Evans January 23, 2008 17:26
60 Frozen Food Science and Technology
The first term in the volume integral is calculated by assuming that T is uniform in the controlvolume and equal to the nodal temperature. Using the divergence theorem, the second termcan be transformed into the net heat flow over the volume’s boundaries. The heat flow througheach surface is assumed to be a linear function of the nodal temperatures in the vicinity ofthe surface. Thus, equation (3.24) can be replaced by
δVρc∂Ti
∂t=
N∑j=1
k Bi j Tj + qδV (3.25)
where Bi j are coefficients that depend on the nodal arrangement.Assembling all these nodal again yields equation (3.18). As with FDM or lumped capaci-
tance FEM (but unlike Galerkin FEM), in this case C is a diagonal matrix, which will presentsome advantages.
3.4.2 Dealing with latent heat release
The major difficulty in the numerical solution of the heat transport equation is in dealingwith the large latent heat, which evolves over a very small temperature range. Voller (1996)reviews the techniques for dealing with phase change. These methods can be divided intofixed grid methods and moving grid methods. In the latter, the object is divided into a frozenzone and an unfrozen zone. Some nodes, element boundaries or control volume boundariesare put on the freezing front and allowed to move with it.
Moving grid methods can give precise, non-oscillating solutions for the temperature and icefront position. They have been applied by Califano and Zaritsky (1997) to the freezing of foodswith irregular two-dimensional geometry. However, moving grid methods are less flexiblethan fixed grid methods because most foods do not have a sharp phase change temperaturebut freeze gradually, hence it is not clear how the freezing front should be defined. With foodsof complex shape, the calculation of the front’s position and subsequent grid adjustment is amajor task. Therefore, this article will concentrate on fixed grid methods. The freezing frontcan still be located in these methods by carrying out an interpolation to locate the positionwhere the freezing temperature applies (Pham, 1986c; Udaykumar, 2002).
3.4.2.1 Source term methods
In one type of fixed grid methods (Voller and Swaminathan, 1991), latent heat is treated as asource term, i.e. is included in the term q in equation (3.1):
q = ρ�g
�t(3.26)
where �t is the time step and �g is the latent heat per unit mass released over �t . Since �gdepends on the temperature change T New − T , an iterative method such as Newton–Raphsonhas to be used for the solution: the new nodal temperature are calculated, the source termsre-estimated, and the equations solved again for nodal temperatures. Fundamentally, there islittle distinction between the source term methods and the apparent specific heat methods,apart from the details of the iteration procedure, since the discretised equation (equation(3.19)) in both methods is the same. Source term methods are popular in the modelling ofmetal casting, where a well-defined freezing range exists and the latent heat can be clearlydistinguished from the specific heat.

BLUK139-Evans January 23, 2008 17:26
Modelling of Freezing Processes 61
Spe
cific
hea
t c
Temperature (T )
(a)
(b)
Fig. 3.3 Apparent specific heat for (a) a material with sharp phase change, (b) a material with gradualphase change.
3.4.2.2 Apparent specific heat method
In the apparent specific heat methods, latent heat is merged with sensible heat to producea specific heat curve with a large peak around the freezing point (Fig. 3.3). Because of thelarge variations in specific heat, iteration must be carried out at every step. It is difficult toobtain convergence with this technique, and there is always a chance that the latent heat isunderestimated. This happens when the temperature at a node steps over the peak in theapparent specific heat curve: the mean specific heat between the initial and final temperatureis then always less than the peak, and the temperature change will therefore be overestimated.Many approximate methods have been proposed to calculate the effective specific heat nearthe freezing point (Comini and Del Giudice, 1976; Morgan et al., 1978; Lemmon, 1979;Cleland et al., 1984; Comini et al., 1989) but none is entirely satisfactory (Pham, 1995).For this reason the apparent specific heat method is not recommended. However, in general-purpose commercial software such as COMSOL it is often the only method available. Toensure convergence in reasonable time, the user should ‘smear out’ the latent heat peak overas wide a temperature range as possible, while ensuring that this will not affect accuracy.For example, when freezing pure water (Tf = 0◦C) in a medium at −40◦C, the temperaturedriving force over most of the process is of the order 40◦C. Therefore, if the latent heat loadis assumed to be released over a range Tf1 = −0.5◦C to Tf2 = +0.5◦C, say, the predictedfreezing time is not expected to be greatly affected. The following apparent specific heat tablecould therefore be used:
T ≤ Tf1 , c = cice
Tf1 < T ≤ Tf2 , c = cice + cwater
2+ L f
Tf2 − Tf1
T > Tf2 , c = cwater
3.4.2.3 Enthalpy method
The basic conduction equation can be written as
ρ∂ H
∂t= ∇ · (k∇T ) + q (3.27)

BLUK139-Evans January 23, 2008 17:26
62 Frozen Food Science and Technology
H(T)
H (Galerkin)
A B
T (Galerkin)
Fig. 3.4 Temperature and enthalpy approximations in a 1D element around the freezing point.
where H is the (specific) enthalpy. After the usual FDM, FEM or FVM manipulations, weobtain the matrix equations
MdHdt
+ KT = f (3.28)
where M is a (constant) mass matrix and H is the vector of nodal enthalpies.In FDM, FVM and lumped capacitance FEM, M is a diagonal matrix and the nodal
enthalpies Hi can be calculated one by one by using the explicit (Euler) steppingscheme:
H Newi = H Old
i + �t
f Oldi − ∑
jKi j T Old
j
Mi(3.29)
This approach was first proposed for FDM by Eyres et al. (1946).To obtain an exact solution to any implicit (α > 0) solution of equation (3.28), iteration
must be carried out at every time step. The enthalpy change vector �H ≡ HNew− H at eachtime step is iteratively adjusted until the residual of equation (3.28) becomes acceptablysmall. A successive substitution scheme such as Gauss–Seidel can be used, but convergenceis very slow and various over-relaxation schemes have been proposed (Voller et al., 1990).A better approach is to use a Newton–Raphson iteration.
The discretisation of highly non-linear problems such as the phase change problem withGalerkin FEM poses serious conceptual difficulties. The Galerkin approach assumes thattemperature is distributed over the element according to the shape function, i.e. T = NTTwhere T is the vector of nodal temperatures. Since H is a non-linear function of T , it cannotbe assumed that H is distributed according to H = NTH as well. In fact, this interpolationwill be very inaccurate around the freezing point (see Fig. 3.4 where the nodal temperaturesin a 1D element are just above and below the freezing point). Yet, in the enthalpy method, thisassumption has to be made when transforming equation (3.27) into a Galerkin FEM equation.In the effective specific heat method, the Galerkin FEM user is faced with how to calculatean effective specific heat over both time (�t) and space (the element’s domain): numericalaveraging methods (which uses some sampling procedure over the element’s domain) failwhen c(T ) has a very sharp peak (Fig. 3.4). For these reasons, the use of FVM or lumpedcapacitance FEM is recommended over Galerkin FEM.
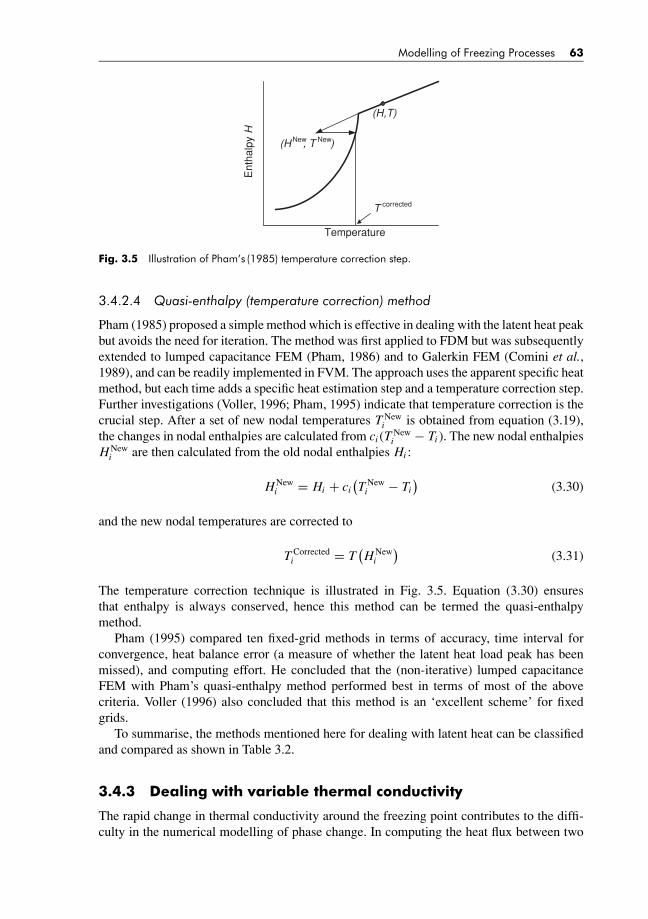
BLUK139-Evans January 23, 2008 17:26
Modelling of Freezing Processes 63
Ent
halp
y H
Temperature
(H , T )New New
T corrected
(H,T)
Fig. 3.5 Illustration of Pham’s (1985) temperature correction step.
3.4.2.4 Quasi-enthalpy (temperature correction) method
Pham (1985) proposed a simple method which is effective in dealing with the latent heat peakbut avoids the need for iteration. The method was first applied to FDM but was subsequentlyextended to lumped capacitance FEM (Pham, 1986) and to Galerkin FEM (Comini et al.,1989), and can be readily implemented in FVM. The approach uses the apparent specific heatmethod, but each time adds a specific heat estimation step and a temperature correction step.Further investigations (Voller, 1996; Pham, 1995) indicate that temperature correction is thecrucial step. After a set of new nodal temperatures T New
i is obtained from equation (3.19),the changes in nodal enthalpies are calculated from ci (T New
i − Ti ). The new nodal enthalpiesH New
i are then calculated from the old nodal enthalpies Hi :
H Newi = Hi + ci
(T New
i − Ti)
(3.30)
and the new nodal temperatures are corrected to
T Correctedi = T
(H New
i
)(3.31)
The temperature correction technique is illustrated in Fig. 3.5. Equation (3.30) ensuresthat enthalpy is always conserved, hence this method can be termed the quasi-enthalpymethod.
Pham (1995) compared ten fixed-grid methods in terms of accuracy, time interval forconvergence, heat balance error (a measure of whether the latent heat load peak has beenmissed), and computing effort. He concluded that the (non-iterative) lumped capacitanceFEM with Pham’s quasi-enthalpy method performed best in terms of most of the abovecriteria. Voller (1996) also concluded that this method is an ‘excellent scheme’ for fixedgrids.
To summarise, the methods mentioned here for dealing with latent heat can be classifiedand compared as shown in Table 3.2.
3.4.3 Dealing with variable thermal conductivity
The rapid change in thermal conductivity around the freezing point contributes to the diffi-culty in the numerical modelling of phase change. In computing the heat flux between two
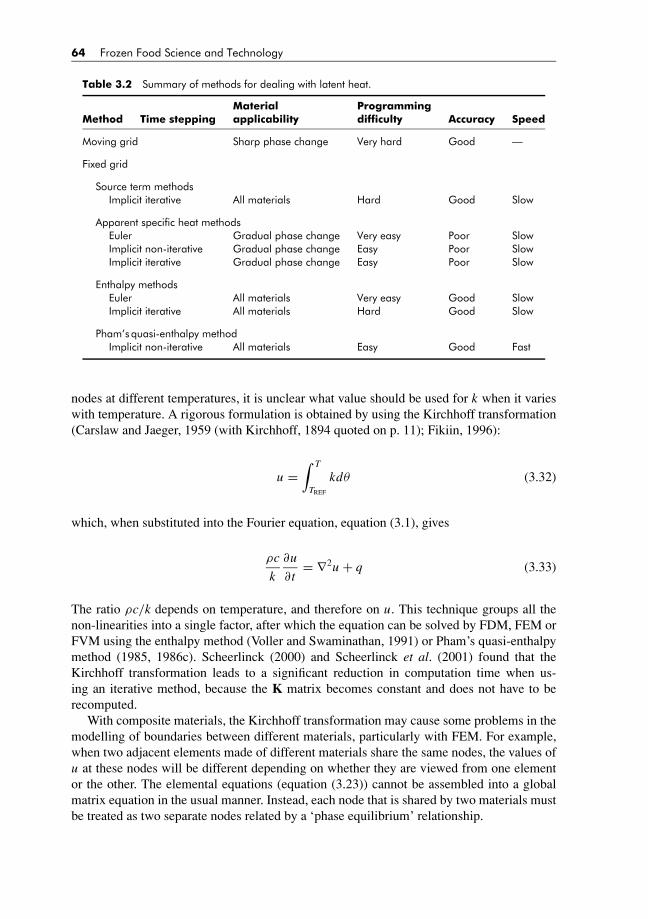
BLUK139-Evans January 23, 2008 17:26
64 Frozen Food Science and Technology
Table 3.2 Summary of methods for dealing with latent heat.
Material ProgrammingMethod Time stepping applicability difficulty Accuracy Speed
Moving grid Sharp phase change Very hard Good —
Fixed grid
Source term methodsImplicit iterative All materials Hard Good Slow
Apparent specific heat methodsEuler Gradual phase change Very easy Poor SlowImplicit non-iterative Gradual phase change Easy Poor SlowImplicit iterative Gradual phase change Easy Poor Slow
Enthalpy methodsEuler All materials Very easy Good SlowImplicit iterative All materials Hard Good Slow
Pham’s quasi-enthalpy methodImplicit non-iterative All materials Easy Good Fast
nodes at different temperatures, it is unclear what value should be used for k when it varieswith temperature. A rigorous formulation is obtained by using the Kirchhoff transformation(Carslaw and Jaeger, 1959 (with Kirchhoff, 1894 quoted on p. 11); Fikiin, 1996):
u =∫ T
TREF
kdθ (3.32)
which, when substituted into the Fourier equation, equation (3.1), gives
ρc
k
∂u
∂t= ∇2u + q (3.33)
The ratio ρc/k depends on temperature, and therefore on u. This technique groups all thenon-linearities into a single factor, after which the equation can be solved by FDM, FEM orFVM using the enthalpy method (Voller and Swaminathan, 1991) or Pham’s quasi-enthalpymethod (1985, 1986c). Scheerlinck (2000) and Scheerlinck et al. (2001) found that theKirchhoff transformation leads to a significant reduction in computation time when us-ing an iterative method, because the K matrix becomes constant and does not have to berecomputed.
With composite materials, the Kirchhoff transformation may cause some problems in themodelling of boundaries between different materials, particularly with FEM. For example,when two adjacent elements made of different materials share the same nodes, the values ofu at these nodes will be different depending on whether they are viewed from one elementor the other. The elemental equations (equation (3.23)) cannot be assembled into a globalmatrix equation in the usual manner. Instead, each node that is shared by two materials mustbe treated as two separate nodes related by a ‘phase equilibrium’ relationship.

BLUK139-Evans January 23, 2008 17:26
Modelling of Freezing Processes 65
3.5 COUPLED HEAT AND MASS TRANSFER
3.5.1 Governing equations
In food freezing, heat transfer is always accompanied by mass transfer, which may haveimportant implications on weight loss and product quality. We will concentrate on the transferof moisture only, which is the most common situation, although solute transfer also happensin immersion freezing.
When mass transfer occurs, conduction is not the only mode of heat transfer. Thermalenergy is also conveyed by the diffusing substance, necessitating the addition of a secondtransport term. This can be expressed with the enthalpy form of the heat transport equation:
∂(ρH )
∂t= ∇ · (k∇T ) + ∇(Hwmw) (3.34)
mw is the mass flux and Hw the enthalpy of the diffusing substance. The mass flux is assumedto follow Fick’s law:
mw = Dw∇W (3.35)
where W is the mass concentration of the diffusing substance (kg water m−3) and Dw its(effective) diffusivity. The governing equation for mass transfer is therefore
∂W
∂t= ∇ · (Dw∇W ) (3.36)
Mechanical effects (gravity, pressure gradient) have been ignored, as well as the mass diffu-sion due to temperature gradient (Soret effect) and heat diffusion due to concentration gradient(Dufour effect). The second term in the heat transport equation can usually be neglected indense foods due to the very slow moisture diffusion rate, but not in porous foods.
In the freezing of non-porous foods such as meat, water evaporates from the surface andis replenished by deep water diffusing towards the surface, until freezing occurs. Thereafterthe water sublimes from the ice front at or near the surface, but there is no significant watermovement in the food. Mass transfer occurs in a rather thin layer near the surface only,in contrast to heat transfer which happens throughout. In the freezing of porous food suchas bread and dough, moisture movement continues right through the freezing process deepinside the food. Each situation requires a different modelling approach.
3.5.2 Freezing of dense foods
Moisture in foods can simultaneously exist in several phases: vapour, free liquid and varioustypes of bound moisture, each of which has its own diffusion rate. However, it is commonlyassumed that moisture movement in foods can be described by a single-phase diffusionequation, equation (3.36), with an effective diffusivity Dw. This equation is of the same formas the heat conduction equation, equation (3.1), and can be solved by the same methods(FDM, FEM or FVM). In dense food, moisture diffusion is very slow and its contribution toheat transport can be neglected, hence the second term in equation (3.34) can be neglected,except at the evaporating surface itself.
BLUK139-Evans January 23, 2008 17:26
66 Frozen Food Science and Technology
The problems to be considered are the changes in boundary conditions and the differencesin scale between heat and mass transfer. Prior to surface freezing, water evaporates fromthe surface at a rate proportional to (Ps − Pa) where Ps is the water partial pressure at thefood surface and Pa that in the surroundings, and is replenished by moisture diffusing fromthe inside. The boundary conditions contain Ps, which is a non-linear function of surfacetemperature and moisture. If explicit time stepping is used, this poses no particular problem,but for any other stepping method, Ps has to be linearised around the present temperatureand moisture value (Davey and Pham, 1997), or an iteration must be carried out at every timestep.
Due to the big difference between moisture and heat diffusivity in dense foods, by thetime the freezing process is completed, only a very thin layer near the surface has under-gone any change in moisture. To model moisture movement accurately, therefore, wouldrequire an extremely fine grid and hence very small time intervals. Pham and Karuri (1999)proposed resolving this difficulty by using a two-grid method, where a second, very fine,one-dimensional finite volume grid just under the surface is used to model the mass transfer.At each time step, the heat flow equation is solved first using the main grid which extendsover the whole product, then the mass transfer equation is solved using the second grid. Theapproach was implemented by Trujillo (2004) in modelling the chilling of a beef side, usingthe FVM-based CFD software FLUENT.
Once the surface has frozen, water becomes immobilised and internal diffusion stops.Moisture then sublimes, at first from the surface, then through a layer of desiccated food thatgradually thickens as the ice front recedes, at a rate determined by (Pham and Willix, 1984;Pham and Mawson, 1997)
m = Psat(Ts) − Pa
1
kg+ RgT
Mw
δ
Dδ
(3.37)
where δ is the desiccated thickness and Dδ the diffusivity of water through it. This equationcorrelates satisfactorily the weight loss data of lamb in frozen storage, the resistance tomass transfer increasing linearly with total weight loss as expected (Pham and Willix, 1984).The model was solved numerically for 1D geometry using a front-tracking finite differencemethod (Campanone et al., 2001). The dehydrated zone is modelled by a flexible grid withdistance increments increasing proportionately to the depth of the freezing zone. Because thedesiccated layer is normally very thin in the freezing of dense foods, modelling it numericallyrequires a very thin grid. In fact, at the moment freezing starts, δ may be zero, which wouldcause difficulty. In the author’s view, when the rate of sublimation is very slow and thedesiccated layer very thin (thinner than, say, half the thickness of a control volume), we canassume pseudo-steady state (i.e. the water vapour profile in the desiccated layer is as if thesublimating front was stationary), and it is sufficiently accurate to use an ODE approach tocalculate its thickness:
dδ
dt= mw
ρsW (δ)(3.38)
where W (δ) is the moisture content at depth δ.
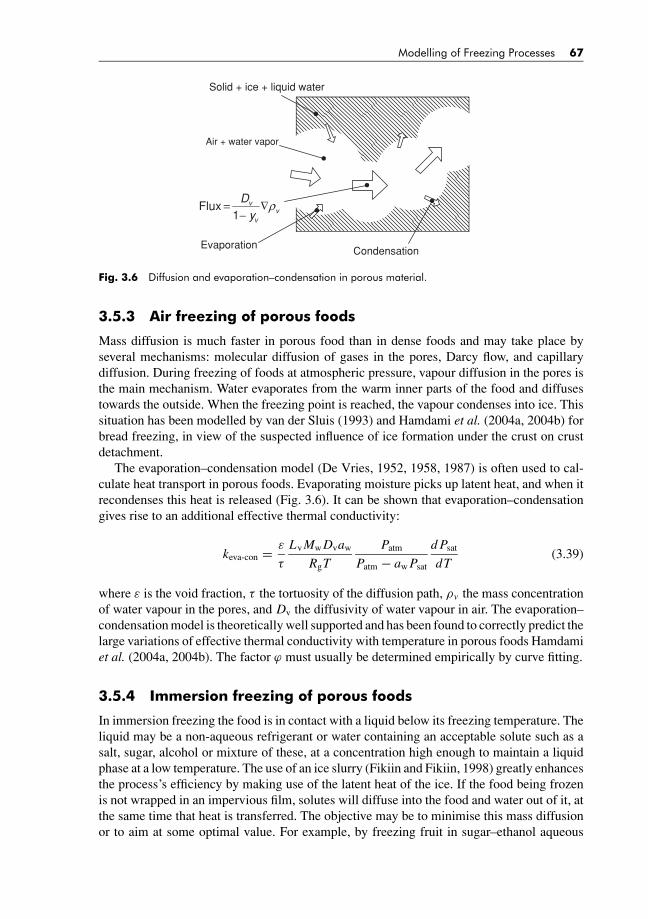
BLUK139-Evans January 23, 2008 17:26
Modelling of Freezing Processes 67
Air + water vapor
Solid + ice + liquid water
vv
v
yD
Flux ρ
Δ
−=
1
Evaporation Condensation
Fig. 3.6 Diffusion and evaporation–condensation in porous material.
3.5.3 Air freezing of porous foods
Mass diffusion is much faster in porous food than in dense foods and may take place byseveral mechanisms: molecular diffusion of gases in the pores, Darcy flow, and capillarydiffusion. During freezing of foods at atmospheric pressure, vapour diffusion in the pores isthe main mechanism. Water evaporates from the warm inner parts of the food and diffusestowards the outside. When the freezing point is reached, the vapour condenses into ice. Thissituation has been modelled by van der Sluis (1993) and Hamdami et al. (2004a, 2004b) forbread freezing, in view of the suspected influence of ice formation under the crust on crustdetachment.
The evaporation–condensation model (De Vries, 1952, 1958, 1987) is often used to cal-culate heat transport in porous foods. Evaporating moisture picks up latent heat, and when itrecondenses this heat is released (Fig. 3.6). It can be shown that evaporation–condensationgives rise to an additional effective thermal conductivity:
keva-con = ε
τ
Lv Mw Dvaw
RgT
Patm
Patm − aw Psat
d Psat
dT(3.39)
where ε is the void fraction, τ the tortuosity of the diffusion path, ρv the mass concentrationof water vapour in the pores, and Dv the diffusivity of water vapour in air. The evaporation–condensation model is theoretically well supported and has been found to correctly predict thelarge variations of effective thermal conductivity with temperature in porous foods Hamdamiet al. (2004a, 2004b). The factor ϕ must usually be determined empirically by curve fitting.
3.5.4 Immersion freezing of porous foods
In immersion freezing the food is in contact with a liquid below its freezing temperature. Theliquid may be a non-aqueous refrigerant or water containing an acceptable solute such as asalt, sugar, alcohol or mixture of these, at a concentration high enough to maintain a liquidphase at a low temperature. The use of an ice slurry (Fikiin and Fikiin, 1998) greatly enhancesthe process’s efficiency by making use of the latent heat of the ice. If the food being frozenis not wrapped in an impervious film, solutes will diffuse into the food and water out of it, atthe same time that heat is transferred. The objective may be to minimise this mass diffusionor to aim at some optimal value. For example, by freezing fruit in sugar–ethanol aqueous

BLUK139-Evans January 23, 2008 17:26
68 Frozen Food Science and Technology
Cold concentratedsolution
Unfrozen, highlyimpregnated layer
Partly frozenlayer
Unfrozen, non-impregnated layer
Thawing front Freezing front
Fig. 3.7 Immersion freezing of porous slab.
solutions or ice slurries, new dessert products can be formulated with beneficial effect oncolour, flavour and texture, due to the enzyme-inhibiting action of the sugar (Fikiin et al.,2003). The objective of modelling in these cases is to predict both the temperature and theconcentration profiles and histories in the food. As solutes penetrate the tissue, the freezingpoint will be depressed to various extents and it is important to take this effect into account.
Lucas et al. (2001) modelled the immersion freezing in a concentrated solution of a one-dimensional slab of inert porous material impregnated with dilute aqueous solution. Theequations to be solved are those for diffusion of solute (equation (3.36)) and heat conduction(equation (3.1)). The porous medium is treated as a homogeneous phase, with average trans-port properties calculated from the fractions of ice, bead solid, water and solute. In particular,diffusion takes place in the liquid channels only and hence the effective mass diffusivitiesmust take into account the void fraction and tortuosity as in equation (3.39) (Lucas et al.,1999). The transport equations are then solved by finite difference. The model is verified bythe brine immersion freezing of a bed of glass beads impregnated with dilute NaCl solution.The model shows that at the start of the process, solute diffusion can prevent freezing at thesurface and enhance the thawing of recently frozen layers. This results in a non-frozen sur-face layer co-existing with an inner frozen layer or frozen core (Fig. 3.7). Continuing solutediffusion in the non-frozen layers causes the adjacent ice crystals to melt. If this process isallowed to continue, the product thaws completely and its solute concentration approximatesthat of the solution. A similar model was developed by Zorrilla and Rubiolo (2005) who usethe enthalpy formulation for the heat transport equation.
3.6 SUPERCOOLING AND NUCLEATION EFFECTS
So far we have assumed that the freezing rate is entirely controlled by heat transfer. However,in many cases, the dynamics of nucleation and mass transfer have observable effects. Somedegree of supercooling is observed in most food freezing processes, where the surface dipsbriefly below freezing point before suddenly coming up to the freezing temperature. Oncenucleation has happened, in most industrial freezing processes, the freezing process reverts

BLUK139-Evans January 23, 2008 17:26
Modelling of Freezing Processes 69
Ent
halp
y H
Temperature (T )
Supercooling
Precooling
Nucleation
Fig. 3.8 Modelling supercooling and nucleation on the H–T diagram.
to being heat transfer controlled. Pham (1989) has modelled this type of behaviour with afinite difference model using the quasi-enthalpy method and validated the model with datafrom Menegalli et al. (1978). Miyawaki et al. (1989) independently used the apparent specificheat technique to solve the same problem. To simulate supercooling, the specific heat abovefreezing is assumed to continue to apply below the initial freezing point, until the coldestnode reaches nucleation temperature. At that point, all the nodes that have an enthalpy valueH below freezing are assumed to freeze instantaneously, releasing enough latent heat forthe node to warm up to the equilibrium temperature T (H ) (Fig. 3.8). Incidentally, Fig. 3.8resembles Fig. 3.5, which illustrates Pham’s temperature correction step.
Pham (1989) found that supercooling normally has negligible effect on freezing time.However, this conclusion may not hold for all types of foods. When water is held as smalldroplets in an emulsion, such as in ice cream or butter, each ice crystal cannot grow beyondits droplet and each droplet has to crystallise separately. In such cases the freezing processmay be very gradual and a freezing plateau may not even be present, as was observedexperimentally (Nahid et al., 2004). This may have important implication on the heat loadand product temperatures in freezers and cold stores. The product may undergo internalwarming due to gradual latent heat release during cold storage, causing higher than normalproduct temperature and heat load. Nahid et al. (2006) use the explicit finite difference methodto model the freezing of butter blocks in air at −11◦C and −23◦C, assuming that nucleationtakes place in individual water droplets according to the model of Avrami (1939, 1940, 1941).At constant temperature, Avrami’s model predicts that
F = 1 − exp(K tn) (3.40)
where F is the frozen fraction of water and K describes the combined effect of the rate ofnucleation and the rate of crystal growth. The former depends on the degree of supercooling(Michelmore and Franks, 1982), while the latter is proportional to the difference betweenthe equilibrium freezing temperature of the liquid phase and the crystal temperature (Mulleret al., 2004). When temperature is not constant, Avrami’s equation can be differentiated togive the rate of freezing:
d F
dt= nK 1/n(1 − F)[−ln(1 − F)]1−1/n (3.41)
BLUK139-Evans January 23, 2008 17:26
70 Frozen Food Science and Technology
Nahid et al. obtained good agreement between calculated and measured product temperatures,both exhibiting a cooling period followed by a temperature peak as freezing occurs, ratherthan the usual temperature plateau.
Nucleation and crystal growth may also affect food quality and drip loss. Maximumdrip loss in meat is believed to happen when a large intracellular crystal forms in eachcell, which causes distortion and damage to the cell wall (Bevilacqua et al., 1979). Thishappens at an intermediate freezing rate, since faster freezing causes the formation of multiplesmall intracellular crystals, while slower freezing leads to extra-cellular freezing. Devireddyet al. (2002) developed a finite volume model to predict the formation of intracellular ice inbiological tissues in the context of cryosurgery. The material is divided into two phases, extra-and intracellular. Extracellular liquid is assumed to freeze without supercooling. As it does so,the extracellular solute concentration increases, causing an osmotic pressure to develop andwater to diffuse across the cell membrane (Mazur, 1963). Due to this diffusion, intracellularsolute concentration increases, but at a rate slower than extracellular concentration. However,the temperature in the cell falls just as fast as that of the extracellular medium. There is thussome degree of supercooling inside the cell. The probability of intracellular nucleation isobtained from the amount of supercooling, using a model by Toner (1993).
Because of the mass transfer process between extra- and intracellular spaces and the su-percooling of the latter, equation (3.1) cannot be solved directly as in heat transfer–controlledfreezing. Instead an iterative procedure has to be carried out at every time step to satisfy theheat balance as well as the intra- and extracellular mass balances:
Guess the rate of ice formation in each control volume;Iterate:
Calculate the new nodal temperatures throughout the domain from the heat conductionequation (3.1) and the amount of ice formed over the time step;Calculate the extracellular ice from the temperatures, assuming thermodynamic equilib-rium in the extracellular space;Calculate the probabilities of intracellular nucleation, i.e. the increase in the number ofcells with internal ice;Calculate the amount of intracellular ice;Calculate the total latent heat released by extra- and intra-cellular ice until convergence isreached.
An approximate analytical equation for predicting crystal size from dendritic growth theorywas presented by Woinet et al. (1998a, 1998b), assuming a Neumann boundary condition,and validated against data from agar gel freezing. Udaykumar et al. (2002) present andvalidate a finite volume technique for computing dendritic growth of crystals from pure melts,assuming diffusion control. An entirely different modelling approach is the use of cellularautomata or hybrid automata (Brown, 1998; Jarvis et al., 2000; Raabe, 2002), where thematerial is modelled as a collection of microscopic elements that change phase stochasticallydepending on the state of the surrounding elements. So far, little work has been done inthe food-freezing field on the modelling of nucleation and crystal growth, although it seemsto be a promising area of investigation. The main difficulty in applying these models isthe difficulty of getting data on relevant parameters such as cell membrane mass transferresistance and nucleation factors. Nucleation can be either homogeneous (occurring in purewater) or heterogeneous (occurring due to contact with other substances). Homogeneousnucleation is very rare in food freezing, while heterogeneous nucleation depends on thecomposition and microstructure of the food and cannot easily be predicted.

BLUK139-Evans January 23, 2008 17:26
Modelling of Freezing Processes 71
3.7 HIGH-PRESSURE FREEZING AND THAWING
High-pressure freezing, and in particular pressure shift freezing, are gaining attention as afreezing method for high-quality or freeze-sensitive foods (Le Bail et al., 2002). In pressureshift freezing, the food is cooled under high pressure to sub-zero temperatures. Because thefreezing point decreases with pressure, phase change does not take place. When the producttemperature has more or less equilibrated, pressure is released suddenly. The food is nowsupercooled by several degrees and nucleation takes place spontaneously throughout thesupercooled product, causing an instantaneous temperature rise. There may be a short periodof equilibration where some water remains supercooled (Otero and Sanz, 2000). The uniformnucleation ensures evenly small crystal size and minimal textural damage. High-pressurethawing has also been investigated as a fast thawing method. Because of the lowering of thefreezing point, the difference between product and ambient temperature is increased, hencea larger heat flux is obtained.
In high-pressure thawing and freezing, the effect of pressure on thermal properties (latentheat, freezing point, thermal conductivity) must be taken into account. Freezing point isdecreased by pressure according to Clapeyron’s equation. Latent heat is also decreased.Thermal conductivity below zero will also be different, since there is no ice.
Chourot et al. (1997) modelled high-pressure thawing of an infinite cylinder of pure water,using FDM with Crank–Nicolson stepping and the apparent specific heat approach. The latentheat is assumed to contribute a triangular peak spanning 1 K at the base. Thermal conductivityis assumed to be constant above and below the phase change range, and vary linearly overthis range. The total latent heat and mean phase change temperature are given as polynomialfunctions of pressure. The entire thawing process takes place under pressure.
Denys et al. (1997) modelled pressure shift freezing using FDM with explicit steppingand apparent specific heat formulation. At the moment of pressure release, the temperaturerise from Ti to Tnew is calculated by an enthalpy balance. The product is assumed to be atuniform temperature when pressure is released; however, in a subsequent paper (Denyset al., 2000) this restriction is relaxed, and the energy balance is carried out node bynode.
In the light of what has been discussed earlier on the handling of latent heat and theshortcomings of the apparent specific heat approach, it can be seen that a simpler, moreefficient and flexible program, which can handle any temperature and pressure regime,can be written by using the enthalpy or quasi-enthalpy formulations, i.e. at every timestep:
– calculate nodal enthalpies from the enthalpy or quasi-enthalpy method– calculate nodal temperatures from nodal enthalpies and pressure.
Figure 3.9 shows a pressure shift process on the enthalpy–temperature diagram. The food iscooled at high pressure from A to B, pressure is released along BC causing partial freezing,then freezing is completed along CD. From the programming point of view this presentsno extra complication over a ‘standard’ freezing program, apart from the need to solve forT from H and P instead of from H alone. If only a finite number of pressure levels areused (usually two), the property subroutine needs only contain the H–T relationship atthese pressures. Also, if it is not intended that nucleation happens during the high-pressurestage, there is no need to know the frozen section (dotted curve) of the H–T curve for highpressure.

BLUK139-Evans January 23, 2008 17:26
72 Frozen Food Science and Technology
Ent
halp
y H
Temperature T
P1
P2
A
B C
D
Fig. 3.9 Pressure shift freezing on the enthalpy–temperature diagram.
3.8 THERMOMECHANICAL EFFECTS DURING FREEZING
Water expands by about 9% by volume when turning into ice, causing considerable stressesin foods during freezing. In cryogenic freezing, this expansion is followed by a significantthermal contraction, of the order of 0.5% in linear terms or 1.5% in volumetric terms (Rabinet al., 1998). Frozen food is brittle and these stresses may cause cracking in the food, es-pecially at high cooling rates such as in cryogenic freezing. Rubinsky et al. (1980) carriedout an approximate analytical analysis of thermal stresses during the freezing of organs butneglected phase-related volume change. Rabin and Steif (1998) calculated thermal stressesin freezing a sphere, taking both phase change expansion and thermal contraction into ac-count, but neglecting the property changes due to freezing. Shi et al. (1998, 1999) carried outthermal strain and stress calculations using the commercial software ABAQUS (ABAQUS,Inc., Rhode Island, USA). They used both an elastic model and a viscoelastic model, butneglected thermal contraction. Pham et al. gave numerical solutions (Pham et al., 2005)and analytical solutions (Pham et al., 2006) of strains and stresses in a freezing elasticsphere.
At moderate values of strains and stresses, thermophysical properties can be assumed tobe unaffected, therefore the analysis can be carried out in two stages: the thermal historyis calculated first, using any of the methods listed earlier, followed by stress and straincalculation. The stress analysis assumes that total strain is the sum of thermal strain (due totemperature change) and mechanical strain (due to mechanical stresses):
εi j = ε(m)i j + ε
(T)i j (3.42)
where the thermal strain can be calculated as a function temperature and includes both thephase change expansion and thermal contraction of ice.
In general it can be said that strain and stress calculations are a specialised field best leftto experts and specialised software. However, in the case of spherical foods, the problem isgreatly simplified by the disappearance of most of the terms in the stress and strain equationsexcept two: the radial stress and the tangential stress. This leaves two ODEs that can easilybe solved. However, there is uncertainty as to whether a solid food behaves as a free-flowingliquid (Rabin and Steif, 1998) or as a rigid solid (Pham et al., 2005, 2006) just before it changesphase. The two assumptions lead to quite different predictions in the resulting strains and
BLUK139-Evans January 23, 2008 17:26
Modelling of Freezing Processes 73
stresses. In the former case, the unfrozen food is squeezed out of the advancing ice front,increasing core pressure; in the latter case, the food freezes as a solid and simply tries toexpand, causing internal tension in the core.
3.9 FREEZING OF LIQUID FOODS
The freezing of liquid foods such as ice cream freezing or the freeze concentration of fruitjuices is a complex problem that has received little attention to date. Due to the need tosimultaneously solve the flow equations and the energy transport equation (and perhaps thespecies transport equation as well), it must be modelled numerically, using computationalfluid dynamics (CFD) software. The energy equation, equation (3.1), now incorporates aconvection term ρc�v · ∇T and becomes:
ρc∂T
∂t+ ρc�v · ∇T = ∇ · (k∇T ) + q (3.43)
or in terms of enthalpy (equation 3.27)
ρ∂ H
∂t+ ρ�v · ∇ H = ∇ · (k∇T ) + q (3.44)
while additional transport equations must be solved for continuity and momentum transport(one for each direction of space), and, if the flow is turbulent, for the variables character-ising the turbulence field (such as turbulence intensity k and turbulence dissipation ε inthe k-ε model). The energy equation can be solved using any of the methods describedearlier.
The main problem with the momentum equation is how to deal with the solidification ofthe fluid, which causes velocity to vanish. The momentum equation can be written as
ρ∂ �v∂t
+ ρ�v · ∇�v = μeff∇2�v − ∇ p + �S (3.45)
where μeff is the effective viscosity (including turbulent viscosity) and �S is the momentumsource term (usually the gravitational force). Bennon and Incropera (1987) review the variousmethods of handling solidification. In one class of methods, the solid and liquid phases aretreated as different domains with a clear boundary between them (similarly to the movinggrid method for solving the freezing of solid foods). The method is complicated and cannotbe applied to materials which do not exhibit a sharp phase change temperature.
A second approach involves changing the viscosity. The viscosity of the fluid is specified asa function of temperature and increases more or less gradually by several order of magnitudesas the temperature falls below the freezing point. A reasonable freezing temperature rangemust be defined to avoid too sharp a change, which would cause convergence problem. Themethod is easy to implement (commercial numerical software normally allow viscosity to beentered as a function of temperature) and intuitively attractive, since it reflects the behaviour ofmost real materials. However, if a realistic viscosity–temperature curve is used, convergencewill be very slow or impossible due to the very large and steep change in viscosity over asmall temperature range. Therefore a much smaller value of solid viscosity may have to be
BLUK139-Evans January 23, 2008 17:26
74 Frozen Food Science and Technology
used, and the solution will only be approximate, with a small but finite residual velocity inthe frozen region.
A third method termed the source method, or porosity method, is employed in commercialCFD software packages such as CFX and Fluent, which are extensively used to model thecasting of metals and polymers. From the temperature field, the frozen fraction at each point iscalculated. The frozen fraction is visualised as a porous solid phase, which causes a resistanceto the flow of the liquid fraction. This resistance is entered into the momentum equation as anegative source term, which is proportional to velocity and increases with the frozen fractionF according to the Kozeny–Carman relationship:
�S = −AF2
(1 − F)3�v (3.46)
A is a proportionality constant which is related to the viscosity and drag coefficient. Alarge value of A causes a sharper transition from liquid to solid behaviour, but may causeconvergence problems. A small number is usually added to the denominator of equation(3.46) to prevent the source term from going to infinity.
3.10 CONCLUSIONS
The numerical modelling of the classical ‘pure thermal’ freezing problem can be consideredsolved in principle. An enthalpy or quasi-enthalpy (temperature correction) method is rec-ommended, in conjunction with FVM or lumped capacitance FEM. Explicit time stepping isrecommended for small or one-off problems, Pham’s quasi-enthalpy method for those whowant speed as well as uncomplicated programming. However, it may be difficult for the userof commercial software to apply the enthalpy or quasi-enthalpy methods, in which case aniterative apparent specific heat technique has to be used. Iterative techniques are also a vi-able alternative in the solution of coupled equations (freezing with mass transfer, freezing ofliquids) since iteration is required in any case.
Freezing is almost always coupled with other physical processes, such as mass transfer,nucleation, crystal growth, mass transfer across cell membrane, vitrification, thermal expan-sion, mechanical strain and stress and cracking. Even in normal freezing, internal pressuremay have some effect on the freezing point that has up till now been neglected. The foodengineer is interested not only in freezing times or heat loads, but also in food quality factors:drip, colour, texture, flavour, distortion and cracks and microbial growth. To predict these,detailed modelling is needed on physical processes other than heat transfer.
To model non-thermal phenomena successfully, data on some food properties hithertoneglected by food technologists (moisture diffusivity, absorption isotherm, nucleation pa-rameters, cell size, cell membrane permeability, viscoelastic properties, tortuosity factor inporous foods, etc.) will have to be collected. For the modelling of high-pressure freezing andthawing, there is a need for more data and prediction methods for thermal properties as afunction of pressure. More and better data on heat transfer coefficients and thermal propertiesand better methods for their prediction will also be an ongoing area of research. The use ofcomputational fluid dynamics (CFD) for calculating heat transfer coefficients in food refrig-eration is increasingly becoming popular, but the lack of a satisfactory turbulence model formany practical situations (circulating flows, natural or mixed convection) means that CFD
BLUK139-Evans January 23, 2008 17:26
Modelling of Freezing Processes 75
results cannot yet be completely trusted. More sophisticated turbulence models are on theway, but will not become practically useful until much faster computers are available.
NOMENCLATURE
aw water activityc specific heat (J kg−1 K−1)B ∇TNBi Biot number (hR/k)C capacitance matrixd1 limiting crystal size (m)dm average crystal size (m)ds average size of non-ice inclusions (m)Dv diffusivity of water vapour in air (m2 s−1)Dw diffusivity of water (m2 s−1)Dδ effective diffusivity of water vapour in desiccated layer (m2 s−1)E Shape factor for freezingf forcing vectorh heat transfer coefficient (W m−2 K−1)H specific enthalpy (J kg−3)H vector of nodal enthalpies (J kg−3)i, j node numberk thermal conductivity (W m−1 K−1)k1, k2 rate constants (s−1)keva-con thermal conductivity due to evaporation–condensation (W m−1 K−1)kg mass transfer coefficient (kg m−2 s−1 Pa−1)L f Latent heat of freezing (J kg−1)K conductance matrixLv latent heat of vapourisation (J kg−1)m mass flux (kg m−2 s−1)M mass matrix (kg)Mw molecular mass of water (kg kmol−1)n vector normal to the freezing front and pointing into the frozen region (m)N vector of shape functionsP partial pressure of water (Pa)q heat generation (J m−3)r position vector (m)R half dimension of object (m)Rg universal gas constant (8314.4 J kmol−1 K−1)t time (s)�t time step (s)T temperature (K)Ta environment temperature (K)Tf initial freezing temperature (K)T nodal temperature vector (K)
u Kirchhoff transform variable, μ =T∫
TREF
kd Q (W m−1)

BLUK139-Evans January 23, 2008 17:26
76 Frozen Food Science and Technology
�v fluid velocity vector (m s−1)vf velocity of freezing front (m s−1)δV control volume (m3)W total water concentration (kg m−3)x position vector (m)α weighting coefficient for time steppingδ thickness of desiccated layer (m)εij strainϕ factor for diffusion in porous mediaρ density (kg m−3)ρs bulk density of dry solid (kg m−3) element or control volume domain
Subscriptsa value in bulk aireff effectivei, j node numbersat saturation value for pure waterw water
Superscripts(e) belonging to one element(m) mechanicalNew value at the end of time step(T) thermal.
REFERENCES
Avrami, M. (1939). Kinetics of phase change I. Journal of Chemical Physics 7, 1103–1112.Avrami, M. (1940). Kinetics of phase change II. Journal of Chemical Physics 8, 212–224.Avrami, M. (1941). Kinetics of phase change III. Journal of Chemical Physics 9, 177–184.Banaszek, J. (1989). Comparison of control volume and Galerkin finite element methods for diffusion-type
problems. Numerical Heat Transfer 16, 59–78.Bennon, W.D. and Incropera, F.P. (1987). A continuum model for momentum, heat and species transport in
binary solid-liquid phase change systems – I. Model formulation. International Journal of Heat and MassTransfer 30, 2161–2170.
Bevilacqua, A., Zaritsky, N.E. and Calvelo, A. (1979). Histological measurements of ice in frozen beef.Journal of Food Technology 1, 237–251.
Brown, S.G.R. (1998). Simulation of diffusional composite growth using the cellular automaton finite differ-ence (CAFD) method. Journal of Materials Science 33, 4769–4773.
Budhia, H. and Kreith, F. (1973). Heat transfer with melting or freezing in a wedge. International Journal ofHeat and Mass Transfer 16, 195–211.
Califano, A.N. and Zaritzky, N.E. (1997). Simulation of freezing or thawing heat conduction in irregular twodimensional domains by a boundary fitted grid method. Lebensmittel-Wissenschaft und- Technologie 30,70–76.
Campanone, L.A., Salvadori, V.O. and Mascheroni, R.H. (2001). Weight loss during freezing and storage ofunpackaged foods. Journal of Food Engineering 47, 69–79.
Carslaw, H.S. and Jaeger, J.C. (1959). Conduction of Heat in Solids, 2nd edn. Oxford: Clarendon Press.Chourot, J.M., Boillereaux, L., Havet, M. and Le Bail, A. (1997). Numerical modeling of high pressure
thawing: application to water thawing. Journal of Food Engineering 34, 63–75.

BLUK139-Evans January 23, 2008 17:26
Modelling of Freezing Processes 77
Cleland, A.C. (1990). Food Refrigeration Processes Analysis, Design and Simulation. London: Elsevier.Cleland, D.J., Cleland, A.C. and Earle, R.L. (1987a). Prediction of freezing & thawing times for multidi-
mensional shapes by simple formulae. Part 1: Regular shapes. International Journal of Refrigeration 10,157–164.
Cleland, D.J., Cleland, A.C. and Earle, R.L. (1987b). Prediction of freezing & thawing times for multidi-mensional shapes by simple formulae. Part 2: Irregular shapes. International Journal of Refrigeration 10,234–240.
Cleland, D.J., Cleland, A.C., Earle, R.W. and Byrne, S.J. (1984). Prediction of rates of freezing, thawing andcooling in solids of arbitrary shape using the finite element method. International Journal of Refrigeration7, 6–13.
Cleland, A.C. and Earle, R.L. (1977). A comparison of analytical and numerical methods for predicting thefreezing times of foods. Journal of Food Science 42, 1390–1395.
Cleland, A.C. and Earle, R.L. (1979a). A comparison of methods for predicting the freezing times of cylindricaland spherical foodstuffs. Journal of Food Science 44, 958–963.
Cleland, A.C. and Earle, R.L. (1979b). Prediction of freezing times for foods in rectangular packages. Journalof Food Science 44, 964–970.
Cleland, A.C. and Earle, R.L. (1982). A simplified method for prediction of heating and cooling rate in solidsof various shapes. International Journal of Refrigeration 5, 98–106.
Cleland, A.C. and Earle, R.L. (1984). Assessment of freezing time prediction methods. Journal of FoodScience 49, 1034–1042.
Comini, G. and Del Giudice, S. (1976). Thermal aspects of cryosurgery. Journal of Heat Transfer 98, 543–549.
Comini, G., Del Giudice, S. and Saro, O. (1989). Conservative equivalent heat capacity methods for non-linearheat conduction. In: R.W. Lewis and K. Morgan, eds. Numerical Methods in Thermal Problems, Vol. 6,Part 1. Swansea: Pineridge Press, pp. 5–15.
Crank, J. and Nicolson, P. (1947). A practical method for numerical integration of solutions of partial differ-ential equations of heat conduction type. Proceedings of Cambridge Philosophical Society 43, 50–67.
Davey, L.M. and Pham, Q.T. (1997). Predicting the dynamic product heat load and weight loss duringbeef chilling using a multi-region finite difference approach. International Journal of Refrigeration 20,470–482.
de Michelis, A. and Calvelo, A. (1982). Mathematical models for non-symmetric freezing of beef. Journalof Food Science 47, 1211–1217.
De Vries, D.A. (1952). The thermal conductivity of granular materials. Annex 1952-1 Bulletin of the Inter-national Institute of Refrigeration pp. 115–131.
De Vries, D.A. (1958). Simultaneous transfer of heat and moisture in porous media. Transactions of theAmerican Geophysical Union 39, 909–916.
De Vries, D.A. (1987). The theory of heat and moisture transfer in porous media revisited. InternationalJournal of Heat and Mass Transfer 30, 1343–1350.
Denys, S., Van Loey, A.M. and Hendrickx, M.E. (1997). Modeling heat transfer during high-pressure freezingand thawing. Biotechnology Progress 13, 416–423.
Denys, S., Van Loey, A.M. and Hendrickx, M.E. (2000). Modeling conductive heat transfer during high-pressure thawing processes: determination of latent heat as a function of pressure. Biotechnology Progress16, 447–455.
Devireddy, R.V., Smith, D.J. and Bischof, J.C. (2002). Effect of microscale mass transport and phase changeon numerical prediction of freezing in biological tissues. Journal of Heat Transfer 124, 365–374.
Eyres, N.R., Hartree, D.R., Ingham, J., Jackson, R., Sarjant, R.J. and Wagstaff, J.B. (1946). The calculationof variable heat flow in solids. Transactions of the Royal Society A240, 1.
Fikiin, K.A. (1996). Generalised numerical modelling of unsteady heat transfer during cooling and freezingusing an improved enthalpy method and quasi-one-dimensional formulation. International Journal ofRefrigeration 19, 132–140.
Fikiin, K.A. and Fikiin, A.G. (1998). Individual quick freezing of foods by hydrofluidisation and pumpableice slurries. In: Advances in the Refrigeration Systems, Food Technologies and Cold Chain, Proceed-ings of IIR Conference, Sofia (Bulgaria), Refrigeration Science and Technology, International Institute ofRefrigeration, pp. 319–326. Published also in AIRAH Journal (2001), 55(11), 15–18.
Fikiin, K., Tsvetkov, O., Laptev, Yu., Fikiin, A. and Kolodyaznaya, V. (2003). Thermophysical and engineeringissues of the immersion freezing of fruits in ice slurries based on sugar-ethanol aqueous solution. EcolibriumAugust, 10–14.

BLUK139-Evans January 23, 2008 17:26
78 Frozen Food Science and Technology
Hamdami, N., Monteau, J.Y. and Le Bail, A. (2004a). Heat and mass transfer simulation during freezingin bread. In: Proceedings ICEF9 9th International Congress on Engineering and Foods, Montpellier(CDROM).
Hamdami, N., Monteau, J.Y. and Le Bail, A. (2004b). Simulation of coupled heat and mass transfer duringfreezing of a porous humid matrix. International Journal of Refrigeration 27, 595–603.
Hossain, Md.M., Cleland, D.J. and Cleland, A.C. (1992a). Prediction of freezing & thawing times for foodsof regular multidimensional shape by using an analytically derived geometric factor. International Journalof Refrigeration 15, 227–234.
Hossain, Md.M., Cleland, D.J. and Cleland, A.C. (1992b). Prediction of freezing and thawing times for foodsof two-dimensional irregular shape by using a semi-analytical geometric factor. International Journal ofRefrigeration 15, 235–240.
Hossain, Md.M., Cleland, D.J. and Cleland, A.C. (1992c). Prediction of freezing and thawing times for foodsof three-dimensional irregular shape by using a semi-analytical geometric factor. International Journal ofRefrigeration 15, 241–246.
Illicali, C. and Holacar, M. (1990). A simplified approach for predicting the freezing times of foodstuffs ofanomalous shape. In: W.E.L. Spiess and H. Schubert, eds. Engineering and Food, Vol. 2. London: Elsevier,pp. 418–425.
Jarvis, D.J., Brown, S.G.R. and Spittle, J.A. (2000). Modelling of non-equilibrium solidification in ternaryalloys: comparison of 1D, 2D and 3D cellular automaton-finite difference simulation. Materials Scienceand Technology 16, 1420–1424.
Carslaw, H.S. and Jaeger, J.C., eds. (1959). Conduction of Heat in Solids, 2nd edn. Oxford: Clarendon Press,p. 11 (Kirchhoff, G. (1894). Vorlesungen uber die Theorie der Warme).
Le Bail, A., Chevalier, D., Mussa, D.M. and Ghoul, M. (2002). High pressure freezing and thawing of foods:a review. International Journal of Refrigeration. 25, 504–513.
Lees, M. (1976). A linear three-level difference scheme for quasilinear parabolic equations. Mathematics ofComputation 20, 516–522.
Lemmon, E.C. (1979). Phase change technique for finite element conduction code. In: R.W. Lewis andK. Morgan, eds. Numerical Methods in Thermal Problems. Swansea: Pineridge Press, pp. 149–158.
Lovatt, S.J., Pham, Q.T., Loeffen, M.P.F. and Cleland, A.C. (1993a). A new method of predicting the time-variability of product heat load during food cooling, Part 1: Theoretical considerations. Journal or FoodEngineering 18, 13–36.
Lovatt, S.J., Pham, Q.T., Loeffen, M.P.F. and Cleland, A.C. (1993b). A new method of predicting the time-variability of product heat load during food cooling, Part 2: Experimental testing. Journal or Food Engi-neering 18, 37–62.
Lucas, T., Flick, D. and Raoult-Wack, A.L. (1999). Mass and thermal behaviour of the food surface duringimmersion freezing. Journal of Food Engineering 41, 23–32.
Lucas, T., Chourot, J.M., Bohuon, Ph. and Flick, D. (2001). Freezing of a porous medium in contact witha concentrated aqueous freezant: numerical modelling of coupled heat and mass transport. InternationalJournal of Heat and Mass Transfer 44, 2093–2106.
Mazur, P. (1963). Kinetics of water loss from cells at subzero temperature and the likelihood of intracellularfreezing. Journal of General Physiology 47, 347–69.
McNabb, A., Wake, G.C., Hossain, Md.M. and Lambourne, R.D. (1990a). Transition times between steadystates for heat conduction, Part I: General theory and some exact results. Occasional Pubs in Maths &Statistics No. 20, Massey University.
McNabb, A., Wake, G.C., Hossain, Md.M. and Lambourne, R.D. (1990b). Transition times between steadystates for heat conduction, Part II: Approximate solutions and examples. Occasional Pubs in Maths &Statistics No. 21, Massey University.
Menegalli, F.C. and Calvelo, A. (1978). Dendritic growth of ice crystals during freezing of beef. Meat Science3, 179–199.
Michelmore, R.W. and Franks, F. (1982). Nucleation rates of ice in undercooled water and aqueous solutionsof polyethylene glycol. Cryobiology 19, 163–171.
Miyawaki, O., Abe, T. and Yano, T. (1989). A numerical model to describe freezing of foods when supercoolingoccurs. Journal of Food Engineering 9, 143–151.
Morgan, K., Lewis, R.W. and Zienkiewicz, O.C. (1978). An improved algorithm for heat conduction problemswith phase change. International Journal of Numerical Methods in Engineering 12, 1191–1195.
Muller, G., Metois, J. and Rudolph, P. (2004). Crystal Growth from Fundamentals to Technology. Amsterdam:Elsevier.
BLUK139-Evans January 23, 2008 17:26
Modelling of Freezing Processes 79
Nahid, A., Bronlund, J.E., Cleland, D.J., Oldfield, D.J., Philpott, B. (2004). Prediction of thawing and freezingof bulk palletised butter. In: Proceedings of the 9th International Congress on Engineering and Foods (ICEF9). Montpellier CDROM; paper print 668 p.
Nahid, A., Bronlund, J.E., Cleland, D.J. and Philpott, B.A. (2006). Modelling the freezing of single cartonsof butter. In: Proceedings 11th Asian Pacific Confederation of Chemical Engineering (APCChe) Congress.Kuala Lumpur, Malaysia, 27–30/8/2006.
Otero, L. and Sanz, P. (2000). High pressure shift freezing, Part 1: Amount of ice instantaneously formed inthe process. Biotechnology Progress 16, 1030–1036.
Peaceman, D.W. and Rachford, H.H. (1955). The numerical solution of parabolic and elliptic differentialequations. Journal of the Society for Industrial and Applied Mathematics 3, 28–41.
Pham, Q.T. (1984). An extension to Plank’s equation for predicting freezing times of foodstuffs of simpleshapes. International Journal of Refrigeration 7, 377–383.
Pham, Q.T. (1985). A fast, unconditionally stable finite-difference method for heat conduction with phasechange. International Journal of Heat and Mass Transfer 28, 2079–2084.
Pham, Q.T. (1986a). Simplified equation for predicting the freezing time of foodstuffs. Journal of FoodTechnology 21, 209–221.
Pham, Q.T. (1986b). Freezing of foodstuffs with variations in environmental conditions. International Journalof Refrigeration 9, 290–295.
Pham, Q.T. (1986c). The use of lumped capacitances in the finite-element solution of heat conduction withphase change. International Journal of Heat and Mass Transfer 29, 285–292.
Pham, Q.T. (1987a). A converging-front model for the asymmetric freezing of slab-shaped foodstuffs. Journalof Food Science 52, 795–800.
Pham, Q.T. (1987b). A comparison of some finite-difference methods for phase-change problems. Proceedings17th International Congress of Refrigeration. Vienna. Vol. B, pp. 267–271.
Pham, Q.T. (1989). Effect of supercooling on freezing times due to dendritic growth of ice crystals. Interna-tional Journal of Refrigeration 12, 295–300.
Pham, Q.T. (1995). Comparison of general purpose finite element methods for the Stefan problem. NumericalHeat Transfer Part B – Fundamentals 27, 417–435.
Pham, Q.T. (2001). Prediction of cooling/freezing/thawing time and heat load. In: D.-W. Sun, ed. Advancesin Food Refrigeration. Leatherhead: Leatherhead Food RA, pp. 110–152.
Pham, Q.T., Le Bail, A., Hayert, M. and Tremeac, B. (2005). Stresses and cracking in freezing sphericalfoods: a numerical model. Journal of Food Engineering 71, 408–418.
Pham, Q.T., Le Bail, A. and Tremeac, B. (2006). Analysis of stresses during the freezing of spherical foods.International Journal of Refrigeration 29, 125–133.
Pham, Q.T. and Karuri, N. (1999). A computationally efficient technique for calculating simultaneous heat andmass transfer during food chilling. 20th International Congress of Refrigeration. Sydney, 19–24 September,1999.
Pham, Q.T. and Mawson, R. (1997). Moisture migration and ice recrystallization in frozen foods. In: M.C.Erickson and Y.C. Hung, eds. Quality in Frozen Foods. New York: Chapman and Hall, pp. 67–91.
Pham, Q.T. and Willix, J. (1984). A model for food desiccation in frozen storage. Journal of Food Science49, 1275–1281, 1294.
Pham, Q.T. and Willix, J. (1990). Effect of Biot number and freezing rate on the accuracy of some foodfreezing time prediction methods. Journal of Food Science 55, 1429–1434.
Plank, R. (1913a). Beitrage zur Berechnung und Bewertung der Gefriergeschwindigkeit von Lebensmitteln.Zeitschrift fur die gesamte Kalte Industrie, Reihe 3 Heft 10, 1–16.
Plank, R. (1913b). Die Gefrierdauer von Eisblocken. Zeitschrift fur die gesamte Kalte Industrie 20(6), 109–114.
Raabe, D. (2002). Cellular automata in materials science with particular reference to recrystallization simu-lation. Annual Review of Materials Research 32, 53–76.
Rabin, Y. and Steif, P.S. (1998). Thermal stresses in a freezing sphere and its application in cryobiology.Transactions of the ASME 65, 328–333.
Rabin, Y., Taylor, M.J. and Wolmark, N. (1998). Thermal expansion measurement of frozen biological tissuesat cryogenic temperatures. ASME Journal of Biomechanical Engineering 120, 259–266.
Riley, D.S., Smith, F.T. and Poots, G. (1974). The inward solidification of spheres and circular cylinders.International Journal of Heat and Mass Transfer 17, 1507–1516.
Rubinsky, B., Cravalho, E.G. and Mikic, B. (1980). Thermal stresses in frozen organs. Cryobiology 17,66–73.
BLUK139-Evans January 23, 2008 17:26
80 Frozen Food Science and Technology
Scheerlinck, N. (2000). Uncertainty Propagation Analysis of Coupled and Non-Linear Heat and Mass Trans-fer Models. PhD thesis, Katholieke Universteit Leuven, pp. 180–181.
Scheerlinck, N., Verboven, P., Fikiin, K.A., de Baerdemaeker, J. and Nicolai, B.M. (2001). Finite-elementcomputation of unsteady phase change heat transfer during freezing or thawing of food using a combinedenthalpy and Kirchhoff transform method. Transactions of the American Society of Agricultural Engineers44, 429–438.
Segerlind, L. (1984). Applied Finite Element Analysis, 2nd edn. New York: John Wiley.Shi, X., Datta, A.K. and Mukherjee, Y. (1998). Thermal stresses from large volumetric expansion during
freezing of biomaterials. Transactions of the ASME 120, 720–726.Shi, X., Datta, A.K. and Mukherjee, Y. (1999). Thermal fracture in a biomaterial during rapid freezing.
Journal of Thermal Stresses 22, 275–292.Thompson, J.F., Warsi, Z.U.A. and Mastin, C.W. (1982). Boundary-fitted coordinate systems for numerical
solution of partial differential equations—A review. Journal of Computational Physics 47, 1–108.Toner, M. (1993). Nucleation of ice crystals inside biological cells. In: P. Steponkus, ed. Advances in Low
Temperature Biology. London: JAI Press, pp. 1–52.Trujillo, F.J. (2004). A Computational Fluid Dynamic Model of Heat and Moisture Transfer during Beef
Chilling. PhD thesis, School of Chemical Engineering and Industrial Chemistry, University of New SouthWales, Sydney, Australia.
Udaykumar, H.S., Mao, L. and Mittal, R. (2002). A finite-volume sharp interface scheme for dendritic growthsimulations: comparison with microscopic solvability theory. Numerical Heat Transfer, Part B 42, 389–409.
Van der Sluis, S.M. (1993). Cooling and freezing simulation of bakery products. Proceedings of InternationalInstitute of Refrigeration Meeting Commissions B1, B2, D1, D2/3. Palmerston North, New Zealand, 1993.
Voller, V.R. (1996). An overview of numerical methods for solving phase change problems. In: W.J.Minkowycz and E.M. Sparrow, eds. Advances in Numerical Heat Transfer, Vol. 1. London: Taylor &Francis, pp. 341–375.
Voller, V.R. and Prakash, C. (1987). A fixed-grid numerical modeling methodology for convection-diffusionmushy region phase-change problems. International Journal of Heat and Mass Transfer 30, 1709–1720.
Voller, V.R. and Swaminathan, C.R. (1991). Generalized source-based method for solidification phase change.Numerical Heat Transfer Part B 19, 175–189.
Voller, V.R., Swaminathan, C.R. and Thomas, B.G. (1990). Fixed grid techniques for phase change problems:a review. International Journal of Numerical Methods in Engineering 30, 875–898.
Woinet, B., Andrieu, J. and Laurent, M. (1998a). Experimental and theoretical study of model food freezing,Part 1: Heat transfer modelling. Journal of Food Engineering 35, 381–393.
Woinet, B., Andrieu, J., Laurent, M. and Min, S.G. (1998b). Experimental and theoretical study of modelfood freezing, Part 2: Characterization and modelling of ice crystal size. Journal of Food Engineering 35,394–407.
Zienkiewicz, O.C. and Taylor, R.L. (1991). The Finite Element Method. London: McGraw-Hill.Zorrilla, S.E. and Rubiolo, A.C. (2005). Mathematical modeling for immersion chilling and freezing of foods.
Part I: Model development. Journal of Food Engineering 66, 329–338.
BLUK139-Evans March 5, 2008 16:20
4 Specifying and Selecting Refrigerationand Freezer Plant
Andy Pearson
4.1 INTRODUCTION
The refrigeration system may be one of the largest users of electricity in a food factory, andcertainly will be in a storage and distribution facility where it can account for up to 70%of the site electrical consumption, so it is important to specify requirements accurately andunambiguously in order to ensure efficient operation of the installed plant. Where food isbeing frozen, whether from raw or after cooking, the way in which it is frozen, includingtemperatures and freezing rate can have a significant effect on product appearance, quality andshelf life. Slow freezing, perhaps as a result of equipment not meeting the design requirements,can be particularly damaging as it causes the growth of large ice crystals within the productand may damage the cell structure. In some cases the freezing process can significantly reduceweight loss, increasing the value of product sold by weight and in special processes, such asice cream making, the method of freezing is an integral part of the production process. Forall these reasons it follows that great care should be taken when buying a refrigerating plant,not just to avoid expensive mistakes but also to maximise the margin made on the product.
The words ‘freezer’, ‘chiller’, ‘cold store’ and ‘chill store’ tend to be used loosely inthe food production market. For this text a stricter convention, common among refrigerationengineers, will be followed. A ‘freezer’ is not just a store for cold produce, as the term is useddomestically. It denotes a piece of equipment specifically designed to turn fresh productsinto frozen ones by leading it through a clearly defined freezing process. A ‘chiller’ is asimilar machine, but used to cool product down without taking it through freezing. Note that‘chiller’ is also used to denote a unit for cooling liquid, usually water, brine or glycol, butusually the context is sufficiently clear to indicate which type of chiller is being discussed.A ‘cold store’ is a store-room or warehouse operated below 0◦C for holding frozen productsand a ‘chill room’ is similar for chilled products. Cold stores usually run at a temperaturesomewhere between −10◦C and −30◦C depending on the product: typically at about −23◦Cfor most foods and down to −29◦C for ice cream. Chill store temperatures depend on theproduct stored, with 0◦C usual for fresh meat, 2◦C for general chill and dairy produce and10◦C for bakery products. Some fruits and vegetables require particular temperature control,for example, to regulate the ripening of bananas, and often in these cases a strictly controlledventilation system is required to regulate the quantity of off-gases in the store atmosphere. Insome cases the quantity of carbon dioxide in the atmosphere needs to be controlled. In othersit is the production of ethylene, which accelerates the ripening process, which is of concern.Significant quantities of fresh air ventilation may be required to control the amounts of thesetrace gases in the atmosphere. The cooling load required to maintain the correct temperature
Frozen Food Science and Technology. Edited by Judith A. Evans
© 2008 Blackwell Publishing Ltd, ISBN: 978-1-4051-5478-9
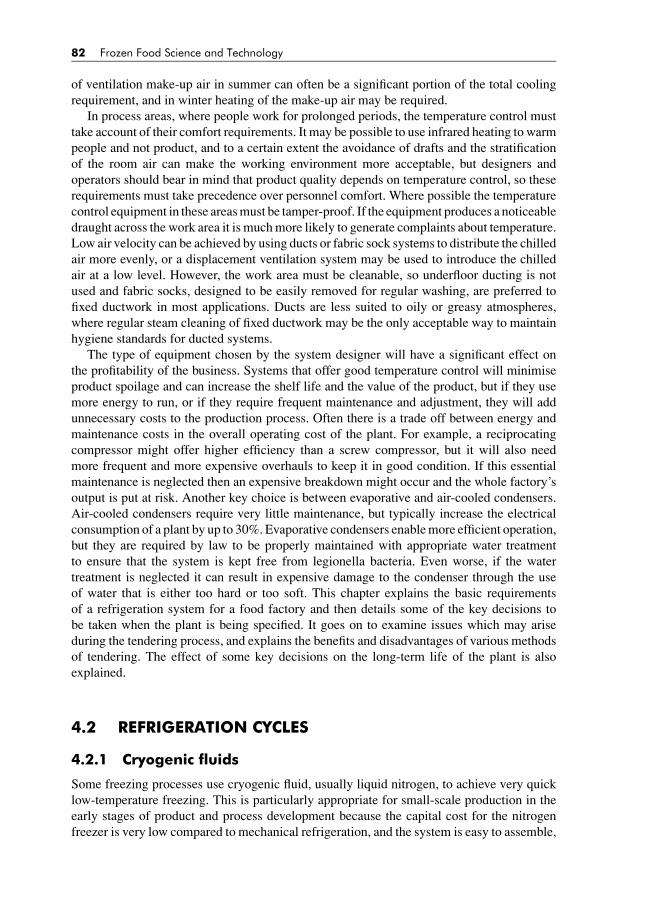
BLUK139-Evans March 5, 2008 16:20
82 Frozen Food Science and Technology
of ventilation make-up air in summer can often be a significant portion of the total coolingrequirement, and in winter heating of the make-up air may be required.
In process areas, where people work for prolonged periods, the temperature control musttake account of their comfort requirements. It may be possible to use infrared heating to warmpeople and not product, and to a certain extent the avoidance of drafts and the stratificationof the room air can make the working environment more acceptable, but designers andoperators should bear in mind that product quality depends on temperature control, so theserequirements must take precedence over personnel comfort. Where possible the temperaturecontrol equipment in these areas must be tamper-proof. If the equipment produces a noticeabledraught across the work area it is much more likely to generate complaints about temperature.Low air velocity can be achieved by using ducts or fabric sock systems to distribute the chilledair more evenly, or a displacement ventilation system may be used to introduce the chilledair at a low level. However, the work area must be cleanable, so underfloor ducting is notused and fabric socks, designed to be easily removed for regular washing, are preferred tofixed ductwork in most applications. Ducts are less suited to oily or greasy atmospheres,where regular steam cleaning of fixed ductwork may be the only acceptable way to maintainhygiene standards for ducted systems.
The type of equipment chosen by the system designer will have a significant effect onthe profitability of the business. Systems that offer good temperature control will minimiseproduct spoilage and can increase the shelf life and the value of the product, but if they usemore energy to run, or if they require frequent maintenance and adjustment, they will addunnecessary costs to the production process. Often there is a trade off between energy andmaintenance costs in the overall operating cost of the plant. For example, a reciprocatingcompressor might offer higher efficiency than a screw compressor, but it will also needmore frequent and more expensive overhauls to keep it in good condition. If this essentialmaintenance is neglected then an expensive breakdown might occur and the whole factory’soutput is put at risk. Another key choice is between evaporative and air-cooled condensers.Air-cooled condensers require very little maintenance, but typically increase the electricalconsumption of a plant by up to 30%. Evaporative condensers enable more efficient operation,but they are required by law to be properly maintained with appropriate water treatmentto ensure that the system is kept free from legionella bacteria. Even worse, if the watertreatment is neglected it can result in expensive damage to the condenser through the useof water that is either too hard or too soft. This chapter explains the basic requirementsof a refrigeration system for a food factory and then details some of the key decisions tobe taken when the plant is being specified. It goes on to examine issues which may ariseduring the tendering process, and explains the benefits and disadvantages of various methodsof tendering. The effect of some key decisions on the long-term life of the plant is alsoexplained.
4.2 REFRIGERATION CYCLES
4.2.1 Cryogenic fluids
Some freezing processes use cryogenic fluid, usually liquid nitrogen, to achieve very quicklow-temperature freezing. This is particularly appropriate for small-scale production in theearly stages of product and process development because the capital cost for the nitrogenfreezer is very low compared to mechanical refrigeration, and the system is easy to assemble,
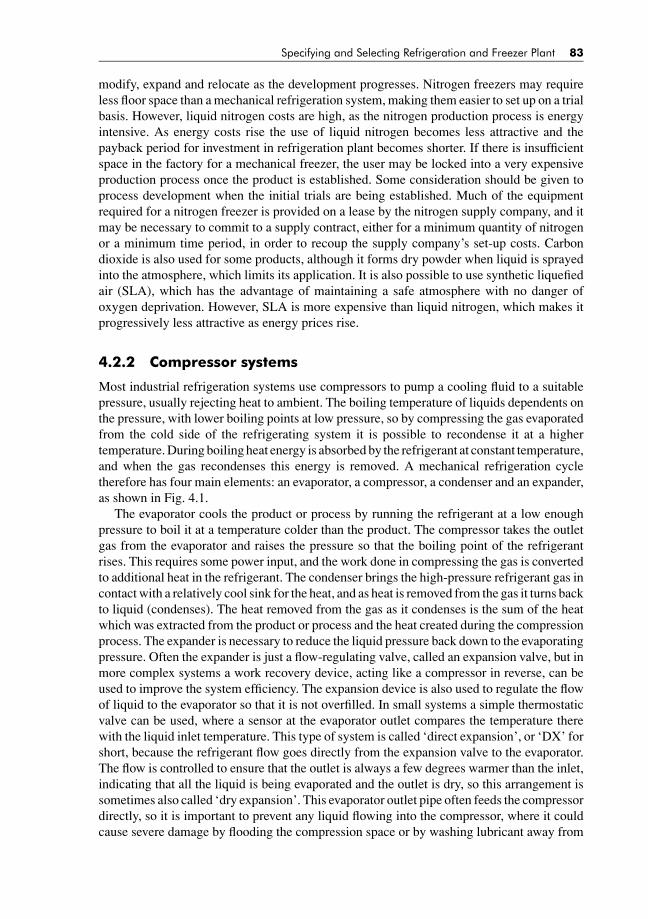
BLUK139-Evans March 5, 2008 16:20
Specifying and Selecting Refrigeration and Freezer Plant 83
modify, expand and relocate as the development progresses. Nitrogen freezers may requireless floor space than a mechanical refrigeration system, making them easier to set up on a trialbasis. However, liquid nitrogen costs are high, as the nitrogen production process is energyintensive. As energy costs rise the use of liquid nitrogen becomes less attractive and thepayback period for investment in refrigeration plant becomes shorter. If there is insufficientspace in the factory for a mechanical freezer, the user may be locked into a very expensiveproduction process once the product is established. Some consideration should be given toprocess development when the initial trials are being established. Much of the equipmentrequired for a nitrogen freezer is provided on a lease by the nitrogen supply company, and itmay be necessary to commit to a supply contract, either for a minimum quantity of nitrogenor a minimum time period, in order to recoup the supply company’s set-up costs. Carbondioxide is also used for some products, although it forms dry powder when liquid is sprayedinto the atmosphere, which limits its application. It is also possible to use synthetic liquefiedair (SLA), which has the advantage of maintaining a safe atmosphere with no danger ofoxygen deprivation. However, SLA is more expensive than liquid nitrogen, which makes itprogressively less attractive as energy prices rise.
4.2.2 Compressor systems
Most industrial refrigeration systems use compressors to pump a cooling fluid to a suitablepressure, usually rejecting heat to ambient. The boiling temperature of liquids dependents onthe pressure, with lower boiling points at low pressure, so by compressing the gas evaporatedfrom the cold side of the refrigerating system it is possible to recondense it at a highertemperature. During boiling heat energy is absorbed by the refrigerant at constant temperature,and when the gas recondenses this energy is removed. A mechanical refrigeration cycletherefore has four main elements: an evaporator, a compressor, a condenser and an expander,as shown in Fig. 4.1.
The evaporator cools the product or process by running the refrigerant at a low enoughpressure to boil it at a temperature colder than the product. The compressor takes the outletgas from the evaporator and raises the pressure so that the boiling point of the refrigerantrises. This requires some power input, and the work done in compressing the gas is convertedto additional heat in the refrigerant. The condenser brings the high-pressure refrigerant gas incontact with a relatively cool sink for the heat, and as heat is removed from the gas it turns backto liquid (condenses). The heat removed from the gas as it condenses is the sum of the heatwhich was extracted from the product or process and the heat created during the compressionprocess. The expander is necessary to reduce the liquid pressure back down to the evaporatingpressure. Often the expander is just a flow-regulating valve, called an expansion valve, but inmore complex systems a work recovery device, acting like a compressor in reverse, can beused to improve the system efficiency. The expansion device is also used to regulate the flowof liquid to the evaporator so that it is not overfilled. In small systems a simple thermostaticvalve can be used, where a sensor at the evaporator outlet compares the temperature therewith the liquid inlet temperature. This type of system is called ‘direct expansion’, or ‘DX’ forshort, because the refrigerant flow goes directly from the expansion valve to the evaporator.The flow is controlled to ensure that the outlet is always a few degrees warmer than the inlet,indicating that all the liquid is being evaporated and the outlet is dry, so this arrangement issometimes also called ‘dry expansion’. This evaporator outlet pipe often feeds the compressordirectly, so it is important to prevent any liquid flowing into the compressor, where it couldcause severe damage by flooding the compression space or by washing lubricant away from
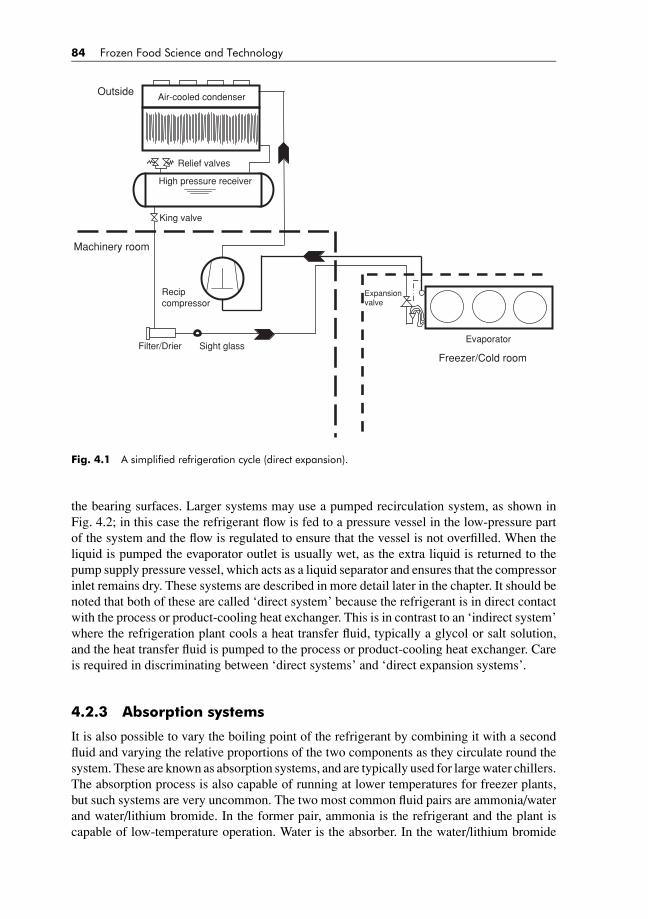
BLUK139-Evans March 5, 2008 16:20
84 Frozen Food Science and Technology
High pressure receiver
Air-cooled condenser
King valve
Recip compressor
Evaporator
Expansion valve
Machinery room
Freezer/Cold room
Outside
Filter/Drier Sight glass
Relief valves
Fig. 4.1 A simplified refrigeration cycle (direct expansion).
the bearing surfaces. Larger systems may use a pumped recirculation system, as shown inFig. 4.2; in this case the refrigerant flow is fed to a pressure vessel in the low-pressure partof the system and the flow is regulated to ensure that the vessel is not overfilled. When theliquid is pumped the evaporator outlet is usually wet, as the extra liquid is returned to thepump supply pressure vessel, which acts as a liquid separator and ensures that the compressorinlet remains dry. These systems are described in more detail later in the chapter. It should benoted that both of these are called ‘direct system’ because the refrigerant is in direct contactwith the process or product-cooling heat exchanger. This is in contrast to an ‘indirect system’where the refrigeration plant cools a heat transfer fluid, typically a glycol or salt solution,and the heat transfer fluid is pumped to the process or product-cooling heat exchanger. Careis required in discriminating between ‘direct systems’ and ‘direct expansion systems’.
4.2.3 Absorption systems
It is also possible to vary the boiling point of the refrigerant by combining it with a secondfluid and varying the relative proportions of the two components as they circulate round thesystem. These are known as absorption systems, and are typically used for large water chillers.The absorption process is also capable of running at lower temperatures for freezer plants,but such systems are very uncommon. The two most common fluid pairs are ammonia/waterand water/lithium bromide. In the former pair, ammonia is the refrigerant and the plant iscapable of low-temperature operation. Water is the absorber. In the water/lithium bromide
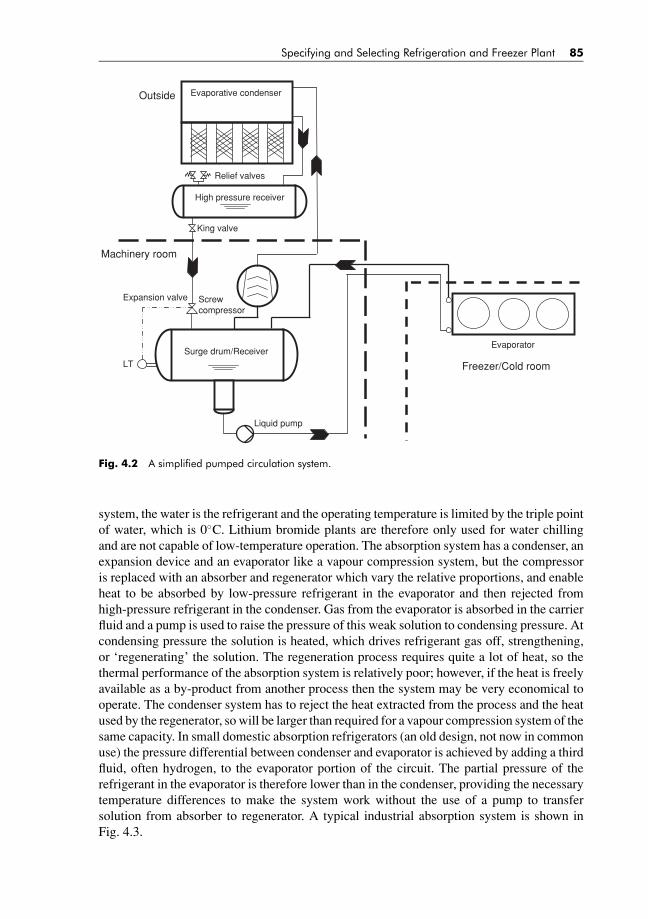
BLUK139-Evans March 5, 2008 16:20
Specifying and Selecting Refrigeration and Freezer Plant 85
LTSurge drum/Receiver
High pressure receiver
Evaporative condenser
King valve
Screwcompressor
Evaporator
Liquid pump
Expansion valve
Machinery room
Freezer/Cold room
Outside
Relief valves
Fig. 4.2 A simplified pumped circulation system.
system, the water is the refrigerant and the operating temperature is limited by the triple pointof water, which is 0◦C. Lithium bromide plants are therefore only used for water chillingand are not capable of low-temperature operation. The absorption system has a condenser, anexpansion device and an evaporator like a vapour compression system, but the compressoris replaced with an absorber and regenerator which vary the relative proportions, and enableheat to be absorbed by low-pressure refrigerant in the evaporator and then rejected fromhigh-pressure refrigerant in the condenser. Gas from the evaporator is absorbed in the carrierfluid and a pump is used to raise the pressure of this weak solution to condensing pressure. Atcondensing pressure the solution is heated, which drives refrigerant gas off, strengthening,or ‘regenerating’ the solution. The regeneration process requires quite a lot of heat, so thethermal performance of the absorption system is relatively poor; however, if the heat is freelyavailable as a by-product from another process then the system may be very economical tooperate. The condenser system has to reject the heat extracted from the process and the heatused by the regenerator, so will be larger than required for a vapour compression system of thesame capacity. In small domestic absorption refrigerators (an old design, not now in commonuse) the pressure differential between condenser and evaporator is achieved by adding a thirdfluid, often hydrogen, to the evaporator portion of the circuit. The partial pressure of therefrigerant in the evaporator is therefore lower than in the condenser, providing the necessarytemperature differences to make the system work without the use of a pump to transfersolution from absorber to regenerator. A typical industrial absorption system is shown inFig. 4.3.

BLUK139-Evans March 5, 2008 16:20
86 Frozen Food Science and Technology
Cascade heat exchanger
Surge drum/Receiver
High pressure receiver
Evaporative condenser
Evaporator
Liquid pump
Expansion valve
Machinery room
Freezer/Cold room
Outside
Relief valves
Absorber
Solution heat exchanger
Desorber
King valve
Expansion valve
Evaporative cooling tower
Fig. 4.3 Absorption refrigeration freezer.
4.3 ASSESSING ENERGY EFFICIENCY OFREFRIGERATION CYCLES
System performance is assessed by comparing the ratio of heat removed from the process tothe work required to achieve that heat removal. Although they seem very different, the inputwork and output heat are both forms of energy. The ratio is usually expressed as the rate ofheat removal, measured in kW, divided by the power input (rate of work input), also measuredin kW. In some applications the total energy input and output, measured in kJ or MJ, is a moreappropriate method of calculation. In a batch freezer for example, the operating temperaturewill be high at the start of the process and will drop as the freezing process progresses tocompletion. In this case a measure of total energy (MJ/MJ) required to complete the batchis more useful than the instantaneous ratio (kW/kW). The ratio is called the coefficient ofperformance (CoP). This concept is often extended to include ancillary devices necessary tocomplete the refrigerating function, such as cooling tower fans and pumps, oil pumps forcompressors, evaporator fans and even drain line and defrost heaters. This extended ratiois called the coefficient of system performance (CoSP), and is generally a smaller figurethan the CoP, which usually includes only the compressor motor power. In some marketsthe performance is called ‘energy efficiency ratio’ (EER) and may be expressed as ton ofrefrigeration (TR) per motor horse power (bhp). Note that the ratio may also be inverted –typically bhp per TR – such that a larger value represents poorer system performance. In theUnited States the convention is that heat pump performance (heat/work) is called CoP, but

BLUK139-Evans March 5, 2008 16:20
Specifying and Selecting Refrigeration and Freezer Plant 87
chiller performance (also heat/work) is called EER. Any specified measure of performancemust state clearly whether it is work/heat or heat/work, particularly if the SI unit kW is usedfor both values. For the rest of this chapter the European convention has been followed: CoPis used for refrigeration and heat pump systems, indicating the ratio of heat extracted to workinput, and where there is any ambiguity they are denoted CoPr and CoPh, respectively.
The main influence on the system efficiency is the extent to which the operating temperatureof the refrigerant must be raised from the evaporator to the condenser. In a chill room forexample, the evaporator may operate at −5◦C and the condenser design condition may be35◦C. In a blast freezer with the same condenser condition the evaporator may operateat −45◦C. In the latter case the compressor must provide much more work to raise theoperating temperature as the temperature lift is double: 80 K instead of 40 K. As there is aneed for some work input for the system to work, it is useful to consider the ‘ideal’ efficiency,sometimes known as the Carnot efficiency, and compare this with system performance underconsideration. The Carnot efficiency indicates the performance that would be achieved by asystem using an ideal cycle with no thermodynamic losses, such as friction. It is a simpleexpression of the evaporating and condensing temperatures. Expressed as a coefficient ofperformance, it is the ratio of the absolute evaporating temperature to the temperature lift(the difference between the condensing and evaporating temperatures). In the chill roomand blast freezer examples above, the Carnot CoPs would be 6.7 and 2.85, respectively.Coefficients achieved in practice are usually much smaller than these, and the differencebetween the ideal and actual energy consumption is sometimes called ‘exergy’.
It follows that the efficiency of a refrigeration system can be improved by ensuring thatthe temperature lift is minimised. At the design point this is achieved by ensuring that theheat exchangers operate with as small a temperature difference as possible; in practice itis also necessary to ensure that the temperature lift is kept to the minimum practical in theprevailing operating conditions. For example, the condenser temperature can be reduced incold weather as a means of lowering the average lift. It might also be possible to raise theevaporator pressure, for example when the load on a glycol chilling system is low, in orderto improve overall operating efficiency. If heat loads could be reduced, or even eliminated,from the system then the overall efficiency could be further improved.
The efficiency of the basic refrigeration cycle described above can be enhanced in a num-ber of ways, usually by increasing the complexity of the circuit. If the temperature lift isgreater than 60 K then it is worth considering a two-stage compressor, or two-stage sys-tem (where the two stages are achieved with separate compressors). This is advantageousbecause compressor efficiency is a function of pressure ratio and pressure difference, so byreducing each of these the compressor performance is improved. The optimum intermediatepressure lies roughly at the geometric mean of the suction and discharge pressures, so thatthe low-stage and high-stage pressure ratios are the same, but the exact value of the opti-mum depends on the compressor characteristic and should be calculated for each system.There are significant differences between reciprocating and screw compressor performancecharacteristics. In isentropic efficiency the screw compressor peak performance is related tothe ratio between suction and discharge volumes, expressed as the volume ratio, or Vi . If thecompressor has a high volume ratio, it is suitable for operation over a higher pressure ratio,but the peak efficiency would be lower than a machine with a low volume ratio. It is possiblein some screw compressors to vary the ratio during operation, by changing the shape of thedischarge port but this is of limited value in low-temperature systems because the operatingpressure ratio is so high that the volume ratio at these conditions is always far smaller thenthe optimum value since a typical screw compressor cannot achieve a volume ratio above 5.8.The consequence of operating at a pressure ratio above the value dictated by the compressor

BLUK139-Evans March 5, 2008 16:20
88 Frozen Food Science and Technology
geometry is that the pressure in the discharge chamber would be lower than the condensingpressure so when the discharge port opens there would be a flow of gas from the systeminto the compressor, resulting in some recompression, and hence wasting of some energy.If the volume ratio is too high then the pressure reached in the discharge chamber will behigher than necessary. There will be a sudden rush of gas from the compressor when the portopens, and in this case energy is wasted because the pressure lift within the compressor ishigher than necessary. For chill compressors where the discharge pressure is varied to suit theambient temperature conditions, variable volume ratio can improve the efficiency by severalpercent in annual energy consumption, but if the discharge pressure does not vary much,for example in a heat recovery system, or if the system only operates in warmer weather,then there will not be much benefit. In a reciprocating compressor, the efficiency is deter-mined by the pressure ratio because the cylinder is not completely evacuated at the end of thecompression stroke. When the discharge valve closes and the piston returns to the bottom ofits stroke, the residual gas in the clearance volume re-expands. This restricts the amount ofgas that can be introduced through the suction valve, reducing the volumetric efficiency, andit also requires to be recompressed, reducing the isentropic efficiency. These compressorsare therefore extremely inefficient at high pressure ratios, because the net swept volume isrelatively small.
In a two-stage plant it may be appropriate to use a reciprocating compressor on the high-pressure stage, where the swept volume is relatively small, and a screw compressor on thelow-pressure stage. In this case the low stage could use a variable volume ratio and highstage could be operated with a fixed pressure ratio to maintain good efficiency across a rangeof ambient conditions by varying the intermediate pressure. However, using this strategyis often not possible because the plant includes a ‘side load’, for example a chill store orglycol chilling plant, which requires the intermediate pressure to be fixed in order to providean appropriate intermediate evaporating temperature. In this case it might be appropriateto provide a stand-alone chiller for the side load, in order not to compromise the energyefficiency strategy for the main plant. Relevant factors to be considered in this case includethe relative size of the heat loads, the load-time profile for each part of the system and theefficiency of the possible stand-alone chiller.
4.4 CHOICE OF REFRIGERANT
It is clear that the ideal efficiency of a refrigerating system does not depend on the fluid usedas the refrigerant, because it is simply a function of evaporating temperature and condensingtemperature. However, some of the factors, which cause the system performance to fall shortof the ideal, depend on the fluid properties, and so system operating efficiency is stronglyinfluenced by the choice of refrigerant. Refrigerant choice also affects the capital cost ofthe equipment required, and may also influence the space required to house the plant. Thelevel of capital expenditure required on heat exchanger surface in order to achieve equivalentefficiency, or on ancillary components such as economisers or oil coolers, may also vary.
Apart from capital costs, space requirements and operating efficiency, the level of mainte-nance required and the cost of health and safety considerations including appropriate trainingand the additional personal protective equipment required for some systems may also be in-fluenced by refrigerant choice.
For most industrial systems the choice lies between ammonia and a halocarbon and isdetermined by consideration of system size, health and safety requirements, capital costs and

BLUK139-Evans March 5, 2008 16:20
Specifying and Selecting Refrigeration and Freezer Plant 89
operational efficiency. In general, ammonia is preferred for large systems because the equip-ment cost is relatively low, the energy efficiency is high and the cost of the additional safetyequipment required is a small proportion of the total equipment cost. In smaller installationsthe convenience of the non-flammable, non-toxic halocarbons may outweigh the capital andoperating cost factors. Ammonia is acutely toxic and a specific hazard analysis should beconducted for the installation, including the effect of a large release of ammonia on the localarea. Particular attention should be paid in this analysis to the proximity of offices, shopsand houses. However, the risks associated with ammonia releases must be kept in perspectiveto ensure that the correct system specification is defined. Fatalities and serious injury areextremely rare and without exception they occur in the immediate vicinity of the ammoniarelease, usually as a consequence of some maintenance intervention or other accident. TheEuropean safety standard for refrigeration, EN-378, requires that automatic gas detectionis installed in ammonia plant rooms, and that it is linked to a manned post or to automaticelectrical isolation of the power supply to the plant room. It is also used to start emergencyventilation of the plant room, usually at relatively high ventilation rates. This is not for toxicityconsiderations, but because ammonia is flammable within a defined concentration range. Thesystem designer must decide whether the plant specification should go beyond the minimumrequirements of the safety standard. For example, it might be appropriate to include ammoniasensors and alarms in a large production area, or to provide power isolation in other parts ofthe building as well as the machinery room. Alarms at low concentrations are generally notrequired because ammonia has a highly distinctive odour, and causes discomfort at levelsthat do not cause injury. This ‘self-warning’ feature of ammonia provides sufficient warningof a leak to the local population, but it might be appropriate to place sensors in normallyunoccupied areas to warn against a dangerous build up of toxic gas. Operating proceduresfor all maintenance activity should be implemented, including where appropriate evacuationof adjacent areas in case a major release occurs. Design of ammonia plant rooms shouldalso include provision in the drainage system for sufficient capacity to prevent solutions ofammonia reaching the local ground water, because weak ammonia solutions can be highlytoxic to fish and other marine life.
The most commonly used halocarbons for industrial refrigeration are R-404A and R-410A.They are not favoured for large systems because it is difficult to keep the plant ‘leak tight’, andthe refrigerant is inherently expensive. They are particularly suited to small systems, and tolow-temperature freezers and stores, because they operate above atmospheric pressure downto temperatures of about −50◦C, whereas ammonia is at atmospheric pressure when boilingat −33◦C. If the required cooling capacity can be achieved with semi-hermetic compressorsthen halocarbons are worth considering. It should be noted that, for halocarbon refrigerants,if the refrigerant charge is greater than the practical limit for any room or chamber servedby the refrigeration system, then that room or chamber should be fitted with a suitable gasdetector and alarm system. These detectors should trigger an alarm if the refrigerant level inthe relevant space rises to the practical limit. This might mean that the detection and alarmsystem requirements for a large halocarbon system serving a number of small rooms wouldbe significantly more arduous and expensive than the requirements for an ammonia system,which would only require detection and ventilation in the machinery room.
In the event of a large halocarbon release the main hazards encountered are asphyxiationand the effects of toxic products of combustion. The off-gases from burning HCFC and HFCrefrigerants are significantly more toxic than ammonia, and extreme caution must be takenwhen fighting fire in these systems, or when ‘hot works’ such as welding or brazing are inprogress.

BLUK139-Evans March 5, 2008 16:20
90 Frozen Food Science and Technology
There will usually be very little difference in capital cost between medium-sized plantswith ammonia or halocarbon – for very small systems halocarbon would probably be cheaper,but for large plants ammonia would be more cost effective.
An additional risk to be considered in the event of a large ammonia release, alongsideflammability and personnel toxicity, is the risk of significant product spoilage in the event ofcontact with ammonia. Reduction or elimination of the ammonia charge should be considered,for example by using a glycol solution as a secondary system. Some recent plants have usedcarbon dioxide in this application because it has a much higher heat capacity than glycol,so the auxiliary loads on the plant, such as circulating pumps, are greatly reduced. Carbondioxide operates at high pressures, but this will not present any health and safety risk if thesystem is designed correctly. There will be a requirement for gas detection and alarms inoccupied spaces served by the carbon dioxide system on the same basis as for fluorocarbons.
4.5 SELECTING THE BEST REFRIGERATING SYSTEMFOR A PROCESS
The most appropriate system for a refrigerating process will usually be a compromise betweencapital and operating costs because in many cases the simplest of systems will not be the mostefficient to operate. Some key factors must be considered in laying down the requirementsfor a plant:� What range of products is to be handled by the system?� What quantity of product is to be handled by the system?� What product condition is required at the system inlet?� What time constraints will be placed on the process?� What condition is required at the exit?� What energy performance is expected of the equipment?� What space is available for the product cooling equipment?� What location is available for the plant which feeds the cooling equipment?� What budget is set for the acquisition of the equipment?� What budget is set for the operation and maintenance of the equipment?
4.5.1 What range of products is to be handled by the system
In cold and chill stores, where the only requirement of the process is to maintain the productat a prescribed temperature the type of product is not significant, provided it does not addmoisture to the storage atmosphere. Wet products such as fish or meat should be wrappedbefore long-term storage otherwise the loss of moisture will reduce product weight andimpair quality, a double loss of value. In freezers and chillers the type of product is muchmore significant as it determines the heat transfer performance of the product, and hencethe freezing capacity of the plant. This is covered in greater detail in subsequent chapters;however, it should be noted here that freezing performance is determined not just by thethermophysical properties of the product, such as density, specific heat capacity, latent heat,thermal conductivity, water content and fat content. The size and shape of the product, theorientation in which it is presented to the airstream and the material in which it is wrappedcan all cause significant increases in the freezing time. There may also be limitations to theair velocity that can be applied to the product, delicate confectionary for example, and this
BLUK139-Evans March 5, 2008 16:20
Specifying and Selecting Refrigeration and Freezer Plant 91
may also result in lengthened freezing or chilling times. If possible the designer should bemindful of the full range of possible product to be handled by a chiller or freezer, and shouldinclude means of adjustment to the basic system to ensure that the loss of performance isminimal when the product specification changes. This might include variable speed fans tovary the air velocity over the product, adjustable air baffles, variable belt speed or controlover the rate of temperature reduction to ensure that thin product is not frozen inefficientlyin a machine designed for thicker portions.
4.5.2 What quantity of product is to be handled by the system
In situations where the volume of product is constant but the density is variable the timerequired to freeze different grades of product can vary greatly. The specification must beunambiguous about the weight of product to be processed, the physical shape it presents andthe weight and type of packaging and transport equipment included. The refrigeration loadon the system is calculated from the weight of product handled by the system in a given time,not the volume of product.
4.5.3 What product condition is required at the system inlet
There are two classes of chiller and freezer: continuous and batch. Spiral and tunnel freezersare of the continuous type. Product is fed through them on a conveyor, often coming directlyfrom a preparation or cooking process. Blast and plate freezers are of the batch type, whereproduct is loaded into a fixed location where it remains for the duration of the freezing processand is then removed. As a consequence of this mode of operation, time must be allowedfor loading and unloading as part of the total batch time. Some plate freezer types can beautomated to provide a form of ‘semi-continuous’ operation, but they are strictly still batchprocessing because there is a need for defrosting, unloading and refilling in every freeze cycle.
Continuous freezers are generally more suited to smaller products with short freezingtimes, and to product in its finished form where the presentation of the frozen food is important.The amount of time that the product spends within the freezer is called the residence time,and is adjusted for different products by varying the conveyor speed. Small products withhigh water content, such as vegetables, will freeze quickly, and it may be difficult to retain thecharacter of the individual items. In this case jets of air may be used to create a fluidised bedto ensure that each item is individually frozen. Larger products and those that contain moreair, such as bakery products, will require a longer residence time, and may also require to behandled more gently to avoid damage. As mentioned above, the packaging of food can havea significant effect on the freezing time. For example, the freezing time of cooked meat ontrays in a spiral freezer will be affected by the depth and material of the tray. Packaged readymeals are particularly difficult to freeze because there is often an air gap between the top ofthe meal and the underside of the lid. Where possible the trays should be left open-toppeduntil the freezing process is over, but this may not be possible for hygiene reasons, or simplybecause it is not possible to seal the package when it is cold. If the product is fed from acooking system directly to the chiller or freezer then there will be significant advantage inpre-chilling with ambient air before it is placed in the freezer. This might be achieved byincluding a reasonable length of conveyor from oven to freezer, perhaps with cooling fansblowing ambient air over the product, rather than positioning them right next to each other.
Batch freezers are suitable for larger products, particularly where it has been wrappedor palletised. Plate freezers are often used for boxed beef, and whole pallets are used for

BLUK139-Evans March 5, 2008 16:20
92 Frozen Food Science and Technology
loading larger blast freezers, mainly to save time in handling the product. Freezing cycles forbatch processes are longer than for continuous freezers because it is economical to group theproduct into larger bundles (boxes or pallets) to reduce the ratio of handling time to freezingtime and maximise the utilisation of the freezer. There is an advantage in achieving the fullloading–freezing–unloading–cleaning within a 24-hour period as this matches the typicalfactory shift pattern. It is often necessary to stack product onto pallets with spacers to enablesome airflow through the block in order to reduce freezing times to fit within the requiredtimeframe, but for most products, given the size of the pallet, the thermal conductivity ofthe product and the insulating effect of the typical packaging material, it is not possible toreduce the batch time to less than 12 hours, so a typical freezer cannot handle more thanone batch per day. A typical blast freezer cycle may load the freezer in the late afternoonand start the freeze mid-evening. Assuming an 18-hour freeze has been achieved, the freezerwill run overnight and through the next morning until the early afternoon. This enables itto be unloaded and cleaned, ready for the next batch, through the mid-afternoon period. Anadvantage of this cycle is that it fits well with a typical time-of-day electrical tariff, wherethe cheapest electricity is available overnight, when the freezer plant is most heavily loaded,and the freezer is off during the most expensive period, typically 16:00 to 19:00 hours. Platefreezer cycle times are typically shorter than blast freezers because the product is presentedto the freezer in slabs to suit the shape of the plate, and because direct contact between theplate and the product gives better heat transfer than an air blast freezer. For unwrapped meatproducts in 75-mm blocks, freezing times of less than 1 hour can be achieved. For boxedproduct in 150-mm blocks, the freezing process could take up to 12 hours.
4.5.4 What time constraints will be placed on the process
There is a limit to the minimum length of time required to achieve freezing at the core of theproduct, and it is determined by the size, shape and physical properties of the product as wellas the type of wrapping used, if any. Individual peas within a fluidised bed have a diameterof about 4 mm and will be frozen within a few seconds, whereas for slabs of beef packed incorrugated cardboard boxes and stacked on pallets it is much more difficult to transfer theheat from the centre of the block to the surrounding air. In the latter case greatly reducingthe temperature of the air is not a viable option; the only thing that will allow the heat totransfer out of the block is time. If a certain product throughput is required in the process,whether it is a batch process such as a blast freezer or a continuous process such as a spiralfreezer, the only way that large, slow-freezing products can be accommodated is by providingsignificant product dwell time within the freezer. This has implications for the size and costof the freezer, but also has an effect on the size of the refrigeration plant. The plant capacityrequired to freeze a tonne of peas will be very large because the heat is removed in a matterof seconds. If the product is a tonne of boxed beef packaged on a pallet then the heat removalmight take 24 hours or more. However, as approximately the same amount of heat is removedbut over a much longer period, the load that the refrigeration plant is required to handle isvery much smaller for the case of beef freezing. The refrigeration plant required to removethe same amount of heat in 24 hours in the meat freezer as was removed in 40 seconds inthe pea freezer would be only 0.1% of the size of the pea freezer. This in turn means therefrigeration plant would be only 0.1% of the size of the pea freezer. In practice, the ancillaryloads such as fans form a significant part of the total, so the difference in plant size is lessextreme than this example, but it should be clear that freezing 1 tonne of peas and 1 tonne ofboxed beef require refrigeration plants of very different sizes.
BLUK139-Evans March 5, 2008 16:20
Specifying and Selecting Refrigeration and Freezer Plant 93
4.5.5 What condition is required at the exit
The specification for a freezer or chiller must state clearly the expected output conditionof the product. In freezers it is usual to state that the product core temperature must havereached a certain temperature within a defined time period. The surface temperature willdrop to within a few kelvins of the air or plate temperature within minutes of starting ofthe freeze process, and so is a very poor indication of the progress of the freezing process.For many products the core temperature can only be measured by destructive testing withtemperature probes, so it is not possible to base the equipment control on this temperatureand the freeze cycle is based on a fixed elapsed time, with some destructive testing of a fewsamples at the end of the cycle to provide verification. A core temperature of −18◦C is oftenused as the acceptance criterion for freezers. This is not an unreasonable value, although itoriginates from the freezing point of a mixture of salt solution and snow (which defined zerodegree on the Fahrenheit scale), and therefore is not directly related to product quality. Itis essential that the whole mass of the product has passed through the freezing point phasechange, and the −18◦C target is often justified on the basis that it allows some leeway forvarying freezing rates depending on product position within the freezer and variations in airflow, air temperature and surface heat transfer. Provided there is no adverse effect, the systemspecifier should consider whether a slightly higher core temperature would be acceptable, asthere could be a significant energy saving in accepting the core at −15◦C, or even as highas −10◦C and either reducing the freeze time or raising the air temperature. The practiceof partially freezing the product and then placing it in a cold store for ‘finishing’ is goodneither for product quality nor for efficiency, and is not acceptable. The product must also besufficiently well frozen so that it can be handled without damage to the product surface orpackaging. Packaging can also be damaged by condensation freezing on the surface of theproduct if it is left for any time in a chill area before being placed in cold storage. If this isunavoidable then consideration should be given to dehumidification of the chill area in thevicinity of the freezer outlet.
4.5.6 What energy performance is expected of the equipment
It is difficult to give specific, accurate requirements for the energy performance of refrigerationequipment because there is a broad band of possible performance depending on factors suchas the size and type of evaporators, the way in which the equipment is used and the way inwhich it is maintained. However, it is important to pay attention to the power consumptionfigures proposed by system designers and contractors as decisions taken at the purchasingstage are difficult and expensive to modify at a later date. Every tenderer for a projectshould be required to give details of the sizing of evaporators and condensers, and the energyconsumption expected of the compressors and ancillary devices. These should be comparedbetween potential suppliers and appropriate cost options should be included for more efficientalternative designs. The system specification should include a method of measuring the powerconsumption of the plant. As a minimum this should be a kW h energy meter for each majorpiece of equipment, and if possible the information should be incorporated into any graphicmonitoring system, so that performance analysis is made as easy as possible. These featuresare not expensive to add to a system at the precontract stage, but they can be very costlyto retrofit. Where possible the plant should be configured to record energy consumption inrelation to product throughput, and to display the results in tabular or graphical form tofacilitate performance comparisons.
BLUK139-Evans March 5, 2008 16:20
94 Frozen Food Science and Technology
4.5.7 What space is available for the product cooling equipment
Freezers and chillers divide into two basic types as described above: batch and continuous.In both cases the total space required for a functional unit is far greater than the physical sizeof the product being frozen. For blast freezers the aircooler is likely to be large; occupyingup to 25% of the footprint of the freezer, and space must also be provided for airflow throughthe product and back to the aircooler. The access to the cooler must be suitable for the typeof materials-handling equipment used: for smaller products trays mounted in racked trolleysare often used, but larger loads typically require pallet trucks or forklifts to move them. Theproduct layout within the freezer must allow room to manoeuvre the truck, but must alsoensure even airflow across all the products.
Spiral freezers generally require a smaller footprint but are taller than tunnel freezers.In both cases there must be sufficient space around the freezer for maintenance, includingin the case of ammonia equipment the requirement for draining oil from the evaporators.Tunnel freezers are long and narrow, but multi-pass arrangements are possible to reduce theoverall length. The airflow is usually across the product path, and if it is possible to dividethe tunnel into temperature zones then some of the equipment can run at a higher evaporatingtemperature. Alternatively, if the airflow is designed to travel along the length of the tunnelthen a greater rise in air temperature can be achieved, so the air volume can be reduced,giving a significant reduction in fan power. However, in this case the evaporating conditionis determined by the air temperature required at the coldest part of the air circuit.
4.5.8 What location is available for the plant which feeds thecooling equipment
For small freezers, typically of capacity 10 kW or less, the refrigeration equipment can bebuilt into the freezer unit. If the unit is air-cooled then a heat load of roughly twice thecooling capacity will be imposed on the room cooling system. Alternatively, a water-cooledunit connected to the building, chilled water or glycol system can be used. Heat loads up toabout 20 kW can be handled by a condensing unit; a package containing compressors and acondenser which can be located outdoors or in a roof void. For larger freezers the refrigerationsystem will be remote, and may be housed in a dedicated plant room. The capital cost andthe energy cost of the installation will be reduced by locating the plant room as close to thefreezer as possible, keeping the pipe runs as short as possible. Consideration should alwaysbe given when laying out the factory floor at the building design stage to the refrigerationplant location. Large systems are likely to use pumped recirculation, so it must be providedin the pipework design to let liquid drain back to the pump vessel in the plant room. If thisis not possible then it may be feasible to locate the pump vessel close to the freezer and runthe dry suction pipe back to the plant room where the compressors, condensers and ancillaryequipment will be located. The suction pipe location must be co-ordinated with other servicesto ensure that the refrigeration system functions reliably and efficiently. The other servicesmay also have particular functional requirements, such as traps in steam lines, or cleanabilityfor ductwork, so an integrated approach to services design is necessary to ensure correctoperation. This is unlikely to happen if each contractor is allowed to install their equipmentwhere they choose on a ‘first come first served’ basis.
4.5.9 What budget is set for the acquisition of the equipment
Before going out to tender, the project team should be able to set down their expectationof price of equipment, by breaking their requirement into discrete functional items and
BLUK139-Evans March 5, 2008 16:20
Specifying and Selecting Refrigeration and Freezer Plant 95
estimating the cost to build and install each of them. This estimate, even if it is carefullycalculated with expert advice, should always be treated as guidance rather than a fixed sum.Circumstances may change during the tendering process, or additional information may bepresented, which offer the possibility of significant system enhancement in plant capacity orefficiency. The project team must also bear in mind that capital costs may escalate if thereare specification changes anytime in the life of the project.
The budget should consider the purchase price of the refrigeration equipment, related costssuch as electrical infrastructure and materials handling, and the associated structural work,including insulated enclosures if required.
4.5.10 What budget is set for the operation and maintenance ofthe equipment
As mentioned previously, it is difficult to assess the specific energy consumption of a freezerbecause it is dependent on product throughput as well as ambient temperature. The mainte-nance costs are likewise difficult to predict with accuracy; however, this does not mean thatvalid comparisons between competitive quotations are not possible. Each proposal should beassessed and ranked according to energy cost, maintenance hours required, materials con-sumption and other operating costs such as water treatment chemicals. Once ranked it is thenpossible to apply cost factors to each element of the operating budget in order to derive anapproximation of the annual operating cost. This approach also gives the dual advantage ofenabling comparison between bids and providing some means of assessing the payback foradditional expenditure on more efficient or more easily maintained equipment.
4.6 DEVELOPING A SPECIFICATION
The specification must state clearly what is expected of the equipment. The product throughputand range of product types must be given, and where possible the extent to which the plant isexpected to cope with variation from these values should be defined. Although this might makethe basic design slightly more expensive it is likely to avoid expensive design changes duringthe construction phase of the project, and it will allow greater flexibility in the use of the plant,once it is in operation. This may avoid the need for expensive upgrading after a short operatinglife. The specification should define the operating environment, including ambient maximumand minimum temperatures and humidity; however, if these are not known, the designersshould be able to make an estimate based on the site location. In these circumstances alltenderers should be asked to quote against the same requirements so that bid comparisons arenot distorted. The extent to which the equipment will operate on part load should be defined,as it may necessitate the provision of additional facilities, and these may have a major effecton the efficiency of the system. For example, a system which provides refrigeration for aspiral freezer that runs continually from Monday morning to Friday evening may also feedan adjacent cold store. The system must be capable of providing cooling to the cold storewhen the freezer is not in operation, or an alternative means of cooling the cold store mustbe available when the freezer is off-line.
In addition to the initial plant requirement, consideration should be given to future expan-sion, but in this case unless the future plans are well defined and unlikely to change there islittle benefit in spending too much money on provisions. In general it is worth sizing vessels,such as high pressure receivers, for future expansion, but it is probably not worth buying addi-tional compressor, or evaporator capacity in the early stages of a project. Condenser capacityrequires additional consideration. If the full condenser capacity is installed in the early stages

BLUK139-Evans March 5, 2008 16:20
96 Frozen Food Science and Technology
of a project there will be a short-term benefit in operating cost if it is possible to run the plantat lower condensing pressures. There is also a danger that plant performance is impaired whencondensers or receivers are added at a later date. It is possible to ensure correct operation ofmultiple condensers and receivers, but the interconnecting pipework is complex and there isgreat scope for inefficiency and instability in operation. There may be grounds for sizing theoriginal steelwork to suit the substitution of the condenser and receiver with larger units atthe time of the expansion, but if this is done the system will be out of commission while thechange is made.
Space constraints for the installation must be clearly identified in the specification, andthe location of the plant room relative to the freezers should be established and fixed as soonas possible. The installation will be most successful if the refrigeration system requirementsare fully appreciated by the building and production process design teams, so that a fullyintegrated design can be achieved.
The specification must also be specific about the legal requirements that are mandatedfor the project, and the client should be clear about the implications of these. In the UnitedKingdom most industrial refrigeration installation projects are governed by the ConstructionDesign and Management Regulations (CDM) and if the site installation takes more than30 days or involves more than 500 person-days then the Health and Safety Executive mustbe notified. CDM places legal requirements on the process owner, called the ‘user’ in theregulations, even before the project commences. Industrial installations are probably alsocovered by the Pressure Systems Safety Regulations (PSSR) and the Pressure EquipmentRegulations (PER). PSSR require that a scheme of examination is created for the equipmentunder the responsibility of the ‘user’ and that the equipment is examined in accordance withthe written scheme before it is put into service and every year thereafter.
4.7 THE TENDERING PROCESS
The traditional way to procure a refrigeration plant was to appoint a team of expert advisors,create a brief for potential suppliers, invite sealed bids for the equipment described in thebrief, evaluate the tenders received and select a successful contractor to provide the equipmentrequired. This process is apparently simple, but contains many pitfalls and in some cases iscounterproductive. For example, it is now recognised that tendering in this way encouragesconflict rather than co-operation between project team members, and can often lead to delays,disputes, or budget over-runs. Each party is prompted by the system to look after their owninterests as opposed to those of the client or the project team, and often the only way for a sub-contractor to improve his project’s financial performance is cutting corners or skimping insome other way. This tendering process is slow, requiring from 2 to 6 months for preparationof the brief, a further 2 months for bid preparation by the prospective contractors and a furthermonth for tender analysis and contractor selection. During this 9-month process the projectwill be progressing, and often the design that is required by the time the sub-contract isplaced is significantly different to the scheme that has been costed by the sub-contractor. Theprocess also tends to create long chains of command from the client through the professionaladvisors to the main contractor and on to the sub-contractors. With a specialist package suchas refrigeration, the client is often frustrated by his lack of influence over the work beingconducted on his behalf by the sub-contract refrigeration contractor, but if he instructs thesub-contractor directly, or even suggests that he might do so, he is open to claims for delayand additional costs which may arise anywhere in the contractual chain. This frustration is

BLUK139-Evans March 5, 2008 16:20
Specifying and Selecting Refrigeration and Freezer Plant 97
partly addressed by the use of a Management Contract rather than a traditional BuildingContract. In the Management Contract a single management contractor is appointed, andhe places works contract packages with all the trades engaged in the project. This givesthe client the opportunity to meet with all the works contractors and encourages a freerexchange of information, making it easier to cope with late changes to the project plan.A good Management Contractor recognises that his role is substantially different from atraditional Main Contractor and will ensure that the full benefits of this style of contract areachieved, but all too often the contract administration is handled in exactly the same way asa building contract, and the potential benefits are not realised. In these cases the client canbe excused for wondering why he is paying for an extra link in the chain of command.
At a more general level there are also problems with the traditional tendering route. First,the specification is prepared by a design team who is not ultimately responsible for, nor eveninvolved in, the operation of the system. They are likely to stick with tried and tested designconcepts, and will stifle innovation whenever it tends to take them from their comfort zone intothe unknown. Their design is then reworked by each of the bidders, potentially introducingmultiple options and discrepancies between bids, before one is selected who ultimately re-does the design to suit the requirements now established during the long bidding process.Even worse, for every successful bidder there will be at least two or three unsuccessful ones.Their bidding overhead must be recovered on the projects that they win – so the total cost toindustry is pushed up even further. In total each project tendered in this way is designed atleast three times and often as many as six, including the efforts of the unsuccessful tenderers.
In recent years much has been written about an alternative approach to constructioncontracts, generally known as ‘partnering’. In a partnering situation the team is appointedbefore the start of the project, down to the level of specialist sub-contractors. This team signsup to a methodology and then agrees a set of operating parameters and sets a budget for theproject. Once this has been done the detailed design is completed by the various specialistsexchanging information in conjunction with the client. When the detailed design is completethe budget is reappraised and once it has been accepted the project work commences. Fromthis point on the project can either follow a traditional contract model – usually a ManagementContract – or can continue on a less conventional route. In an open book contract there are twostages. For an open book tender the sub-contractor will present a detailed breakdown of costs,including equipment and sub-contract quotes. These are marked up by agreed percentages togive the total price for the project. This becomes the fixed, lump-sum price in the contract.For an open-book contract, the visibility of costs carries through to contract completion,usually with an agreed methodology for handling cost overruns and underspends on individualline items. A common approach is to agree on a ‘guaranteed maximum price’ where, withthe exception of design changes, the project cost is capped. If the result is higher than thecap the contractor pays the difference: if it is less than the cap the result is shared betweenthe client and the sub-contractor. This works well if there is a positive spirit on both sidesand provided the original budget is accepted by all as a fair estimate. A further advantageof partnering is that it fosters a long-term relationship, and if the project is the latest in along line of successful installations then the contractor selection stage is merely a case ofvalidating the previous team. The client should check whether the key members of previousproject teams will be involved again, and may ask for references for any new team members,but if there is a case history of previous successful projects between the two parties thereis no point wasting energy on investigating what is already well known. One of the majorbenefits of starting a project on the basis of a partnering agreement is that it enables a highlevel of trust between all those involved in the process to be developed.
BLUK139-Evans March 5, 2008 16:20
98 Frozen Food Science and Technology
At the opposite end of the trust–suspicion scale there is e-bidding. This is a method oftendering which is designed to get the lowest possible first cost for the client, by requiringall tenderers to post their bids on a website. The tenderers are told what the lowest price is,and where in the ranking their current bid lies. If they choose to do so they can reduce theirprice and increase their chances of success. In some e-bids the client is obliged to acceptthe lowest bid, unless there is a problem with the technical submission; in others it is clearlystated that there is no such obligation, and the client may choose whichever bid he likes. Themajor flaw with e-bidding is that it is founded on two false premises: first, that all suppliersare equally capable and competent to fulfil the client’s requirements, and second, that theyare all equally hungry for work. The process requires a very detailed specification before theprices are prepared, and all the bidders must confirm that they are tendering in accordancewith the specification. There is no means within the e-bid process for one of the bidders to addvalue to their proposal, for example by offering a larger condenser. Anything that increasesthe basic price is disadvantageous to them. The bidder’s current workload is more subtle aproblem: if one contractor is very quiet he is likely to accept a lower margin on the projectthan a company who are already busy. It is naıve to assume that the contractors are equallycompetent and equally successful, so it follows that on average the low bidder’s business isquiet because he is less successful than his competitor. If a client is asked whether he wantsa low price or not he will probably say yes. However, if asked whether he wants to buy fromthe least successful and therefore most desperate contractor on the list the answer is likelyto be different. The answer to this dilemma is to have a thorough specification and vettingprocedure before the tender documents are issued; however, this process takes time and costsmoney, and still leaves the client with a contractor who is looking for every opportunity tosave money on his project costs in order to claw back some margin. The obvious conclusion isthat e-bidding is a suitable way to buy commodities in a large market, but is not so appropriatefor specialist sub-contract construction with a restricted field of suppliers. If the only reasonthat the client is adopting e-bidding is to ensure his sub-contractor is honest then he mightbe better advised to try to foster a more positive, trusting relationship.
Whichever tender process is used, the decision must be made before starting the projectand cannot be changed midway through the process. Analysis of the tenders received whetheras the result of a sealed bid, as the technical submissions supporting an e-bid or as part of thepartnering design development phase should always include a review of energy consumptionand operating costs, and should incorporate a hazard and operability study to ensure that theconcept does not have built-in expensive mistakes. Often the hazop (hazard and operabilitystudy) is not conducted until the contract has been placed, by which time design changesbecome expensive and cause delays. A disadvantage of traditional tendering and e-biddingis that the pre-contract design is often not sufficiently detailed to make a detailed analysispossible. With the hazop integrated into the pre-contract design development, many of therequirements can be incorporated at little or no additional cost.
4.8 HOW TO DESIGN FOR ENERGY EFFICIENCY
The first step in designing an efficient refrigerating system is to eliminate all unnecessaryheat loads. These might be as obvious as electrical heaters or other energy inputs, but canalso include door openings and other moisture ingress. For example, excessive humidity,which causes condensation or frost on the evaporator represents a substantial heat load. Ifthis can be eliminated by running at a higher temperature, by dehumidifying or by bettercontrol of humidifiers then significant savings in system efficiency can be achieved. The

BLUK139-Evans March 5, 2008 16:20
Specifying and Selecting Refrigeration and Freezer Plant 99
next step is to ensure that the temperature lift is as small as possible by correct sizing of theevaporator and condenser heat exchangers. This must take account of part load operation, andwith careful design it need not add much to the project capital cost. Each energy consumingelement, such as compressors, fans and pumps should be considered in its own right, andselected to be as efficient as possible, including the use, where possible, of efficient motors.The final element in efficient design is the inclusion of provisions necessary to ensure thatthe original efficiency can be maintained throughout the life of the plant. This will includeprovision of sufficient monitoring points for temperature, pressure and power to enable thesystem to be re-commissioned as part of a routine maintenance programme, provision ofaccess for inspection and maintenance and arrangement of equipment to promote efficientoperation. Where possible the compressor plant should be located as close to the load aspossible to minimise the suction line pressure drop. Care must also be taken with the locationof condensers, particularly the air-cooled types, to ensure that recirculation of warm air isminimised.
4.9 HOW TO DESIGN FOR LONG-TERMENVIRONMENTAL SUSTAINABILITY
In addition to the energy efficiency considerations outlined above there are several otheraspects of sustainability that should be considered in the design of refrigeration systems. Asthe majority of refrigerant loss is reported to be associated with major equipment failuresthe system should be designed to have as small a refrigerant charge as possible, bearingin mind the need for reliable, efficient operation. It must be possible to decant and recoverthe refrigerant in a safe and convenient manner. The consequence of accidental release ofrefrigerant, through drains, leaks or relief valves should be considered, particularly wherethere is a significant effect on the local environment, and it should be noted that the refrigerantreleased will also contain oil, and so can cause localised pollution even after it has evaporated.Refrigerant and oil drained from a system should be treated as controlled waste and handledaccordingly.
4.10 HOW TO DESIGN FOR FLEXIBILITY IN USAGE
The designer should consider the consequences of changes in the operation of the systemwhen it is first laid out, and where possible should make allowances for future modifications.This will not only consist of the addition of extra heat loads, but might also include changesin the operating temperature level or relocation of factory equipment. Where possible, andwhere the budget allows, pipe sizes should be kept as large as possible to enable loads to bemoved. Insulation thickness on chill pipes should be suitable for low-temperature operation.Consideration should be given to provision of anti-frost heater mats under chill areas if thereis any prospect of them being converted to freezers or cold stores in future. The alternativewould be that the floor would have to be lifted to enable a heater mat to be laid, which could betime-consuming, disruptive and expensive. Where low-temperature compressors may be usedat chill conditions the motor size should be increased accordingly, as the power consumptionof a given size of compressor will be much higher when operating at chill conditions. Thereshould also be adequate provision in the electrical supply for operation at chill conditions,if this is likely. These provisions are all expensive, so judgement must be used to determinewhether the chance of change justifies the extra cost.
BLUK139-Evans March 5, 2008 16:20
100 Frozen Food Science and Technology
4.11 MAINTAINING AND OPERATINGREFRIGERATION EQUIPMENT
Refrigeration equipment ought to be capable of providing years of trouble-free efficientoperation, but it takes some careful maintenance as well. The effects of ice, moisture andexposure to weather can have a detrimental effect on plant mechanical integrity, which maylead to unreliable operation. Wear and tear on small components such as solenoid valves andpressure regulators can lead to expensive malfunctions, for example in hot gas defrost valvestations, so such components should be the subject of regular inspection and replacementwhere necessary. In many cases condition monitoring, for example, of lubricant condition orvibration, can be used to extend the time between expensive overhauls, but care must be takenwith some equipment where failure is sudden, without any prior warning and with expensiveconsequences. For example, reciprocating compressor overhauls are required regularly. Ifthese are not completed following the compressor manufacturer’s guidelines then there isa risk that the small springs in the loading gear may break and fall into the compressorcylinder. This can cause serious damage far beyond the value of the overhaul, and there is nocondition monitoring that can predict this type of failure. Screw compressors are more suitedto condition monitoring, as bearing wear can be monitored and maintenance planned to suitproduction and load variations.
For fluorocarbon refrigerants (f-gases) there should be a regime of regular leak testingon refrigerating systems with a charge of more than 3 kg. The European f-gas directive,introduced in 2007, requires leak testing annually if the refrigerant content of the system isabove 3 kg, every 6 months if it is above 30 kg and every 3 months if it is above 300 kg. Muchmore frequent leak testing is recommended if expensive losses and inefficient running are tobe avoided. The provision of a gas detection system in the machinery room is not a substitutefor thorough leak testing, as it is possible to lose substantial quantities of refrigerant withoutregistering anything on the gas detector. For very large distributed f-gas systems it may beappropriate to divide the system into sub-sections and thoroughly test each sub-section byrotation over a month. It is recommended that some sort of leak testing on large systemsshould form part of the weekly routine.
Evaporators and condensers, which rely on good airflow for their continued operation,should be inspected regularly and cleaned if necessary. Evaporative condenser water treatmentfor the control of harmful bacteria is required by law, but the effects of scale or corrosion shouldalso be considered in order to ensure long, reliable operation of the equipment. Typically,scaling occurs in hard-water areas and corrosion is more prevalent in soft-water areas, but ifwater softeners are used there is an increased risk of corrosion even though the mains wateris hard.
Functional checks of safety devices are required annually by law under the PressureSystems Safety Regulations. It is sensible to extend the scope of inspection beyond the letterof the law for these checks and include a system control functional check and a report on plantperformance. If necessary, as indicated by poor performance, a re-commissioning exerciseshould be conducted to bring the plant back to its original efficiency.
Although refrigeration plant presents specific hazards of working with volatile, low-temperature liquids, asphyxiation or poisoning and working with high-pressure fluids thereare many other hazards to be considered, including working at height, lifting heavy weights,working with electricity and working in a noisy environment. These hazards must be includedin any risk assessment for refrigeration plant operation or maintenance.
BLUK139-Evans January 23, 2008 17:27
5 Emerging and Novel Freezing Processes
Kostadin Fikiin
5.1 NEED FOR PROCESS INNOVATIONS IN THE FOODFREEZING INDUSTRY TO IMPROVE THE HUMANWELL-BEING AND QUALITY OF LIFE
As is known, heat and cold are of the same physical nature. In spite of this, they have playeddifferent roles in the development of human civilisation. Prometheus, the mythological herowho bestowed the divine fire of Olympus to mankind, is glorified in immortal poeticaland musical works. However, the pioneers who created artificial refrigeration and gave it tohumanity have not yet been praised in a work of art as a token of gratitude. For millennia, coldhas primarily been associated with winter, diseases and people’s misery, rather than with itsproven capability to preserve biological materials. More recently, in the industrialised world,food refrigeration has become a powerful instrument for improving the quality of life.
Refrigeration does not have a competitive alternative to maintain the nutritional resourcesof humankind. The worldwide food output amounts nearly 5 billion tonnes per year, some2 billion of which need refrigerated processing, but only 400 million are effectively re-frigerated. Chilling is an indispensable element of almost all post-harvest or post-mortemtechniques for handling food commodities of plant or animal origin, while freezing has beenestablished and recognised as the paramount commercial method for long-term preservationof the natural quality attributes of perishable foods, thereby forming a substantial part of theglobal economy and the well-being of citizens. In terms of money, every year the global in-vestment in refrigerating equipment is over US$ 170 billion, while all refrigerated foodstuffscost US$ 1200 billion (which exceeds 3.5 times the US military budget). Some 700–1000million household refrigerators and 300,000,000 m3 of cold-storage facilities are availableover the world. The annual global production of various frozen foods is about 50 milliontonnes (plus 20 million tonnes of ice creams and 30 million tonnes of fish), with a remarkablegrowth of 10% every year. Refrigeration thus accounts for about 15% of the worldwide elec-tricity consumption, thereby determining to a large extent the global economic sustainability(in terms of energy efficiency and environmental friendliness).
Food refrigeration stakeholders and cold chain professionals are part of the FAO/WHOCodex Alimentarius Commissions and played an important role in the historic world leaders’summits in Montreal, Kyoto and Johannesburg (devoted to ozone-depletion, global warmingand sustainable development). Refrigeration and the cold chain are among the top priorities ofthe US Presidential Council for Food Safety. While the economies of industrialised nationswaste 25–30% of their perishable food production because of imperfect or lacking coldchain, the disastrous dimension of such agricultural losses in developing countries is a majorcontributor to malnutrition.
Frozen Food Science and Technology. Edited by Judith A. Evans
© 2008 Blackwell Publishing Ltd, ISBN: 978-1-4051-5478-9

BLUK139-Evans January 23, 2008 17:27
102 Frozen Food Science and Technology
The twenty-first century poses new challenges for the global frozen food sector, whichcan be summarised as follows:� Although the promising capabilities of several emerging freezing technologies (detailed in
this chapter) attract the attention of researchers and industrialists, many such innovationsremain unimplemented in the common industrial practice.� Both conventional and novel freezing techniques have a substantial potential for fur-ther optimisation by involving advanced modelling and experimental tools and enrichingtheoretical understanding of underlying phenomena (e.g. heat transfer, fluid flow andbiochemical processes).� The manufacture of frozen commodities and related scientific research are still insuffi-ciently attractive for high-skilled experts and young specialists as compared with hi-techbranches (e.g. information technologies, electronics, communications, biotechnologies,etc.).� Developing countries around the world need more refrigeration capacities and inexpensivefood freezing equipment to make their economies more competitive on the global markets.
Simultaneously, the high reputation of freezing as one of the safest and most nutritionallyvaluable preservation techniques should not create a false sense of total security and shouldnot defeat the care and diligence when managing the frozen supply chain (IIR, 1986, 1999;Kennedy, 2000). While freezing drastically reduces detrimental phenomena in foods, a num-ber of physical and biochemical reactions still occur and are accentuated if proper processingand handling conditions are not maintained throughout the entire chain for production, stor-age, transport, distribution, retail and household handling of various frozen commodities ofplant or animal origin by using an integral farm-to-table approach.
Contemporary food industry promotes research and innovations, which primarily dealwith the sustainable processing, preservation and supply of safe, high-quality, healthier foodsand beverages for the consumers. In that context, food-freezing technologies are a crucialand underexploited element of the sustainable food production and preservation and relatedfood chain management. This importance perceptibly increases as a result of the ongoingextension of traditional food chains into new markets and emerging economies around theworld. Essential measures should, therefore, be undertaken to raise professional competenceand encourage a stronger public commitment to food freezing investigations. It is vital to makepublic authorities and food policy makers more aware of the topical professional endeavoursof refrigeration scientists and industrialists around the world. Relevant funding agencies(such as the European Commission) supported, therefore, a number of successful freezing-related research projects whose deliverables and industrial implementation result in reducedpost-harvest losses, extended shelf-life and better quality of frozen foods, lower investmentsand running costs, higher energy savings, and enhanced environmental friendliness (Fikiin,2003).
5.2 STATE OF THE ART AND CONVENTIONALFREEZING MODES
In the early twentieth century, many people were experimenting with mechanical and chemicalmethods to preserve food. As an industrial process, quick freezing began its history nearly80 years ago when Clarence Birdseye found a way to flash-freeze foods and deliver them

BLUK139-Evans January 23, 2008 17:27
Emerging and Novel Freezing Processes 103
Cell
Cell membrane
Natural Cells Crystallisation and Water Migrationduring Freezing
After Quick Freezing
Less damaged tissue with maintained integrity
After Slow Freezing
Shrunk cells and destructed tissue
Ice crystalsWater flux
Fig. 5.1 Crucial impact of freezing rate on the end product quality (Fikiin, 2003).
to the public – one of the most important steps forward ever taken in the food industry.During his stay on the Arctic, Birdseye observed that the combination of ice, wind and lowtemperature almost instantly froze just-caught fish. More importantly, he also found thatwhen such quick-frozen fish were cooked and eaten, they were scarcely different in taste andtexture from how they would have been if fresh. After years of work, Birdseye invented asystem that packed dressed fish, meat or vegetables into waxed-cardboard cartons, which wereflash-frozen under pressure (US Patent No. 1,773,079, 1930). Then, he turned to marketingand a number of ventures have been initiated to manufacture, transport and sell frozen foods(e.g. construction of double-plate freezers and grocery display cases; lease of refrigeratedboxcars for railway transport; and retail of frozen products in Springfield, Massachusetts,in 1930). These technology achievements constituted the world’s first cold chain for frozenfoods (Fikiin, 2003).
Thus, quick freezing has further been adopted as a widespread commercial method forlong-term preservation of perishable foods, which improved both the health and convenienceof virtually everyone in the industrialised countries. Freezing rate affects strongly the qualityof frozen foods, in which the predominant water content should quickly be frozen in a fine-grain crystal structure in order to prevent the cellular tissues and to inhibit rapidly the spoilingmicrobiologic and enzymatic processes (Fig. 5.1).
Basic heat transfer considerations (Fikiin, 2003) clearly suggest that the desired shorteningof freezing duration and a resulting high throughput of refrigerating equipment could beachieved by means of: (i) lower refrigerating medium temperature (which generally requiresgreater investment and running costs for the refrigeration machines to be employed); (ii)enhanced surface heat transfer coefficients (by increased refrigerating medium velocity andboundary layer turbulence, involvement of surface phase-change effects and less packaging);

BLUK139-Evans January 23, 2008 17:27
104 Frozen Food Science and Technology
Evaporator plates
Product to be frozen
Expansion valve
Condenser
Compressor
HydrauliccylinderWelding flange
unionPressureplate
Freezerplate
Spacer
Liftingbolt
Freezer Plates
Frame
Plateangle
Hose
Refrigerantheader Oil purge valve
(both headers)
(a)
(b)
(d)
(c)
(e)
Fig. 5.2 Multi-plate freezing systems.
and (iii) reduced size of the refrigerated objects (by freezing small products individually orappropriately cutting the large ones into minor pieces).
As detailed in Chapters 4 and 6–8, air-blast and multi-plate freezers are most widespread,while air fluidising systems are used for IQF of small products (Figs. 5.2, 5.3 and 5.5). Theapplication of cryogenic IQF (Fig. 5.4) is still very restricted because of the high price of theliquefied gases used.
5.2.1 Fluidised-bed freezing systems
The air fluidisation (Fig. 5.5) was studied extensively and used commercially, with an in-creasing popularity, during the last 50 years (Fikiin et al., 1965, 1966, 1970; Fikiin, 1969,1979, 1980). This freezing principle possesses many attractive features, including:� High freezing rate due to the small sizes and thermal resistance of the IQF products,
great overall heat transfer surface of the fluidised foods and high surface heat transfercoefficients.

BLUK139-Evans January 23, 2008 17:27
Emerging and Novel Freezing Processes 105
TunnelFreezers
Spiral Freezers
(a)
(b)
Fig. 5.3 Air-blast freezing systems.� Good quality of the frozen products that have an attractive appearance and do not sticktogether.� Continuity and possibilities for complete automation of the freezing process.
In spite of these advantages the fluidisation freezing by air has some drawbacks, such as:� Necessity of two-stage refrigerating plants (using large quantities of CFC-, HCFC- orHFC-based refrigerants with significant ozone depletion or global warming potentials) tomaintain an evaporation temperature of about −45◦C, which needs high investment andpower costs.
Liquid nitrogen spraying
Immersion in liquid nitrogen
(a)
(b)
Fig. 5.4 Cryogenic freezing systems.

BLUK139-Evans January 23, 2008 17:27
106 Frozen Food Science and Technology
Fluidized bed
Blowers
Cold air
Air
(a) (b)
(c)
Frozenproduct
out
Fluidised bed
Fig. 5.5 Fluidised-bed freezing systems.� Lower surface heat transfer coefficients and freezing rates in comparison with the immer-sion methods.� Need for a high speed and pressure airflow, which results in a great fan power consumption.� Some moisture losses from the product surface and a rapid frosting of the air coolers,caused by the great temperature differential between the products and the evaporatingrefrigerant.� Excessive sensitivity of the process parameters to the product shape, mass and sizes, whichrequires careful control, specific for every separate food commodity.
5.2.2 Freezing by immersion
The immersion freezing in non-boiling liquid refrigerating media is a well-known methodhaving several important advantages: high heat transfer rate, fine ice crystal system in foods,great throughput, low investments and operational costs (Tressler, 1968; Fleshland andMagnussen, 1990; Lucas and Raoult-Wack, 1998; Fikiin et al., 2001). Immersion applica-tions have been limited because of the uncontrolled solute uptake by the refrigerated productsand operational problems with the immersion liquids (high viscosity at low temperatures,difficulty in maintaining the medium at a definite constant concentration and free from or-ganic contaminants). Recent achievements in the heat and mass transfer, physical chemistry,fluid dynamics and automatic process control make it possible to solve these problems and todevelop advanced innovative immersion IQF systems (Fikiin and Fikiin, 1998, 1999, 2002,2003a, 2003b; Fikiin, 2003).
5.3 INDIVIDUAL QUICK FREEZING OF FOODS BYHYDROFLUIDISATION AND PUMPABLE ICE SLURRIES
The Hydrofluidisation Method (HFM) for fast freezing of foods was suggested and patentedrecently to overcome the drawbacks and to bring together the advantages of both air fluidis-ation and immersion food freezing techniques (Fikiin, 1985, 1992, 1994). The HFM uses a
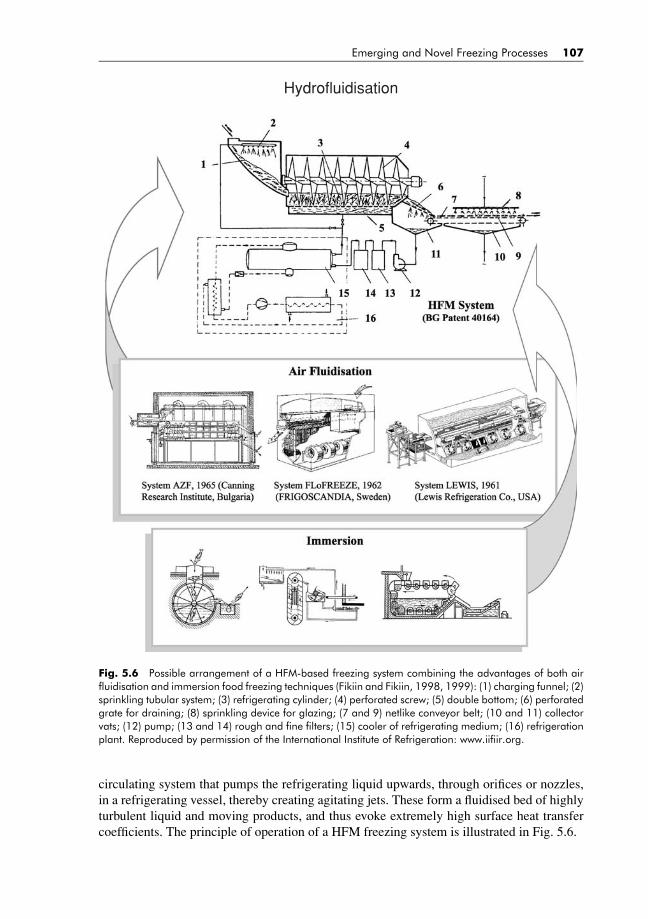
BLUK139-Evans January 23, 2008 17:27
Emerging and Novel Freezing Processes 107
Hydrofluidisation
Fig. 5.6 Possible arrangement of a HFM-based freezing system combining the advantages of both airfluidisation and immersion food freezing techniques (Fikiin and Fikiin, 1998, 1999): (1) charging funnel; (2)sprinkling tubular system; (3) refrigerating cylinder; (4) perforated screw; (5) double bottom; (6) perforatedgrate for draining; (8) sprinkling device for glazing; (7 and 9) netlike conveyor belt; (10 and 11) collectorvats; (12) pump; (13 and 14) rough and fine filters; (15) cooler of refrigerating medium; (16) refrigerationplant. Reproduced by permission of the International Institute of Refrigeration: www.iifiir.org.
circulating system that pumps the refrigerating liquid upwards, through orifices or nozzles,in a refrigerating vessel, thereby creating agitating jets. These form a fluidised bed of highlyturbulent liquid and moving products, and thus evoke extremely high surface heat transfercoefficients. The principle of operation of a HFM freezing system is illustrated in Fig. 5.6.
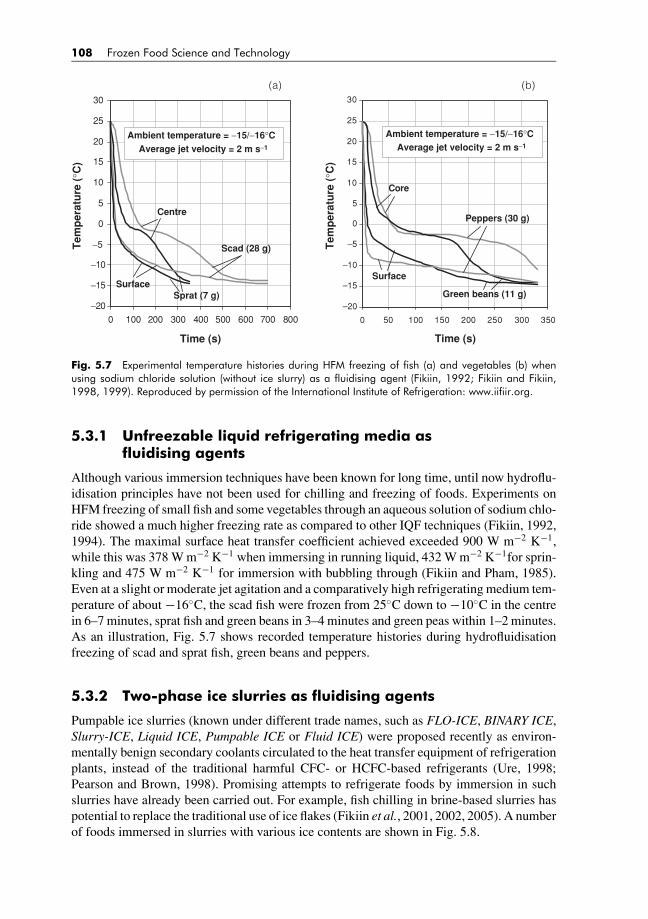
BLUK139-Evans January 23, 2008 17:27
108 Frozen Food Science and Technology
−20
−15
−10
−5
0
5
10
15
20
25
30
0 50 100 150 200 250 300 350
Time (s)
Ambient temperature = −15/−16°CAverage jet velocity = 2 m s−1
Core
Surface
Green beans (11 g)
Peppers (30 g)
−20
−15
−10
−5
0
5
10
15
20
25
30
0 100 200 300 400 500 600 700 800
Time (s)
Tem
per
atu
re (
°C)
Tem
per
atu
re (
°C)
Scad (28 g)
Sprat (7 g)
Centre
Surface
Ambient temperature = −15/−16°CAverage jet velocity = 2 m s−1
(a) (b)
Fig. 5.7 Experimental temperature histories during HFM freezing of fish (a) and vegetables (b) whenusing sodium chloride solution (without ice slurry) as a fluidising agent (Fikiin, 1992; Fikiin and Fikiin,1998, 1999). Reproduced by permission of the International Institute of Refrigeration: www.iifiir.org.
5.3.1 Unfreezable liquid refrigerating media asfluidising agents
Although various immersion techniques have been known for long time, until now hydroflu-idisation principles have not been used for chilling and freezing of foods. Experiments onHFM freezing of small fish and some vegetables through an aqueous solution of sodium chlo-ride showed a much higher freezing rate as compared to other IQF techniques (Fikiin, 1992,1994). The maximal surface heat transfer coefficient achieved exceeded 900 W m−2 K−1,while this was 378 W m−2 K−1 when immersing in running liquid, 432 W m−2 K−1for sprin-kling and 475 W m−2 K−1 for immersion with bubbling through (Fikiin and Pham, 1985).Even at a slight or moderate jet agitation and a comparatively high refrigerating medium tem-perature of about −16◦C, the scad fish were frozen from 25◦C down to −10◦C in the centrein 6–7 minutes, sprat fish and green beans in 3–4 minutes and green peas within 1–2 minutes.As an illustration, Fig. 5.7 shows recorded temperature histories during hydrofluidisationfreezing of scad and sprat fish, green beans and peppers.
5.3.2 Two-phase ice slurries as fluidising agents
Pumpable ice slurries (known under different trade names, such as FLO-ICE, BINARY ICE,Slurry-ICE, Liquid ICE, Pumpable ICE or Fluid ICE) were proposed recently as environ-mentally benign secondary coolants circulated to the heat transfer equipment of refrigerationplants, instead of the traditional harmful CFC- or HCFC-based refrigerants (Ure, 1998;Pearson and Brown, 1998). Promising attempts to refrigerate foods by immersion in suchslurries have already been carried out. For example, fish chilling in brine-based slurries haspotential to replace the traditional use of ice flakes (Fikiin et al., 2001, 2002, 2005). A numberof foods immersed in slurries with various ice contents are shown in Fig. 5.8.

BLUK139-Evans January 23, 2008 17:27
Emerging and Novel Freezing Processes 109
(a)
(d) (e) (f)
(b) (c)
Fig. 5.8 Different foods immersed in slurries with various ice concentrations: (a) fruits; (b) vegetables; (c)chickens; (d), (e) and (f) fish (Fikiin et al., 2002). Reproduced by permission of the International Institute ofRefrigeration: www.iifiir.org.
Fikiin and Fikiin (1998, 1999) proposed, therefore, a novel method to enhance the advan-tages of the hydrofluidisation (described hereafter) by employing two-phase ice suspensionsas fluidising media. The ice slurries reveal a great energy potential as HFM refrigeratingmedia whose minute ice particles absorb latent heat when thawing on the product surface.Hence, the goal of the ice slurry involvement is to provide an enormously high surface heattransfer coefficient (of the order of 1000–2000 W m−2 K−1 or more), excessively short freez-ing time and uniform temperature distribution in the whole volume of the freezing apparatus.The combination of the HFM with the high heat transfer efficiency of the ice-slurry-based re-frigerating media represents a new interdisciplinary research field whose development wouldadvance essentially the refrigerated processing of foods. The HFM freezing with ice slur-ries can acquire a process rate approaching that of the cryogenic flash freezing modes. Forinstance, at a refrigerating ice-slurry temperature of −25◦C and a heat transfer coefficientof 1000 W m−2 K−1, strawberries, apricots and plums can be frozen from 25◦C down to anaverage final temperature of −18◦C within 8–9 minutes, raspberries, cherries and morelloswithin 1.5–3 minutes, and green peas, blueberries and cranberries within approximately 1minute only. The general layout of an ice-slurry-based system for hydrofluidisation freezingis shown in Fig. 5.9.
5.3.3 Advantages of the hydrofluidisation freezing
As described above, the novelty of the hydrofluidisation method lies in the involvement ofunfreezable liquids or pumpable ice slurries as fluidising agents. It is well known that theimmersion freezing history began with use of brines to freeze fish, vegetables and meat. Binaryor ternary aqueous solutions containing soluble carbohydrates (e.g. sucrose, invert sugar,glucose (dextrose), fructose and other mono- and disaccharides) with additions of ethanol,salts, glycerol, etc., have been studied as possible immersion media. There are practicallyunlimited possibilities to combine constituents and to formulate appropriate multi-componentHFM refrigerating media based on one-phase liquids or two-phase ice slurries, which have
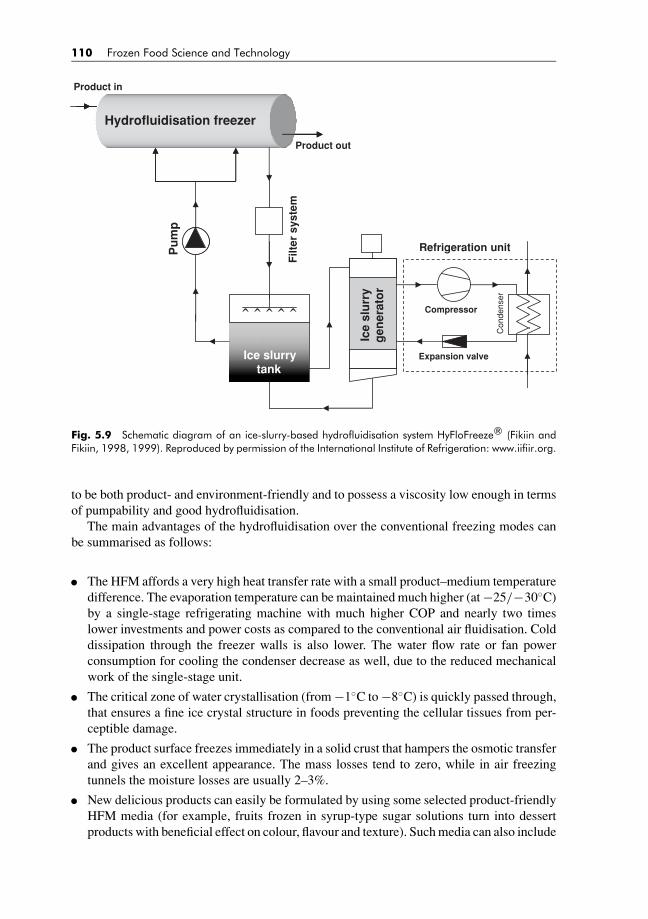
BLUK139-Evans January 23, 2008 17:27
110 Frozen Food Science and Technology
Hydrofluidisation freezer
Product out
Product in
Filt
er s
yste
m
Pu
mp
Ice slurrytank
Ice
slu
rry
gen
erat
or
Compressor
Expansion valve
Refrigeration unit
Con
dens
er
Fig. 5.9 Schematic diagram of an ice-slurry-based hydrofluidisation system HyFloFreeze® (Fikiin andFikiin, 1998, 1999). Reproduced by permission of the International Institute of Refrigeration: www.iifiir.org.
to be both product- and environment-friendly and to possess a viscosity low enough in termsof pumpability and good hydrofluidisation.
The main advantages of the hydrofluidisation over the conventional freezing modes canbe summarised as follows:� The HFM affords a very high heat transfer rate with a small product–medium temperature
difference. The evaporation temperature can be maintained much higher (at −25/−30◦C)by a single-stage refrigerating machine with much higher COP and nearly two timeslower investments and power costs as compared to the conventional air fluidisation. Colddissipation through the freezer walls is also lower. The water flow rate or fan powerconsumption for cooling the condenser decrease as well, due to the reduced mechanicalwork of the single-stage unit.� The critical zone of water crystallisation (from −1◦C to −8◦C) is quickly passed through,that ensures a fine ice crystal structure in foods preventing the cellular tissues from per-ceptible damage.� The product surface freezes immediately in a solid crust that hampers the osmotic transferand gives an excellent appearance. The mass losses tend to zero, while in air freezingtunnels the moisture losses are usually 2–3%.� New delicious products can easily be formulated by using some selected product-friendlyHFM media (for example, fruits frozen in syrup-type sugar solutions turn into dessertproducts with beneficial effect on colour, flavour and texture). Such media can also include
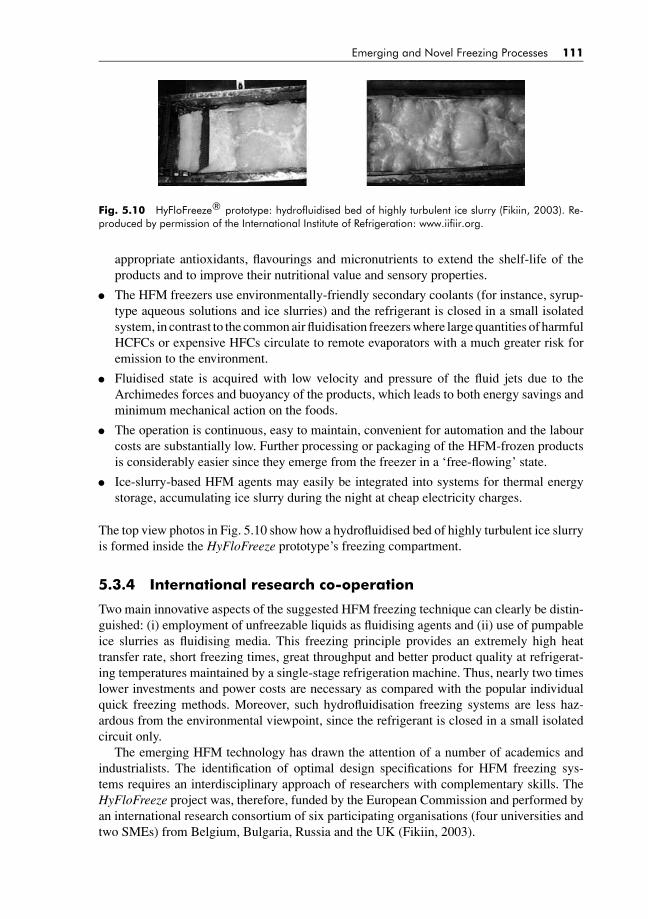
BLUK139-Evans January 23, 2008 17:27
Emerging and Novel Freezing Processes 111
Fig. 5.10 HyFloFreeze® prototype: hydrofluidised bed of highly turbulent ice slurry (Fikiin, 2003). Re-produced by permission of the International Institute of Refrigeration: www.iifiir.org.
appropriate antioxidants, flavourings and micronutrients to extend the shelf-life of theproducts and to improve their nutritional value and sensory properties.� The HFM freezers use environmentally-friendly secondary coolants (for instance, syrup-type aqueous solutions and ice slurries) and the refrigerant is closed in a small isolatedsystem, in contrast to the common air fluidisation freezers where large quantities of harmfulHCFCs or expensive HFCs circulate to remote evaporators with a much greater risk foremission to the environment.� Fluidised state is acquired with low velocity and pressure of the fluid jets due to theArchimedes forces and buoyancy of the products, which leads to both energy savings andminimum mechanical action on the foods.� The operation is continuous, easy to maintain, convenient for automation and the labourcosts are substantially low. Further processing or packaging of the HFM-frozen productsis considerably easier since they emerge from the freezer in a ‘free-flowing’ state.� Ice-slurry-based HFM agents may easily be integrated into systems for thermal energystorage, accumulating ice slurry during the night at cheap electricity charges.
The top view photos in Fig. 5.10 show how a hydrofluidised bed of highly turbulent ice slurryis formed inside the HyFloFreeze prototype’s freezing compartment.
5.3.4 International research co-operation
Two main innovative aspects of the suggested HFM freezing technique can clearly be distin-guished: (i) employment of unfreezable liquids as fluidising agents and (ii) use of pumpableice slurries as fluidising media. This freezing principle provides an extremely high heattransfer rate, short freezing times, great throughput and better product quality at refrigerat-ing temperatures maintained by a single-stage refrigeration machine. Thus, nearly two timeslower investments and power costs are necessary as compared with the popular individualquick freezing methods. Moreover, such hydrofluidisation freezing systems are less haz-ardous from the environmental viewpoint, since the refrigerant is closed in a small isolatedcircuit only.
The emerging HFM technology has drawn the attention of a number of academics andindustrialists. The identification of optimal design specifications for HFM freezing sys-tems requires an interdisciplinary approach of researchers with complementary skills. TheHyFloFreeze project was, therefore, funded by the European Commission and performed byan international research consortium of six participating organisations (four universities andtwo SMEs) from Belgium, Bulgaria, Russia and the UK (Fikiin, 2003).
BLUK139-Evans January 23, 2008 17:27
112 Frozen Food Science and Technology
5.4 HIGH-PRESSURE FREEZING
Non-thermal food processing techniques (e.g. pulse-electric field pasteurisation, high-intensity pulsed lights, high-intensity pulsed-magnetic field, ozone treatment) are presentlyregarded with special interest by the food industry. Among them, high-pressure processingis gaining in popularity with food processors because of its food preservation capability andpotential to achieve interesting functional effects. Under high pressure pathogenic micro-organisms can be inactivated with minimal heat treatment, which results in almost completeretention of nutritional and sensory characteristics of fresh foods, without sacrificing theirshelf-life. Other advantages over traditional thermal processing include reduced processtimes; minimal heat damage problems; retention of freshness, flavour, texture, and colour;lack of vitamin C loss and tangible changes in food during pressure-shift freezing (due toreduced crystal size and multiple ice-phase forms); and minimal undesirable functionalityalterations. However, the spore inactivation is a major challenge as methods for full inacti-vation of spores under pressure are yet to be developed. Hence, another group of researchactivities worldwide focus on different techniques for treatment of foods by high hydrostaticpressure, including high-pressure-aided freezing and thawing.
A number of products (such as jams and fruit juices) have been processed under highpressure in Japan. There have been 10–15 types of pressurised foods on the Japanese marketbut several have recently disappeared, while the remaining ones are too specific to excitea substantial commercial interest. Examples of pressurised products in Europe and US are:(i) orange juice (Pernod Ricard Company, France); (ii) acidified avocado puree (AvomexCompany, USA and Mexico); and (iii) sliced ham (Espuna Company, Spain). Volumes pro-duced are still very small and some current European food regulations slowed down thelaunching of new pressurised products because of legislative problems.
The so-called cryofixation is a physical method for immobilisation of biological materi-als by ultra-quick freezing. Unlike the chemical fixation, it preserves thoroughly the ultra-structural morphology, much closer to the natural state of the cell tissue. This results in fastpreservation of morphological details without artificial damage, less cross-linking of proteinsby aldehyde fixation and reduced masking of the antigenic sites. The water phase diagram(Fig. 5.11) shows that at atmospheric pressure crystalline ice will build up at around 0◦Cand this water crystallisation leads to some rupture of the biological structures (Fig. 5.1).The cryofixation aims, therefore, to avoid such crystallisation-caused damages. At very highfreezing rates particles and large molecules in water serve as cores for a heterogeneous nu-cleation, i.e. water becomes solid in a vitreous state and does not show a crystalline structure.The necessary freezing rates can only be achieved for very thin layers of 5–25 μm duringfreezing at atmospheric pressure. This restriction could be overcome through a depressionof the initial freezing (cryoscopic) point of water by adding chemical cryoprotectants or byincreasing the ambient pressure. At a pressure of 200 MPa the freezing point drops to about−22◦C (see Fig. 5.11), which enables a depth of vitrification of about 200 μm, so that objectswith a thickness of up to 0.4–0.6 mm could be well frozen.
Consequently, the main promising features of high-pressure freezing are as follows:� Freezing point depression and reduced latent heat of phase change;� Short freezing times and resulting benefits (e.g. microcrystalline or vitreous ice);� Inactivation of micro-organisms and enzymes, and structure modifications with no essen-tial changes of nutritional and sensory quality.

BLUK139-Evans January 23, 2008 17:27
Emerging and Novel Freezing Processes 113
Liquid
Ice IIce III
Ice II
Ice V
Pressure (MPa)
Tem
pera
ture
(°C
)
0
10
0
−10
−20
−30100 200 300 400 500
A B C K
H
D
G
I
E
F
Fig. 5.11 Illustrates various paths of changing the food physical state by external manipulations oftemperature or pressure, while Figs. 5.12 and 5.13 show temperature- and pressure-dependent thermalproperties of potatoes during pressure-assisted freezing (Schluter et al., 2000).
Water phase diagram and high pressure effects on the phase transitions:A – B – C – D – C – B – A Subzero storage without freezingA – B – H – I Pressure-assisted1 freezingI – H – B – A Pressure-assisted1 thawingA – B – C – D – E Pressure-shift2 freezingE – D – C – B – A Pressure-induced3 thawingA – B – C – D – G – F Freezing to ice IIIF – G – D – C – B – A Thawing of ice IIIA – B – C – K – ice VI Freezing above 0◦C
1 assisted: phase transition at constant pressure2 shift: phase transition due to pressure change3 induced: phase transition initiated with pressure change and continued at constant pressureReproduced by permission of the International Institute of Refrigeration: www.iifiir.org
The future will reveal soon whether the current achievements in this field are more likely tostay in the laboratories or they could be implemented as a common industrial practice.
5.5 MAGNETIC RESONANCE FREEZING
As already discussed, the conventional refrigeration equipment provides freezing rates which,as a rule, are insufficient to eliminate completely undesirable water migration and masstransfer within a food product undergoing freezing. Realising this circumstance, researchersdecided that if water could somehow be retained within the cells while freezing, then thecells would not become dehydrated and foodstuff could keep its original attributes and fresh-ness. A system for magnetic resonance freezing (MRF) preventing such cellular dehydrationcould be regarded as composed of a common freezer and a special magnetic resonance de-vice. The MRF process (Fig. 5.14) is then applied with the following two steps (Mohanty,2001).
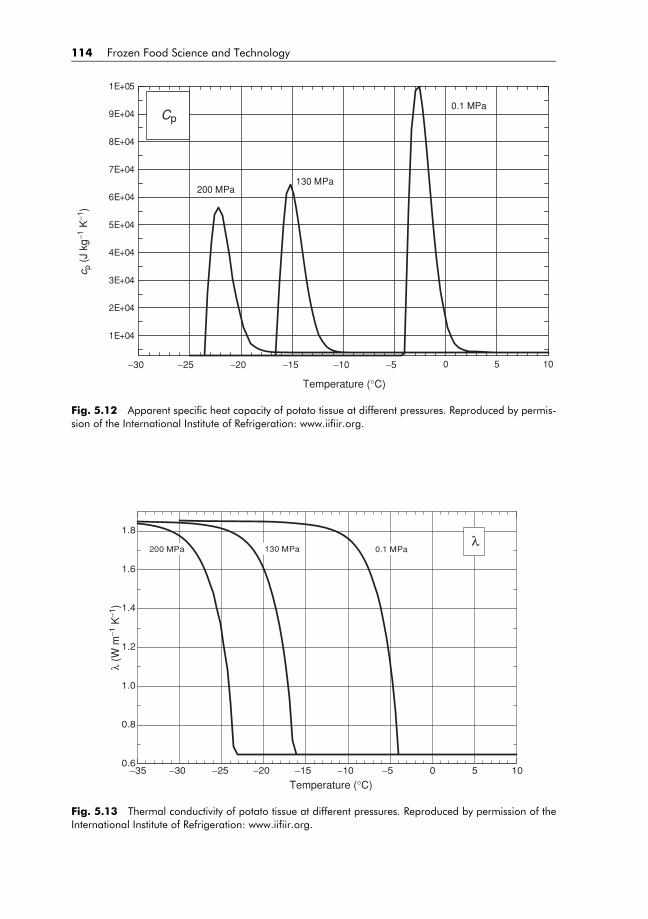
BLUK139-Evans January 23, 2008 17:27
114 Frozen Food Science and Technology
1E+04
2E+04
3E+04
4E+04
5E+04
6E+04
7E+04
8E+04
9E+04
1E+05
−30 −25 −20 −15 −10 −5 0 5 10
Cp0.1 MPa
130 MPa200 MPa
Temperature (°C)
c p (
J kg
−1 K
−1)
Fig. 5.12 Apparent specific heat capacity of potato tissue at different pressures. Reproduced by permis-sion of the International Institute of Refrigeration: www.iifiir.org.
0.6
0.8
1.0
1.2
1.4
1.6
1.8
−35 −30 −25 −20 −15 −10 −5 0 5 10
λ0.1 MPa130 MPa200 MPa
Temperature (°C)
λ (W
m−1
K−1
)
Fig. 5.13 Thermal conductivity of potato tissue at different pressures. Reproduced by permission of theInternational Institute of Refrigeration: www.iifiir.org.
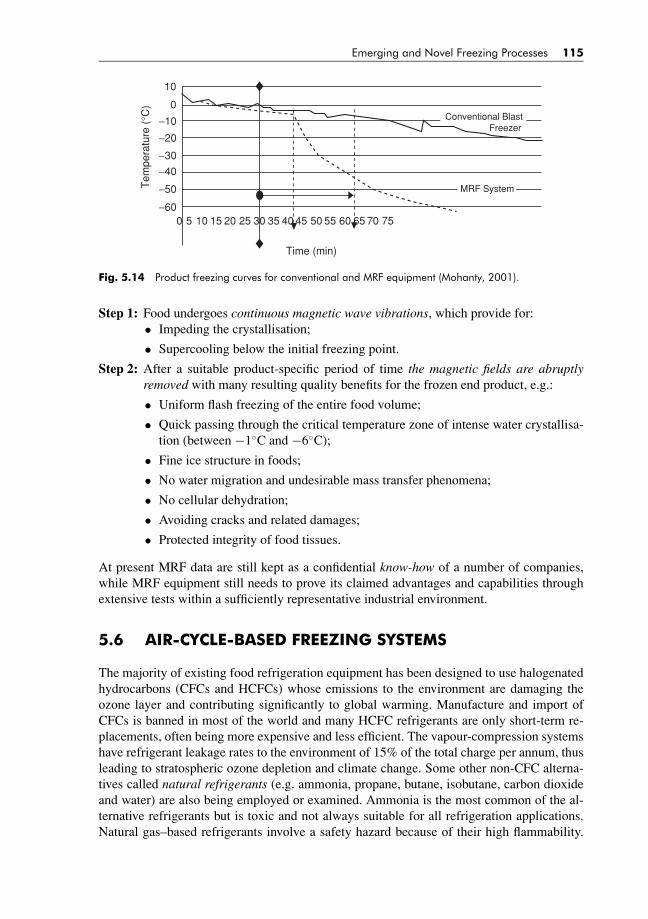
BLUK139-Evans January 23, 2008 17:27
Emerging and Novel Freezing Processes 115
0 5 10 15 20 25 30 35 40 45 50 55 60 65 70 75
Time (min)
Conventional Blast Freezer
MRF System
10
0
−10
−20
−30
−40
−50
−60
Tem
pera
ture
(°C
)
Fig. 5.14 Product freezing curves for conventional and MRF equipment (Mohanty, 2001).
Step 1: Food undergoes continuous magnetic wave vibrations, which provide for:• Impeding the crystallisation;
• Supercooling below the initial freezing point.
Step 2: After a suitable product-specific period of time the magnetic fields are abruptlyremoved with many resulting quality benefits for the frozen end product, e.g.:
• Uniform flash freezing of the entire food volume;
• Quick passing through the critical temperature zone of intense water crystallisa-tion (between −1◦C and −6◦C);
• Fine ice structure in foods;
• No water migration and undesirable mass transfer phenomena;
• No cellular dehydration;
• Avoiding cracks and related damages;
• Protected integrity of food tissues.
At present MRF data are still kept as a confidential know-how of a number of companies,while MRF equipment still needs to prove its claimed advantages and capabilities throughextensive tests within a sufficiently representative industrial environment.
5.6 AIR-CYCLE-BASED FREEZING SYSTEMS
The majority of existing food refrigeration equipment has been designed to use halogenatedhydrocarbons (CFCs and HCFCs) whose emissions to the environment are damaging theozone layer and contributing significantly to global warming. Manufacture and import ofCFCs is banned in most of the world and many HCFC refrigerants are only short-term re-placements, often being more expensive and less efficient. The vapour-compression systemshave refrigerant leakage rates to the environment of 15% of the total charge per annum, thusleading to stratospheric ozone depletion and climate change. Some other non-CFC alterna-tives called natural refrigerants (e.g. ammonia, propane, butane, isobutane, carbon dioxideand water) are also being employed or examined. Ammonia is the most common of the al-ternative refrigerants but is toxic and not always suitable for all refrigeration applications.Natural gas–based refrigerants involve a safety hazard because of their high flammability.

BLUK139-Evans January 23, 2008 17:27
116 Frozen Food Science and Technology
Q
S Q
T
Work
P1
P2
1
2
3
41
23
4
Fig. 5.15 The Air Cycle on a T–S (Temperature–Entropy) diagram and shown diagrammatically.
Transcritical CO2 cycles needs high pressures and complicated equipment. As a rule,important modifications to the existing refrigerating plants are required to introduce greentechnologies in the food refrigeration sector.
The principle of the air cycle is that when air is compressed its temperature and pressureincrease (1–2) as shown in Fig. 5.15. Heat is removed from the compressed air at constantpressure and its temperature is reduced (2–3). Air is then expanded and its temperaturedecreases (3–4). The air further absorbs heat (gaining temperature) from the process atconstant pressure (4–1) where it starts the cycle again (Evans et al., 2005).
Air-cycle refrigeration is an environmentally friendly alternative to the conventionalvapour-compression systems. Originally used in the nineteenth century, the technology em-ployed slow-speed reciprocating compressors and low-efficiency expanders. The poor en-ergy efficiency and comparatively high cost of such machinery was a major factor for thereplacement of these systems with vapour-compression equipment. However, the remarkableprogress in turbine technology since that time (Horlock, 2003), along with the developmentof air bearings and ceramic components, provided dramatic improvements in efficiency. Theair-cycle use for aircraft and railway carriage air-conditioning (which affords equipmentsimplicity, compactness and robustness) and the development of high-speed rotary compres-sors and expanders have greatly improved the cycle performance and reliability (Fig. 5.16).
BootstrapHot air heatexchanger
Motor Poweredcompressor
Expansionturbine Cold air heat
exchanger
Fig. 5.16 An air-cycle unit for automotive applications (Normalair-Garrett Ltd.)

BLUK139-Evans January 23, 2008 17:27
Emerging and Novel Freezing Processes 117
Combining this with newly available compact heat exchangers with highly enhanced heattransfer characteristics makes competition with existing vapour-compression systems ratherattractive.
Air-cycle systems could be viable for many industrial applications (Gigiel et al., 1996;Van Gerwen and Verschoor; 1996; Verschoor, 2001). An air-cycle system can simultaneouslyproduce both heat and cold, the advantage being that heating is provided at higher temperaturesas compared to the conventional vapour-cycle heat-pump system. Frequency control of themotor speed permits a smooth variation of the operating capacity depending on the heatloads. On the other hand, mass production techniques make the air systems much cheaperthan they were in the past. Air-cycle refrigeration is one of the most attractive ways forsolving the environmental problems since the working fluid (air) is completely natural, freeand totally environmentally benign. This environmental friendliness, reliability, minimalmaintenance and efficiency can successfully be transferred to the food refrigeration industry(Gigiel et al., 1992; Fikiin et al., 1998; Russell et al., 2001, 2001). The energy efficiency canadditionally be enhanced by combining the air cycle with systems for thermal energy storage.Feasibility studies have shown that such type of equipment may compete (in terms of energyand investment costs) with vapour-compression systems, coupled with conventional waterheating devices (Gigiel et al., 1996; Van Gerwen and Verschoor, 1996).
Both open and closed air-circulation systems can be employed to freeze foods. In theopen cycle atmospheric air normally enters the system and returns to the atmosphere afterbeing used for heating and cooling purposes (Shaw et al., 1995). The air as a refrigerant isin a direct contact with the refrigerated products, avoiding any intermediate heat exchangers,pipelines, secondary coolants and related energy dissipation. However, the running of suchsystems is strongly dependent on the atmospheric conditions, which results in more difficultcontrol. Atmospheric air contains water vapours, which may freeze at low temperatures.Obviously, the open systems also require turbo-machines with oil-free air bearings. In theclosed cycle dry air is circulated around the closed system, similarly to a conventional vapour-compression machine. The advantage of a closed air cycle is that the load on the system canbe matched exactly without any change in the efficiency. This is because the efficiency of therotating machinery used in air-cycle plants depends only on the velocities of the air and notits density. The change of pressure in the system overall results in corresponding changes inthe air density and mass flow. Thus the refrigeration and the heating effects from the air-cycleplant can vary in proportion to the mass flow, without change in the efficiency, in contrast tocommon vapour-compression systems.
Recent developments and improvements in air-cycle equipment enable a wider practi-cal exploitation of this emerging technology for food freezing applications. The benefitsare greater reliability, reduced maintenance, simple and compact design, reduced overalllabour costs, improved control of product quality, along with using an environmentally be-nign and free refrigerant unlike the conventional heating and cooling systems. Fast freezingthrough low-temperature air dramatically reduces freezing times and has many advantages(e.g. flexibility, savings in freezer footprint and higher product quality). With a conventionalvapour-compression plant, freezing is limited to refrigerating air temperatures above −40◦C.Freezing at lower refrigerating temperatures is limited to cryogens, such as nitrogen or carbondioxide that are expensive throw away liquefied gases. The primary reason for using an aircycle in food freezing is that it can greatly increase the range of operating conditions available(Evans et al., 2005). Lower refrigerating temperatures result in faster freezing, improved foodquality and either reduced freezer size or larger throughput through an existing freezer (if thenecessary refrigeration capacity is duly provided).
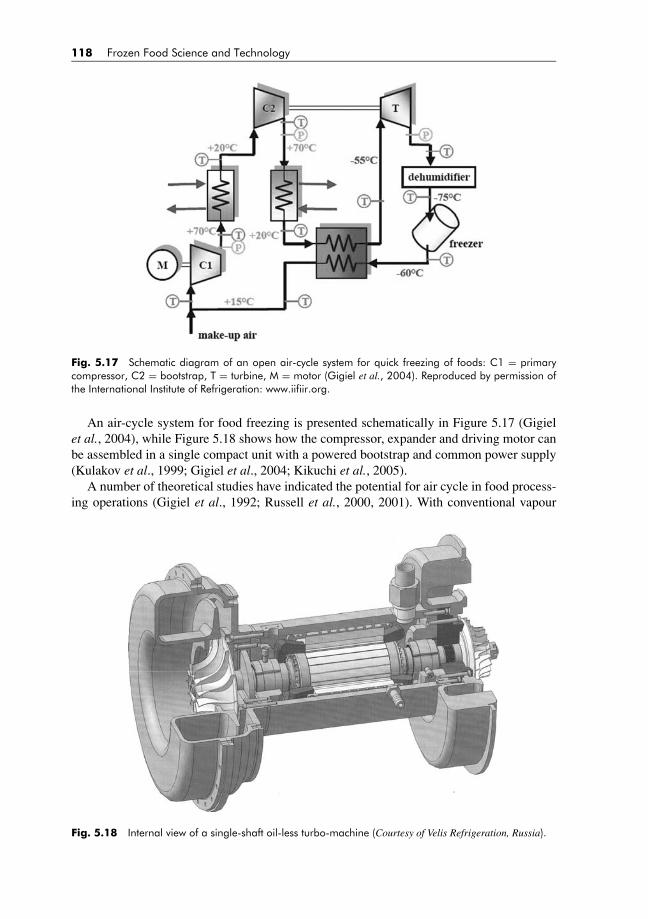
BLUK139-Evans January 23, 2008 17:27
118 Frozen Food Science and Technology
Fig. 5.17 Schematic diagram of an open air-cycle system for quick freezing of foods: C1 = primarycompressor, C2 = bootstrap, T = turbine, M = motor (Gigiel et al., 2004). Reproduced by permission ofthe International Institute of Refrigeration: www.iifiir.org.
An air-cycle system for food freezing is presented schematically in Figure 5.17 (Gigielet al., 2004), while Figure 5.18 shows how the compressor, expander and driving motor canbe assembled in a single compact unit with a powered bootstrap and common power supply(Kulakov et al., 1999; Gigiel et al., 2004; Kikuchi et al., 2005).
A number of theoretical studies have indicated the potential for air cycle in food process-ing operations (Gigiel et al., 1992; Russell et al., 2000, 2001). With conventional vapour
Fig. 5.18 Internal view of a single-shaft oil-less turbo-machine (Courtesy of Velis Refrigeration, Russia).
BLUK139-Evans January 23, 2008 17:27
Emerging and Novel Freezing Processes 119
compression plant the refrigerating air temperature ranges between ambient and −40◦C.With air cycle, there is no limit on the cold side temperature above the liquefaction pointand therefore the processes can be designed to suit the food and not the available equipment(Evans et al., 2005). Theoretically, air temperatures up to 300◦C on the hot side can also beobtained at the same time, suitable for direct cooking or the production of steam.
The established public opinion is that the air-cycle is inefficient as it has a low COP.It is fairly mentioned in almost every manual, that air-cycle possesses low thermodynamicefficiency when using it solely for cooling within a temperature range common for thecommercial food refrigeration. Nevertheless, thermodynamic evidence shows (Kulakov et al.,1999) that air-cycle refrigeration may reach or exceed the performance of vapour-compressionsystems in two practically valuable cases: (i) at low refrigerating temperatures (approachingor falling within the cryogenic range), and (ii) when using the air cycle for both coolingand heating, i.e. as a heat pump. In the 1940s Peter Kapitza (Nobel Laureate in physics)introduced for the first-time turbo-technologies for mass production of liquid oxygen at lowpressures. His enemies subjected him to malicious attacks at a governmental level becausethis process has been energy inefficient as compared to common high-pressure cryogeniccycles. However, because of the mass production technologies and the lack of breakdowns,the ‘energy inefficient’ Kapitza process proved to have much higher economic efficiencythan alternative cycles (efficient in terms of running costs only). Remarkable progress hasrecently been achieved as advanced turbo-technologies lie in the basis of the modern powergeneration and aeronautics – major players, such as Rolls Royce and Boeing, are continuouslygenerating new knowledge in the field (Horlock, 2003).
Consequently, air-cycle food freezing has no intrinsic detrimental ozone depletion andglobal warming effects. Air cycle is capable of operating at low refrigerating temperatures(close to the cryogenic range), where it outperforms conventional vapour-compression sys-tems (efficient above −40◦C) and CO2-based systems (used above −54◦C). Furthermore, thehigh-velocity airflow exiting the turbo-expander can directly be impinged on the food, therebyensuring high heat transfer coefficients (over 140 W m−2 K−1). Thus, along with enhancedair-blast freezing, an open cycle can perfectly serve to freeze foods by air-cycle-based fluidis-ation or air impingement, both associated with high process rates and substantially improvedquality of the end product.
5.7 OTHER UNCONVENTIONAL FREEZING METHODS ANDCONCLUDING REMARKS
Alongside the emerging and novel freezing techniques mentioned in this chapter (e.g. hy-drofluidisation; immersion freezing with smart agitation modes; application of ice slurries orair impingement; air-cycle-based freezing; flash-freezing cryogenic methods; high-pressureshift freezing and magnetic resonance freezing), a number of promising freezing processinnovations have also been launched (such as ultrasonic freezing, dehydrofreezing, use ofantifreezes and ice nucleation proteins; freeze drying, partial freezing, vacuum and heat pipeapplications; solar, thermionic; magnetocaloric, electrocaloric and thermoacoustic refriger-ation). Some of these freezing principles are presently small scale only and still unlikely tobe implemented for commercial refrigeration in a short-term perspective.
Novel technologies with long-term implementation perspective include magnetic andacoustic Stirling refrigeration. Magnetic refrigeration is based on the magnetocaloric effect
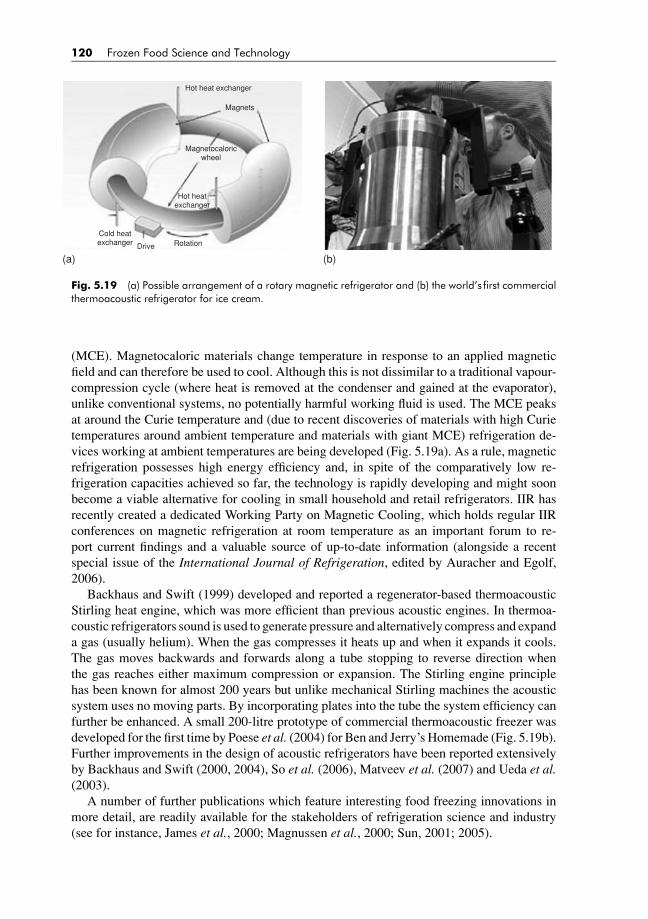
BLUK139-Evans January 23, 2008 17:27
120 Frozen Food Science and Technology
Hot heat exchanger
Magnets
Magnetocaloricwheel
Hot heatexchanger
Cold heatexchanger Drive Rotation
(a) (b)
Fig. 5.19 (a) Possible arrangement of a rotary magnetic refrigerator and (b) the world’s first commercialthermoacoustic refrigerator for ice cream.
(MCE). Magnetocaloric materials change temperature in response to an applied magneticfield and can therefore be used to cool. Although this is not dissimilar to a traditional vapour-compression cycle (where heat is removed at the condenser and gained at the evaporator),unlike conventional systems, no potentially harmful working fluid is used. The MCE peaksat around the Curie temperature and (due to recent discoveries of materials with high Curietemperatures around ambient temperature and materials with giant MCE) refrigeration de-vices working at ambient temperatures are being developed (Fig. 5.19a). As a rule, magneticrefrigeration possesses high energy efficiency and, in spite of the comparatively low re-frigeration capacities achieved so far, the technology is rapidly developing and might soonbecome a viable alternative for cooling in small household and retail refrigerators. IIR hasrecently created a dedicated Working Party on Magnetic Cooling, which holds regular IIRconferences on magnetic refrigeration at room temperature as an important forum to re-port current findings and a valuable source of up-to-date information (alongside a recentspecial issue of the International Journal of Refrigeration, edited by Auracher and Egolf,2006).
Backhaus and Swift (1999) developed and reported a regenerator-based thermoacousticStirling heat engine, which was more efficient than previous acoustic engines. In thermoa-coustic refrigerators sound is used to generate pressure and alternatively compress and expanda gas (usually helium). When the gas compresses it heats up and when it expands it cools.The gas moves backwards and forwards along a tube stopping to reverse direction whenthe gas reaches either maximum compression or expansion. The Stirling engine principlehas been known for almost 200 years but unlike mechanical Stirling machines the acousticsystem uses no moving parts. By incorporating plates into the tube the system efficiency canfurther be enhanced. A small 200-litre prototype of commercial thermoacoustic freezer wasdeveloped for the first time by Poese et al. (2004) for Ben and Jerry’s Homemade (Fig. 5.19b).Further improvements in the design of acoustic refrigerators have been reported extensivelyby Backhaus and Swift (2000, 2004), So et al. (2006), Matveev et al. (2007) and Ueda et al.(2003).
A number of further publications which feature interesting food freezing innovations inmore detail, are readily available for the stakeholders of refrigeration science and industry(see for instance, James et al., 2000; Magnussen et al., 2000; Sun, 2001; 2005).

BLUK139-Evans January 23, 2008 17:27
Emerging and Novel Freezing Processes 121
ACKNOWLEDGEMENTS
Figures 5.1–5.19 include illustrations of R.P. Singh, O. Schluter, Air Products and Chemi-cals, Advanced Freezers, Frigoscandia, Normalair-Garrett, Food Refrigeration and ProcessEngineering Research Centre, Velis Refrigeration, Pennsylvania State University and AmesLaboratory, whose contribution is gratefully acknowledged.
ACRONYMS
CFC ChlorofluorocarbonCOP Coefficient of performanceFAO Food and Agriculture Organisation of the United NationsHCFC HydrochlorofluorocarbonHFC HydrofluorocarbonHFM Hydrofluidisation methodIIR International Institute of RefrigerationIQF Individual quick freezingMCE Magnetocaloric effectMRF Magnetic resonance freezingSME Small or medium enterpriseWHO World Health Organisation
REFERENCES
Auracher, H. and Egolf, P.W., eds. (2006). Magnetic refrigeration at room temperature. International Journalof Refrigeration 29(8), 1235–1394.
Backhaus, S. and Swift, G.W. (1999). A thermoacoustic Stirling heat engine. Nature 399, 335–338.Backhaus, S. and Swift, G.W. (2000). A thermoacoustic-Stirling heat engine: detailed study. Journal of the
Acoustical Society of America 107(6), 3148–3166.Backhaus, S. and Swift, G.W. (2004). A resonant, self-pumped, circulating thermoacoustic heat exchanger.
Journal of the Acoustical Society of America 116(5), 2923–2938.Evans, J.A., Gigiel, A.J. and Brown, T. (2005). Fast freezing using air cycle technologies. In: Proceedings of
EU Workshop ‘EUROFREEZE 2005: Individual Quick Freezing of Foods’, Sofia (Bulgaria), 13–15 January2005, European Commission.
Fikiin, A.G. (1969). Congelation de fruits et de legumes par fluidisation. Proceedings Budapest Conference,IIF/IIR: pp. 197–203.
Fikiin, A.G. (1979). Bases theoriques du procede de fluidisation lors de l’intensification de la congelationdes fruits et des legumes. Proceedings 15th International Congress Refrigeration, Venice, 4, pp. 221–230.
Fikiin, A.G. (1980). Physical conditions of fluidized-bed freezing of fruits and vegetables. KholodilnayaTekhnika/Refrigeration Engineering, 7, 59–61 (in Russian)
Fikiin, A.G. (1985). Method and system for immersion cooling and freezing of foodstuffs by hydrofluidization.Invention Certificate No. 40164, Bulgarian Patent Agency INRA.
Fikiin, A.G. (1992). New method and fluidized water system for intensive chilling and freezing of fish. FoodControl 3(3), 153–160.
Fikiin, A.G. (1994). Quick freezing of vegetables by hydrofluidization. In: New Applications of Refrigerationto Fruit and Vegetables Processing – Proceedings of IIR Conference, Istanbul (Turkey), RefrigerationScience and Technology, International Institute of Refrigeration, 1994-3, pp. 85–91.
Fikiin, A.G. and Pham, V.H. (1985). System for examination of heat transfer regimes during hydrorefrigerationof foodstuffs. Invention Certificate No. 39749, Bulgarian Patent Agency INRA.

BLUK139-Evans January 23, 2008 17:27
122 Frozen Food Science and Technology
Fikiin, A.G., Ditchev, S.P. and Fikiina, I.K. (1966). Principal parameters characterising the fluidisation offruit and vegetable layers. Kholodilnaya Tekhnika/Refrigeration Engineering 11, 33–37 (in Russian)
Fikiin, A.G., Ditchev, S.P. and Karagerov, D.I. (1965). Fluidized bed freezing system for fruits and vegetableswith various dimensions. Invention Certificate No. 10967, Bulgarian Patent Agency INRA.
Fikiin, A.G., Ditchev, S.P. and Karagerov, D.I. (1970). Fluidized bed freezing apparatus AZF. KholodilnayaTekhnika/Refrigeration Engineering 7, 55–58 (in Russian).
Fikiin, K.A. (2003). Novelties of Food Freezing Research in Europe and Beyond. Flair-Flow Europe SyntheticBrochure for SMEs No.10 (ISBN: 2-7380-1145-4), INRA: Institut National de la Recherche Agronomique,Paris (France), p. 55.
Fikiin, K.A. and Fikiin, A.G. (1998). Individual quick freezing of foods by hydrofluidisation and pumpableice slurries. In: K. Fikiin, ed. Advances in the Refrigeration Systems, Food Technologies and Cold Chain.IIR Proceedings Series ‘Refrigeration Science and Technology’, 1998-6: pp. 319–326 (published also inthe AIRAH Journal, 2001, 55(11), pp. 15–18).
Fikiin, K.A. and Fikiin, A.G. (1999). Novel cost-effective ice-slurry-based technology for individual quickfreezing of foods by hydrofluidisation. CD-Rom Proceedings of the 20th International Congress of Refrig-eration, Sydney (Australia), ICR Paper No. 271.
Fikiin, K.A. and Fikiin, A.G. (2002). Congelacion individual rapida de alimentos por hidrofluidificacion ycompuestos de hielo. Frıo, Calor y Aire Acondicionado (Madrid) 30(334), 22–27.
Fikiin, K.A. and Fikiin, A.G. (2003a). Quick freezing of foods by hydrofluidisation and pumpable ice sus-pensions. Kholodilnaya Tekhnika/Refrigeration Engineering (1), 22–25 (in Russian).
Fikiin, K.A. and Fikiin, A.G. (2003b). L’Ice Slurry (ghiaccio binario) per una surgelazione veloce deglialimenti – Surgelamento singolo degli alimenti mediante idrofluidizzazione. Industria & Formazione peril Tecnico della Refrigerazione e Climatizzazione (Milano) (3), 36–39.
Fikiin, K.A., Fikiin, A.G., Russell, S.L. and Fitt, P.W. (1998). Shelf-life extension of Bulgarian yoghurt byusing a novel environment-friendly air-cycle integrated system for thermal and refrigerated processing. In:Shelf-Life Prediction – Proceedings of the EU COPERNICUS Workshop, Wageningen (the Netherlands),pp. 159–168.
Fikiin, K.A., Kaloyanov, N.G., Filatova, T.A. and Sokolov, V.N. (2002). Fine-crystalline ice slurries as a basisof advanced industrial technologies: state of the art and future prospects. Refrigeration Business (Moscow)(7), 4–11 (in Russian).
Fikiin, K.A., Wang, M.-J., Kauffeld, M. and Hansen, T.M. (2005). Direct contact chilling and freezingof foods in ice slurries – Chapter 9. In: M. Kauffeld, M. Kawaji and P.W. Egolf, eds. Handbookon Ice Slurries – Fundamentals and Engineering. International Institute of Refrigeration, pp. 251–271.
Fikiin, K.A., Tsvetkov, O.B., Laptev, Yu.A., Fikiin, A.G. and Kolodyaznaya, V.S. (2001). Thermophysicaland engineering issues of the immersion freezing of fruits in ice slurries based on sugar-ethanol aqueoussolutions. Proceedings of the Third IIR Workshop on Ice Slurries, Lucerne (Switzerland). InternationalInstitute of Refrigeration, pp. 147–154 (published also in EcoLibrium – Journal of AIRAH: AustralianInstitute of Refrigeration, Air Conditioning and Heating, 2003, 2(7), 10–15).
Fleshland, O. and Magnussen, O. M. (1990). Chilling of farmed fish. Proceedings Aberdeen Conference,IIF/IIR: pp. 185–192.
Gigiel, A.J., Chauveron, S. and Fitt, P. (1992). Air as a replacement for CFC refrigerants. IIR Congress ‘Cold‘92’, Buenos Aires, Argentina, 7–9 Sept.
Gigiel, A., Gibbs, R., Butler, D. and Holder, D. (1996). Air-cycle technologies for building services. IIRProceedings Series ‘Refrigeration Science and Technology’, International Institute of Refrigeration – Paris,1996-3: 687–696.
Gigiel, A., Polonara, F. and Di Nicola, G. (2004). Rapid freezing of food in an open air cycle freezer. In:Natural Working Fluids 2004 – 6th IIR Gustav Lorentzen Conference. IIR Proceedings Series ‘RefrigerationScience and Technology’, International Institute of Refrigeration, 2004–2.
Horlock, J. (2003). Advanced Gas Turbine Cycles. Elsevier Science, p. 405.IIR (1986). Recommendations for the Processing and Handling of Frozen Foods. Paris: International Institute
of Refrigeration, p. 419.IIR (1999). Control of the Cold Chain for Quick-Frozen Foods. Handbook. Paris: International Institute of
Refrigeration, p. 94.James, C., Ketteringham, L. and James, S.J. (2000). Enhanced heat transfer in food chilling, freezing and
thawing using heat pipes. In: K. Fikiin, ed. Advances in the Refrigeration Systems, Food Technologies andCold Chain. IIR Proceedings Series ‘Refrigeration Science and Technology’, 1998/6, pp. 327–333.
Kennedy, C.J., ed. (2000). Managing Frozen Foods. Cambridge: Woodhead Publishing, p. 286.
BLUK139-Evans January 23, 2008 17:27
Emerging and Novel Freezing Processes 123
Kikuchi, S., Okuda, S., Igawa, H., Morii, S., Mitsuhashi, M. and Higashimori, H. (2005). Development of anair-cycle system for refrigeration. Mitsubishi Heavy Industries Technical Review 42(4), 1–4.
Kulakov, V.M., Vereschagin, M.P., Kulakov, V.V. and Vereschagin, M.M. (1999). Air turbo-refrigeratingmachines. Refrigeration Business 6: 5–10 (in Russian).
Lucas, T. and Raoult-Wack, A.L. (1998). Immersion chilling and freezing in aqueous refrigerating media:review and future trends. International Journal of Refrigeration 21(6), 419–429.
Magnussen, O.M., Nordtvedt, T.S. and Torstveit, A.K. (2000). Use of partial freezing in the cold chain. In:K. Fikiin, ed. Advances in the Refrigeration Systems, Food Technologies and Cold Chain. IIR ProceedingsSeries ‘Refrigeration Science and Technology’, 1998/6, pp. 363–370.
Matveev, I.K., Backhaus, S. and Swift, G.W. (2007). Analytical solution for temperature profiles at the endsof thermal buffer tubes. International Journal of Heat and Mass Transfer 50, 897–901.
Mohanty, P. (2001). Magnetic resonance freezing system. AIRAH Journal 55(6), 28–29.Pearson, S.F. and Brown, J. (1998). Use of pumpable ice to minimise salt uptake during immersion freezing.
Proceedings Oslo Conference, IIF/IIR: pp. 712–722.Poese, M.E., Robert, W.M., Garrett, S.L., van Gerwen, R. and Gosselin, P. (2004). Thermoacoustic refriger-
ation for ice cream sales. 6th IIR Gustav Lorentzen Conference on Natural Working Substances, Glasgow,Aug 29–Sept 1, 2004.
Russell, S.L., Gigiel, A.J. and James, S.J. (2001). Progress in the use of air cycle technology in food refrig-eration and especially retail display. AIRAH Journal 55(11), 20–25.
Schluter, O., George, S., Heinz, V. and Knorr, D. (2000). Phase transitions in model foods, induced by pressure-assisted freezing and pressure-assisted thawing. In: K. Fikiin, ed. Advances in the Refrigeration Systems,Food Technologies and Cold Chain. IIR Proceedings Series ‘Refrigeration Science and Technology’, 1998-6, pp. 240–248.
Shaw, R., Kiczek, E. and Rossman, J. (1995). COLDBLAST air-cycle freezing system. Proceedings of the19th International Congress of Refrigeration, The Hague, 3a: 684–691.
So, J.H., Swift, G.W. and Backhaus, S. (2006). An internal streaming instability in regenerators. Journal ofthe Acoustical Society of America 120(4), 1898–1909.
Sun, Da-Wen, ed. (2001). Advances in Food Refrigeration. Surrey: Leatherhead Publishing, p. 482.Sun, Da-Wen, ed. (2005). Handbook of Frozen Food Processing and Packaging. Boca Raton, FL: CRC Press,
Taylor & Francis Group, p. 737.Tressler, D.K. (1968). Food freezing systems. In: D.K. Tressler, W.B. Van Arsdel and M.J. Copley, eds. The
Freezing Preservation of Foods, Vol. 1. Westport, CT: AVI Publishing, pp. 120–152.Verschoor, M., ed. (2001). Guidelines for the Application and Design of Air-cycle Systems for Heating,
Ventilating and Air-Conditioning in Buildings. TNO Environment, Energy and Process Innovation, p. 120.Van Gerwen, R. and Verschoor, M. (1996). Feasibility of air cycle systems for building air conditioning
systems. IIR Proceedings Series ‘Refrigeration Science and Technology’, International Institute of Refrig-eration – Paris, 1996-3: pp. 677–685.
Ueda, U., Biwa, T., Yazaki, T. and Mizutani, U. (2003). Construction of a thermoacoustic Stirling cooler.Physica B 329, 1600–1601.
Ure, Z. (1998). Slurry-ice based cooling systems. In: K. Fikiin, ed. Advances in the Refrigeration Systems, FoodTechnologies and Cold Chain. IIR Proceedings Series ‘Refrigeration Science and Technology’, 1998-6:pp. 172–179.
BLUK139-Evans January 23, 2008 17:29
6 Freezing of Meat
Steve James
It is believed that the first meat freezing works were established at Darling Harbour in Sydney,Australia in 1861 (Critchell and Raymond, 1912). In the next decade there were a number ofattempts to transport frozen meat. However, the first entirely successful frozen meat shipmentwas that in the s.s. Paraguay from Buenos Aires to Havre in 1877. Due to a collision theship took 7 months to complete her journey but the 5,500 mutton carcasses were ‘in tip topcondition’ when the ship arrived at Havre. A second voyage was planned but never happenedand to quote Berges (cited in Critchell and Raymond, 1912), “As has often happened in thehistory of industries, it has been the French who have made the discoveries, and the Englishhave turned them to account to their profit”.
The arrival of the s.s. Strathleven in London on December 8 1880 with its cargo of40 tonnes of frozen Australian beef and mutton started the frozen meat trade. It was soldfor up to three times its value in Australia and as stated in the Daily Telegraph, “It has beentested by the ordinary method of cooking, and found to be in such good condition that neitherby its appearance in the butchers’ shops, nor by any peculiarity of flavour when cooked forthe table, could it be distinguished from freshly killed English meat.” Eighteen months laterthe s.s. Dunedin arrived with a cargo of frozen New Zealand lamb and mutton. By 18922,000,000 carcasses were arriving per year and by 1910 602,750 tonnes of frozen meat werebeing exported from Australia, New Zealand and South America (Critchell and Raymond,1912).
Currently, meat for industrial processing is usually frozen in the form of carcasses, quartersor boned out primals in 25-kg cartons. It is not unusual for meat to be frozen twice beforeit reaches the consumer. During industrial processing frozen raw material is often thawed ortempered before being turned into meat-based products, i.e. pies, convenience meals, burgers,etc. or consumer portions, fillets, steaks, and so on. These consumer-sized portions are oftenrefrozen before storage, distribution and sale.
6.1 FREEZING RATE
There are little data in the literature to suggest that, in general, the method of freezing or therate of freezing has any substantial influence on a meat’s subsequent storage life, its qualitycharacteristics or final eating quality. There is some disagreement in the literature aboutwhich one has more benefits – fast freezing or slow freezing. Slightly superior chemical andsensory attributes have been found in food cryogenically frozen in a few trials (Sebraneket al., 1978; Dobryzcki et al., 1977; Sebranek, 1980) but other trials did not show anyappreciable advantage (Lampitt and Moran, 1933) especially during short-term storage (Hill
Frozen Food Science and Technology. Edited by Judith A. Evans
© 2008 Blackwell Publishing Ltd, ISBN: 978-1-4051-5478-9
BLUK139-Evans January 23, 2008 17:29
Freezing of Meat 125
Table 6.1 Relationship between freezing rate of beef M. longissimusdorsi and weight loss during freezing, thawing and cooking(source: Petrovic et al., 1993).
% Weight loss during
Freezing rate (cm h−1) Freezing Thawing Cooking
Control — — 36.320.22 2.83 0.78 38.410.39 2.58 0.72 38.003.33 1.15 1.21 37.473.95 1.05 0.18 37.244.92 0.87 0.10 37.155.66 0.63 0.03 37.14
and Glew, 1973). In the case of dark, firm and dry (DFD) pork, Kondratowicz et al. (2000)found that conventional slow freezing resulted in a better sensory quality than freezing inliquid carbon dioxide. Jackobsson and Bengtson (1973) indicated that there is an interactionbetween freezing rate and cooking method. Meat that had been cooked from frozen wasfound to show a favourable effect of faster freezing rates. Mittal and Barbut (1991) showedthat freezing rate affected the modulus of rigidity of meat after cooking. Similar values tofresh meat were produced in meat frozen in liquid nitrogen.
In 1980, Anon and Calvelo reported a relationship between the rate of freezing and driploss. They reported drip loss to reach a maximum when the freezing time from −1◦C to −7◦Cwas approximately 17 minutes. Mascheroni (1985) used this relationship to produce a methodfor determining the rate at which meat had been frozen. However, attempts to replicate thework at Langford (James et al., 1983) were unsuccessful because of the variability in driploss from meat before freezing. Ngapo et al. (1999) reported that drip loss was higher fromslow-frozen than from fast-frozen pork samples. However, the difference disappeared after4 weeks of frozen storage.
Experiments with pork M. longissimus dorsi found no difference in drip loss betweensamples frozen at −20◦C or −80◦C (Sakata et al., 1995). At −20◦C and −80◦C, samplestook 6 and 3 hours, respectively, to pass from −1◦C to approximately −6◦C. In the −20◦Csamples intercellular and intracellular ice was seen but only intracellular at −80◦C.
Methods of freezing clearly affect the ultrastructure of muscle. Slow freezing (e.g.1–2 mm h−1) tends to produce large ice crystals extracellularly, while quick freezing (e.g.50 mm h−1) gives smaller crystals in and outside cells (Buchmuller, 1986). Obviously, atemperature gradient will occur in large pieces of meat and result in a non-uniform icemorphology (Bevilacqua et al., 1979).
Petrovic et al. (1993) found that slowly frozen meat, 0.22 and 0.39 cm h−1, lost moreweight during freezing, thawing and cooking than that frozen at 3.95–5.66 cm h−1 (Table 6.1).However, higher weight losses during thawing were measured at an intermediate freezingrate of 3.33 cm h−1. Meat frozen at rates of 3.33 cm h−1 and faster were rated as tenderer andjuicier after cooking than unfrozen controls and slow-frozen samples (Table 6.2). Petrovicet al. stated that the optimal conditions for freezing portioned meat are those that achievefreezing rates between 2 and 5 cm h−1 to −7◦C. Grujic et al. (1993) suggest even tighterlimits, 3.33–3.95 cm h−1. Slow freezing at up to 0.39 cm h−1 resulted in decreased solubilityof myofibrillar proteins, increase in weight loss during, freezing thawing and cooking, lowerwater binding capacity and tougher cooked meat. Very quickly frozen meat (>4.9 cm h−1)
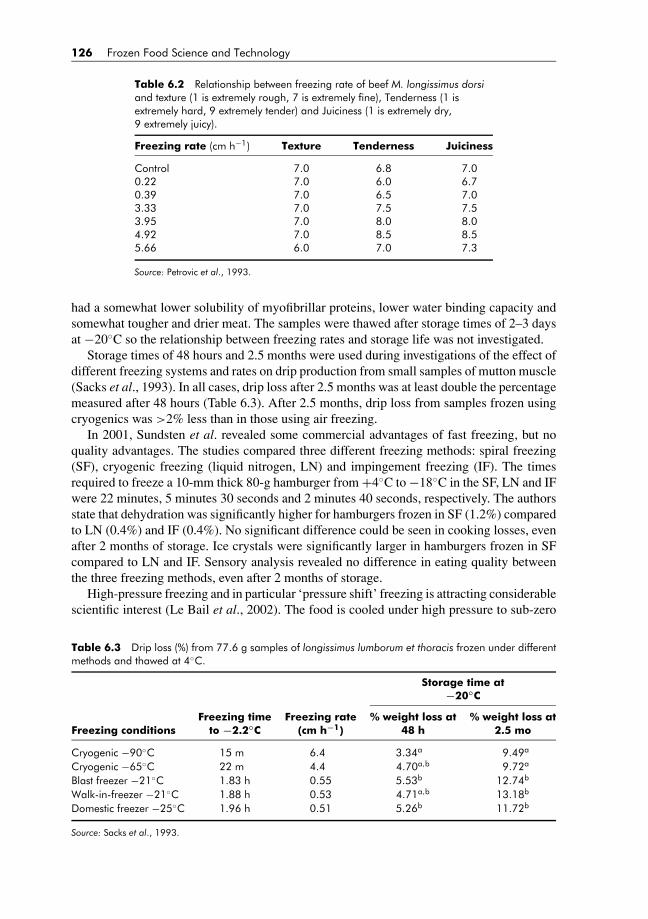
BLUK139-Evans January 23, 2008 17:29
126 Frozen Food Science and Technology
Table 6.2 Relationship between freezing rate of beef M. longissimus dorsiand texture (1 is extremely rough, 7 is extremely fine), Tenderness (1 isextremely hard, 9 extremely tender) and Juiciness (1 is extremely dry,9 extremely juicy).
Freezing rate (cm h−1) Texture Tenderness Juiciness
Control 7.0 6.8 7.00.22 7.0 6.0 6.70.39 7.0 6.5 7.03.33 7.0 7.5 7.53.95 7.0 8.0 8.04.92 7.0 8.5 8.55.66 6.0 7.0 7.3
Source: Petrovic et al., 1993.
had a somewhat lower solubility of myofibrillar proteins, lower water binding capacity andsomewhat tougher and drier meat. The samples were thawed after storage times of 2–3 daysat −20◦C so the relationship between freezing rates and storage life was not investigated.
Storage times of 48 hours and 2.5 months were used during investigations of the effect ofdifferent freezing systems and rates on drip production from small samples of mutton muscle(Sacks et al., 1993). In all cases, drip loss after 2.5 months was at least double the percentagemeasured after 48 hours (Table 6.3). After 2.5 months, drip loss from samples frozen usingcryogenics was >2% less than in those using air freezing.
In 2001, Sundsten et al. revealed some commercial advantages of fast freezing, but noquality advantages. The studies compared three different freezing methods: spiral freezing(SF), cryogenic freezing (liquid nitrogen, LN) and impingement freezing (IF). The timesrequired to freeze a 10-mm thick 80-g hamburger from +4◦C to −18◦C in the SF, LN and IFwere 22 minutes, 5 minutes 30 seconds and 2 minutes 40 seconds, respectively. The authorsstate that dehydration was significantly higher for hamburgers frozen in SF (1.2%) comparedto LN (0.4%) and IF (0.4%). No significant difference could be seen in cooking losses, evenafter 2 months of storage. Ice crystals were significantly larger in hamburgers frozen in SFcompared to LN and IF. Sensory analysis revealed no difference in eating quality betweenthe three freezing methods, even after 2 months of storage.
High-pressure freezing and in particular ‘pressure shift’ freezing is attracting considerablescientific interest (Le Bail et al., 2002). The food is cooled under high pressure to sub-zero
Table 6.3 Drip loss (%) from 77.6 g samples of longissimus lumborum et thoracis frozen under differentmethods and thawed at 4◦C.
Storage time at−20◦C
Freezing time Freezing rate % weight loss at % weight loss atFreezing conditions to −2.2◦C (cm h−1) 48 h 2.5 mo
Cryogenic −90◦C 15 m 6.4 3.34a 9.49a
Cryogenic −65◦C 22 m 4.4 4.70a,b 9.72a
Blast freezer −21◦C 1.83 h 0.55 5.53b 12.74b
Walk-in-freezer −21◦C 1.88 h 0.53 4.71a,b 13.18b
Domestic freezer −25◦C 1.96 h 0.51 5.26b 11.72b
Source: Sacks et al., 1993.

BLUK139-Evans January 23, 2008 17:29
Freezing of Meat 127
Evaporator Reversiblefan
False ceiling
Product ontrolleys
Fig. 6.1 Example of a freezing tunnel with longitudinal air circulation.
temperatures but does not undergo a phase change and freeze until the pressure is released.Rapid nucleation results producing small, even ice crystals. However, studies on pork andbeef (Fernandez-Martin et al., 200) and on pork (Zhu et al., 2004) have failed to show anyreal commercial quality advantages and an increase in toughness in the later study.
Slow freezing from a high initial temperature can provide conditions for microbial growthas compared to a very rapid freezing process. Castell-Perez et al. (1989) predicted that slowfreezing from an initial product temperature of 30◦C could result in an 83% increase inbacterial numbers compared with a 4% increase from 10◦C.
6.2 FREEZING SYSTEMS
6.2.1 Air
Air is by far the most widely used method of freezing food, as it is economical, hygienicand relatively non-corrosive to equipment. Systems range from the most basic – in whicha fan draws air through a refrigerated coil (evaporator) and blows the cooled air around aninsulated room (Fig. 6.1) – to purpose-built, conveyerised blast-freezing tunnels or spirals.Relatively low rates of heat transfer are attained from product surfaces in air systems. Thebig advantage of air systems is their versatility; especially when there is a requirement tofreeze a variety of irregularly shaped products or individual products.
In practice, air distribution is a major problem, often overlooked by the system designerand the operator. The freezing time of the product is reduced as the air speed is increased.An optimum value exists between the decrease in freezing time and the increasing powerrequired to drive the fans to produce higher air speeds. This optimum value can be as low as1.0 m s−1 air speed when freezing beef quarters to 15 m s−1 plus for thin products.
Recently, the use of impingement technology to increase the surface heat transfer in airand other freezing systems has received attention (Newman, 2001; Sundsten et al., 2001;Everington, 2001). Impingement is the process of directing a jet or jets of fluid at a solidsurface to effect a change. The very high velocity (20–30 m s−1) impingement gas jets“break up” the static surface boundary layer of gas that surrounds a food product. The

BLUK139-Evans January 23, 2008 17:29
128 Frozen Food Science and Technology
resulting medium around the product is more turbulent and the heat exchange through thiszone becomes much more effective.
6.2.2 Batch Systems
Placing food items in large refrigerated rooms is the most common method of freezing. Fanscirculate air through refrigerated coils and around the products in an insulated room. Largeindividual items such as meat carcasses are hung from overhead rails, smaller products areplaced either unwrapped or in cartons on racks, pallets, or large bins.
6.2.3 Continuous systems
In a continuous system meat is conveyed through a freezing tunnel or refrigerated room usuallyby an overhead conveyor or on a belt. This overcomes the problem of uneven air distributionsince each item is subjected to the same velocity/time profile. Some meat products are frozenon racks of trays (2-m high), pulled or pushed through a freezing tunnel by mechanical means.For larger operations, it is more satisfactory to feed meat on a continuous belt through lineartunnels or spiral freezers. Linear tunnels are of simpler construction but are restricted by thelength of belt necessary to achieve the cooling time required and on the space available inmost factories. Spiral freezers are therefore a more viable alternative.
6.3 CONTACT FREEZERS
Contact freezing methods are based on heat transfer by contact between products and metalsurfaces, which in turn are cooled by either primary or secondary refrigerants or directimmersion in a refrigerated liquid. Contact freezing offers several advantages over air-cooling,i.e. much better heat transfer and significant energy savings. However, the need for regularlyshaped products with large flat surfaces is a major hindrance with plate systems and the needto wrap and wash off the immersion liquid in immersion systems.
Modern plate cooling systems differ little in principle from the first contact freezer patentedin 1929 by Clarence Birdseye. Essentially product is pressed between hollow metal platescontaining a circulating refrigerant (Fig. 6.2). A hydraulic cylinder is used to bring the freezingplates into pressure contact with the product. These plates can be either horizontal or vertical.
Good heat transfer is dependent on product thickness, good contact and the conductivityof the product. Plate freezers are often limited to a maximum thickness of 50–70 mm. Goodcontact is a prime requirement. Air spaces in packaging and fouling of the plates can havea significant effect on cooling time; for example, a water droplet frozen on the plate canlengthen the freezing time by as much as 30–60%.
General advantages of plate freezers over air-blast carton freezers include:� Freezing is either faster for the same refrigerant evaporating temperature, or can take placeat a higher evaporating temperature for a given freezing time.� Product temperatures are easier to control, especially for smaller cuts.� Power consumption is significantly reduced – savings of at least 30%, and possibly 50%or more, may be expected because air-circulating fans are not required and because higherevaporating temperatures can be used for the same effective cooling medium temperature.� In many cases, less building space is required.
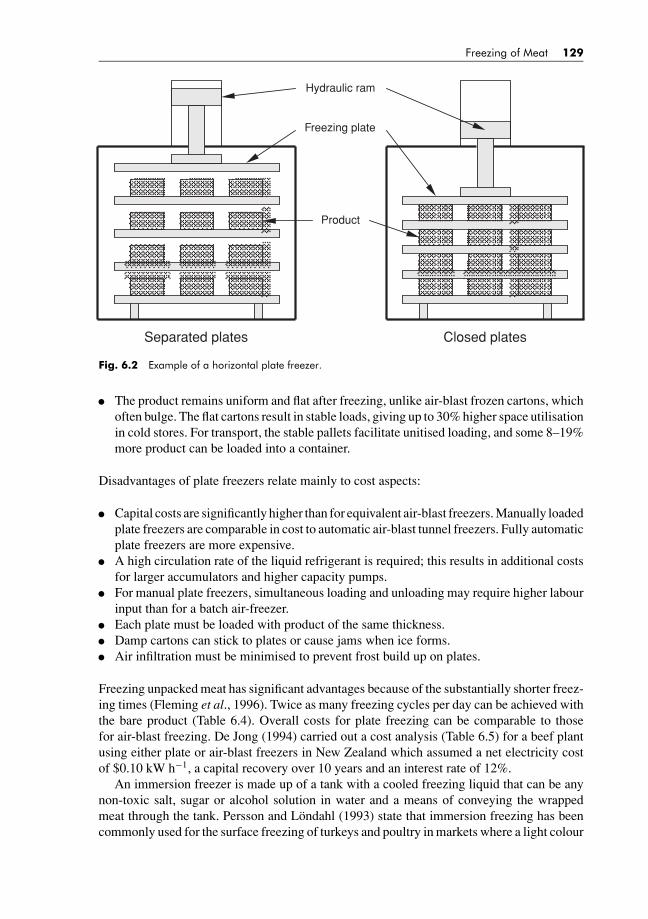
BLUK139-Evans January 23, 2008 17:29
Freezing of Meat 129
Hydraulic ram
Freezing plate
Product
Separated plates Closed plates
Fig. 6.2 Example of a horizontal plate freezer.� The product remains uniform and flat after freezing, unlike air-blast frozen cartons, whichoften bulge. The flat cartons result in stable loads, giving up to 30% higher space utilisationin cold stores. For transport, the stable pallets facilitate unitised loading, and some 8–19%more product can be loaded into a container.
Disadvantages of plate freezers relate mainly to cost aspects:� Capital costs are significantly higher than for equivalent air-blast freezers. Manually loadedplate freezers are comparable in cost to automatic air-blast tunnel freezers. Fully automaticplate freezers are more expensive.� A high circulation rate of the liquid refrigerant is required; this results in additional costsfor larger accumulators and higher capacity pumps.� For manual plate freezers, simultaneous loading and unloading may require higher labourinput than for a batch air-freezer.� Each plate must be loaded with product of the same thickness.� Damp cartons can stick to plates or cause jams when ice forms.� Air infiltration must be minimised to prevent frost build up on plates.
Freezing unpacked meat has significant advantages because of the substantially shorter freez-ing times (Fleming et al., 1996). Twice as many freezing cycles per day can be achieved withthe bare product (Table 6.4). Overall costs for plate freezing can be comparable to thosefor air-blast freezing. De Jong (1994) carried out a cost analysis (Table 6.5) for a beef plantusing either plate or air-blast freezers in New Zealand which assumed a net electricity costof $0.10 kW h−1, a capital recovery over 10 years and an interest rate of 12%.
An immersion freezer is made up of a tank with a cooled freezing liquid that can be anynon-toxic salt, sugar or alcohol solution in water and a means of conveying the wrappedmeat through the tank. Persson and Londahl (1993) state that immersion freezing has beencommonly used for the surface freezing of turkeys and poultry in markets where a light colour
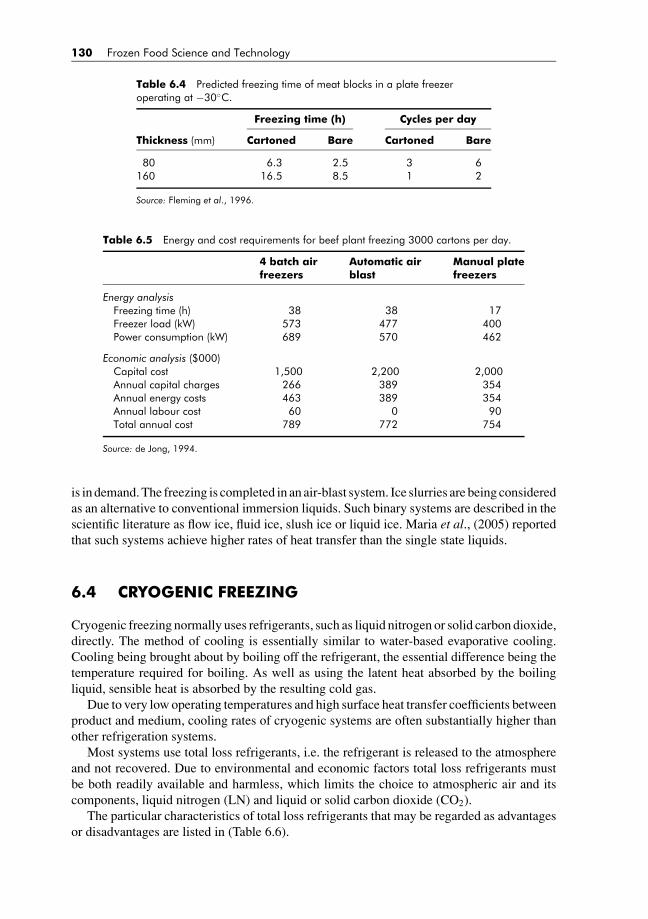
BLUK139-Evans January 23, 2008 17:29
130 Frozen Food Science and Technology
Table 6.4 Predicted freezing time of meat blocks in a plate freezeroperating at −30◦C.
Freezing time (h) Cycles per day
Thickness (mm) Cartoned Bare Cartoned Bare
80 6.3 2.5 3 6160 16.5 8.5 1 2
Source: Fleming et al., 1996.
Table 6.5 Energy and cost requirements for beef plant freezing 3000 cartons per day.
4 batch air Automatic air Manual platefreezers blast freezers
Energy analysisFreezing time (h) 38 38 17Freezer load (kW) 573 477 400Power consumption (kW) 689 570 462
Economic analysis ($000)Capital cost 1,500 2,200 2,000Annual capital charges 266 389 354Annual energy costs 463 389 354Annual labour cost 60 0 90Total annual cost 789 772 754
Source: de Jong, 1994.
is in demand. The freezing is completed in an air-blast system. Ice slurries are being consideredas an alternative to conventional immersion liquids. Such binary systems are described in thescientific literature as flow ice, fluid ice, slush ice or liquid ice. Maria et al., (2005) reportedthat such systems achieve higher rates of heat transfer than the single state liquids.
6.4 CRYOGENIC FREEZING
Cryogenic freezing normally uses refrigerants, such as liquid nitrogen or solid carbon dioxide,directly. The method of cooling is essentially similar to water-based evaporative cooling.Cooling being brought about by boiling off the refrigerant, the essential difference being thetemperature required for boiling. As well as using the latent heat absorbed by the boilingliquid, sensible heat is absorbed by the resulting cold gas.
Due to very low operating temperatures and high surface heat transfer coefficients betweenproduct and medium, cooling rates of cryogenic systems are often substantially higher thanother refrigeration systems.
Most systems use total loss refrigerants, i.e. the refrigerant is released to the atmosphereand not recovered. Due to environmental and economic factors total loss refrigerants mustbe both readily available and harmless, which limits the choice to atmospheric air and itscomponents, liquid nitrogen (LN) and liquid or solid carbon dioxide (CO2).
The particular characteristics of total loss refrigerants that may be regarded as advantagesor disadvantages are listed in (Table 6.6).
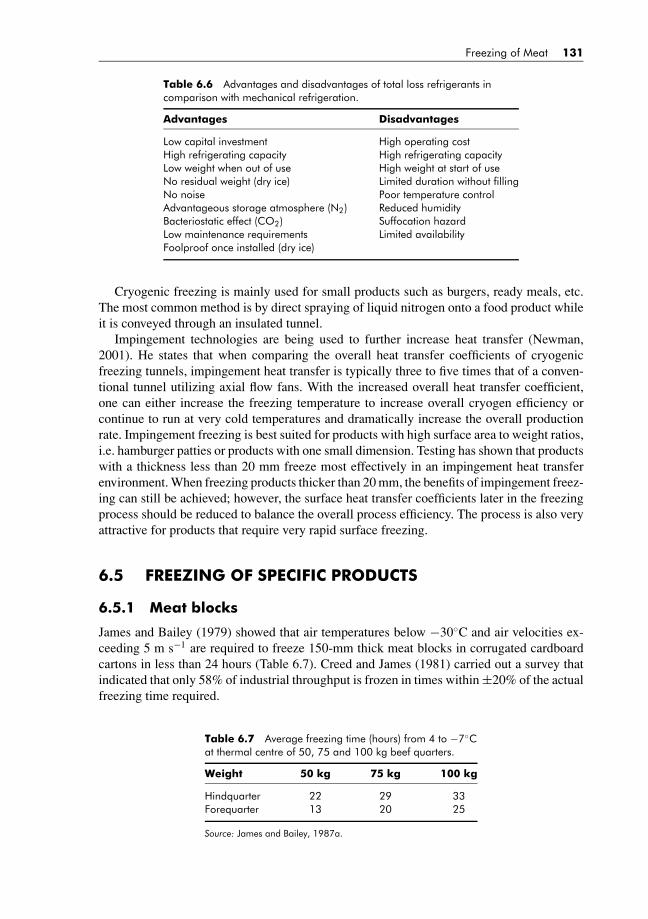
BLUK139-Evans January 23, 2008 17:29
Freezing of Meat 131
Table 6.6 Advantages and disadvantages of total loss refrigerants incomparison with mechanical refrigeration.
Advantages Disadvantages
Low capital investment High operating costHigh refrigerating capacity High refrigerating capacityLow weight when out of use High weight at start of useNo residual weight (dry ice) Limited duration without fillingNo noise Poor temperature controlAdvantageous storage atmosphere (N2) Reduced humidityBacteriostatic effect (CO2) Suffocation hazardLow maintenance requirements Limited availabilityFoolproof once installed (dry ice)
Cryogenic freezing is mainly used for small products such as burgers, ready meals, etc.The most common method is by direct spraying of liquid nitrogen onto a food product whileit is conveyed through an insulated tunnel.
Impingement technologies are being used to further increase heat transfer (Newman,2001). He states that when comparing the overall heat transfer coefficients of cryogenicfreezing tunnels, impingement heat transfer is typically three to five times that of a conven-tional tunnel utilizing axial flow fans. With the increased overall heat transfer coefficient,one can either increase the freezing temperature to increase overall cryogen efficiency orcontinue to run at very cold temperatures and dramatically increase the overall productionrate. Impingement freezing is best suited for products with high surface area to weight ratios,i.e. hamburger patties or products with one small dimension. Testing has shown that productswith a thickness less than 20 mm freeze most effectively in an impingement heat transferenvironment. When freezing products thicker than 20 mm, the benefits of impingement freez-ing can still be achieved; however, the surface heat transfer coefficients later in the freezingprocess should be reduced to balance the overall process efficiency. The process is also veryattractive for products that require very rapid surface freezing.
6.5 FREEZING OF SPECIFIC PRODUCTS
6.5.1 Meat blocks
James and Bailey (1979) showed that air temperatures below −30◦C and air velocities ex-ceeding 5 m s−1 are required to freeze 150-mm thick meat blocks in corrugated cardboardcartons in less than 24 hours (Table 6.7). Creed and James (1981) carried out a survey thatindicated that only 58% of industrial throughput is frozen in times within ±20% of the actualfreezing time required.
Table 6.7 Average freezing time (hours) from 4 to −7◦Cat thermal centre of 50, 75 and 100 kg beef quarters.
Weight 50 kg 75 kg 100 kg
Hindquarter 22 29 33Forequarter 13 20 25
Source: James and Bailey, 1987a.
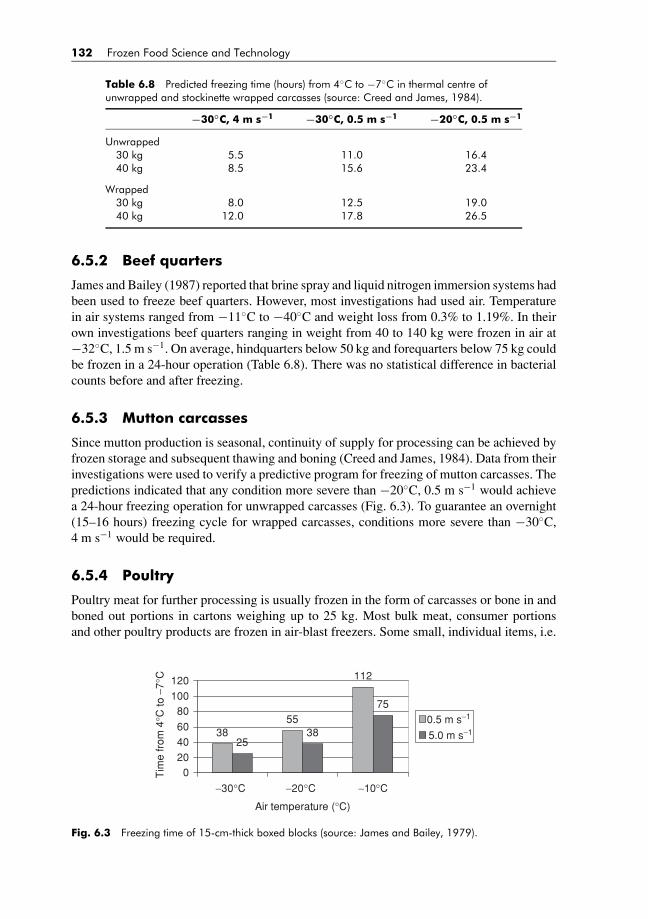
BLUK139-Evans January 23, 2008 17:29
132 Frozen Food Science and Technology
Table 6.8 Predicted freezing time (hours) from 4◦C to −7◦C in thermal centre ofunwrapped and stockinette wrapped carcasses (source: Creed and James, 1984).
−30◦C, 4 m s−1 −30◦C, 0.5 m s−1 −20◦C, 0.5 m s−1
Unwrapped30 kg 5.5 11.0 16.440 kg 8.5 15.6 23.4
Wrapped30 kg 8.0 12.5 19.040 kg 12.0 17.8 26.5
6.5.2 Beef quarters
James and Bailey (1987) reported that brine spray and liquid nitrogen immersion systems hadbeen used to freeze beef quarters. However, most investigations had used air. Temperaturein air systems ranged from −11◦C to −40◦C and weight loss from 0.3% to 1.19%. In theirown investigations beef quarters ranging in weight from 40 to 140 kg were frozen in air at−32◦C, 1.5 m s−1. On average, hindquarters below 50 kg and forequarters below 75 kg couldbe frozen in a 24-hour operation (Table 6.8). There was no statistical difference in bacterialcounts before and after freezing.
6.5.3 Mutton carcasses
Since mutton production is seasonal, continuity of supply for processing can be achieved byfrozen storage and subsequent thawing and boning (Creed and James, 1984). Data from theirinvestigations were used to verify a predictive program for freezing of mutton carcasses. Thepredictions indicated that any condition more severe than −20◦C, 0.5 m s−1 would achievea 24-hour freezing operation for unwrapped carcasses (Fig. 6.3). To guarantee an overnight(15–16 hours) freezing cycle for wrapped carcasses, conditions more severe than −30◦C,4 m s−1 would be required.
6.5.4 Poultry
Poultry meat for further processing is usually frozen in the form of carcasses or bone in andboned out portions in cartons weighing up to 25 kg. Most bulk meat, consumer portionsand other poultry products are frozen in air-blast freezers. Some small, individual items, i.e.
3855
112
2538
75
0204060
80100120
−30°C −20°C −10°C
Air temperature (°C)
Tim
e fr
om 4
°C to
−7°
C
0.5 m s−1
5.0 m s−1
Fig. 6.3 Freezing time of 15-cm-thick boxed blocks (source: James and Bailey, 1979).
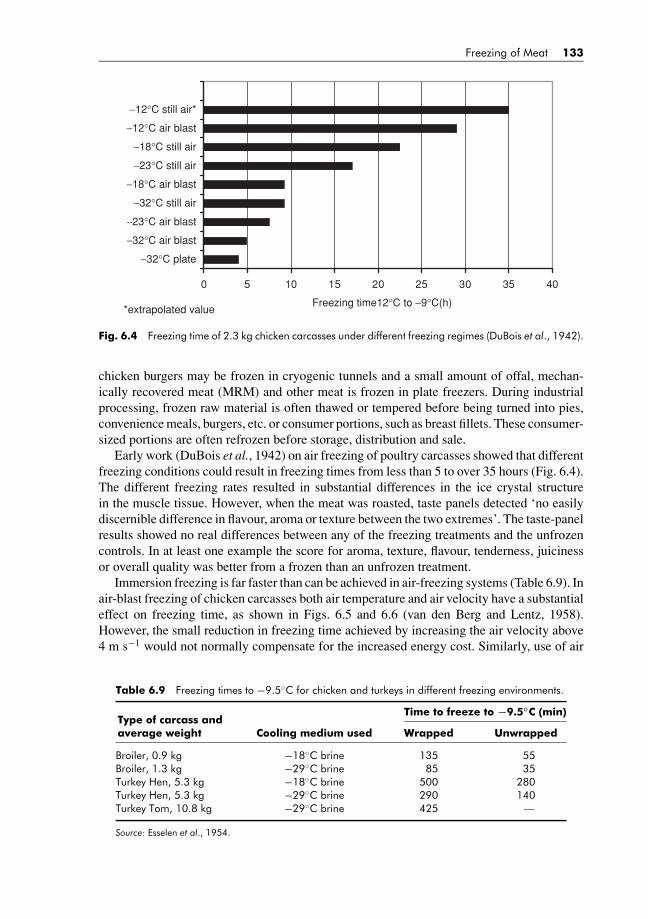
BLUK139-Evans January 23, 2008 17:29
Freezing of Meat 133
0 5 10 15 20 25 30 35 40
−32°C plate
−32°C air blast
−23°C air blast
−32°C still air
−18°C air blast
−23°C still air
−18°C still air
−12°C air blast
−12°C still air*
Freezing time12°C to −9°C(h)*extrapolated value
Fig. 6.4 Freezing time of 2.3 kg chicken carcasses under different freezing regimes (DuBois et al., 1942).
chicken burgers may be frozen in cryogenic tunnels and a small amount of offal, mechan-ically recovered meat (MRM) and other meat is frozen in plate freezers. During industrialprocessing, frozen raw material is often thawed or tempered before being turned into pies,convenience meals, burgers, etc. or consumer portions, such as breast fillets. These consumer-sized portions are often refrozen before storage, distribution and sale.
Early work (DuBois et al., 1942) on air freezing of poultry carcasses showed that differentfreezing conditions could result in freezing times from less than 5 to over 35 hours (Fig. 6.4).The different freezing rates resulted in substantial differences in the ice crystal structurein the muscle tissue. However, when the meat was roasted, taste panels detected ‘no easilydiscernible difference in flavour, aroma or texture between the two extremes’. The taste-panelresults showed no real differences between any of the freezing treatments and the unfrozencontrols. In at least one example the score for aroma, texture, flavour, tenderness, juicinessor overall quality was better from a frozen than an unfrozen treatment.
Immersion freezing is far faster than can be achieved in air-freezing systems (Table 6.9). Inair-blast freezing of chicken carcasses both air temperature and air velocity have a substantialeffect on freezing time, as shown in Figs. 6.5 and 6.6 (van den Berg and Lentz, 1958).However, the small reduction in freezing time achieved by increasing the air velocity above4 m s−1 would not normally compensate for the increased energy cost. Similarly, use of air
Table 6.9 Freezing times to −9.5◦C for chicken and turkeys in different freezing environments.
Time to freeze to −9.5◦C (min)Type of carcass andaverage weight Cooling medium used Wrapped Unwrapped
Broiler, 0.9 kg −18◦C brine 135 55Broiler, 1.3 kg −29◦C brine 85 35Turkey Hen, 5.3 kg −18◦C brine 500 280Turkey Hen, 5.3 kg −29◦C brine 290 140Turkey Tom, 10.8 kg −29◦C brine 425 —
Source: Esselen et al., 1954.
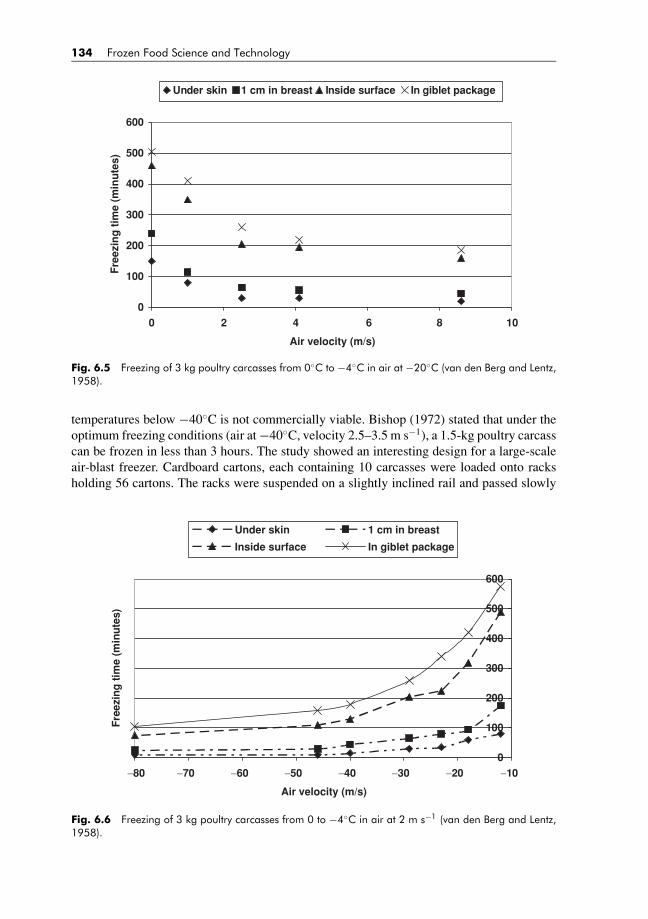
BLUK139-Evans January 23, 2008 17:29
134 Frozen Food Science and Technology
0
100
200
300
400
500
600
0 2 4 6 8 10
Air velocity (m/s)
Fre
ezin
g t
ime
(min
ute
s)
Under skin 1 cm in breast Inside surface In giblet package
Fig. 6.5 Freezing of 3 kg poultry carcasses from 0◦C to −4◦C in air at −20◦C (van den Berg and Lentz,1958).
temperatures below −40◦C is not commercially viable. Bishop (1972) stated that under theoptimum freezing conditions (air at −40◦C, velocity 2.5–3.5 m s−1), a 1.5-kg poultry carcasscan be frozen in less than 3 hours. The study showed an interesting design for a large-scaleair-blast freezer. Cardboard cartons, each containing 10 carcasses were loaded onto racksholding 56 cartons. The racks were suspended on a slightly inclined rail and passed slowly
0
100
200
300
400
500
600
−80 −70 −60 −50 −40 −30 −20 −10
Air velocity (m/s)
Fre
ezin
g t
ime
(min
ute
s)
Under skin 1 cm in breast
Inside surface In giblet package
Fig. 6.6 Freezing of 3 kg poultry carcasses from 0 to −4◦C in air at 2 m s−1 (van den Berg and Lentz,1958).

BLUK139-Evans January 23, 2008 17:29
Freezing of Meat 135
Table 6.10 Freezing time equations for liver in plate freezer.
Block thickness (cm) Equation
7.6 Y = −0.3547 + 54.4632R + 0.02138I10.2 Y = −0.1917 + 79.9314R + 0.05203I15.2 Y = −0.8020 + 212.119R + 0.08880I
Source: Creed and James, 1983.
by gravity through a chamber operating at −40◦C. After passing through the chamber theracks are unloaded and then slightly elevated. The empty racks were then returned to thestarting point by gravity.
6.5.5 Offal
Although edible offal comprises from 3% to 4% of the cold weight of a carcass there islittle published data on its refrigeration (Creed and James, 1983). The authors found thatliver was amenable to plate freezing and the freezing time to −7◦C (Y) was related to theinitial temperature (I ) and R, where R = (−1.5◦C – refrigerant temperature)−1 (Table 6.10).The authors extended their studies to examine the effect of different packaging materials onfreezing time (Creed and James, 1985).
6.5.6 Small products
The rate of freezing of unwrapped small meat products affects the weight loss with lossincreasing as freezing rate decreases. There is also some evidence that it affects losses duringcooking and sensory properties. Hanenian et al. (1989) have shown that freezing times ofindividual meat burgers (patties) can range from 22 s to over an hour in different systems(Table 6.11). Freezing in nitrogen and CO2 substantially reduced the amount of weight lossfrom unwrapped patties when compared with air systems. However, cooking losses werehigher and overall patty quality lower in those frozen in nitrogen. This was mainly due tocracking of patties in the immersion system.
When burgers are stacked and placed in boxes before freezing the freezing times increaseby at least an order of magnitude. Studies carried out on packaged burgers looked at freezingrates between 2◦C and −18◦C ranging from 24 to 96 hours (Berry and Leddy, 1989). Be-fore freezing tenderness scores measured using a taste panel (eight extremely tender to oneextremely tough) ranged from 6.6 to 6.1. All the burgers were rated as tougher immediatelyafter freezing and after storage for 18 months (Fig. 6.7). Immediately after freezing burgers
Table 6.11 Freezing of beef burgers from 2◦C to −10◦C in different systems.
Freezing Freezing Weight CookingTemperature Thickness time rate loss loss
Method (◦C) (cm) (s) (cm h−1) (%) (%)
Air (23 W m−2 K−1) −14 1.10 3939 0.5 2.0 34.4Air (31 W m−2 K−1) −25 1.12 2047 1.0 1.7 34.6CO2 snow −78 1.13 129 16.5 0.1 35.9N2 immersion −196 1.13 22 97.3 0.1 37.7
Source: Hanenian et al., 1989.

BLUK139-Evans January 23, 2008 17:29
136 Frozen Food Science and Technology
02468
1012
24 48 72 96
Freezing time (hours), 2°C to −18°C
Tex
ture
Panel 0 months
Panel 18 months
Instron 0 months
Instron 18 months
Fig. 6.7 Texture of burgers measured by taste panel (8 is extremely tender, 1 is extremely tough) andInstrom (kg) after 0 and 18 months storage (source: Berry and Leddy, 1989).
frozen in 96 hours were significantly tougher than those frozen in 24 hours; however, thedifference was not significant after 18 months of storage. Instrumental texture measurementswere in general agreement with those from the taste panel (Fig. 6.7).
Commercial freezing rates can be very slow. Sausages at the centre of a pallet requiring 6–7 days to achieve −15◦C from a starting temperature of 7◦C (Wanous et al., 1989). However,studies carried out on similar sausages frozen in 9 hours, 2.4 days and 6.8 days showed noeffect of freezing rate on TBA (thiobarbituric acid) values during frozen storage of 20 weeks.
Many small meat products such as cubes and strips of ham and poultry meat, poultry pieces,cooked meat balls, slices of salami and mincemeat can be individually quick frozen (IQF) ina rotary cryogenic freezer (Thumel and Gamm, 1994). The product is sprayed with a fine mistof nitrogen to freeze the surface as it enters the drum. As the tilting drum rotates it transportsthe food through a contra-current flow of cold gas that completes the freezing process.
6.6 TEMPERING AND CRUST FREEZING
There is no exact definition for the word ‘tempering’ in the meat industry. In practice ‘tem-pering’ can be a process in which the temperature of the product is either raised or loweredto a value that is optimal for the next processing stage.
James and James (2002) detail the advantages of tempering and the use of single- andmulti-stage systems where the temperature of frozen product is raised as required. With 150-mm-thick meat blocks, single-stage tempering operations can take many days (Brown andJames, 2006). However, microwave systems can rapidly temper similar meat blocks in lessthan 10 minutes (Swain and James, 2005).
Tempering and crust freezing operations are used to produce the optimum texture in achilled product so that it is suitable for mechanical processing. In this case, the product issemi-frozen so that it is stiff enough to be sliced, cubed etc.
6.6.1 Pork loin chopping
Loins from lamb and pork are often processed into chops with a high-speed guillotiningmachines. Because of the deformation in this process the yield can be reduced. The yield canbe increased by first tempering the meat, providing a stiff outer crust, by freezing with liquidnitrogen or a blast of very cold air. However, the process must be carefully controlled, if toomuch meat is frozen the subsequent chopped meat will have a large increase in the amount of
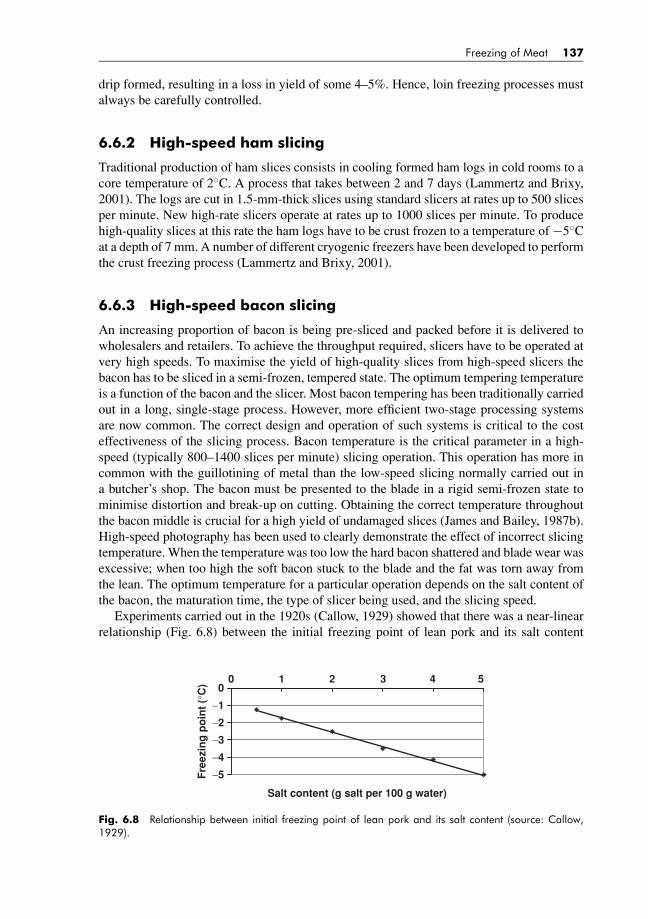
BLUK139-Evans January 23, 2008 17:29
Freezing of Meat 137
drip formed, resulting in a loss in yield of some 4–5%. Hence, loin freezing processes mustalways be carefully controlled.
6.6.2 High-speed ham slicing
Traditional production of ham slices consists in cooling formed ham logs in cold rooms to acore temperature of 2◦C. A process that takes between 2 and 7 days (Lammertz and Brixy,2001). The logs are cut in 1.5-mm-thick slices using standard slicers at rates up to 500 slicesper minute. New high-rate slicers operate at rates up to 1000 slices per minute. To producehigh-quality slices at this rate the ham logs have to be crust frozen to a temperature of −5◦Cat a depth of 7 mm. A number of different cryogenic freezers have been developed to performthe crust freezing process (Lammertz and Brixy, 2001).
6.6.3 High-speed bacon slicing
An increasing proportion of bacon is being pre-sliced and packed before it is delivered towholesalers and retailers. To achieve the throughput required, slicers have to be operated atvery high speeds. To maximise the yield of high-quality slices from high-speed slicers thebacon has to be sliced in a semi-frozen, tempered state. The optimum tempering temperatureis a function of the bacon and the slicer. Most bacon tempering has been traditionally carriedout in a long, single-stage process. However, more efficient two-stage processing systemsare now common. The correct design and operation of such systems is critical to the costeffectiveness of the slicing process. Bacon temperature is the critical parameter in a high-speed (typically 800–1400 slices per minute) slicing operation. This operation has more incommon with the guillotining of metal than the low-speed slicing normally carried out ina butcher’s shop. The bacon must be presented to the blade in a rigid semi-frozen state tominimise distortion and break-up on cutting. Obtaining the correct temperature throughoutthe bacon middle is crucial for a high yield of undamaged slices (James and Bailey, 1987b).High-speed photography has been used to clearly demonstrate the effect of incorrect slicingtemperature. When the temperature was too low the hard bacon shattered and blade wear wasexcessive; when too high the soft bacon stuck to the blade and the fat was torn away fromthe lean. The optimum temperature for a particular operation depends on the salt content ofthe bacon, the maturation time, the type of slicer being used, and the slicing speed.
Experiments carried out in the 1920s (Callow, 1929) showed that there was a near-linearrelationship (Fig. 6.8) between the initial freezing point of lean pork and its salt content
−5
−4
−3
−2
−1
00 1 2 3 4 5
Salt content (g salt per 100 g water)
Fre
ezin
g p
oin
t (°
C)
Fig. 6.8 Relationship between initial freezing point of lean pork and its salt content (source: Callow,1929).
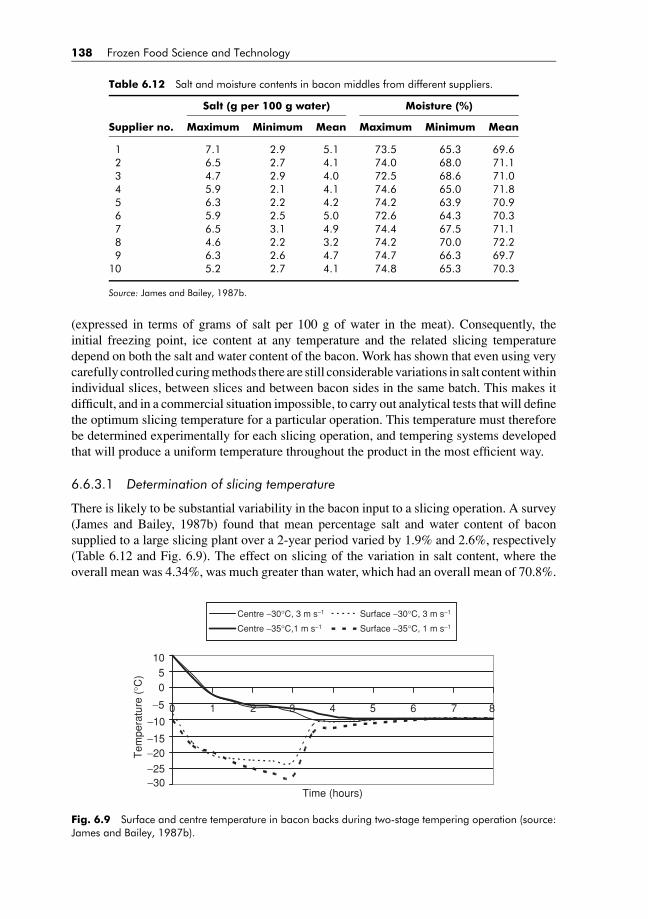
BLUK139-Evans January 23, 2008 17:29
138 Frozen Food Science and Technology
Table 6.12 Salt and moisture contents in bacon middles from different suppliers.
Salt (g per 100 g water) Moisture (%)
Supplier no. Maximum Minimum Mean Maximum Minimum Mean
1 7.1 2.9 5.1 73.5 65.3 69.62 6.5 2.7 4.1 74.0 68.0 71.13 4.7 2.9 4.0 72.5 68.6 71.04 5.9 2.1 4.1 74.6 65.0 71.85 6.3 2.2 4.2 74.2 63.9 70.96 5.9 2.5 5.0 72.6 64.3 70.37 6.5 3.1 4.9 74.4 67.5 71.18 4.6 2.2 3.2 74.2 70.0 72.29 6.3 2.6 4.7 74.7 66.3 69.7
10 5.2 2.7 4.1 74.8 65.3 70.3
Source: James and Bailey, 1987b.
(expressed in terms of grams of salt per 100 g of water in the meat). Consequently, theinitial freezing point, ice content at any temperature and the related slicing temperaturedepend on both the salt and water content of the bacon. Work has shown that even using verycarefully controlled curing methods there are still considerable variations in salt content withinindividual slices, between slices and between bacon sides in the same batch. This makes itdifficult, and in a commercial situation impossible, to carry out analytical tests that will definethe optimum slicing temperature for a particular operation. This temperature must thereforebe determined experimentally for each slicing operation, and tempering systems developedthat will produce a uniform temperature throughout the product in the most efficient way.
6.6.3.1 Determination of slicing temperature
There is likely to be substantial variability in the bacon input to a slicing operation. A survey(James and Bailey, 1987b) found that mean percentage salt and water content of baconsupplied to a large slicing plant over a 2-year period varied by 1.9% and 2.6%, respectively(Table 6.12 and Fig. 6.9). The effect on slicing of the variation in salt content, where theoverall mean was 4.34%, was much greater than water, which had an overall mean of 70.8%.
−30−25
−20−15
−10
−5
05
10
0 1 2 3 4 5 6 7 8
Time (hours)
Tem
pera
ture
(°C
)
Centre −30°C, 3 m s−1 Surface −30°C, 3 m s−1
Centre −35°C,1 m s−1 Surface −35°C, 1 m s−1
Fig. 6.9 Surface and centre temperature in bacon backs during two-stage tempering operation (source:James and Bailey, 1987b).
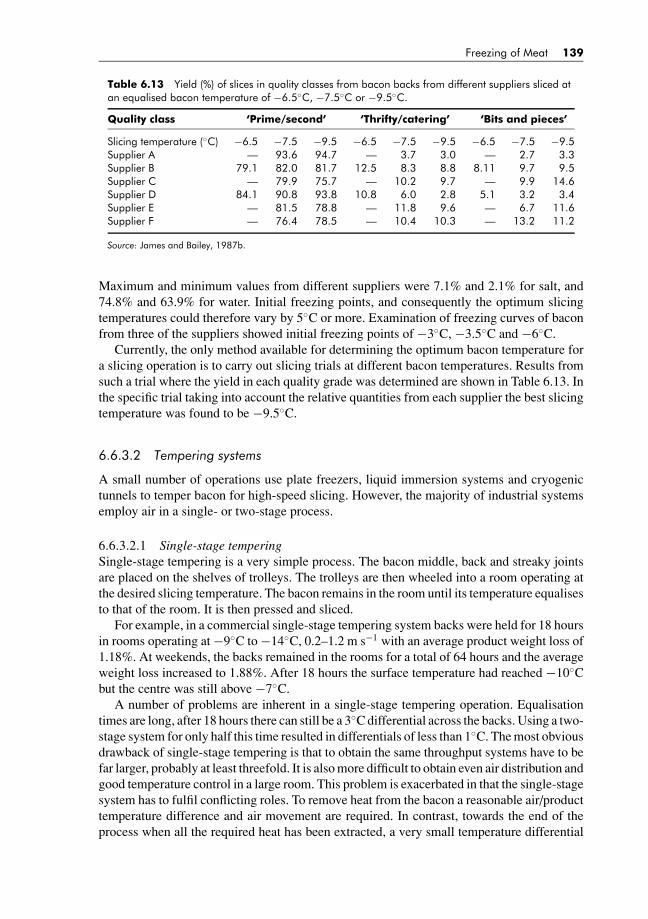
BLUK139-Evans January 23, 2008 17:29
Freezing of Meat 139
Table 6.13 Yield (%) of slices in quality classes from bacon backs from different suppliers sliced atan equalised bacon temperature of −6.5◦C, −7.5◦C or −9.5◦C.
Quality class ‘Prime/second’ ‘Thrifty/catering’ ‘Bits and pieces’
Slicing temperature (◦C) −6.5 −7.5 −9.5 −6.5 −7.5 −9.5 −6.5 −7.5 −9.5Supplier A — 93.6 94.7 — 3.7 3.0 — 2.7 3.3Supplier B 79.1 82.0 81.7 12.5 8.3 8.8 8.11 9.7 9.5Supplier C — 79.9 75.7 — 10.2 9.7 — 9.9 14.6Supplier D 84.1 90.8 93.8 10.8 6.0 2.8 5.1 3.2 3.4Supplier E — 81.5 78.8 — 11.8 9.6 — 6.7 11.6Supplier F — 76.4 78.5 — 10.4 10.3 — 13.2 11.2
Source: James and Bailey, 1987b.
Maximum and minimum values from different suppliers were 7.1% and 2.1% for salt, and74.8% and 63.9% for water. Initial freezing points, and consequently the optimum slicingtemperatures could therefore vary by 5◦C or more. Examination of freezing curves of baconfrom three of the suppliers showed initial freezing points of −3◦C, −3.5◦C and −6◦C.
Currently, the only method available for determining the optimum bacon temperature fora slicing operation is to carry out slicing trials at different bacon temperatures. Results fromsuch a trial where the yield in each quality grade was determined are shown in Table 6.13. Inthe specific trial taking into account the relative quantities from each supplier the best slicingtemperature was found to be −9.5◦C.
6.6.3.2 Tempering systems
A small number of operations use plate freezers, liquid immersion systems and cryogenictunnels to temper bacon for high-speed slicing. However, the majority of industrial systemsemploy air in a single- or two-stage process.
6.6.3.2.1 Single-stage temperingSingle-stage tempering is a very simple process. The bacon middle, back and streaky jointsare placed on the shelves of trolleys. The trolleys are then wheeled into a room operating atthe desired slicing temperature. The bacon remains in the room until its temperature equalisesto that of the room. It is then pressed and sliced.
For example, in a commercial single-stage tempering system backs were held for 18 hoursin rooms operating at −9◦C to −14◦C, 0.2–1.2 m s−1 with an average product weight loss of1.18%. At weekends, the backs remained in the rooms for a total of 64 hours and the averageweight loss increased to 1.88%. After 18 hours the surface temperature had reached −10◦Cbut the centre was still above −7◦C.
A number of problems are inherent in a single-stage tempering operation. Equalisationtimes are long, after 18 hours there can still be a 3◦C differential across the backs. Using a two-stage system for only half this time resulted in differentials of less than 1◦C. The most obviousdrawback of single-stage tempering is that to obtain the same throughput systems have to befar larger, probably at least threefold. It is also more difficult to obtain even air distribution andgood temperature control in a large room. This problem is exacerbated in that the single-stagesystem has to fulfil conflicting roles. To remove heat from the bacon a reasonable air/producttemperature difference and air movement are required. In contrast, towards the end of theprocess when all the required heat has been extracted, a very small temperature differential
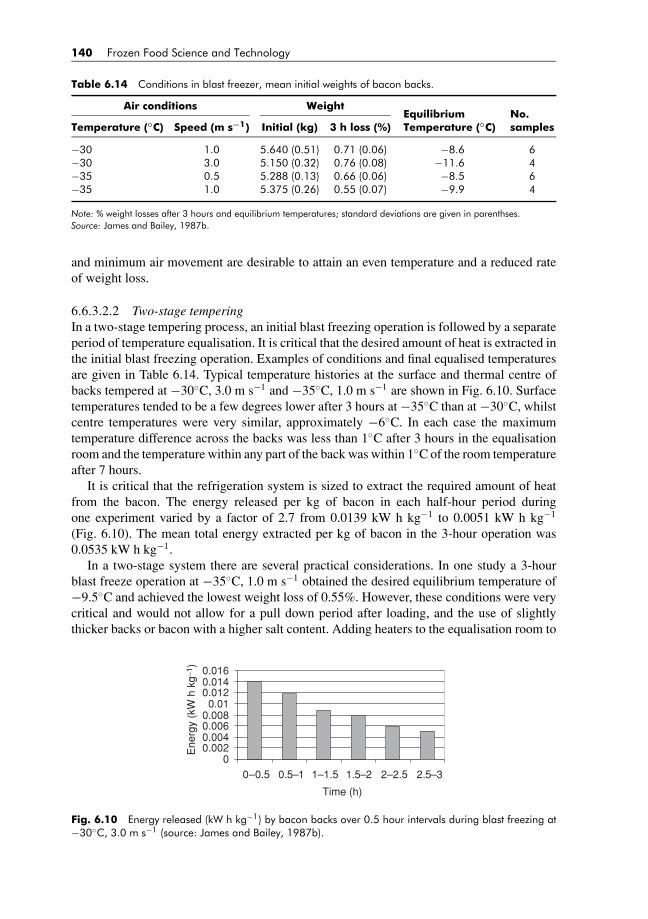
BLUK139-Evans January 23, 2008 17:29
140 Frozen Food Science and Technology
Table 6.14 Conditions in blast freezer, mean initial weights of bacon backs.
Air conditions Weight
Temperature (◦C) Speed (m s−1) Initial (kg) 3 h loss (%)EquilibriumTemperature (◦C)
No.samples
−30 1.0 5.640 (0.51) 0.71 (0.06) −8.6 6−30 3.0 5.150 (0.32) 0.76 (0.08) −11.6 4−35 0.5 5.288 (0.13) 0.66 (0.06) −8.5 6−35 1.0 5.375 (0.26) 0.55 (0.07) −9.9 4
Note: % weight losses after 3 hours and equilibrium temperatures; standard deviations are given in parenthses.Source: James and Bailey, 1987b.
and minimum air movement are desirable to attain an even temperature and a reduced rateof weight loss.
6.6.3.2.2 Two-stage temperingIn a two-stage tempering process, an initial blast freezing operation is followed by a separateperiod of temperature equalisation. It is critical that the desired amount of heat is extracted inthe initial blast freezing operation. Examples of conditions and final equalised temperaturesare given in Table 6.14. Typical temperature histories at the surface and thermal centre ofbacks tempered at −30◦C, 3.0 m s−1 and −35◦C, 1.0 m s−1 are shown in Fig. 6.10. Surfacetemperatures tended to be a few degrees lower after 3 hours at −35◦C than at −30◦C, whilstcentre temperatures were very similar, approximately −6◦C. In each case the maximumtemperature difference across the backs was less than 1◦C after 3 hours in the equalisationroom and the temperature within any part of the back was within 1◦C of the room temperatureafter 7 hours.
It is critical that the refrigeration system is sized to extract the required amount of heatfrom the bacon. The energy released per kg of bacon in each half-hour period duringone experiment varied by a factor of 2.7 from 0.0139 kW h kg−1 to 0.0051 kW h kg−1
(Fig. 6.10). The mean total energy extracted per kg of bacon in the 3-hour operation was0.0535 kW h kg−1.
In a two-stage system there are several practical considerations. In one study a 3-hourblast freeze operation at −35◦C, 1.0 m s−1 obtained the desired equilibrium temperature of−9.5◦C and achieved the lowest weight loss of 0.55%. However, these conditions were verycritical and would not allow for a pull down period after loading, and the use of slightlythicker backs or bacon with a higher salt content. Adding heaters to the equalisation room to
00.0020.0040.0060.008
0.010.0120.0140.016
0–0.5 0.5–1 1–1.5 1.5–2 2–2.5 2.5–3
Time (h)
Ene
rgy
(kW
h k
g−1 )
Fig. 6.10 Energy released (kW h kg−1) by bacon backs over 0.5 hour intervals during blast freezing at−30◦C, 3.0 m s−1 (source: James and Bailey, 1987b).
BLUK139-Evans January 23, 2008 17:29
Freezing of Meat 141
provide exact temperature control with slightly negative product load was considered moreviable than trying to control the refrigeration against the positive load likely in practice. Airdistribution and control would also be less exact at 3 m s−1 and a variation of ±0.5 m s−1 inair velocity over the bacon backs would have far less effect on the final equalised temperaturethan a similar variation about a mean of 1.0 m s−1. Operating conditions of −30◦C, 3.0 ms−1 were therefore chosen for this particular industrial plant, because they were less criticaland provided a degree of flexibility.
Investigations have showed clearly the need to size the refrigeration system to meet theinitial rate of heat release from the warm bacon backs (James 1997). In trials an experimentalfreezer was unable to maintain the desired set point of −30◦C but rose to −27◦C immediatelyafter loading and took 1.5 hours to fully recover. The average equalised temperature in thistrial was 0.6◦C higher than in two successive trials where less bacon was used and the freezerreached −30◦C within minutes of loading. Although the average rate of heat release from thebacon backs during the freezing operation was 0.0175 kW kg−1 the refrigeration plant had tohave twice this capacity to meet the rate of release during the first 0.5 hour. In the industrialsituation heat ingress through the open door during loading and the considerable coolingrequirement of the supporting racks also have to be taken into consideration. One practicalsolution is a central refrigeration plant serving a number of separate freezing chambers.These can be loaded and unloaded in a sequence to provide the plant with a nearly constantrefrigeration load enabling it to operate at optimum efficiency.
6.7 FROZEN STORAGE OF MEAT AND MEAT PRODUCTS
There are clear differences between the environmental conditions required for cooling, whichis a heat removal/temperature reduction process, and those required for storage where the aimis to maintain a set product temperature. Extensive data are available on the optimum storageconditions and attainable frozen storage lives for many products (IIR, 1986; ASHRAE, 2006).
Since the bacteria found on meat will not grow at a temperature below −12◦C changesin microbial levels are not a factor in the frozen storage life of meat. Freezing and frozenstorage may in fact improve the safety of the meat. Georgsson et al. (2006), for example,found that freezing poultry and storing in for 30 days reduced the levels of Campylobacter byup to 2.87log cfu (kg of carcass)−1. However, similar reductions were not found with faecalcoliforms. While Sandberg et al., (2005) reported a 2log cfu g−1 reduction in Campylobacterafter 3 weeks at −20◦C. On beef trimmings Moorhead and Dykes (2002) reported a 0.6–2.2log cfu g−1 reduction in the first 7 days of storage at −18◦C.
The factors that influence the storage life of frozen meat may act in any one of three stagesprior to freezing, during the actual freezing process (already discussed) and post-freezing inthe storage period itself (James and Evans, 1997).
6.7.1 Pre-freezing treatment
Some pre-freezing factors, i.e. species differences, animal to animal variation or differencesbetween cuts of meat, are inherent in the animal. There are also other factors including feedingand transport that may have an effect on frozen storage.
Species is the main pre-freezing factor that is commonly believed to influence the frozenstorage life. Table 6.15 provides data from three sources on the storage life of meat fromdifferent species and the average and range from all the publications located.
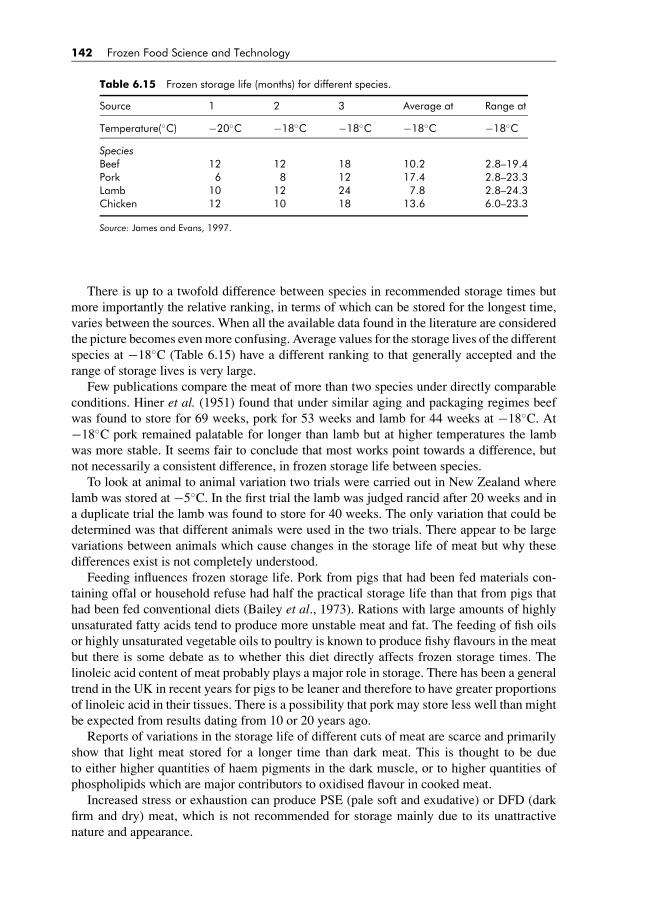
BLUK139-Evans January 23, 2008 17:29
142 Frozen Food Science and Technology
Table 6.15 Frozen storage life (months) for different species.
Source 1 2 3 Average at Range at
Temperature(◦C) −20◦C −18◦C −18◦C −18◦C −18◦C
SpeciesBeef 12 12 18 10.2 2.8–19.4Pork 6 8 12 17.4 2.8–23.3Lamb 10 12 24 7.8 2.8–24.3Chicken 12 10 18 13.6 6.0–23.3
Source: James and Evans, 1997.
There is up to a twofold difference between species in recommended storage times butmore importantly the relative ranking, in terms of which can be stored for the longest time,varies between the sources. When all the available data found in the literature are consideredthe picture becomes even more confusing. Average values for the storage lives of the differentspecies at −18◦C (Table 6.15) have a different ranking to that generally accepted and therange of storage lives is very large.
Few publications compare the meat of more than two species under directly comparableconditions. Hiner et al. (1951) found that under similar aging and packaging regimes beefwas found to store for 69 weeks, pork for 53 weeks and lamb for 44 weeks at −18◦C. At−18◦C pork remained palatable for longer than lamb but at higher temperatures the lambwas more stable. It seems fair to conclude that most works point towards a difference, butnot necessarily a consistent difference, in frozen storage life between species.
To look at animal to animal variation two trials were carried out in New Zealand wherelamb was stored at −5◦C. In the first trial the lamb was judged rancid after 20 weeks and ina duplicate trial the lamb was found to store for 40 weeks. The only variation that could bedetermined was that different animals were used in the two trials. There appear to be largevariations between animals which cause changes in the storage life of meat but why thesedifferences exist is not completely understood.
Feeding influences frozen storage life. Pork from pigs that had been fed materials con-taining offal or household refuse had half the practical storage life than that from pigs thathad been fed conventional diets (Bailey et al., 1973). Rations with large amounts of highlyunsaturated fatty acids tend to produce more unstable meat and fat. The feeding of fish oilsor highly unsaturated vegetable oils to poultry is known to produce fishy flavours in the meatbut there is some debate as to whether this diet directly affects frozen storage times. Thelinoleic acid content of meat probably plays a major role in storage. There has been a generaltrend in the UK in recent years for pigs to be leaner and therefore to have greater proportionsof linoleic acid in their tissues. There is a possibility that pork may store less well than mightbe expected from results dating from 10 or 20 years ago.
Reports of variations in the storage life of different cuts of meat are scarce and primarilyshow that light meat stored for a longer time than dark meat. This is thought to be dueto either higher quantities of haem pigments in the dark muscle, or to higher quantities ofphospholipids which are major contributors to oxidised flavour in cooked meat.
Increased stress or exhaustion can produce PSE (pale soft and exudative) or DFD (darkfirm and dry) meat, which is not recommended for storage mainly due to its unattractivenature and appearance.

BLUK139-Evans January 23, 2008 17:29
Freezing of Meat 143
Meat is generally not frozen until rigor is complete and a degree of conditioning hastaken place, otherwise toughening and increased drip can occur. In red meat, there is littleevidence of any relationship between chilling rates and frozen storage life. However, thereis evidence that increasing the time in chilled storage before freezing reduces frozen storagelife. Carcasses that have been electrically stimulated have prolonged storage lives and thiscould be attributed to the shorter interval between slaughter and freezing. In poultry, chillingmethod does have an effect on storage life. Air-chilled broilers had significant flavour changesafter 3 months at −12◦C and −20◦C, whereas immersion-chilled birds only exhibited changesat −12◦C after 6 months and were stable at −20◦C. Water chilling of broilers produced amore favourable taste in the leg and breast meat than air chilling. Thielke et al., (2005) foundthat ageing of poultry carcasses for at least 6 hours after chilling and prior to deboning andfreezing improved the texture of cooked breast fillets.
Processing of meat prior to freezing generally results in a longer storage time. Heatingprior to freezing can result in a 50% longer PSL (practical storage life) for sausages. However,the heating process could be critical since muscles cooked to higher temperatures are mostsusceptible to oxidative changes during storage. Heat treatments such as frying tend to produceshort storage lives, probably because of the high fat content of the product. Breaded productsare often fried and although breading alone may have a protective effect on a product, theaddition of oil may have a counteractive effect.
A process such as mincing has been found to effect storage of comminuted products, thisis probably due to the induced heating and the increased surface area that results. Additionof fat to mince can lower storage life unless a high-grade wrapping material, which has theability to exclude air, is used to wrap the product. Smoking is generally advantageous due tothe antioxidant properties of the smoke. Smoked broilers and ham store well for over a yearwithout serious quality change.
Additives, such as spices, seasoning, antioxidants and protein concentrates can influencestorage life. The use of vegetable extracts such as onion juice, yellow onion peel, hot waterextracts of aubergine (egg plant), potatoes and sweet potatoes have been shown to help controlrancidity in beef and turkey meat. However, an addition of salt may also reduce the storage lifedue to increased rancidity. Mechanically recovered meat is used in a range of meat products,but can cause storage problems due to its high fat content and increased rancidity (James andEvans, 1997).
6.7.2 During Frozen Storage
Three factors during storage – the storage temperature, the degree of fluctuation in the storagetemperature and the type of wrapping/packaging in which the meat is stored – are commonlybelieved to have the main influence on frozen storage life.
6.7.2.1 Storage temperature
To quote from the IIR Red book, “storage life of nearly all frozen foods is dependent onthe temperature of storage . . .” and in the book a table is provided of practical storage livesof different foods at three storage temperatures, extract in Table 6.16. However, few papershave been located where data are presented from experiments on the PSL of meat at differentstorage temperatures. Many of those that have been located are on products that do not meetthe lower temperature–longer storage rule (normal stability).

BLUK139-Evans January 23, 2008 17:29
144 Frozen Food Science and Technology
Table 6.16 Practical storage life (months) at different storagetemperatures.
Product −12◦C −18◦C −24◦C
Beef carcasses 8 15 24Beef steaks/cuts 8 18 24Ground beef 6 10 15Veal carcass 6 12 15Veal steaks/cuts 6 12 15Lamb carcasses 18 24 >24Lamb steaks 12 18 24Pork carcasses 6 10 15Pork steaks/cuts 6 10 15Sliced bacon (vac.) 12 12 12Chicken, whole 9 18 >24Chicken parts/cuts 9 18 >24Turkey, whole 8 15 >24Ducks, Geese, whole 6 12 18Liver 4 12 18
Source: IIR, 1986.
Experimental data from many different publications have been plotted against the temper-ature of storage for beef (Fig. 6.11), pork (Fig. 6.12) and lamb (Fig. 6.13). There is a cleareffect of temperature on storage life, with lower temperatures resulting in extended storage,but considerable scatter between results at any one temperature.
It has been shown that rancidity in bacon is increased by higher salt content and that therates of chemical reactions are accelerated as the temperature is lowered when packed inpermeable wrap. Cured pork products are known to have an abnormal temperature profilebetween −5◦C and −60◦C and store less well between −30◦C and −40◦C.
Improved aroma scores have been found to be moderately related to lower freezing tem-peratures, but not related to flavour. Aroma scores for minced beef improved during 6–12month storage at −12.2◦C, −17.8◦C or −23.3◦C, although a slight increase in rancidity alsooccurred.
Work in New Zealand (Winger, 1984) has found that consumer panels are often not verysensitive to quality changes and could not tell the difference between samples of lamb storedat −5◦C and −35◦C. A trained taste panel could differentiate between the two temperaturesand scored the samples stored at −5◦C as rancid.
6.7.2.2 Temperature fluctuation
Generally, fluctuating temperatures in storage are considered to be detrimental to the product.However, it has been reported that repeated freeze–thaw cycles do not cause any essentialchange in the muscle ultrastructure (Carrol et al., 1981) and that several freeze–thaw cyclesduring a product’s life cause only small quality damage (Wirth, 1979) or possibly no damageat all. In fact, a slight but significant improvement in samples that had been frozen andunfrozen several times was found by a taste panel (Jul, 1982).
Minor temperature fluctuations in a stored product are generally considered unimportant,especially if they are below −18◦C and are only of the magnitude of 1–2◦C. Well-packedproducts and those that are tightly packed in palletised cartons are also less likely to show

BLUK139-Evans January 23, 2008 17:29
Freezing of Meat 145
0−10−20−30−400
200
400
600
800
1000
1200
Temperature (°C)
Sto
rage
life
of b
eef (
days
)
Fig. 6.11 Experimental data on storage life of beef at different temperatures (source: James and Evans,1997).
0−10−20−30−400
200
400
600
800
1000
1200
Temperature (°C)
Sto
rage
life
of p
ork
(day
s)
Fig. 6.12 Experimental data on storage life of pork at different temperatures (source: James and Evans,1997).
0−10−20−30−400
200
400
600
800
1000
1200
Temperature (°C)
Sto
rage
life
of l
amb
(day
s)
Fig. 6.13 Experimental data on storage life of lamb at different temperatures (source: James and Evans,1997).

BLUK139-Evans January 23, 2008 17:29
146 Frozen Food Science and Technology
quality loss. However, poorly packed samples are severely affected by the temperature swings.There is disagreement on how much effect larger temperature fluctuations have on a product.Some authors consider temperature fluctuations have the same effect on quality of the productas storage has at an average constant temperature (Dawson, 1969); others consider fluctu-ations may have an additive effect (Van Arsdel, 1969; Bech-Jacobsen and Bøgh-Sørensen,1984). There is evidence that exposure to temperatures above −18◦C rather than temperaturefluctuations may be the major factor influencing quality deterioration (Gortner et al., 1948).Although Reid and Perez Albeta (2006) found that temperature fluctuations of 5◦C or 10◦Cabout a −17◦C mean increased weight loss from a model system by approximately 0.1% and0.3%, respectively.
6.7.2.3 Packaging
Packaging has a large direct effect on storage life, especially in fatty foods and in extremecases indirectly due to substantially increasing the freezing time. There are a number ofsuch instances where large pallet loads of warm, boxed meat have been frozen in storagerooms. In these cases, freezing times can be so great that bacterial and enzymic activityresults in a reduction of storage life. In most cases, it is the material and type of packagingthat influences frozen storage life. Wrapping in a tightly fitting pack having a low water andoxygen permeability (such as a vacuum pack) can more than double the storage life of aproduct. Waterproof packing also helps us to prevent freezer burn and tight packing helps toprevent an ice build up in the pack. When a product is breaded, packaging appears to havelittle effect and in a trial where breaded pork chops and breaded ground pork were packed inpoor and very good packs, an effect of packing could not be found (Van Arsdel, 1969).
Rancidity occurs in unwrapped meat because its surface dries, allowing oxygen to reachsubcutaneous fat. Without wrapping, freezer burn may occur causing extreme toughening andthe development of rancidity in the affected area. Packaging can be effective in some cases inreducing discolouration by lessening oxygen penetration into the meat. Lighting, especiallyultra-violet, can also increase fat oxidation (Volz et al., 1949; Lentz, 1971). Exposure to thelevels of light found in many retail frozen food display areas can cause appreciable colourchange within 1–3 days. Development of off flavour can be accelerated and may be noticeablewithin 1–2 months on display. Products kept in dark or opaque packages may therefore beexpected to retain colour longer than those exposed to the light.
6.8 TYPES OF STORAGE ROOM
6.8.1 Bulk storage rooms
Most unwrapped meat and poultry and all types of wrapped foods are stored in largeair-circulated rooms. To minimise weight loss and appearance changes associated withdesiccation, air movement around the unwrapped product should be the minimum required tomaintain a constant temperature. With wrapped products low air velocities are also desirableto minimise energy consumption. However, many storage rooms are designed and constructedwith little regard to air distribution and localised velocities over products. Horizontal throwrefrigeration coils are often mounted in the free space above the racks or rails of product andno attempt is made to distribute the air around the products.
BLUK139-Evans January 23, 2008 17:29
Freezing of Meat 147
Using a false ceiling or other form of ducting to distribute the air throughout the storageroom can substantially reduce variations in velocity and temperature.
6.8.2 Controlled atmosphere storage rooms
Controlled atmosphere storage rooms were developed for specialised fruit stores, especiallythose for apples. Interest is growing in the application of this technique to other commoditiesincluding meat. In addition to the normal temperature control plant, these stores also includespecial gas-tight seals to maintain an atmosphere that is normally lower in oxygen and higherin nitrogen and carbon dioxide than air. Additional plant is required to control the CO2
concentration, generate nitrogen and consume oxygen.
6.8.3 Jacketed cold stores
Cooling the walls, floor and ceiling of a store produces very good temperature control in theenclosed space with the minimum of air movement. It is especially suitable for CA storage andfor unwrapped produce that are very sensitive to air movement or temperature fluctuations.The refrigerated jacket can be provided by embedding pipe coils in the structure or utilisinga double skin construction through which refrigerated air is circulated.
Although the refrigerated jacket is efficient in absorbing any heat input from the sur-roundings the lack of air circulation within the enclosed space means that heat removal fromthe product is very limited. Care must therefore be taken to (a) attain the desired storagetemperature throughout the product before storing, (b) minimise any heat loads producedduring loading and unloading, and (c) provide the supplementary refrigeration required forany products which respire.
6.9 CONCLUSIONS
(1) Under commercial conditions differences in freezing rates are unlikely to produce no-ticeable changes in the organoleptic quality of the meat produced. However, currentlegislation requires a minimum meat temperature of −12◦C to be achieved before meatis moved from the freezing system. Freezing time is therefore of considerable economicimportance.
(2) Most unprocessed meat is either frozen in batch air systems as bone in carcasses, sidesor quarters, or boned out in cartons. Freezing times in such systems are typically 25–72hours. Some offal is frozen in plate freezers.
(3) Small processed items are typically frozen in continuous belt freezers or in cryogenictunnels.
(4) Crust freezing and tempering are increasingly being used to allow high-speed mechan-ical portioning or slicing of meat and meat products. The final temperature distributionproduced by the freezing system is critical in such operations.
Although a great deal has been written on the frozen storage life of different meats, the un-derlying data are backed up by a relatively small number of controlled scientific experiments.Much of the scientific data date back to the time when meat was either stored unwrappedor in wrapping materials that are no longer used. It is not surprising when we consider the
BLUK139-Evans January 23, 2008 17:29
148 Frozen Food Science and Technology
changes in packaging and handling methods over the last century that there is a considerablescatter in data on storage lives for similar products.
In recent years energy conservation requirements have caused an increased interest inthe possibility of using more efficient storage temperatures than have been used to date.Researchers such as Jul have questioned the wisdom of storage below −20◦C and have askedwhether there is any real economic advantage in very low temperature preservation. There isa growing realisation that storage lives of several foods can be less dependent on temperaturethan previously thought. Since research has shown that meat and poultry often producenon-linear time–temperature curves, there is probably an optimum storage temperature for aparticular product. Improved packing and preservation of products can also increase storagelife and may allow higher storage temperatures to be used. One suggestion is that with storageat −18◦C, low stability meats such as mechanically recovered meat should be stored for 8months or less, medium stability meats such as pork and processed meats should be storedfor between 8 and 15 months, and high stability meats, which include all meat and poultryexcept pork, could be stored for more than 15 months.
REFERENCES
Anon, M.C. and Calvelo, A. (1980). Freezing rate effects on the drip loss of frozen beef. Meat Science 4,1–14.
ASHRAE (2006). Refrigeration Handbook, sections 9–29.Bailey, C., Cutting, C.L., Enser, N. and Rhodes, D.N. (1973). The influence of slaughter weight on the stability
of pork sides in frozen storage. Journal of Science of Food and Agriculture 24, 1299.Bech-Jacobsen, K. and Bøgh-Sørensen, L. (1984). TTT-Studies of different retail packed pork products.
In: P. Zeuthen, J.C. Cheftel, C. Eriksson, M. Jul, H. Leniger, P. Linko, G. Varela and G. Vos, eds. ThermalProcessing and Quality of Foods. Elsevier Applied Science Publishers, pp. 716–720.
Berry, B.W. and Leddy, K.F. (1989). Effects of freezing rate, frozen storage temperature and storage time ontenderness values of beef patties. Journal of Food Science 54(2), 291–296.
Bevilacqua, A., Zaritzky, N.E. and Cavelo, A. (1979). Histological measurements of ice in frozen beef.Journal of Food Technology 14, 237–251.
Bishop, E. (1972). Poultry freezing. Refrigeration and Air Conditioning 75, 37–40, 85.Brown, T. and James, S.J. (2006). The effect of air temperature, velocity and visual lean composition on the
tempering time of frozen beef blocks. International Journal of Refrigeration 73, 545–552.Buchmuller, J. (1986). Chilling and freezing meat products with liquid nitrogen. Fleischwirtschaft 66(4),
568–570.Callow, E.H. (1929). The freezing and storage of mild cured bacon. DSIR Department Food Investigation
Board 67–73.Carrol, R.J., Cavanaugh, R.J. and Rorer, F.P. (1981). Effects of frozen storage on the ultrastructure of bovine
muscle. Journal of Food Science 46, 1091–1094, 1102.Castell-Perez, M.E., Heldman, D.R. and Steffe, J.F. (1989). Computer simulation of microbial growth during
freezing and frozen food storage. Journal of Food Process Engineering 10, 249–268.Creed, P.G. and James, S.J. (1981). A survey of commercial meat block freezing in the United Kingdom and
Eire. International Journal of Refrigeration 4, 348–354.Creed, P.G. and James, S.J. (1983). The freezing times of liver in a vertical plate freezer. In: Progress in
Refrigeration Science and Technology, Proceedings of the XVI International Congress of Refrigeration,Tome III. Paris (France). 4, pp. 145–151.
Creed, P.G. and James, S.J. (1984). The prediction of freezing and thawing times of mutton carcasses.In: Proceedings of the 30th European Meeting of Meat Research Workers. Bristol. Paper 2:5, pp. 59–60.
Creed, P.G. and James, S.J. (1985). Heat transfer during the freezing of liver in a plate freezer. Journal ofFood Science 50, 285–288, 294.
Critchell, J.T. and Raymond, J. (1912). A History of the Frozen Meat Trade, 2nd edn. London: Constable &Company Ltd.
BLUK139-Evans January 23, 2008 17:29
Freezing of Meat 149
Dawson, L.E. (1969). Stability of frozen poultry meat and eggs. In: W.B. Van Arsdel, M.J. Copley and R.L.Olson, eds. Quality and Stability of Frozen Foods – Time-Temperature Tolerance and its Significance.pp. 143–167.
de Jong, R.S. (1994). Plate freezing technology and economics applied to the meat industry. In: ProceedingsIRHACE Technology Conference. Paper 11.
Dobryzcki, J., Pietrzak, E. and Hoser, A. (1977). Rheological characteristics of fresh and frozen chickenmuscles and their relation to tenderness measured by sensory methods. Acta Alimentaria 6(2), 107–111.
DuBois, C.W., Tressler, D.K. and Fenton, F. (1942). The effect of the rate of freezing and temperature ofstorage on the quality of frozen poultry. Refrigeration Engineering 44, 93–99, 111.
Esselen, W.B., Levine, A.S., Pflug, I.J. and Davis, L.L. (1954). Brine immersion cooling and freezing ofready to cook poultry. Refrigeration Engineering 62, 61–63.
Everington, D.W. (2001). Development of equipment for rapid freezing. In: Rapid Cooling of Food. Meetingof IIR Commission C2. Bristol, UK. Section 2, pp. 173–180.
Fernandez-Martin, F., Otero, L., Solas, M.T. and Sanz, P.D. (2000). Protein denaturation and structural damageduring high-pressure-shift freezing of porcine and bovine muscle. Journal of Food Science 65, 1002–1008.
Fleming, A.K., Chadderton, T., Amos, N.D. and Cleland, A.C. (1996). Non-traditional refrigeration tech-nologies for the New Zealand meat industry. MIRINZ publication 961, ISSN 0465-4390.
Georgsson, F., Porkelsson, A.E., Geirsdottir, M., Reiersen, J. and Stern, N.J. (2006). The influence of freezingand duration of storage on Campylobacter and indicator bacteria in broiler carcasses. Food Microbiology23(7), 677–683.
Gortner, W.A., Fenton, F., Volz, F.E. and Gleim, E. (1948). Effect of fluctuating storage temperatures onquality of frozen food. Industrial Engineering Chemistry 40, 1423–1246.
Grujic, R., Petrovic, L., Pikula, B. and Amidzic, L. (1993). Definition of the optimum freezing rate – 1,investigation of structure and ultrastructure of beef M . longissimus dorsi frozen at different freezing rates.Meat Science 33, 301–318.
Hanenian, R., Mittal, G.S. and Usborne, W.R. (1989). Effects of pre-chilling, freezing rate, and storage timeon beef patty quality. Journal of Food Science 54(3), 532–535.
Hill, M.A. and Glew, G. (1973). Organoleptic assessment of products frozen two methods: liquid nitrogenand blast freezing. Journal of Food Technology 8, 205–210.
Hiner, R.L., Gaddis, A.M. and Hankins, O.G. (1951). Effect of methods of protection, palatability of freezerstored meat. Food Technology 223–229.
International Institute of Refrigeration. (1986). Recommendations for the Processing and Handling of FrozenFoods, 3rd edn.
Jackobsson, B. and Bengtson, N. (1973). Freezing of raw beef: influence of ageing, freezing rate and cookingmethod on quality and yield. Journal of Food Science 38, 560–565.
James, S.J. and Bailey, C. (1979). The determination of freezing time of boxed meat blocks. In: The Proceed-ings of the Institute of Refrigeration. Session (1978–79), pp. 1–8.
James, S.J. and Bailey, C. (1987). The freezing of beef quarters. In: Proceedings XVII International Congressof Refrigeration C, Vienna (Austria), C2-4.
James, S.J. and Bailey, C. (1987b). Bacon tempering for high speed slicing. In: Proceedings XVII InternationalCongress of Refrigeration C, Vienna (Austria), C2-1.
James, S.J., Nair, C. and Bailey, C. (1983). The effects of freezing and thawing rates on the drip loss fromfrozen beef. In: P. Zeuthen, et al. eds. Thermal Processing and the Quality of Foods, 1st edn. London &New York: Elsevier Applied Science Publishers, pp. 807–813.
James, S.J. (1997). Bacon tempering for high speed slicing. In: Proc. Meat Refrigeration – Why and How?EU concerted action programme CT94 1881, Langford, UK.
James, S.J. and Evans, J.A. (1997). Frozen storage of meat and meat products. FAIR Concerted ActionPL95-1180.
Jul, M. (1982). The intricacies of the freezer chain. International Journal of Refrigeration 5, 226–230.Kondratowicz, J., Bak, T. and Denaburski, J. (2000). Influence of the freezing procedure – Characteristics of
normal pork, as well as pork with PSE- and DFD-traits. Fleischwirtschaft 80, 81–83.Lammertz, M. and Brixy, N. (2001). Continuous process and production improvements by application of
refrigeration with cryogenic gases. In: Rapid Cooling of food, Meeting of IIR Commission C2, Bristol, UK.Lampitt, L.H. and Moran, T. (1933). The palatability of rapidly frozen meat. Journal of the Society of Chemical
Industry 52, L11.21 143t–146t.Le Bail, A., Chevalier, D., Mussa, D.M. and Ghoul, M. (2002). High pressure freezing and thawing of foods:
a review. International Journal of Refrigeration 25, 504–513.

BLUK139-Evans January 23, 2008 17:29
150 Frozen Food Science and Technology
Lentz, C.P. (1971). Effect of light and temperature on colour and flavour of pre-packaged frozen beef.Canadian Institute of Food Science and Technology Journal 4, 166.
Maria, G.T., Abril, J. and Casp, A. (2005). Surface heat transfer coefficients for refrigeration and freezing offoods immersed in an ice slurry. International Journal of Refrigeration 28, 1040–1047.
Mascheroni, R.H. (1985). Generalisation of a method for the characterization of quick frozen beef. MeatScience 13, 81–89.
Mittal, G.S. and Barbut, S. (1991). Effects of freezing rate and storage time on the structural properties ofminced meat. Lebensmittel – Wissenschaft und -Technologie 24, 226–230.
Moorhead, S.M. and Dykes, G.A. (2002). Survival of Campylobacter jejuni on beef trimmings during freezingand frozen storage. Letters in Applied Microbiology 34, 72–76.
Newman, M. (2001). Cryogenic impingement freezing utilizing atomized liquid nitrogen for the rapid freezingof food products. In: Rapid Cooling of food, Meeting of IIR Commission C2, Bristol, UK.
Ngapo, T.M., Babare, I.H., Reynolds, J. and Mawson, R.F. (1999). Freezing and thawing rate effects on driploss from samples of pork. Meat Science 53, 149–158.
Persson, P.O. and Londahl, G. (1993). Freezing technology. In: C.P. Mallett, ed. Frozen Food Technology,Chapter 2. Blackie Academic & Professional.
Petrovic, L., Grujic, R. and Petrovic, M. (1993). Definition of the optimal freezing rate – 2 Investigationsof the physico-chemical properties of beef M . longissimus dorsi frozen at different freezing rates. MeatScience 33, 319–331.
Reid, D.S. and Perez Albeta, L. (2006). The effect of average storage temperature, and temperature fluctuationon the rate of moisture migration in a model frozen food. IUFoST 1979–1988.
Sacks, B., Casey, N.H., Boshof, E. and van Zyl, H. (1993). Influence of freezing method on thaw drip andprotein loss of low-voltage electrically stimulated and non-stimulated sheep’s muscle. Meat Science 34,235–243.
Sakata, R., Oshida, T., Morita, H. and Nagata, Y. (1995). Physico-chemical and processing quality of porcineM. longissimus dorsi frozen at different temperatures. Meat Science 39, 277–284.
Sebranek, J.G. (1980). Cryogenic freezing of ground beef patties shows superior organoleptic effects. QuickFreezing August, 50–53.
Sandberg, M., Hofshagen, M., Ostensvik, O., Skjerve, E. and Innocent, G. (2005). Survival of Campylobacteron frozen broiler carcasses as a function of time. Journal of Food Protection 68, 1600–1605.
Sebranek, J.G., Sang, P.N., Rust, R.E., Topei, D.G. and Kraft, A.A. (1978). Influence of liquid nitrogen,liquid carbon dioxide and mechanical freezing on sensory properties of ground beef patties. Journal ofFood Science 43, 842–844.
Sundsten, S., Andersson, A. and Tornberg, E. (2001). The effect of the freezing rate on the quality ofhamburgers. In: Rapid Cooling of Food, Meeting of IIR Commission C2, Bristol, UK.
Swain, M.J. and James, S.J. (2005). Microwave thawing and tempering In: H. Schubert and Regier, M. eds.Microwave Processing of Food. Woodhead Publishing Limited.
Thielke, S., Lhafi, S.K. and Kuhne, M. (2005). Effects of aging prior to freezing on poultry meat tenderness.Poultry Science 84, 607–612.
Thumel, H. and Gamm, D. (1994). Loose rotary freezing. Fleischwirtschaft 74(1), 64–65.Van Arsdel, W.B. (1969). Estimating quality change from a known temperature history. In: W.B. Van Arsdel,
M.J. Copley and R.L. Olson, eds. Quality and Stability of Frozen Foods – Time-Temperature Toleranceand its Significance. pp. 237–262.
van den Berg, L. and Lentz, C.P. (1958). Factors affecting freezing rate and appearance of eviscerated poultryfrozen in air. Food Technology 12, 183–185.
Volz, F.E., Gortner, W.A., Pitz, E.W. and Miller, J.E. (1949). The effect of ultraviolet light in the meat cooleron the keeping quality of frozen pork. Food Technology 3, 4.
Wanous, M.P., Olson, D.G. and Kraft, A.A. (1989). Pallet location and freezing rate effect on the oxidationof lipids and myoglobin in commercial fresh pork sausage. Journal of Food Science 54(3), 549–552.
Winger, R.J. (1984). Storage life and eating related quality of New Zealand frozen lamb: a compendium ofirrepressible longevity. In: P. Zeuthen, J.C. Cheftel, C. Eriksson, M. Jul, H. Leniger, P. Linko, G. Varela andG. Vos, eds. Thermal Processing and Quality of Foods. Elsevier Applied Science publishers, pp. 541–552.
Wirth, F. (1979). Chilling, freezing, storage and handling of meat: present state of our knowledge. Fleis-chwirtscaft 59(12), 1857–1861.
Zhu, S.M., Le Bail, A., Chapleau, N., Ramaswamy, H.S. and de Lamballerie-Anton, M. (2004). Pressure shiftfreezing of pork muscle: effect on color, drip loss, texture, and protein stability. Biotechnology Progress20, 939–945.

BLUK139-Evans January 23, 2008 18:0
7 Freezing of Fish
Ola M. Magnussen, Anne K.T. Hemmingsen, VidarHardarsson, Tom S. Nordtvedt and Trygve M. Eikevik
7.1 INTRODUCTION
The term ‘fish’ covers a wide variety of species with very different characteristics, such asshape, appearance and size. The most common characteristic is that they mostly have gills, tail,and fins and that they are cold blooded. Shellfish is, however, often regarded to be in this group.The most characteristic difference between fish and animal products is the edible muscle. Inbeef, the fibres are running through the muscle and are strongly bound together by meansof connective tissue. Fish mainly live in ‘weightless’ condition in water and the fish muscleis made up of millions of fibres arranged in short segments or blocks. The short segmentsare linked together with connective tissue or a thin membrane of collagen material with lowmaterial strength. The fish muscle will therefore easily break, or the segments will separate onefrom another, by mechanical pressure or strain. This is often called gapping and is a commondefect for fish products if exposed to tough handling during catch, processing and freezing.
The most common fishes are often divided into two distinct groups, pelagic and demersal.Pelagic fish, like herring, sprat, mackerel and capelin live mainly in the upper layers of theseas. They feed on phytoplankton and zooplankton, which are abundant in spring and summer.Most pelagic fish have a high fat content, but with large variations due to the feeding season.Pelagic fish have thin and soft skin that is easily damaged during handling and freezing. Thefat fish muscle has low mechanical strength, and strain must be avoided during processingand freezing. Demersal fish, such as cod, haddock and pollock, and flatfishes live near orat the bottom of the seas. They feed mostly on other fish and organisms. The fat reserveis deposited mainly in the liver. The fillet/muscle is lean and a little more capable to resiststrain. Spawning generally puts considerable strain on the fish proteins and fat and muscletissue become watery and soft during the spawning season. The fillet quality and yield thenbecomes poorer and is not well suited for high-quality products.
Fish farming has lately become a big issue in many countries. Farming gives a high degreeof control of quality and fish size and reduces variations in products. The fish are slaughteredand handled in large centralized plants and are often frozen as gutted or as filleted products.Farmed fat fish, such as salmon and halibut, have, unlike pelagic fish, better mechanicalstrength of muscle and longer shelf-life as frozen products.
7.2 PRE-FREEZING EFFECTS
There is today increasing focus on methods for ethical slaughtering and killing of fish.Anaesthetization before slaughter is recommended to calm down the fish in order to reduce
Frozen Food Science and Technology. Edited by Judith A. Evans
© 2008 Blackwell Publishing Ltd, ISBN: 978-1-4051-5478-9
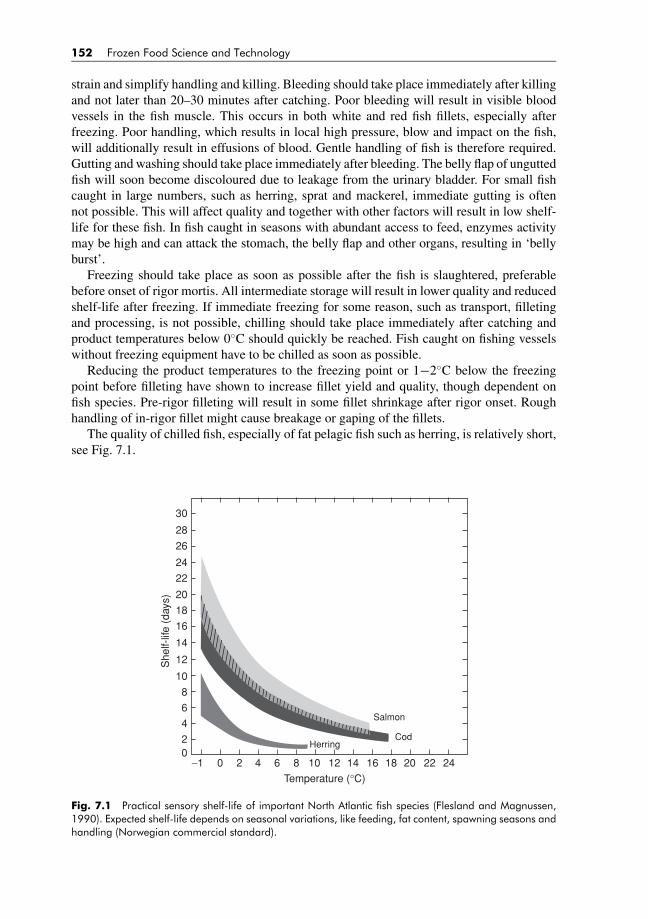
BLUK139-Evans January 23, 2008 18:0
152 Frozen Food Science and Technology
strain and simplify handling and killing. Bleeding should take place immediately after killingand not later than 20–30 minutes after catching. Poor bleeding will result in visible bloodvessels in the fish muscle. This occurs in both white and red fish fillets, especially afterfreezing. Poor handling, which results in local high pressure, blow and impact on the fish,will additionally result in effusions of blood. Gentle handling of fish is therefore required.Gutting and washing should take place immediately after bleeding. The belly flap of unguttedfish will soon become discoloured due to leakage from the urinary bladder. For small fishcaught in large numbers, such as herring, sprat and mackerel, immediate gutting is oftennot possible. This will affect quality and together with other factors will result in low shelf-life for these fish. In fish caught in seasons with abundant access to feed, enzymes activitymay be high and can attack the stomach, the belly flap and other organs, resulting in ‘bellyburst’.
Freezing should take place as soon as possible after the fish is slaughtered, preferablebefore onset of rigor mortis. All intermediate storage will result in lower quality and reducedshelf-life after freezing. If immediate freezing for some reason, such as transport, filletingand processing, is not possible, chilling should take place immediately after catching andproduct temperatures below 0◦C should quickly be reached. Fish caught on fishing vesselswithout freezing equipment have to be chilled as soon as possible.
Reducing the product temperatures to the freezing point or 1−2◦C below the freezingpoint before filleting have shown to increase fillet yield and quality, though dependent onfish species. Pre-rigor filleting will result in some fillet shrinkage after rigor onset. Roughhandling of in-rigor fillet might cause breakage or gaping of the fillets.
The quality of chilled fish, especially of fat pelagic fish such as herring, is relatively short,see Fig. 7.1.
0−1 0 2 4 6 8 10 12 14 16 18 20 22 24
2
4
6
8
10
12
14
16
18
20
22
24
26
28
30
She
lf-lif
e (d
ays)
Temperature (°C)
Salmon
HerringCod
Fig. 7.1 Practical sensory shelf-life of important North Atlantic fish species (Flesland and Magnussen,1990). Expected shelf-life depends on seasonal variations, like feeding, fat content, spawning seasons andhandling (Norwegian commercial standard).
BLUK139-Evans January 23, 2008 18:0
Freezing of Fish 153
Chill storage of fish before freezing will therefore reduce the shelf-life of the frozenproduct. Quality losses in fresh products depend to a large extent on micro-organisms presentin or around the products. The metabolism of the micro-organisms will mostly terminate infrozen conditions. There is today no appropriate general way to calculate the effect of chillstorage on frozen food quality. Effects of handling and chill storage on quality of frozen fishmust therefore be established for specific products and species.
7.3 EFFECTS OF FREEZING PARAMETERS
Since the start of microscopy of frozen food in around 1990, the effect of freezing rate andice crystal size on quality of frozen products have been discussed. Very fast freezing of smalltissue parts may give small ice crystals distributed inside the cells. The effect of very fastfreezing rate on practical food quality is, however, still discussed. The freezing rate requiredis very high and can only be achieved with very efficient heat transfer and large temperaturedifferences (cryogenic freezing, N2 or CO2). Even then, the freezing rate giving small icecrystals is high enough only on the surface of commercial products. Since the freezing rate isreduced almost proportionally to the square of the ice layer thickness, the ice crystal size anddistribution will vary throughout the product. For practical purposes, the effect of freezingrate on quality of most fish products is not proved. However, quality effects of freezing rateand requirements should be tested for new products.
Phase change from liquid to solid water will, different from solidification of most otherliquids, give a volume increase and a density reduction of about 5–7%. During freezing ofmost commercial products and commonly used freezers, the ice formation starts on the surfaceand heat is transferred through an increasing layer of ice. The internal volume increases dueto crystallization of freezeable water. With the most commonly used freezing temperatures,there will still be some liquid inside the muscle after freezing. The volume increase is probablyallowed by expansion and movement in unfrozen parts and no visible cracking is seen. Use ofvery low temperatures will often result in surface/ice temperatures where almost all liquid isfrozen and what is termed ‘glassy state’ exists. The result is little or no expansion possibilitiesand the build-up of high internal forces until the material cracks in the weakest parts. Thelimits for low temperatures on product surfaces and expansion possibilities during freezingshould therefore be examined when low freezing temperatures are used.
7.4 FREEZING METHODS
In general, the fish processing companies handle and process a number of fish species andproducts. The products may have different packing, products size and freezing times, whichoften require flexible freezing equipment and the possibility to handle a variety of items.Selection of freezers is often challenging and demand careful evaluation of the volumes andthe requirements for the most important products, seasonal variations and possible use for newproducts. The result is often general equipment which is labour intensive for most productsgiving relative high costs. The variations in products, freezing times and volumes give largevariations in refrigeration load. There is frequent use of a few large screw compressors withcapacity control by slide valve regulation and simple capacity control, which often result inhigh-energy consumption at part load. Improved systems, for example with such frequencycontrol as should be used to improve energy efficiency. Measurements on a fish processing
BLUK139-Evans January 23, 2008 18:0
154 Frozen Food Science and Technology
plant have shown almost constant energy consumption regardless of freezing demand andprocessing volume. It is therefore strongly recommended to select refrigeration systemscapable to cover the variations in load with high energy efficiency. Careful selection ofcompressors, capacity control and use of frequency control of compressors and fans shouldbe used. Most plants also have large consumption of hot water for cleaning, washing androom heating. To a large extent this should be covered by energy recovery from oil coolersof screw compressors and/or high stage heat pumps and high-pressure compressors.
7.4.1 Air (gas) freezing
Due to the large variety of products to be frozen in most fish processing plants, air-blastfreezing is used in most companies. Multi-purpose air freezers can be used for most fishes,finished or semi-finished fish products, with acceptable results due to the air’s flow charac-teristics. On the other hand, the labour requirement, in order to achieve uniform and quickfreezing, is often high due to stacking and transport. Desiccation during freezing may causediscolouration of the skin and loss of the characteristic bright surface of high-quality freshfish. Batch freezing and poor airflow control often results in excessive running times of largefans to ensure freezing of all products. Weight losses of up to 5% have been measured forsmall consumer products. This will also result in high energy consumption for fans and com-pressors. Use of improved control and regulation systems is therefore recommended. A largenumber of types and arrangements of air-blast freezers exist, from the general-purpose typesto highly specialised units for one single product. In general, the main challenges are to ensureuniform flow of the fluid over product surfaces. Especially for the in situ built freezers, littleemphasis has been put on dimensioning, product arrangement and ensuring uniform airflow.Most of the existing air/gas freezer types are found in fish industry; description of the threemost common types follows.
7.4.1.1 Tunnel freezers
Tunnel freezers are flexible freezers that can be used for fish products of all sizes and geome-tries, packed or non-packed. Products should be placed on racks with shelf space adapted toproduct height to allow uniform air flow over the products. Non-packed products will stickto the shelves and tunnel freezers are therefore mainly used for freezing of packed products.The packing material, size and geometry often have strong effects on freezing time. Lowthermal conductivity of the packing material and air gaps between packing and product maygreatly reduce the heat transer. With the common thickness of products or packing used in thebulk freezing of fish, freezing times of many hours is common. As an example, the freezingof pelagic fish in standard 20-kg packing boxes is shown in Fig. 7.2.
The packing and the air layer between the fish and the lid result in almost no heat flowthrough the lid. Additionally, with dense stacking on shelves, freezing takes place onlyfrom the bottom of the package. Common batch freezing requires 18–20 hours, which whenincluding hours for loading and unloading, results in total freezing times of 24 hours or more.Packing is expensive; substancial cost reductions are possible by use of plastic bags. Freezingtime will then also be greatly reduced. Traditionally, air flow over a number of shelves throughthe tunnel is used, resulting in large temperature increases in the air, especially during themain freezing period. This results in differences in the freezing time and excessive totalrunning of fans and compressors.
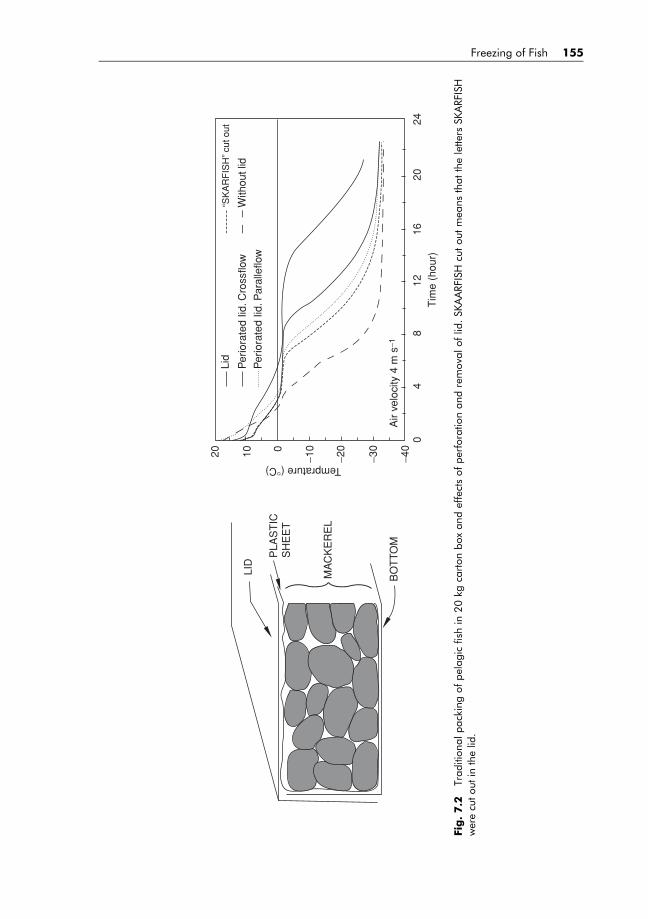
BLUK139-Evans January 23, 2008 18:0
Freezing of Fish 155
Lid
20 10 0
−10
−20
−30
−40
04
812
Tim
e (h
our)
Air
velo
city
4 m
s−1
BO
TTO
M
MA
CK
ER
EL
PLA
ST
IC
SH
EE
T
LID
Temprature (°C)
1620
24
Per
iora
ted
Iid. C
ross
flow
With
out l
id
“SK
AR
FIS
H” c
ut o
ut
Per
iora
ted
Iid. P
aral
leflo
w
Fig
.7.2
Trad
ition
alpa
ckin
gof
pela
gic
fish
in20
kgca
rton
box
and
effe
cts
ofpe
rfor
atio
nan
dre
mov
alof
lid.
SKA
ARF
ISH
cuto
utm
eans
that
the
lette
rsSK
ARF
ISH
wer
ecu
tout
inth
elid
.

BLUK139-Evans January 23, 2008 18:0
156 Frozen Food Science and Technology
Fig. 7.3 Batch type air-blast freezer for pelagic fish and airflow simulation.
A diagram of a modern air-blast freezer for pelagic fish is shown in Fig. 7.3. The principaldesign should be chosen from optimisation of airflow, temperatures, required capacity, fantypes and structural arrangements. Uniform airflow and freezing time should be designedby use of computer simulation. Energy consumption should be minimized by use of fandiffusers, fan speed control and adjustment of freezing time.
7.4.1.2 Continuous freezers
The increased demand for ready-made food from fish has greatly increased the industrialproduction of single frozen products. Although the main focus today is on fresh products,the industry has also seen a large increase in the production of frozen products, mainly dueto the short shelf-life of fresh fish. This has given a large demand for semi-finished frozenproducts which are thawed, processed and sold as ‘refreshed’. Efficient industrial productionrequires in-line processing and freezing within required times and to avoid discontinuity inthe processing line. Continuous air-blast freezers where the products are transported on abelt system are mainly used. To achieve fast freezing, low temperatures and high-velocityair over and/or vertically on the belts are required. Continuous multi-belt air-blast freezersand spiral freezers are often used. The continuous freezers are mainly used for freezingof non-packed products or vacuum or skin-packed products to obtain fast freezing. Weightlosses of typical wet fish surfaces of non-packed fish fillets can be reduced by the use of lowtemperatures.
The advantage of the multi-belt air-blast freezer (see Fig. 7.4) is the wide belts, whichpermit freezing of large fillets without changing their shape. By using stainless steel plate asthe belt marks on the fillets, often found with the use of stainless wire mesh belts or flexibleplastic parts, can be avoided. However, this requires enough length of the upper/first belt to
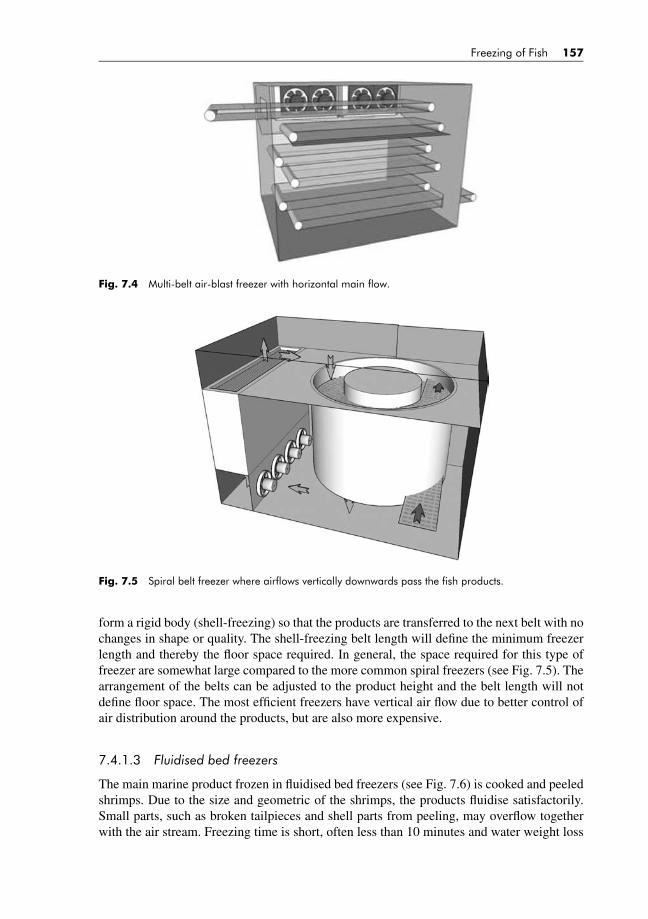
BLUK139-Evans January 23, 2008 18:0
Freezing of Fish 157
Fig. 7.4 Multi-belt air-blast freezer with horizontal main flow.
Fig. 7.5 Spiral belt freezer where airflows vertically downwards pass the fish products.
form a rigid body (shell-freezing) so that the products are transferred to the next belt with nochanges in shape or quality. The shell-freezing belt length will define the minimum freezerlength and thereby the floor space required. In general, the space required for this type offreezer are somewhat large compared to the more common spiral freezers (see Fig. 7.5). Thearrangement of the belts can be adjusted to the product height and the belt length will notdefine floor space. The most efficient freezers have vertical air flow due to better control ofair distribution around the products, but are also more expensive.
7.4.1.3 Fluidised bed freezers
The main marine product frozen in fluidised bed freezers (see Fig. 7.6) is cooked and peeledshrimps. Due to the size and geometric of the shrimps, the products fluidise satisfactorily.Small parts, such as broken tailpieces and shell parts from peeling, may overflow togetherwith the air stream. Freezing time is short, often less than 10 minutes and water weight loss
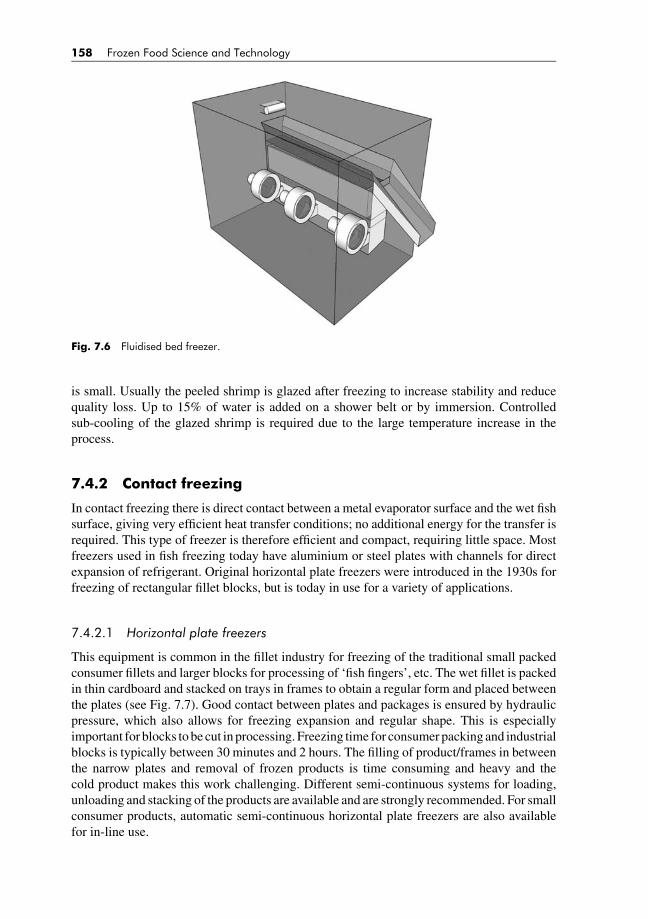
BLUK139-Evans January 23, 2008 18:0
158 Frozen Food Science and Technology
Fig. 7.6 Fluidised bed freezer.
is small. Usually the peeled shrimp is glazed after freezing to increase stability and reducequality loss. Up to 15% of water is added on a shower belt or by immersion. Controlledsub-cooling of the glazed shrimp is required due to the large temperature increase in theprocess.
7.4.2 Contact freezing
In contact freezing there is direct contact between a metal evaporator surface and the wet fishsurface, giving very efficient heat transfer conditions; no additional energy for the transfer isrequired. This type of freezer is therefore efficient and compact, requiring little space. Mostfreezers used in fish freezing today have aluminium or steel plates with channels for directexpansion of refrigerant. Original horizontal plate freezers were introduced in the 1930s forfreezing of rectangular fillet blocks, but is today in use for a variety of applications.
7.4.2.1 Horizontal plate freezers
This equipment is common in the fillet industry for freezing of the traditional small packedconsumer fillets and larger blocks for processing of ‘fish fingers’, etc. The wet fillet is packedin thin cardboard and stacked on trays in frames to obtain a regular form and placed betweenthe plates (see Fig. 7.7). Good contact between plates and packages is ensured by hydraulicpressure, which also allows for freezing expansion and regular shape. This is especiallyimportant for blocks to be cut in processing. Freezing time for consumer packing and industrialblocks is typically between 30 minutes and 2 hours. The filling of product/frames in betweenthe narrow plates and removal of frozen products is time consuming and heavy and thecold product makes this work challenging. Different semi-continuous systems for loading,unloading and stacking of the products are available and are strongly recommended. For smallconsumer products, automatic semi-continuous horizontal plate freezers are also availablefor in-line use.

BLUK139-Evans January 23, 2008 18:0
Freezing of Fish 159
Fig. 7.7 Contact freezer type horizontal plate freezer.
7.4.2.2 Vertical plate freezers
Compared to the horizontal plate freezer mainly used for processed fish products, the verticalversion developed later is a typical bulk volume freezer. Due to the vertical openings (seeFig. 7.8) the products can be filled in between the plates by weight or volume. For mostproducts, bulk product is required and the products are frozen to the plates. Some productsare, however, filled in a plastic bag before freezing. The plate position is controlled by a
Fig. 7.8 Contact freezing between vertical plates.
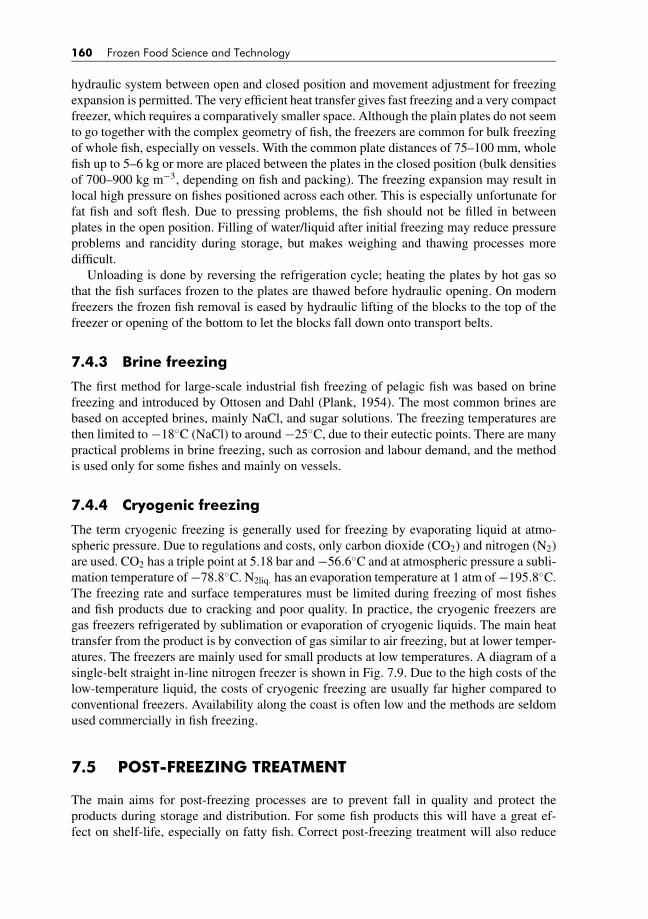
BLUK139-Evans January 23, 2008 18:0
160 Frozen Food Science and Technology
hydraulic system between open and closed position and movement adjustment for freezingexpansion is permitted. The very efficient heat transfer gives fast freezing and a very compactfreezer, which requires a comparatively smaller space. Although the plain plates do not seemto go together with the complex geometry of fish, the freezers are common for bulk freezingof whole fish, especially on vessels. With the common plate distances of 75–100 mm, wholefish up to 5–6 kg or more are placed between the plates in the closed position (bulk densitiesof 700–900 kg m−3, depending on fish and packing). The freezing expansion may result inlocal high pressure on fishes positioned across each other. This is especially unfortunate forfat fish and soft flesh. Due to pressing problems, the fish should not be filled in betweenplates in the open position. Filling of water/liquid after initial freezing may reduce pressureproblems and rancidity during storage, but makes weighing and thawing processes moredifficult.
Unloading is done by reversing the refrigeration cycle; heating the plates by hot gas sothat the fish surfaces frozen to the plates are thawed before hydraulic opening. On modernfreezers the frozen fish removal is eased by hydraulic lifting of the blocks to the top of thefreezer or opening of the bottom to let the blocks fall down onto transport belts.
7.4.3 Brine freezing
The first method for large-scale industrial fish freezing of pelagic fish was based on brinefreezing and introduced by Ottosen and Dahl (Plank, 1954). The most common brines arebased on accepted brines, mainly NaCl, and sugar solutions. The freezing temperatures arethen limited to −18◦C (NaCl) to around −25◦C, due to their eutectic points. There are manypractical problems in brine freezing, such as corrosion and labour demand, and the methodis used only for some fishes and mainly on vessels.
7.4.4 Cryogenic freezing
The term cryogenic freezing is generally used for freezing by evaporating liquid at atmo-spheric pressure. Due to regulations and costs, only carbon dioxide (CO2) and nitrogen (N2)are used. CO2 has a triple point at 5.18 bar and −56.6◦C and at atmospheric pressure a subli-mation temperature of −78.8◦C. N2liq. has an evaporation temperature at 1 atm of −195.8◦C.The freezing rate and surface temperatures must be limited during freezing of most fishesand fish products due to cracking and poor quality. In practice, the cryogenic freezers aregas freezers refrigerated by sublimation or evaporation of cryogenic liquids. The main heattransfer from the product is by convection of gas similar to air freezing, but at lower temper-atures. The freezers are mainly used for small products at low temperatures. A diagram of asingle-belt straight in-line nitrogen freezer is shown in Fig. 7.9. Due to the high costs of thelow-temperature liquid, the costs of cryogenic freezing are usually far higher compared toconventional freezers. Availability along the coast is often low and the methods are seldomused commercially in fish freezing.
7.5 POST-FREEZING TREATMENT
The main aims for post-freezing processes are to prevent fall in quality and protect theproducts during storage and distribution. For some fish products this will have a great ef-fect on shelf-life, especially on fatty fish. Correct post-freezing treatment will also reduce
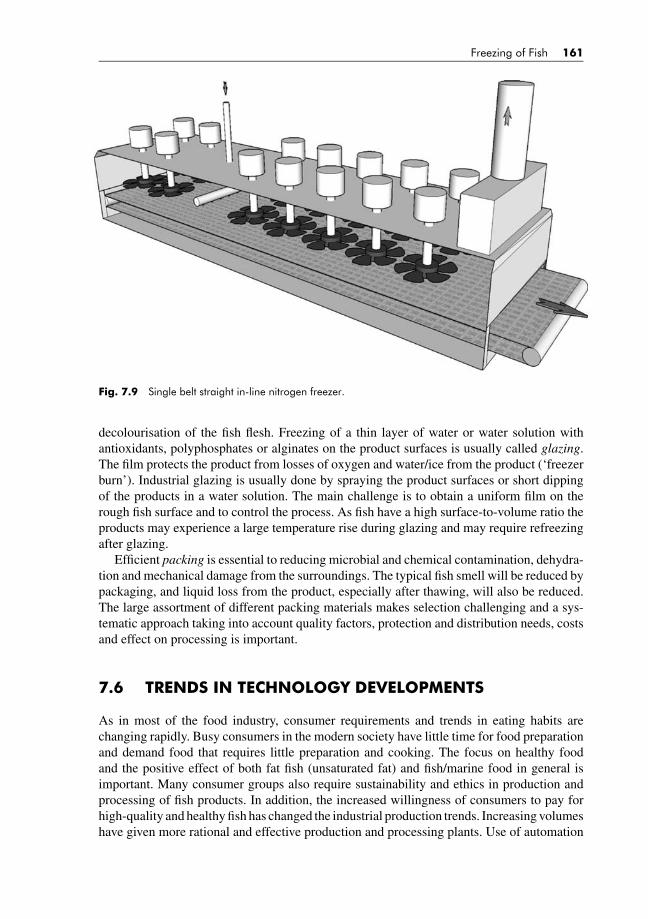
BLUK139-Evans January 23, 2008 18:0
Freezing of Fish 161
Fig. 7.9 Single belt straight in-line nitrogen freezer.
decolourisation of the fish flesh. Freezing of a thin layer of water or water solution withantioxidants, polyphosphates or alginates on the product surfaces is usually called glazing.The film protects the product from losses of oxygen and water/ice from the product (‘freezerburn’). Industrial glazing is usually done by spraying the product surfaces or short dippingof the products in a water solution. The main challenge is to obtain a uniform film on therough fish surface and to control the process. As fish have a high surface-to-volume ratio theproducts may experience a large temperature rise during glazing and may require refreezingafter glazing.
Efficient packing is essential to reducing microbial and chemical contamination, dehydra-tion and mechanical damage from the surroundings. The typical fish smell will be reduced bypackaging, and liquid loss from the product, especially after thawing, will also be reduced.The large assortment of different packing materials makes selection challenging and a sys-tematic approach taking into account quality factors, protection and distribution needs, costsand effect on processing is important.
7.6 TRENDS IN TECHNOLOGY DEVELOPMENTS
As in most of the food industry, consumer requirements and trends in eating habits arechanging rapidly. Busy consumers in the modern society have little time for food preparationand demand food that requires little preparation and cooking. The focus on healthy foodand the positive effect of both fat fish (unsaturated fat) and fish/marine food in general isimportant. Many consumer groups also require sustainability and ethics in production andprocessing of fish products. In addition, the increased willingness of consumers to pay forhigh-quality and healthy fish has changed the industrial production trends. Increasing volumeshave given more rational and effective production and processing plants. Use of automation

BLUK139-Evans January 23, 2008 18:0
162 Frozen Food Science and Technology
and improved control systems are frequent. At the same time, flexibility is required to increasevariation in products and packing.
The increased demand for high-quality products makes temperature control of productfrom harvest to the consumers especially important. Immediate chilling of caught and farmedfish down to the freezing point and minimal storage before processing are absolutely neces-sary. It is further important to keep product temperatures low and uniform during processingin order to ensure optimal quality and yield. Fast freezing to temperatures well below to-day’s typical product temperatures (−30◦C) is now common in modern plants. Research hasshown that lowering the temperature to below −45◦C has a great effect on quality, and that itis required for some products (i.e. sushi products). Also, lower storage and distribution tem-peratures will be required for a new improved cold chain. Thawing is often more demandingthan freezing and new improved thawing processes and equipment must be used.
The large floating fish factories process the catch on board producing consumer productsor semi-finished products. Fillets are mainly frozen in horizontal plate freezers (compactequipment), but also tunnels and continuous-belt freezers are used. An increasing number oftrawlers and long-liners now have changed from fresh fish production to freezing of guttedunprocessed fish for thawing and processing on land. Vertical plate freezers or bulk tunnelsare used. The traditional fish processing industry is based on fish from smaller coastal vesselsand trawlers. The seasonal variation in volume of fish requires freezing of raw materials. Theraw material is thawed before processing. Knowledge of thawing procedures and equipmentis therefore also required and is essential to retain the high yield and quality of fish products.
7.7 LEGISLATIVE ASPECTS OF FREEZING
The legislative requirements of freezing of fish varies with region and have lately beenchanged somewhat in Europe. In Europe the EU regulations are the most common standard.The requirements are mainly recommendations. In Norway the directions are given in ‘Thedescription of quality of fish and fish products’ and are summarized below.
Fish and fish products must be frozen in freezing equipment with sufficient capacity and ina way so that the temperature region for maximal crystallisation is passed as soon as possiblefor the actual product. The freezing shall reduce the temperature in the warmest place ofthe product to −18◦C or lower. When choosing the freezing method, the freezing rate andthe properties of the raw material and the finished product must be taken into consideration.Contact freezing, air freezing and evaporation of freezing medium can be used direct on theproducts. The only freezing media that can be directly in contact with the products are air,nitrogen and carbon dioxide. Stowing of products in a freezing tunnel must be done in a wayso that the freezing medium can flow along the whole surface of every product unit.
Freezing of fish and fish products must be done as soon as possible after all necessaryprocessing operations are finished. The time from when the raw material is put into productionuntil it is placed in a freezer should not be more than 4 hours. Fish that are exempted fromthe directions of gutting can be frozen round. Fish that are frozen round should mainly befree from parasites and have low content of feed in the stomach. Fish that are frozen for useas baith should during freezing and freeze storage be labelled and stored such that confusionwith human food does not happen.
With contact freezing, the freezing time shall be set so that the temperature in the warmestpoint of the product is −18◦C or lower after a time in hours equivalent to the product’s halfthickness in centimetre (for example, 5 cm thickness gives maximum 2.5-h freezing time).
BLUK139-Evans January 23, 2008 18:0
Freezing of Fish 163
With air freezing, the freezing time for round fish (single frozen, in blocks or packaging) shallbe maximum 24 hours (the temperature in the warmest point of the product should be −18◦Cor lower within this time limit). For whole fish with thickness above 16 cm, the freezing timecan be prolonged to 72 hours. Glazing of fish products shall be performed hygienically, withpure water and in a way so that the temperature rise is minimal.
Freezing storage rooms shall be insulated and have refrigeration equipment so that thefish products after thermal stabilization are stored so that the core temperature is −18◦C orlower in the whole product. Transfer of products from freezing equipment to freezing storageequipment shall not be done before the products have a core temperature of minimum −18◦C.The products shall be transferred to freezing storage equipment immediately after departingthe freezing equipment. Frozen raw materiel and finished products shall, if nothing else isdecided, be labelled, stored, transported and presented as frozen products and the freezingchain shall be maintained throughout every point.
7.8 FOOD QUALITY AND FREEZING RATE
Literature on freezing of fish is often confusing about what happens to the fish as it freezes.The difference between slow and quick freezing is not well understood and only in recentyears freezing processing knowledge has advanced sufficiently to explain the differencesbetween slow and quick freezing.
A common understanding has been that rapid freezing of fish (small products: 50–100mm h−1) is unsatisfactory due to disruption of muscle tissue during sudden cooling. Anothertheory is that the cell walls during rapid freezing can burst under the induced pressure causedby expansion of water during rapid freezing. It has also been assumed that slow freezing(in blast freezer room: 2 mm h−1) results in formation of large ice crystals that can causedamage to the cell walls, which would result in considerable drip loss during thawing. It has,however, been shown that the differences in the size of the ice crystals does not provide afull explanation as the wall of the fish muscle cells are sufficiently elastic to adapt to thelarger ice crystals without excessive damage. Additionally, the water in fish muscle is boundto the protein in the form of a gel so that little fluid will be lost during thawing even if thedamage of the cell walls has occurred. Slow bulk freezing does, however, result in productswith poorer quality and this is now explained mainly by temperature-dependent denaturationof the proteins. The dentauration processes are reduced as the temperature is reduced and atslow freezing a longer time is spent at higher temperatures (Johnston et al., 1994).
Many of the advantages of rapid freezing can be lost during subsequent storage (Fennema,1975) and often too much effort has been placed on high freezing rates in process freezers.Achieving complete product freezing is probably more critical because rates of temperaturereduction in frozen storage is much lower leading to significant loss of product quality(Valentas et al., 1997). Very fast freezing (100–1000 mm h−1) in liquefied gases such asnitrogen or carbon dioxide may cause stresses resulting in splitting or cracking of the tissue.
In general, the lower the temperature of frozen storage, the lower is the rate of microbial andbiochemical changes. Freezing and frozen storage has a variable effect on micro-organismsand does not inactivate enzymes. Different types of micro-organisms vary in their resistanceto low temperatures. At normal storage temperatures of −18◦C, there is a slow loss of quality(Fellows, 1997) which for fish is mainly due to oxidation of lipids.
Factors influencing protein denaturation during freezing include salt concentration, pH,ionic strength, lipid oxidation, enzymatic reaction, surface tension and the physical effects
BLUK139-Evans January 23, 2008 18:0
164 Frozen Food Science and Technology
of ice and dehydration. For many proteins, the temperature between −2◦C and −10◦C iscritical. Freezing rate and temperature control can be used to maintain protein integrityduring freezing. The rate of freezing should be high enough to prevent formation of large icecrystals in the extra-cellular spaces. The effect of frozen storage on colour, pH and textureseem to have been studied much more than the effect of freezing rate on these properties(Sun, 2006).
REFERENCES
Flesland, O. and Magnussen, O.M. (1990). Chilling of farmed fish. In: Chilling and Freezing of New FishProducts, Preprints. Aberdeen, September 18–20, pp. 159–164.
Plank, R. (1954). Handbuch der kaltetechnik, Erster band, Entwiklung wirtschaftliche bedeutung werkstoffe,Springer-Verlag, Berlin/Gottingen/Heidelberg, p. 568.
Johnston, W.A., Nicholson, F.J., Roger, A., Stroud, G.D. (1994). Freezing and refrigerated storage in fisheries.FAO Fisheries Technical Paper. No. 340. Rome, FAO. p. 143.
Fennema, O.R. (1975). Freezing preservation. In: Principles of Food Science-Part II Physical Principles ofFood Preservation. New York: Marcel Dekker, pp. 173–215.
Valentas, K.J., Rotstein, E., Singh, P.R. (1997). Handbook of Food Engineering Practice. Boca Raton, NewYork: CRC Press, p. 718.
Fellows, P.J. (1997). Food Processing Technology, Principles and Practice. Camebridge, England: WoodheadPublishing Limited, p. 505.
Sun, Da Wen (2006). Handbook of Frozen Food Processing and Packaging. Boca Raton, London, New York:CRC, Taylor & Francis, p. 737.

BLUK139-Evans January 23, 2008 17:36
8 Freezing of Fruits and Vegetables
Cristina L. M. Silva, Elsa M. Goncalves andTeresa R. S. Brandao
8.1 INTRODUCTION
The benefits of eating fruits and vegetables are well recognised by the general consumers.Fruits and vegetables are key parts of a proper daily diet, resulting from being great sourcesof vitamins, mineral salts and dietary fibres with health-promoting or disease-preventingproperties.
Fruits and vegetables are perishable foods with extremely rapid deterioration; this meansthat their stability after harvesting and during sub-sequent storage is critical (Canet, 1989).Preservation of foods usually involves technologies that prevent microbial growth as wellas retard quality degradation reactions. Among such processes, freezing is a proven andefficient method. For vegetables, freezing is widely recognised as the most satisfactory methodfor long-term preservation, and it is an important segment of the frozen food market. Themarket for frozen fruits is rising slowly (Wisnow, 2006). They may suffer from the imageof being second best, when compared to fresh or chilled produces. However, the growingconsumer demand for healthy products that ease busy lifestyles, with little meal preparationand shopping, makes frozen fruits a fashionable market.
Raw fruits and vegetables contain large quantities of water in proportion to their weightand, consequently, the water phase change occurring in freezing makes these products moresusceptible to ice crystal formation and thawing than other types of food. Due to their cellularstructural characteristics, fruits are less resistant to the freezing process than vegetables.Adding to these characteristics, the fact that frozen vegetables are most often consumedcooked, with thawing and cooking operations occurring simultaneously, make quality aspectsless relevant for frozen vegetables than for frozen fruits. Consumers expect more from a frozenfruit. The attractive aroma, colour, texture and freshness are strong characteristics that aredifficult to dissociate from the raw product, and hence the negative impact of freezing onfruit quality is huge.
Some novel methods for rapid freezing and thawing of foods, aiming at improving quality,have been applied in frozen food technology (Li and Sun, 2002). In the particular case of fruitsand vegetables, dehydrofreezing has been successfully used, since part of the water is removedbefore freezing, thus being an advantage for plant texture preservation. Other techniques, yetexpensive and challenging, such as addition of antifreeze proteins, may be applied aimingat controlling the growth of ice crystals and recrystallisation, and thus improving texturalproperties.
The impact of the freezing process on product quality is enormous. However, a largenumber of other factors may also contribute to the final frozen product characteristics. Fac-tors such as product type and variety, degree of ripening, raw product quality, harvesting
Frozen Food Science and Technology. Edited by Judith A. Evans
© 2008 Blackwell Publishing Ltd, ISBN: 978-1-4051-5478-9

BLUK139-Evans January 23, 2008 17:36
166 Frozen Food Science and Technology
methods, elapsed time between harvesting and processing and pre-freezing treatments aresome examples (Parreno and Torres, 2006; Torreggiani and Maestrelli, 2006). All these fac-tors, and/or their combinations, combined with packaging and storage conditions during thedistribution chain, lead to difficulties in accurate prediction of frozen fruit and horticulturalproduct quality.
In terms of safety, consumers have confidence in frozen products. Obviously, those safetyrecords depend directly on the quality of the raw products prior to the freezing process, andon hygiene practices and standards along all process steps, storage and distribution.
Food industries want to diversify and to innovate whilst maintaining high quality andsafety levels. Currently, the challenge for the frozen food industry is to maintain a role forfrozen products in a market where the consumer prefers fresh food.
Frozen food fits well with changing consumer trends. This type of product allows greatflexibility in meal preparation, and enables consumers to select healthy foods. Consumershave not only expected frozen food suppliers to meet their needs, for convenient and healthyfood, but also to expand variety and improve its quality.
Quality and safety aspects and traditional and innovative freezing technologies applied tofruits and vegetables will be examined further in the following sections.
8.2 QUALITY AND SAFETY OF FROZEN FRUITSAND VEGETABLES
Quality and safety are two major food issues. Quality is a broad concept, which embraces bothsensory attributes readily perceived by the human senses (such as general appearance, tex-ture, taste and aroma), and hidden attributes (such as nutritional value, chemical constituents,and mechanical and functional properties) that may involve quantification and instrumentalmeasurements (Shewfelt et al., 1997; Abbott, 1999). Safety is related to chemical and micro-biological characteristics of the product. Obviously, more than characteristics, quality andsafety are requirements and standards of product excellence.
A huge variety of products are commonly named as ‘vegetables’. This is not a botanicalterm and refers to the most diverse plant parts, such as roots (carrots), stems (asparagus), leaves(lettuce), flowers (broccoli), seeds (peas) and also fruits such as cucumbers and pumpkins.This great diversity of plant tissues and structures is one important influencing factor for thefinal frozen fruit and vegetable quality. Most vegetables, however, have fibrous structuresthat allow structural retention when they are thawed after freezing. On the other hand, fruitspresent softer structures, being physically much more susceptible to firmness loss (Sterling,1968; Alonso et al., 1997).
Quality and stability of frozen fruits and vegetables is influenced markedly by the Productitself, by the applied freezing Process and by Packaging. These factors are commonly referredto as PPP factors. These aspects are well documented in several handbooks of frozen foods(Deitrich et al., 1977 and Torreggiani and Maestrelli, 2006 are two examples).
8.2.1 Product influence
The raw material used in the preparation of frozen fruits and vegetables is an importantinfluencing factor, affecting both physical characteristics and nutritive value of the finalproduct. The suitability for freezing varies greatly with agronomic practices and conditions,

BLUK139-Evans January 23, 2008 17:36
Freezing of Fruits and Vegetables 167
the involved species and varieties, the degree of ripening, and the time elapsed betweenharvesting and processing (Fennema, 1966; Munoz-Delgado, 1977; Canet, 1989).
It is also obvious that only raw material that is clean and sound should be selected forfreezing, but this is not enough. The agronomic factors, including soil type, climatic condi-tions, irrigation, methods of cultivation, fertiliser composition and application, can and dohave significant effect on the nutrient content and texture of the frozen product.
Many authors, such as Buss (1977), Karel (1979) and Reid (1990), have studied theinfluence of different cultivars of the same variety on the nutritive value, texture and flavourof the final frozen product. On the other hand, it seems that differences in cultivars can alsoinfluence the processing conditions, especially the required thermal treatment (blanching)time before freezing (Mundt and McCarty, 1960).
Other authors studied the influence of different maturity stages on composition and freez-ing conditions (Lisiewska et al., 1999; Robertson and Sissins, 1966; Thompson et al., 1983).It should be pointed out that most fruits and some vegetables intended for freezing are har-vested at the same stage of maturity as for fresh consumption. However, the determination ofthe optimum maturity stage is very important for maximum quality retention of some speciesand varieties during frozen storage, particularly for fruits.
Another obvious quality loss source is the time elapsed between harvesting and freezing.Raw materials change with time and, unless careful handling, transportation, and storageprocedures are used, the initial quality of the raw materials fed into a process may be lost.Products that undergo some rapid changes in chemical composition, sensory attributes andnutritional value and the ones with intense metabolism, directly related to high respirationheat (Maestrelli, 2000), should be processed as quickly as possible. Sweet corn, green peasand asparagus are some of the most susceptible vegetable products (Reid, 1990), since asevere decrease in quality may occur if the time between harvesting and processing is long.
Vegetables such as peas and lima beans, which are vined mechanically and badly bruisedduring the threshing process, may suffer rapid deterioration. Bruising during the vining oper-ation brings about abnormal respiration, which is responsible for off-flavour production, justas if these vegetables had been under a low-oxygen atmosphere. Holding under refrigerationtemperatures retards spoilage but, even so, they will not keep longer than 5 or 6 hours in goodconditions, unless they are blanched (Tressler and Evers, 1957).
In spite of the above-mentioned studies, little has been done to relate the structure andchemical composition of the raw tissue, to the organoleptic properties of the frozen fruit or veg-etable products. Research into the specific mechanisms that produce these quality losses in in-dividual products is required, as well as in the selection and breeding of varieties more adaptedto the freezing process. Research workers should turn greater attention to these aspects, withthe aim of expanding the number of available varieties suitable for the freezing process.
8.2.2 Process influence
Processing often results in a marked influence on the finished product. The following sub-topics consider the stages of preparatory or pre-freezing treatments, where blanching isincluded, and the freezing process itself.
8.2.2.1 Pre-freezing treatments
Preparatory or pre-freezing treatments are usually necessary to obtain ready-to-use productsand to provide the best preservation conditions (Munoz-Delgado, 1977).
BLUK139-Evans January 23, 2008 17:36
168 Frozen Food Science and Technology
Grading, cleaning, sorting, removal of defective produce and inspecting, and in some casespeeling, shelling, trimming, chopping and slicing are the main common operations for fruitsand vegetables (Cioubanu and Niculescu, 1976). These operations reduce microbial load,remove foreign material and minimize product variation, but may also destroy the protectivebarrier provided by cellular compartmentation and allow oxygen access. The resulting effectsinclude leaching of nutrients, browning, desiccation and interaction of enzymes, which canlead to loss of nutrients, and texture and colour changes (Canet, 1989; Cano et al., 1990;Reid, 1990).
Some endogenous enzymes are responsible for undesirable changes, such as off-flavoursand odours, and colour and nutritive alterations, during frozen storage. The main foodquality-related enzymes have been discussed by Svensson (1977). According to this au-thor, the enzymes can be separated into four groups, related to changes in flavour, colour,texture/consistency and nutritional value. However, which are the enzymes responsible forquality deterioration in frozen vegetables, still remains a question. The amount of researchwork carried out trying to find a correlation between frozen vegetable’s quality losses and itsenzyme content is large. These deteriorative enzymes may have to be inactivated by applyingparticular treatments before the freezing step. Therefore, blanching is the most importantpre-freezing treatment for vegetable tissues stabilisation (Fennema, 1966). Blanching is athermal treatment designed to inactivate a target enzyme to a given extent. Normally, perox-idase, followed by catalase, and in some cases polygalacturonase or lipoxygenase, are usedas criteria, due to their higher resistance to thermal treatment (Fennema, 1985). However, asmentioned above, there is no evidence that these enzymes are the main factors responsiblefor quality deterioration.
Blanching also affords a series of secondary benefits, which result from the complementaryfunctions of washing, destroying vegetative cells of micro-organisms present on the surface,eliminating any remaining insecticide residues, enhancing the colour of green vegetablesand eliminating off-flavours produced by gases and other volatile substances, that may haveformed during the time between harvesting and processing (Fennema, 1966; Shams andThompson, 1987).
However, since blanching is a thermal treatment, detrimental effects exist, like alterationof plant tissue and consequent texture change, solubilisation and destruction of nutrients andvitamins in the blanching medium, loss of weight and colour changes, resulting in qualityloss.
Due to these changes, research has also been carried out into possible alternatives thatcan replace blanching, without producing adverse effects on product quality. As a resultof such research, some vegetables, with a high natural flavour, low enzymatic activity orwhen shorter frozen storage periods are envisaged, can be preserved without blanching. Thisis the case for onions, green peppers, parsley, leeks and cucumbers (Leino, 1992; Munoz-Delgado, 1977). Except for these few products, blanching remains an essential step in thefreezing process for vegetables, and consequently research in this area should be contin-ued, in order to optimize procedures and reduce the adverse effects on the final productquality.
In general terms, the optimisation of the blanching process (Mundt and McCarty, 1960;Steinbuch, 1983; Selman, 1987; Reid, 1990) implies:� a careful characterisation of the raw material, since enzyme level depends on variety,
maturity, and other factors;
BLUK139-Evans January 23, 2008 17:36
Freezing of Fruits and Vegetables 169� product analysis prior to blanching, to identify the enzyme levels within the tissue andestimate the required heat treatment to inactivate those enzymes responsible for deleteriouschanges in freezing and frozen storage;� the selection of the most adequate blanching system, and;� the understanding and quantification of the degree to which the physico-chemical andsensorial enzymatic changes occur during the process.
Fruits cannot be subjected to a blanching treatment, due to their tissue sensitivity. Therefore,alternative pre-treatments have to used, such as chemical treatments or use of additives, toinactivate deteriorative enzymes. Barbosa-Canovas et al. (2005) compiled a freezing guidefor fruits, but there is still a great need for research in this field, in order to obtain betterquality products.
8.2.2.2 Freezing process
The process of freezing requires the controlled removal of heat from the product, at a steadyuniform rate, until the heat remaining in the product is equal to its equilibrium after stabili-sation (Fennema, 1975).
Besides the great number of species and varieties included in the category of fruits andvegetables, these products have in common a considerable amount of water in their constitu-tion. This characteristic makes them very sensitive to water phase changes and, consequently,to quality deterioration.
The ice crystal formation that occurs during the freezing processes tends to disrupt cellularstructure. Ice crystals begin to form in the extracellular medium and progress towards thecytoplasm, after the cell membrane has lost its permeability. The ice crystals’ growth causescells to decompartmentalise, which does not allow the return of the water to the intracellularmedium during thawing. Consequently, the turgidity of the cells is affected and texture maysuffer pronounced damage. These alterations may also promote drip loss while thawing. Fruittissues, being more delicate, are particularly susceptible, and the impact of freezing on cellturgidity and firmness can be disastrous (Sousa et al., 2006).
In conclusion, the colour, flavour, taste, texture and aroma bouquet of fresh fruits andvegetables is affected strongly by the freezing technology, and these characteristics determinethe product quality excellence and therefore they should be preserved.
The freezing process involves several stages (Fig. 8.1). The first stage – pre-freezing stage(a) – corresponds to the removal of heat from the food during the cooling period, whenthe temperature is reduced to the freezing point. This initial freezing temperature varieswith product, depending on the moisture content. During this initial period sensible heat isremoved from the product.
The second stage – super-cooling (b) – when the temperature falls below the freezingpoint, is essentially transitory and not always observed.
The third stage – freezing stage (c) – is the period of transformation of water into ice,throughout the whole mass of food. During this stage, the temperature remains constant in anideal system, but in real situations falls slowly and continually while latent heat is extracted.The transformation of water into ice is an example of crystallisation. Crystallisation is theformation of a systematically organised phase from a solution. The crystallisation processconsists of nucleation and crystal growth. Nucleation is the association of molecules into atiny ordered particle of a size sufficient to survive and serves as a site for crystal growth.
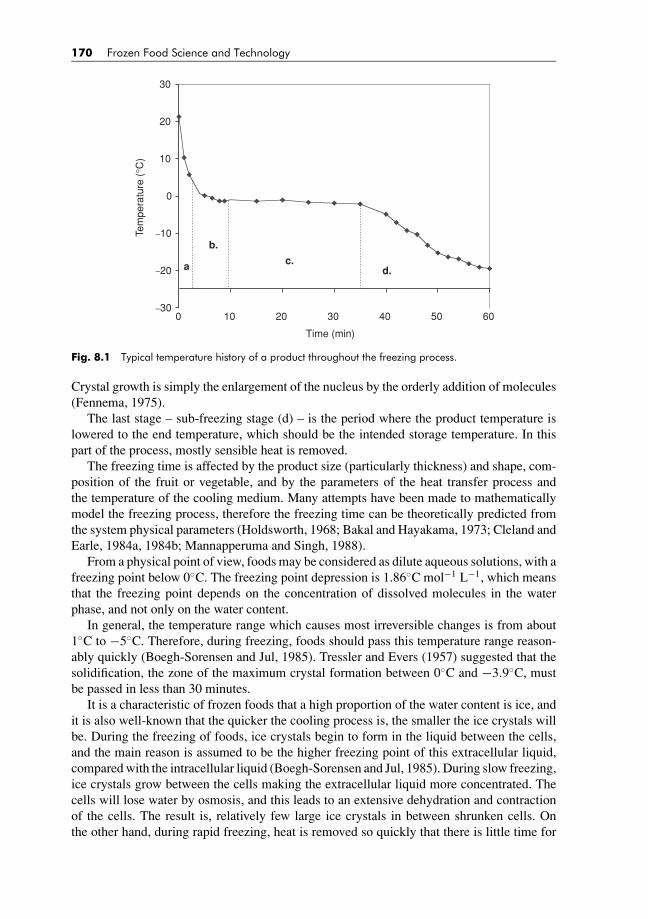
BLUK139-Evans January 23, 2008 17:36
170 Frozen Food Science and Technology
−30
−20
−10
0
10
20
30
10
a
b.
c.d.
0 20 30 40 50 60
Time (min)
Tem
pera
ture
(°C
)
Fig. 8.1 Typical temperature history of a product throughout the freezing process.
Crystal growth is simply the enlargement of the nucleus by the orderly addition of molecules(Fennema, 1975).
The last stage – sub-freezing stage (d) – is the period where the product temperature islowered to the end temperature, which should be the intended storage temperature. In thispart of the process, mostly sensible heat is removed.
The freezing time is affected by the product size (particularly thickness) and shape, com-position of the fruit or vegetable, and by the parameters of the heat transfer process andthe temperature of the cooling medium. Many attempts have been made to mathematicallymodel the freezing process, therefore the freezing time can be theoretically predicted fromthe system physical parameters (Holdsworth, 1968; Bakal and Hayakama, 1973; Cleland andEarle, 1984a, 1984b; Mannapperuma and Singh, 1988).
From a physical point of view, foods may be considered as dilute aqueous solutions, with afreezing point below 0◦C. The freezing point depression is 1.86◦C mol−1 L−1, which meansthat the freezing point depends on the concentration of dissolved molecules in the waterphase, and not only on the water content.
In general, the temperature range which causes most irreversible changes is from about1◦C to −5◦C. Therefore, during freezing, foods should pass this temperature range reason-ably quickly (Boegh-Sorensen and Jul, 1985). Tressler and Evers (1957) suggested that thesolidification, the zone of the maximum crystal formation between 0◦C and −3.9◦C, mustbe passed in less than 30 minutes.
It is a characteristic of frozen foods that a high proportion of the water content is ice, andit is also well-known that the quicker the cooling process is, the smaller the ice crystals willbe. During the freezing of foods, ice crystals begin to form in the liquid between the cells,and the main reason is assumed to be the higher freezing point of this extracellular liquid,compared with the intracellular liquid (Boegh-Sorensen and Jul, 1985). During slow freezing,ice crystals grow between the cells making the extracellular liquid more concentrated. Thecells will lose water by osmosis, and this leads to an extensive dehydration and contractionof the cells. The result is, relatively few large ice crystals in between shrunken cells. Onthe other hand, during rapid freezing, heat is removed so quickly that there is little time for
BLUK139-Evans January 23, 2008 17:36
Freezing of Fruits and Vegetables 171
dehydration of the cells, and ice crystals will also be formed in the cells. The distribution andsize of frozen food’s ice crystals has been the subject of many investigations (Luyet, 1968;Fennema, 1975). It is easy to imagine that a slowly frozen product will lose a certain amountof water during thawing, simply because the water may be unable to return to its originalposition. It is equally easy to conclude that no such problems arise in a rapidly frozen product.Therefore, quick freezing leads to small ice crystals and superior quality of the frozen foods(Reid, 1983; Boegh-Sorensen and Jul, 1985; Reid, 1990), specially frozen plant materials.
During the freezing process, water is converted into ice crystals with a high degree of purity,leading to a concentrated solution of salts, minerals, and other substances. The concentrationextent depends on the product, the end temperature, and also on the freezing rate. Thisincreased solutes concentration often causes a pH change, usually towards the acid side, thatcan influence product quality (van den Berg, 1968).
Freezing may also cause physico-chemical changes, such as loss of water-binding capacity,resulting in drip loss; protein changes, leading to toughening or dryness; and loss of turgour.Many of these changes increase with increasing water-phase solute concentration, but mayat the same time decrease with colder freezing temperature (Boegh-Sorensen and Jul, 1985).
Different kinds of cell damage can occur in the freezing processes, depending on the rateof heat removal and the water permeability. The pre-freezing stage brings an increase inthe permeability of the tissue membranes, with a final loss of intracellular pressure, but theirreversible adverse effects of freezing on quality are the result of crystallisation. Fennema(1975) stated that these changes are due to ice formation, rather than to the decrease intemperature per se.
The water volume increase, caused by the change of state of water into ice, dependsmainly on the free water content in tissues and the amount of gas in their intercellular spaces.Through the expansion, caused by freezing of water, cell tissues will be exposed to strongmechanical forces. Due to the volume increase, intercellular ice development forces the cellsapart, rupturing the middle lamellae and tearing the cell wall. Therefore, freezing causesdisruption of the cell membranes, considerable cell disorganisation, the major result beingusually a loss in tissue firmness (Reeve, 1970; Rahman et al., 1971; Fuchigami et al., 1995a;Khan and Vincent, 1996).
Related to the freezing rate, as an example, Khan and Vincent (1996) concluded thatfor potato low freezing rates promoted more mechanical damage than fast freezing. Butconfusion exists about the real influence of freezing rate on quality of frozen foods. It seemsthat for many products the effects, which may be caused by different freezing rates, are notbig enough (Fuchigami et al., 1995a, 1995b; Bartolome et al., 1996). In most vegetables,where freezing follows blanching, the freezing rate is of minor importance, because blanchinginduces marked structural changes.
The number of studies available in the literature about the effect of freezing per se, on thenutrient components and changes in fruits and vegetable pigments is very limited. Lopez andWilliams (1985) determined the effect of freezing on the concentration of essential elements,such as cadmium and lead in frozen green beans, and concluded that there were fewer changes.Jansen (1969) reported little or no effect of freezing rate on ascorbic acid and vitamin B inpeas and snap beans.
8.2.3 Packaging influence
The packaging has a determinant role on frozen fruits and vegetables quality preservation,by protecting the food from external contamination or deterioration that may occur along

BLUK139-Evans January 23, 2008 17:36
172 Frozen Food Science and Technology
the distribution chain from producer to consumer. Therefore, the main packaging function isproduct preservation. In addition to that, an attractive package with a good design projectsan image of quality.
At the same time, the packaging material cannot affect and/or contaminate the food, andthe choice of the material has to be in line with the existing legislation.
The materials employed in packages for frozen foods should, first of all, possess all theusual features normally required for food packaging, namely: they should be chemically inertand stable; odour-free and not permeable to odour; free of toxic substances, that could beabsorbed; impermeable to water vapour, volatile substances, and external odours; mechan-ically transformable into the appropriate size and shape for display in retail sales; easy toopen; attractive; and able to afford protection against microbial contamination (Feinberg andHartzell, 1968).
In addition to those requirements, packaging materials should be shaped in such a wayas to promote rapid freezing of the product inside, yet resistant to food products expansionduring freezing. They should also be: impermeable to liquids; resistant to moisture, weakacids and low temperatures; reflective and as opaque as possible; and permeable and resistantto microwave energy, in those cases in which reheating or cooking may be done in microwaveovens (Villalvilla, 1988).
Frozen fruits and vegetables have their own special requirements for preparatory treat-ments and packaging. Certain products are particularly fragile, calling for packages that canwithstand the compression and shocks during production. Ultraviolet radiation, to a wave-length of 500 nm, can also catalyse certain chemical reactions that may give rise to significantcolour changes, in the case of chlorophyll-containing vegetables, and makes the use of opaquepackaging materials essential.
Frozen fruits and vegetables can undergo significant dehydration during storage, as a resultof storage temperatures fluctuations, and water permeability of packaging. Such dehydrationis irreversible, giving rise to ice formation inside the package and exerting detrimental effectson quality (changes in colour and flavour, freezer burn, increased risk of oxidation andstructural deterioration). Consequently, during storage packages should ideally be air-tight,totally impermeable to water vapour, and effective as thermal insulators to limit possibletemperatures fluctuations within the product (Ahvenainen and Malkki, 1984).
There are numerous papers dealing with the mechanical and physical properties of pack-aging material, but relatively few with the effect of packaging type on the quality and stabilityof frozen fruits and vegetables (Zhuang et al., 1994; Oruna-Concha et al., 1998).
8.2.4 Safety
Nowadays, due to the global market and consumer behaviour, the occurrence of microbi-ological outbreaks is common. Nevertheless, frozen foods are generally recognised as safe(Barbosa-Canovas et al., 2005). The freezing and frozen storage under proper conditionsdo not affect significantly the microbial level, and the frozen foodstuff’s final safety recorddepends mainly on the quality of the raw materials, thawing conditions and final handling byconsumer.
The spoilage of fresh fruits and vegetables can be caused by microbial activity. The richnutrient composition and high water activity of these products make them attractive sub-strates for micro-organisms to grow. Soil and improper irrigation waters are prime sources ofcontamination. If the contaminants are pathogenic bacteria, viruses or parasites, consumers’
BLUK139-Evans January 23, 2008 17:36
Freezing of Fruits and Vegetables 173
health will certainly be at risk, since serious foodborne illnesses are associated with thosemicro-organisms.
In terms of spoilage, from a quality point of view, the genera Bacillus, Clostridium,Corynebacterium, Cytophaga, Erwinia, Pseudomonas and Xanthomonas are the most com-mon bacteria. Fungi also adversely affect some produces. Salmonella, Shigella, Escherichiacoli, Listeria monocytogenes and Aeromonas are the major threats to fruits and vegetablessafety (Sumner and Peters, 1997).
For maximum hazard control and consumer defence, this microbial flora should be inac-tivated before the freezing stage. Disinfectant washings, thermal (blanching) or alternativenon-thermal treatments (such as ozonation, ultrasonication, UV-C radiation) may be appliedto reduce the risk of final frozen product contamination.
In most processing plants, conveyer belts and other equipment are the chief source ofmicrobial contamination. Therefore, continuous cleaning of the equipment and environmentis a requirement.
The freezing process per se affects microbial activity in foods as unfavourable conditionsfor microbial survival are involved (e.g. the low temperatures and the water phase change).However, this impact varies greatly with the type of micro-organisms and its physiologicalstate, the type of fruit and vegetable and its composition, and the rates of freezing and thawing.
The level of nitrates in foods has caused concern, because of potential toxicity, and highlevels of nitrites may cause methaemoglobinaemia in infants. Several authors have demon-strated that the blanching treatment can reduce plant material nitrate content significantly(Bodiphala and Ormrod, 1971; Kmiecik and Lisiewska, 1999). Blanching was shown toremove other contaminants, such as DDT (dichlorodiphenyltrichloroethane) and carbonylresidue (Elkins et al., 1968), di-syston (Kleinschmidt, 1971), adrin, heptaclor epoxide, andendrin (Solar et al., 1971).
8.2.5 Legislative aspects of frozen fruits and vegetables
Existing specific legislative and legal standards for frozen fruits and vegetables are mainlyregulatory advisory establishments. These specific documents are guidelines for proper prac-tice of processing and handling.
In terms of hygiene, environmental issues, working conditions, labelling, HACCP, packag-ing, storage and distribution, the EU legislation for frozen stuffs is common with general foodproduction (Sørensen, 2002). The Council Directive 89/108/EEC defined the approximationof the laws of the Member States relating to quick-frozen foodstuffs for human consump-tion, which was then implemented through the measures Commission Directive 92/1/EECand 92/e/EEC, respectively on the monitoring of temperatures in transport, warehousing andstorage, and on laying down the sampling procedure and method of analysis for the officialcontrol of the temperatures.
Recommended International Codes of Practice for the Processing and Handling(FAO/WHO Food Standards, 2006) are for quick frozen foods in general, and deal withraw materials and preparation, freezing process, storage, transport and distribution, retail dis-play, packaging and labelling, and hygiene topics. Only sound and wholesome raw materialsshould be used and should be in prime condition just before processing. After preparation,the product should be quick frozen without delay, using appropriate equipment to minimisephysical, biochemical and microbial changes. Furthermore, the range of temperatures formaximum crystallisation should be passed quickly and the process is achieved only when theproduct temperature reaches −18◦C after thermal stabilisation. Thereafter, the temperature
BLUK139-Evans January 23, 2008 17:36
174 Frozen Food Science and Technology
has to be kept constant and repackaging can be done under controlled conditions. Sørensen(2002) presented a critical analysis on the available EU legislation, mentioning also the USand Australian laws, and concluded that it is limited due to the enormous amount of differentproducts, give few guidelines to producers, and more detailed information can be found insome countries.
Particularly for frozen fruits and vegetables, several Codex Standards (FAO/WHO FoodStandards, 2006) exist for a good number of quick-frozen products, such as strawber-ries, peaches and different berries, and spinach, broccoli, brussels sprouts, peas, leek,cauliflower, green beans and potatoes. These Codex Standards emphasise good codes ofpractice for maximising quality aspects, and mention the allowed optional ingredients andadditives.
Finally, several import-export regulations exist (e.g. the Canadian Food Inspection AgencyLiaison – Preparedness and Policy Coordination, 2006).
8.3 TRADITIONAL FREEZING TECHNOLOGIES
As described before, the freezing process can be divided into two main phases, which arethe pre-freezing treatments that include blanching processes, and freezing. The next sub-topics summarise the traditional freezing technologies and give indications for innovativetechniques, aiming at maximising the final frozen fruits and vegetables products quality.
8.3.1 Traditional preparatory treatments
The most common preparatory procedures for freezing fruits and vegetables are grading,selection, washing, peeling and, in some cases, shelling, trimming, chopping and slicing(Cioubanu and Niculescu, 1976).
Washing cleans the product of dirt and impurities and removes pesticide residues. Beuchat(2000) reported that wash-water with about 5 ppm chlorine reduced microbial populationsby more than 90%, from an initial population of 104–106 CFU g−1. However, the efficacy ofthis operation depends on pH, temperature, type of product and diversity of micro-organisms.Garg et al. (1990), for example, observed that dipping lettuce in water containing 300 ppmchlorine, reduced total microbial counts, by about 1000-fold, but had no effect on microbialcounts on carrots.
Peeling, one of the most delicate pre-treatments, is performed industrially by abrasion,high-pressure steam or treatment with sodium hydroxide solution. The disadvantage of allthese methods is the substantial raw material losses (Canet, 1989).
After washing and peeling, the product may, depending upon the product type and variety,be subjected to other procedures such as shelling, chopping and slicing. All these operationsmust be carried out with the utmost care, under the most stringent hygienic conditions,in order to prevent product contamination and mechanical damage. The varying degree ofcomplexity, and automation of the preparatory treatments, requires a thorough understandingof the mechanisms according to the product type, and further research studies are desirable,in order to improve quality and optimise procedures.
Blanching is a thermal treatment, commonly applied to a variety of vegetables, withdifferent objectives, the most important being to preserve and stabilise the products throughenzyme inactivation. Blanching may be carried out in boiling water, steam, or in a combinationof both. The product is heated typically by brief immersion in water, to a temperature between
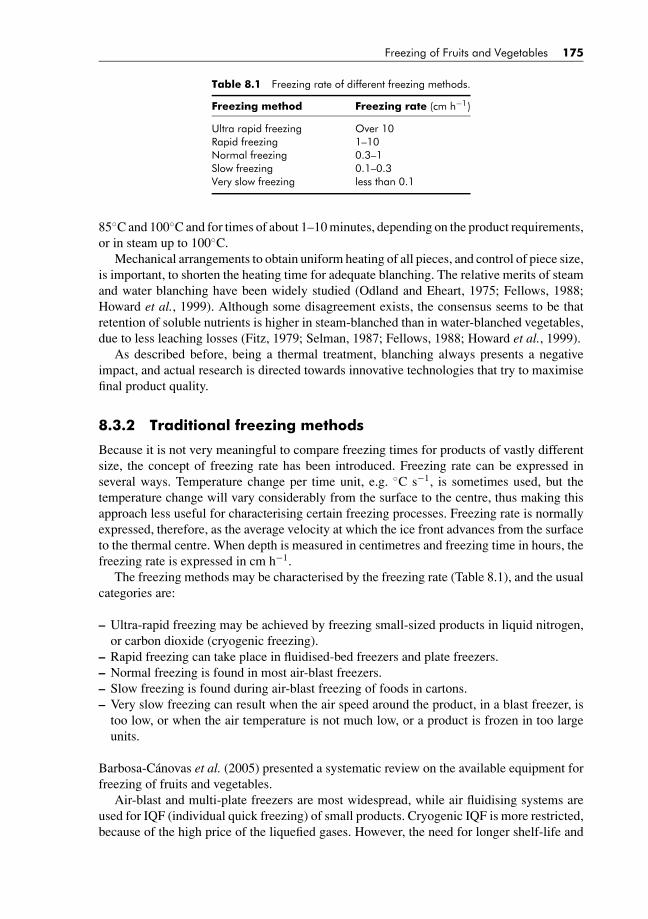
BLUK139-Evans January 23, 2008 17:36
Freezing of Fruits and Vegetables 175
Table 8.1 Freezing rate of different freezing methods.
Freezing method Freezing rate (cm h−1)
Ultra rapid freezing Over 10Rapid freezing 1–10Normal freezing 0.3–1Slow freezing 0.1–0.3Very slow freezing less than 0.1
85◦C and 100◦C and for times of about 1–10 minutes, depending on the product requirements,or in steam up to 100◦C.
Mechanical arrangements to obtain uniform heating of all pieces, and control of piece size,is important, to shorten the heating time for adequate blanching. The relative merits of steamand water blanching have been widely studied (Odland and Eheart, 1975; Fellows, 1988;Howard et al., 1999). Although some disagreement exists, the consensus seems to be thatretention of soluble nutrients is higher in steam-blanched than in water-blanched vegetables,due to less leaching losses (Fitz, 1979; Selman, 1987; Fellows, 1988; Howard et al., 1999).
As described before, being a thermal treatment, blanching always presents a negativeimpact, and actual research is directed towards innovative technologies that try to maximisefinal product quality.
8.3.2 Traditional freezing methods
Because it is not very meaningful to compare freezing times for products of vastly differentsize, the concept of freezing rate has been introduced. Freezing rate can be expressed inseveral ways. Temperature change per time unit, e.g. ◦C s−1, is sometimes used, but thetemperature change will vary considerably from the surface to the centre, thus making thisapproach less useful for characterising certain freezing processes. Freezing rate is normallyexpressed, therefore, as the average velocity at which the ice front advances from the surfaceto the thermal centre. When depth is measured in centimetres and freezing time in hours, thefreezing rate is expressed in cm h−1.
The freezing methods may be characterised by the freezing rate (Table 8.1), and the usualcategories are:
– Ultra-rapid freezing may be achieved by freezing small-sized products in liquid nitrogen,or carbon dioxide (cryogenic freezing).
– Rapid freezing can take place in fluidised-bed freezers and plate freezers.– Normal freezing is found in most air-blast freezers.– Slow freezing is found during air-blast freezing of foods in cartons.– Very slow freezing can result when the air speed around the product, in a blast freezer, is
too low, or when the air temperature is not much low, or a product is frozen in too largeunits.
Barbosa-Canovas et al. (2005) presented a systematic review on the available equipment forfreezing of fruits and vegetables.
Air-blast and multi-plate freezers are most widespread, while air fluidising systems areused for IQF (individual quick freezing) of small products. Cryogenic IQF is more restricted,because of the high price of the liquefied gases. However, the need for longer shelf-life and
BLUK139-Evans January 23, 2008 17:36
176 Frozen Food Science and Technology
improved product taste and quality has motivated the development of this type of equipment(Fellows, 1988; Ramaswamy and Marcotte, 2005).
Air fluidisation (IQF) was studied extensively and has been increasingly used com-mercially, during the last 40 years. This freezing process has many attractive features,including:� High freezing rate due to the small product size and thermal resistance of the IQF products,
and high surface heat transfer coefficients;� Good quality of the frozen products that have an attractive appearance and do not sticktogether;� Continuity and possibilities for complete automation of the freezing process.
Notwithstanding these advantages, fluidisation freezing by air has some drawbacks as well,such as:� Lower surface heat transfer coefficients and freezing rates in comparison to immersion
methods;� Need for a high-speed and -pressure air flow, that results in high fan energy consumption;� Some moisture losses from the product surface and a rapid frosting of the air coolers(evaporator), caused by the great temperature differential between the products and theevaporating refrigerant;� Excessive sensitivity of the process parameters to the product shape, mass and sizes, whichrequires careful control, specific for each food commodity.
The immersion freezing in non-boiling liquid refrigerating media is a well-known method,having several important advantages: high heat transfer rate, fine ice crystal system in foods,great throughput, low investments and operational costs. The immersion applications havebeen limited, because of the uncontrolled solute uptake by the refrigerated products and op-erational problems with the immersion liquids (high viscosity at low temperatures, difficultmaintaining the medium at a definite constant concentration and free from organic contami-nants). Recent achievements in heat and mass transfer, physical chemistry, fluid dynamics andautomatic process control make it possible to solve these problems and to develop advancedinnovative immersion IQF systems (Fikiin, 2003).
The selection of the most adequate system for a given product must be a balance betweencosts, quality and feasibility (Bebilacqua et al., 2004).
8.4 INNOVATIVE TECHNOLOGIES
Freezing is unquestionably the most satisfactory method currently available for long-termpreservation of fruits and vegetables. The nutrient content is largely retained and the productresembles the fresh material more closely than thermally processed foods. However, as it hasbeen described, some changes occur that are mainly textural, and to a smaller extent lossesof nutrients, colour and odour.
Therefore, there is a strong driving force to develop innovative research mainly dedicatedto overcome the drawbacks of the required pre-treatments, specially blanching, and freezingprocess.
BLUK139-Evans January 23, 2008 17:36
Freezing of Fruits and Vegetables 177
8.4.1 Innovative preparatory treatments
Developments have been mainly on systems that try to minimise thermal pre-treatments, oreven avoid it, in order to better retain the original quality of the raw fruits and vegetables.
Several patents exist for microwave blanching, both at atmospheric and higher pressures(Cryodry Corporatio, 1969; Jeppson, 1970; Smith and Williams, 1970). The use of mi-crowaves may not be generally advantageous in blanching, partly because of its characteristicnon-uniform heating. It has been reported that microwaved vegetables were worse in colourthan water or steam blanched green vegetables (Drake et al., 1981). Moreover, the use ofmicrowave may not reduce significantly the operation time. However, some advantage is seenin the use of this system for vegetables of large cross-section, such as potatoes and brusselssprouts (Selman, 1987).
It seems that the optimisation of the system can involve the joint use of microwaves andsteam, to raise the product temperature rapidly, followed by a holding time controlled bysteam alone (Decareau, 1985). However, there is still little information on the consequencesof this alternative blanching on quality (Begum and Brewer, 2001; Ramesh et al., 2002).
The use of new blanching techniques, such as electro-conductive, is still very limited(Vigerstrom, 1976; Garrote et al., 1988). This may be due to the high capital cost neededto replace current water blanchers, and to the fact that more work is required to show thatproduct quality is higher, compared to conventionally blanched products.
The increasing consumer demand for high quality standards has spurred the search fornew and gentle processing technologies that prolong shelf-life without the detrimental effectscaused by blanching. This fact promoted the search and the development of other methods, asefficient as blanching, to reduce the enzyme activity and microbial load on products (Piyasenaet al., 2003; Knorr et al., 2004). Non-thermal methods have emerged as attractive alternativesto conventional methods of thermal processing, and constitute challenging methods aimingat reducing pernicious effects of thermal methods, by preserving quality and nutritionalattributes of fruits and vegetables, and yielding safe and less-perishable products.
The application of ozone, ultrasounds and ultraviolet (UV-C) irradiation are examples ofnon-thermal technologies that may have potential applications in the food industry. Becausethey do not use heat, these technologies are commonly designated as non-thermal technolo-gies. Moreover, they consume small amount of energy, and appear much more economicaland environment-friendly technologies (Piyasena et al., 2003).
Ozone is a gas molecules of which are formed by three oxygen atoms. In nature, this tri-atomic molecule is formed by the UV part (185 nm) of sunlight. Commercially, this moleculeis obtained by submitting oxygen molecules to electrical discharges. This molecule is veryunstable, and it rapidly dissociates, returning to its former oxygen form (Butz and Tauscher,2002).
Ozone is considered as a potent disinfecting agent, due to its high oxidation power (Guzel-Seydim et al., 2004). Studies show that ozone enables a fast inactivation of micro-organismsthrough the reaction with intracellular enzymes, nucleic material or membrane components,destroying the coating of spores or viral capsules (Kim et al., 1999).
Disinfection is the most usual and known application of ozone. Some applications ofozone in the food industry include food preservation, surface hygienisation, sanitation, waterdisinfection and wastewater reutilisation (Graham et al., 1969; Schneider et al., 1991; Sheldonand Brown, 1986).
Ozone, applied as a gas or in dissolved water, has been tested for the post-harvest treatmentsof fruits and vegetables, such as apples, oranges, berries, grapes, onions, lettuce and spices

BLUK139-Evans January 23, 2008 17:36
178 Frozen Food Science and Technology
(Beuchat, 1992; Zao and Cranston, 1995; Kim et al., 1999; Perez et al., 1999; Suslow, 2004).However, its use still presents some controversies, and its efficacy, concerning its applicationin foods, still needs to be further studied.
Ultraviolet (UV) light occupies a wide band of wavelengths in the non-ionising regionof the electromagnetic spectrum, between X-rays (200 nm) and violet part of visible light(400 nm). The germicidal range is in the region of short-wave UV (UV-C), with wavelengthsbetween 200 and 280 nm, with 254 nm being the most lethal. Exposure to low doses of UV-Chas been reported to reduce post-harvest decay of fruits and vegetables (Lu et al., 1987; Erkanet al., 2001; Marquenie et al., 2002; Allende and Artes, 2003), with potential applications inthe post-harvest industry.
Ultrasound is defined as pressure waves with a frequency of 20 kHz or more (Butz andTauscher, 2002). Ultrasound may be used at frequencies between 20 kHz and 10 MHz. Higher-power ultrasound, at lower frequencies (20–100 kHz), has the ability to cause cavitation,which has the capacity to inactivate microbes and enzymes (Knorr et al., 2004; Piyasenaet al., 2003).
Ultrasounds technology has been increasingly used in the food industry, either for analysisor for the modification of foods. Low-intensity ultrasound provides information about physi-cal and chemical properties, and high-intensity ultrasound is normally used to physically andchemically change the properties of foods, such as emulsification, cell disruption, chemicalreaction promotion, enzyme inhibition, meat softening and modification of crystallisationprocesses (McClements, 1995).
The single use of ultrasounds seems not to be effective in inactivating micro-organismsin foods. However, the conjoint application of mild temperatures may enhance the ultrason-ication effect (thermosonication) (Mason et al., 1996; Lopez-Malo et al., 2005; Cruz et al.,2006), with minor changes in terms of quality parameters, when compared to conventionalthermal methods. Other combinations that also seem to be successful in terms of microbialand enzymatic inactivation are the manosonication and thermomanosonication, which com-bine the use of pressure, and pressure and temperature together with ultrasound, respectively(McClements, 1995; Mason et al., 1996).
8.4.2 Innovative freezing methods
Recent developments in freezing technology have been characterised mainly by improve-ments in process control to increase freezing rate and reduce costs (Barbosa-Canovas et al.,2005).
As explained, ice crystal nucleation and growth are one of the main causes of degradationof fruits and vegetables quality during freezing. Therefore, a series of strategies for controllingice crystals in food have been attempted, and are listed below:� The inhibition of nucleation. There is an attempt to reduce freezing temperature, with the
benefits of minimising chemical and physical processes, without the deleterious effectsof freezing and freeze concentration. This approach has been pursued by the Rich Cor-poration in a series of patents and products, where the freezing point has been loweredby introducing massive quantities of osmotically active materials (Blanshard and Franks,1987).� The control of nucleation. Since ice nucleation and growth are temperature-dependent rateprocesses, with optima at different temperatures, the relative rates of nucleation and growthof ice crystals may be exploited, by the appropriate manipulation of the rates of heat transfer
BLUK139-Evans January 23, 2008 17:36
Freezing of Fruits and Vegetables 179
(Diller, 1985). Examples of novel techniques are high-pressure freezing and impingementjet freezing. High-pressure freezing promotes instantaneous and homogeneous formationof ice throughout the whole volume of the product, and is one promising innovativetechnology to improve product’s quality (Li and Sun, 2002; Van Buggenhout et al., 2005).Impingement jet freezing, characterised by its high turbulence, results in a very rapidfreezing process and less expensive method, compared to cryogenic freezing (Soto andBorquez, 2001).� The control of ice crystal growth. Crystals are desired, but of the right size. One approachmay be to inhibit partially the accretion of water molecules at the ice interface. Alter-natively, the presence and accumulation of micro- and macro-molecular additives maymodify the diffusion/colligative properties at the ice crystal–water interface and, thereby,limit extensive ice crystal growth (Blanshard and Franks, 1987). Antifreeze proteins maybe directly added to the product to lower the freezing temperature and slow recrystallisationrate during frozen storage (Griffith and Ewart, 1995; Li and Sun, 2002).� Exploitation of the glassy state. This area has been the subject of a number of investigations.Boutron (1986) has observed that, depending on the rate of cooling in a system, the fractionof water in the ratio of vitrified to crystalline state will vary in a systematic fashion.Therefore, there is an obvious and exploitable correlation between the kinetics of icecrystallisation and the degree of cell damage, depending on whether the ice crystallisesinside or outside the cells. An even more interesting development has been the conclusionof Levine and Slade (1989), who have demonstrated that glassy temperature (Tg) is afunction of molecular mass, and have discussed how the use of appropriate raw materials,in a formulated food product, allow us to manipulate Tg and, therefore, promote productstability.� Bacterial ice nucleation. Bacterial ice nucleation, by strains of Pseudomonas, Erwinia andXanthomonas, has been both detected and investigated since the 1970s, and it has beenrecognised as one of the major causes of frost injury in plants. These micro-organismsare very useful in such processes where ice nucleation is a limiting step (Margaritis andBassi, 1991; Watanabe and Arai, 1994). The application of these bacterial ice nucleatorsto the freezing of some model food systems, elevating nucleation temperature, may reducefreezing times and improve the quality (e.g. the flavour and textural properties) of frozenfoods (Li and Lee, 1995).� Reduction of water content. By reducing the product’s water content, especially of fruits,the negative impact of freezing may be minimised. Dehydrofreezing is a promising newtechnology to reduce or avoid the negative phenomena that occurs in most frozen fruitsand vegetables after storage and thawing (Maestrelli et al., 2001; Li and Sun, 2002; Senesi,2003).
REFERENCES
Abbott, J.A. (1999). Quality measurement of fruits and vegetables. Postharvest Biology and Technology 15(3),207–225.
Ahvenainen, P. and Malkki, Y. (1984). Influence of packaging on the shelf life of frozen carrot, fish and icecream. In: O. Zeuthen, J.C. Cheftel, C. Eriksson, M. Jul, H. Leniger, P. Linko, G. Varela and G. Vos, eds.Thermal Processing and Quality of Foods. New York: Elsevier Applied Science Publishers, pp. 528–532.
Allende, A. and Artes, F. (2003). UV-C radiation as a novel technique for keeping quality of fresh processed‘Lollo rosso’ lettuce. Food Research International 36(7), 739–756.

BLUK139-Evans January 23, 2008 17:36
180 Frozen Food Science and Technology
Alonso, J., Canet, W. and Rodriguez, M.T. (1997). Thermal and calcium pre-treatment affects texture,pectinesterase and pectic substances of frozen sweet cherries. Journal of Food Science 62(3), 511–515.
Bakal, A. and Hayakama, K.I. (1973). Heat transfer in the freezing and thawing of foods. Advance FoodResearch 20, 217–256.
Barbosa-Canovas, G.V., Altunakar, B. and Mejıa-Lorıo, D.J. (2005). Freezing fruits and vegetables. FAOAgricultural Services Bulletin 158, Rome.
Bartolome, A.P., Ruperez, P. and Fuster, C. (1996). Freezing rate and frozen storage effects on color andsensory characteristics of pineapple fruit slices. Journal of Food Science 61(1), 154–156.
Bebilacqua, M., D’Amore, A. and Polonara, F. (2004). A multi-criteria decision approach to choosing theoptimal blanching-freezing system. Journal of Food Engineering 63(3), 253–263.
Begum, S. and Brewer, M.S. (2001). Physical, chemical and sensory quality of microwave-blanched snowpeas. Journal of Food Quality 24(6), 479–493.
Beuchat, L.R. (1992). Surface desinfection of raw produce. Dairy, Food and Environmental Sanitation 12(1),6–9.
Beuchat, L.R. (2000). Surface decontamination of fruits and vegetables eaten raw: a review. Food Safety &Hygiene, Food Science Australia. Available from: http://www.who.int/fsf/fos982∼1.pdf [2001].
Blanshard, J.M.V. and Franks, F. (1987). Ice crystallization and its control in frozen-food systems. In: J.M.V.Blanshard and P. Lillford, eds. Food Structure and Behaviour. Orlando, FL: Academic Press, pp. 51–65.
Bodiphala, T. and Ormrod, D.P. (1971). Factors affecting the nitrate content of vegetables and fruit foods.Journal of Canadian Institute of Food Technology 4(1), 6–8.
Boegh-Sorensen, L. and Jul, M. (1985). Effects of freezing/thawing on foods. In: R.K. Robinson, ed. Micro-biology of Frozen Foods. London and New York: Elsevier Applied Science Publishers, pp. 41–82.
Boutron, P. (1986). Comparison with the theory of the kinetics and extent of ice crystallization and of theglass-forming tendency in aqueous cryoprotective solutions. Cryobiology 23, 88–102.
Buss, D.H. (1977). Nutritional priorities, with particular reference to frozen foods. In: W.K. Downey, ed.Food Quality and Nutrition. London: Applied Science Publishers.
Butz., P. and Tauscher, B. (2002). Emerging technologies: chemical aspects. Food Research International 35,279–284.
Canadian Food Inspection Agency Liaison – Preparedness and Policy Coordination. (2006). Available from:http://www.inspection.gc.ca/english/reg/rege.shtml (December 2006).
Cano, P., Marin, M.A. and Fuster, C. (1990). Freezing of banana slices. Influence of maturity, level andthermal treatment prior to freezing. Journal of Food Science 55(4), 1070–1073.
Canet, W. (1989). Quality and stability of frozen vegetables. In: S. Thorne, ed. Developments in Food Preser-vation,), Vol. 5. New York: Elsevier Science Publishing, pp. 1–50.
Cioubanu, A. and Niculescu, L. (1976). Cooling Technology in the Food Industry. In: A. Cioubanu, G. Lascu,V. Bercescu and L. Niculescu, eds. Kent: Abacus Press.
Cleland, A.C. and Earle, R.L.J. (1984a). Assessment of freezing time prediction methods. Journal of FoodScience 49, 1034–1042.
Cleland, A.C. and Earle, R.L.J. (1984b). Freezing time predictions for different final products Journal ofFood Science 49, 1230–1232.
Cruz, R.M.S., Vieira, M.C. and Silva, C.L.M. (2006). Effect of heat and thermosonication treatments onperoxidase inactivation kinetics in watercress (Nasturtium officinale). Journal of Food Engineering 72(1),8–15.
Cryodry Corporatio (1969). Microwave Heating Apparatus. British Patent no 1: 143 272.Decareau, R.V. (1985). Microwave in the Food Processing Industry. New York: Academic Press.Deitrich, W.C., Feinberg, B., Olson, R.L., Roth, T.L. and Winter, F.H. (1977). Freezing vegetables. In: N.W.
Desroier and D.K. Tressler, eds. Fundamentals of Food Freezing. Westport, Conneticut: AVI PublishingCompany, pp. 81–134.
Diller, K.R. (1985). The influence of controlled ice nucleation on regulating the thermal history duringfreezing. Cryobiology 22, 268–281.
Drake S.R., Spayd, S.E., and Thompson, J.B. (1981). The influence of blanch and freezing methods on thequality of selected vegetables. Journal of Food Quality 4(4), 271–278.
Elkins, E.R., Lamb, F.C., Farrow, R.P., Kimball, J.R. and Cook, R.W. (1968). Removal of DDT, parathion,and carbaryl from spinach by commercial and home preparative methods. Journal of Agricultural and FoodChemistry 16(6), 967–973.
Erkan, M., Wang, C.Y. and Krizek, D.T. (2001). UV-C irradiation reduces microbial populations and deteri-oration in Cucurbita pepo fruit tissue. Environmental and Experimental Botany 45, 1–9.
BLUK139-Evans January 23, 2008 17:36
Freezing of Fruits and Vegetables 181
FAO/WHO Food Standards. (2006). Available from: http://www.codexalimentarius.net/web/standard list.jsp(December 2006).
Feinberg, B. and Hartzell, R.P. (1968). Factors affecting quality in frozen foods. In: D.K. Tressler, W.B. vanArsdel and M.J. Copley, eds. The Freezing Preservation of Foods, Vol. 2. Wesport, CT: AVI Publishing,pp. 260.
Fellows, P. (1988). Food Processing Technology – Principles and Practice. Chichester: Ellis Horwood Ltd.Fennema, O. (1966). An over-all view of low temperature food preservation. Cryobiology 3(3), 197–213.Fennema, O. (1975). Effects of freeze-preservation on nutrients. In: Roberts S. Harris and Endel Karmas,
eds. Nutritional Evaluation of Food Processing, 2nd edn. Westport, CT: AVI Publishing, pp. 244–288.Fennema, O.R. (1985). Food Chemistry. New York: Marcel Dekker.Fikiin, K. (2003). Novelties in Food Freezing Research in Europe and Beyond. Technical Bulletin of the Flair
Flow 4, Technical University of Sofia, Bulgaria.Fitz, V.L. (1979). The vibratory spiral blancher-cooler. Quick Frozen Foods International 21(1), 124–125.Fuchigami, M., Hyakumoto, N. and Miyazaki, K. (1995a). Programmed freezing effects on texture, pectic
composition and electron microscopic structure of carrots. Journal of Food Science 60(1), 137–141.Fuchigami, M., Miyazaki, K. and Hyakumoto, N. (1995b). Frozen carrots texture and pectic components as
affected by low-temperature-blanching and quick freezing. Journal of Food Science 60(1), 132–136.Garg, N., Churey J.J. and Splittstoesser, D.F. (1990). Effect of processing conditions on the microflora of
fresh-cut vegetables. Journal of Food Protection 53, 701–703.Garrote, R.L., Silva, E.R. and Bertone, R.A. (1988). Blanching of small whole potatoes in boiling water and
by electroconductive heating. Lebensmittel-wissenschaft und Tecnologie 21(1), 41–45.Graham, H.N., Struder, V.V. and Gurkin, M. (1969). US patent, 3, 484, 247.Griffith, M., and Ewart, K.V. (1995). Antifreeze proteins and their potential use in frozen foods. Biotechnology
Advances 13(3), 375–402.Guzel Seydim, Z.B., Greene, A.K. and Seydim, A.C. (2004). Use of ozone in food industry. Lebensmittle
Wissenschaft und Technologie 37, 453–460.Holdsworth, S.D. (1968). Mathematical Procedures for Calculating Freezing Times for Foodstuffs and Meth-
ods of Determining Temperature Distributions in Frozen Products. Technical Bulletion No 16, CampdenFood Preservation Research Association, Chipping Campden, Glos., UK.
Howard, L.A., Wong, A.D., Perry, A.K. and Klein, B.P. (1999). β-Carotene and ascorbic acid retention infresh and processed vegetables. Journal of Food Science 64(5), 929–936.
Jansen, E.J. (1969). Quality related chemical and physical changes in frozen foods. In: W.B. Van Arsdel, M.J.Copley and R.L. Olson, eds. Quality and Stability of Frozen Foods. New York, London, pp. 19–42.
Jeppson, M.R. (1970). Method and device for treating substances with microwave energy. West GermanPatent Application no 1 492 600.
Karel, M. (1979). Effect of storage on nutrient retention of foods. Food Technology 33(2), 26–37.Khan, A.A and Vincent, J.F.V. (1996). Mechanical damage induced by controlled freezing in apple and potato.
Journal of Texture Studies 27, 143–157.Kim, J.G., Yousef, A.E. and Dave, S. (1999). Application of ozone for enhancing the microbiological safety
and quality of foods: a review. Journal of Food Protection 62, 1071–1087.Kleinschmidt, M.G. (1971). Rate of Di-syston (0,0-diethyl S-[2-(ethylthio)ethyl] phosphorodithioate) in
potatoes during processing. Journal of Agriculture and Food Chemistry 19(6), 1196–1197.Kmiecik, W. and Lisiewska, Z. (1999). Effect of pretreatment conditions and period of storage on some
quality indices of frozen chive (Allium schoenoprasum L.). Food Chemistry 67, 61–66.Knorr, D., Zenker, M., Heinz, V. and Lee, D.-U. (2004). Applications and potential of ultrasonics in food
processing. Trends Food Science and Technology 15, 261–266.Leino, M.E. (1992). Effect of freezing, freeze-drying and air-drying on odor of chive characterized by
headspace gas chromatography and sensory analyses. Journal of Agricultural and Food Chemistry 40,1379–1384.
Levine, H. and Slade, L. (1989). A food polymer science approach to the practice of cryostabilizationtechnology. Comments-on-Agricultural-and-Food-Chemistry 1(6), 315–396.
Li, J. and Lee, T.C. (1995). Bacterial ice nucleation and its potential application in the food industry. Trendsin Food Science and Technology (6), 259–265.
Li, B. and Sun, D.-W. (2002). Novel methods for rapid freezing and thawing of foods – a review. Journal ofFood Engineering 54(3), 175–182.
Lisiewska, Z., Kmiecik, W. and Gebczynski, P. (1999). Effect of maturity stages on the content of ashcomponents in raw, frozen, and canned broad beans. Food Chemistry 67(2), 155–162.
BLUK139-Evans January 23, 2008 17:36
182 Frozen Food Science and Technology
Lopez, A. and Williams, H.L. (1985). Essential elements and cadmium and lead in fresh, canned, and frozengreen beans (Phaseolus vulgaris L.). Journal of Food Science 50, 1152–1157.
Lopez-Malo, A., Palou, E., Jimenez-Fernandez, M., Alzamora, S.M. and Guerrero, S. (2005). Multifactorialfungal inactivation combining thermosonication and antimicrobials. Journal of Food Engineering 67, 87–93.
Lu, J.Y., Stevens, C., Yakabu, P., Loretan, P.A. and Eakin, D. (1987). Gamma, electron beam and ultravioletradiation on control of storage rots and quality of Walla Walla onions. Journal of Food Processing andPreservation 12, 53–62.
Luyet, B. (1968). Basic physical phenomena in the freezing and thawing of animal and plant tissue. In: D.K.Tressler, W.B. van Arsdel and M.J. Copley, eds. The Freezing Preservation of Foods, Vol. 2. Westport, CT:AVI Publishing, pp. 1–25.
Maestrelli, A. (2000). Fruit and vegetables: the quality of raw material in relation to freezing. In: C.J. Kennedy,ed. Managing Frozen Foods. Cambridge: Woodhead Publishing Ltd., pp. 27–55.
Maestrelli, A., Lo Scalzo, R., Lupi, D., Bertolo, G. and Torreggiani, D. (2001). Partial removal of water beforefreezing: cultivar and pre-treatments as quality factors of frozen muskmelon (Cucumis melo, cv reticulatusNaud.). Journal of Food Engineering 49(2–3), 255–260.
Mannapperuma, J.D. and Singh, R.P. (1988). Prediction of freezing and thawing times of foods using anumerical method based on enthalpy formulation. Journal of Food Science 53(2), 626–630.
Margaritis, A. and Bassi, A.S. (1991). Principles and biotechnological applications of bacterial ice nucleation.Critical Revue of Biotechnology 11(3), 277–295.
Marquenie, D., Michiels, C.W., Geeraerd, A.H., Schenk, A., Soontjen, C., Van Impe, J.F. and Nicolai, B.M.(2002). Inactivation of conidia of Botrytis cinerea and Monilinia fructigena using UV-C and heat treatment.International Journal of Food Microbiology 73, 187–196.
Mason, T.J., Paniwnyk, L. and Lorimer, J.P. (1996). The uses of ultrasound in food technology. Ultrasonicationand Sonochememistry 3, S253–S260.
McClements, D.J. (1995). Advances in the application of ultrasound in food analysis and processing. Trendsin Food Science and Technology 6, 239–299.
Mundt, J.O. and McCarty, I.E. (1960). Factors affecting the blanching of green beans. Food Technology309–311.
Munoz-Delgado, J.A. (1977). Effect of freezing, storage and distribution on quality and nutrition attributes offoods, in particular of fruits and vegetables. In: W.K. Downey, ed. Food Quality and Nutrition: ResearchPriorities. London: Applied Sciences Publishers, pp. 353–384.
Odland, D. and Eheart, M.S. (1975). Ascorbic acid, mineral and quality retention in frozen broccoli blanchedin water, steam and ammonia-steam. Journal of Food Science 40(5), 1004–1007.
Oruna-Concha, M.J., Gonzalez-Castro, M.J., Lopez-Hernandez, J. and Simal-Lozano, J. (1998). Monitoringof the vitamin C content of frozen green beans and padron peppers by HPLC. Journal of the Science ofFood and Agriculture 76, 477–480.
Parreno, W.C. and Torres, M.D.A. (2006). Quality and safety of frozen vegetables. In: D.-W. Sun, ed. Hand-book of Frozen Food Processing and Packaging. Boca Raton, FL: CRC Press, pp. 377–415.
Perez, A.G., Sanz, C., Rios, J.J. and Olıas, R. (1999). Effects of ozone treatment on postharvest strawberryquality. Journal of Agricultural Food Chemistry 47, 1652–1656.
Piyasena, P., Mohareb, E. and McKellar, R.C. (2003). Inactivation of microbes using ultrasound: a review.International Journal of Food Microbiology 87, 207–216.
Rahman, A.R., Henning, W.L. and Wescott, D.E. (1971). Histological and physical changes in carrots as affectby blanching, cooking, freezing, freeze drying and compression. Journal of Food Science 36, 500–502.
Ramaswamy, H. and Marcotte, M. (2005). Food Processing – Principles and Application. Boca Raton, FL:CRC Press, p. 420.
Ramesh, M.N., Wolf, W., Tevini, D. and Bognar, A. (2002). Microwave blanching of vegetables. Journal ofFood Science 67(1), 390–398.
Reeve, R.M. (1970). Relationships of histological structure to texture of fresh and processed fruit and veg-etables. Journal of Texture Studies 1, 247–284.
Reid, D.S. (1983). Fundamental physicochemical aspects of freezing. Food Technology 110–115.Reid, D.S. (1990). Optimizing the quality of frozen foods. Food Technology 44(7), 78–82.Robertson, J. and Sissins, D.J. (1966). The effect of maturity, processing, storage in the pod and cooking on
the vitamin C content of fresh peas. Nutrition 20(1), 21–24.Schneider, K.R., Steslow, F.S., Sierra, F.S., Rodrick, G.E. and Noss, C.I. (1991). Ozone depuration of Vibrio
vulnificus from the southern quahog clam, Mercenaria campechiensis. Journal of Invertebrate Patholology57(2), 184–190.

BLUK139-Evans January 23, 2008 17:36
Freezing of Fruits and Vegetables 183
Selman, J.D. (1987). The blanching process. In: Stuart Thorme, ed. Developments in Food Preservation,Vol. 4. London and New York: Elsevier Applied Science Publishers, pp. 205–250.
Senesi, E. (2003). Applications of mild technology to horticultural products. Experiences from the IVTPA.Food, Agriculture & Environment 1(2), 150–159.
Shams, M.A. and Thompson, D.R. (1987). Qualitative determination of pea losses as affected by conventionalwater blanching. Journal of Food Science 52(4), 1006–1109.
Sheldon, B.W. and Brown, A.L. (1986). Efficacy of ozone as a disinfectant for poultry carcasses and chillwater. Journal of Food Science 51(2), 305–309.
Shewfelt, R.L., Erickson, M.C., Hung, Y.C. and Malundo, T.M.M. (1997). Applying quality concepts infrozen food development. Food Technology 51(2), 56–59.
Smith, T.J. and Williams, L.G.US. (1970). Microwave blanching. Patent no 3 578 463.Solar, J.M., Liuzzo, J.A. and Novak, A.F. (1971). Removal of aldrin, heptachlor epoxide, and endrin from
potatoes during processing. Journal of Agriculture and Food Chemistry 19(5), 1008–1010.Sørensen, L.B. (2002). Frozen Food Legislation. Bulletin of the International Institute of Refrigeration 2002–4.Soto, V. and Borquez, R. (2001). Impingement jet freezing of biomaterials. Food Control 12, 515–522.Sousa, M.B., Canet, W., Alvarez, M.D. and Tortosa, M.E. (2006). Effect of processing on the texture and
structure of raspberry (cv. Heritage) and blackberry (cv. Thornfree). European Food Research Technology223, 517–532.
Steinbuch, E. (1983). Techniques for blanching of vegetables for freezing cost, energy and waste aspects.Revue Generale du Froid 73(1), 27–38.
Sterling, C. (1968). Effect of low temperature on structure and firmness of apple tissue. Journal of FoodScience 33(6), 577–580.
Sumner, S.S. and Peters, D.L. (1997). Microbiology of vegetables. In: D.S. Smith, J.N. Cash, W.-K. Nipand Y.H. Hui, eds. Processing Vegetables, Science and Technology. Lancaster, PA: Technomic PublishingCompany, pp. 87–116.
Suslow, T.V. (2004). Ozone Applications for Post Harvest Disinfection of Edible Horticultural Crops, Divisionof Agriculture and Natural Resources. University of California, Publication 8133.
Svensson, S. (1977). Inactivation of enzymes during thermal processing. In: T. Hoyem and O. Kvale, eds.Physical, Chemical and Biological Changes in Food Caused by Thermal Processing. London: AppliedScience Publishers, pp. 202–217.
Tressler, D.K. and Evers, C.F. (1957). The Freezing Preservation of Foods - Freezing of Fresh Foods, Vol. I.The AVI Publishing Company, Inc. Westport, CT.
Thompson, D.R., Hung, Y.C. and Norwing, J.F. (1983). Influence of raw material properties on the freezingof sweet corn. In: B.M. McKenna, ed. Engineering and Food, Vol. 1. Elsevier Applied Science Publishers,pp. 299–309.
Torreggiani, D. and Maestrelli, A. (2006). Quality and safety of frozen fruits. In: D.-W. Sun, ed. Handbookof Frozen Food Processing and Packaging. Boca Raton, Florida: CRC Press, pp. 417–440.
Van Buggenhout, S., Messagie, I., Van Loey, A. and Hendrickx, M. (2005). Influence of low-temperatureblanching combined with high-pressure shift freezing on the texture of frozen carrots. Journal of FoodScience 70(4), S304–S308.
van den Berg, L. (1968). Physicochemical changes in foods during freezing and subsequent storage. In: J.Hawthorn and E.J. Rolfe, eds. Recent Advances in Food Science. Vol. 4 – Low Temperature Biology ofFoodstuffs. Oxford: Pergamon Press, pp. 205–219.
Villalvilla, C. (1988). Packaging. More than protection!. Surgelation 26, 39–45.Vigerstrom, K.B. (1976). Deep-fried potato products. US Patent no 3 997 678.Watanabe, M. and Arai, S. (1994). Bacterial ice-nucleation activity and its application to freeze concentration
of fresh foods for modification of their properties. Journal of Food Engineering 22, 453–473.Wisnow, S.J. (2006). Frozen vegetables and fruits are good: So why aren’t more of them being eaten?. Quick
Frozen Foods Intenational –Available from: http://www.qffintl.com/pdf/october 2006/ FrozenVegetablesandFruitsAreGood.cfm
Zao, J. and Cranston, P.M. (1995). Microbial decontamination of black pepper by ozone and the effect of thetreatment on volatile oil constituents of the spice. Journal of the Science of Food and Agriculture 68(1),11–18.
Zhuang, H., Barth, H. and Hildebrand, D. (1994). Packaging influenced total chlorophyll, soluble protein, fattyacid composition and lipoxygenase activity in broccoli florets. Journal of Food Science 59, 1171–1174.
BLUK139-Evans January 23, 2008 17:38
9 Freezing of Bakery and Dessert Products
A. LeBail and H.D. Goff
9.1 BAKERY PRODUCTS
9.1.1 Bake off technology and bakery products
Bakery products (termed BCG) such as bread, viennoiserie, and many other specialitiesremain an important input in a well-balanced diet, being at the base of the pyramid ofnutrition (http://www.usda.gov/cnpp/DietGd.pdf). Consumers prefer freshly baked products,which are traditionally prepared by baking from scratch. In addition, consumers are searchingfor a larger variety of products including ethnic products, health promoting products, non-allergenic products (i.e. gluten-free bread) with a high level of ‘freshness’ (‘freshly baked’)and organoleptic qualities. In parallel, the reduced availability of skilled bakers and thecost of shop space mean that traditional bakers have difficulties to match production withdemand. The food industry has been proposing several alternatives to solve this problem. Thecorresponding technologies called ‘Bake Off Technologies’ (BOT) encompass several bakingprocesses. The spirit of BOT is to keep the technological and time-consuming operations atthe industrial level and the final preparation of products before retailing is carried out in smallshops equipped with a minimum of equipment (thawing–proofing chamber, oven) and withminimally skilled personnel.
The market share of BOT is growing at a very high rate (more or less around 10% peryear), whereas the overall bread consumption is almost constant; there is thus a transfer fromtraditional baking (scratch baking) towards BOT.
The main technologies of bread making are listed in Table 9.1. The three key technologiesof BOT are the Unfermented Frozen dough (UFD), the Partially Baked Frozen Bread (PBF)and the Partially Baked Unfrozen Bread (PBUF).
UFD requires skilled personnel but can also produce products with a quality comparableto scratch baking. At least 3 hours are needed to prepare bread with UFD technology. UFDproducts are the most preferred frozen bakery products in France. PBF or PBUF do notrequire highly skilled personnel. Usually PBF and PBUF, breads are thawed before beingbaked in a convection oven. Partially baked (PBF and PBUF) products can be prepared in lessthan 1 hour but their production is energy demanding. The fermented frozen dough (F-FD)technology has not been extensively developed due to quality problems. This technology,also called ‘ready to bake’, is promising; however, if temperature abused in the cold chain,the surface of the dough pieces might reach the melt point and stick together, resulting in anunacceptable crust after baking.
In 2003, the European bread market was divided into 47% for traditional scratch baking,6% for bread production in supermarket (traditional scratch baking), 36% for industrial fresh
Frozen Food Science and Technology. Edited by Judith A. Evans
© 2008 Blackwell Publishing Ltd, ISBN: 978-1-4051-5478-9
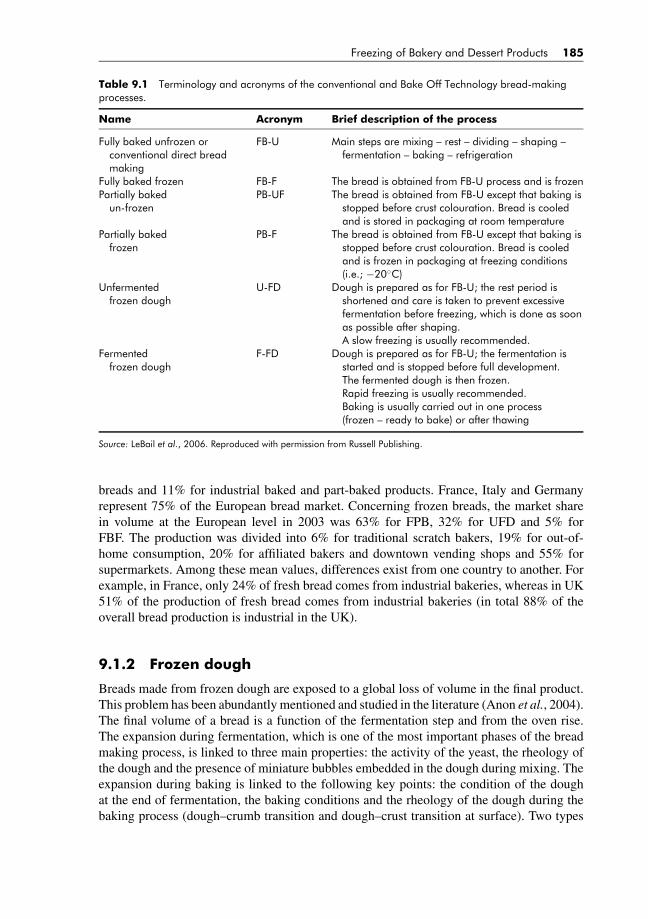
BLUK139-Evans January 23, 2008 17:38
Freezing of Bakery and Dessert Products 185
Table 9.1 Terminology and acronyms of the conventional and Bake Off Technology bread-makingprocesses.
Name Acronym Brief description of the process
Fully baked unfrozen orconventional direct breadmaking
FB-U Main steps are mixing – rest – dividing – shaping –fermentation – baking – refrigeration
Fully baked frozen FB-F The bread is obtained from FB-U process and is frozenPartially baked
un-frozenPB-UF The bread is obtained from FB-U except that baking is
stopped before crust colouration. Bread is cooledand is stored in packaging at room temperature
Partially bakedfrozen
PB-F The bread is obtained from FB-U except that baking isstopped before crust colouration. Bread is cooledand is frozen in packaging at freezing conditions(i.e.; −20◦C)
Unfermentedfrozen dough
U-FD Dough is prepared as for FB-U; the rest period isshortened and care is taken to prevent excessivefermentation before freezing, which is done as soonas possible after shaping.A slow freezing is usually recommended.
Fermentedfrozen dough
F-FD Dough is prepared as for FB-U; the fermentation isstarted and is stopped before full development.The fermented dough is then frozen.Rapid freezing is usually recommended.Baking is usually carried out in one process(frozen – ready to bake) or after thawing
Source: LeBail et al., 2006. Reproduced with permission from Russell Publishing.
breads and 11% for industrial baked and part-baked products. France, Italy and Germanyrepresent 75% of the European bread market. Concerning frozen breads, the market sharein volume at the European level in 2003 was 63% for FPB, 32% for UFD and 5% forFBF. The production was divided into 6% for traditional scratch bakers, 19% for out-of-home consumption, 20% for affiliated bakers and downtown vending shops and 55% forsupermarkets. Among these mean values, differences exist from one country to another. Forexample, in France, only 24% of fresh bread comes from industrial bakeries, whereas in UK51% of the production of fresh bread comes from industrial bakeries (in total 88% of theoverall bread production is industrial in the UK).
9.1.2 Frozen dough
Breads made from frozen dough are exposed to a global loss of volume in the final product.This problem has been abundantly mentioned and studied in the literature (Anon et al., 2004).The final volume of a bread is a function of the fermentation step and from the oven rise.The expansion during fermentation, which is one of the most important phases of the breadmaking process, is linked to three main properties: the activity of the yeast, the rheology ofthe dough and the presence of miniature bubbles embedded in the dough during mixing. Theexpansion during baking is linked to the following key points: the condition of the doughat the end of fermentation, the baking conditions and the rheology of the dough during thebaking process (dough–crumb transition and dough–crust transition at surface). Two types
BLUK139-Evans January 23, 2008 17:38
186 Frozen Food Science and Technology
of studies are available in the literature focussing either on the formulation and/or on theprocess.
9.1.2.1 Process conditions
Process parameters that have been examined are, for example, the mixing conditions (Rouilleet al., 2000), degree of fermentation prior to freezing (Kline and Sugihara, 1968; Zounis et al.,2002), freezing temperature (Stecchini et al., 2002), freezing rate (Havet et al., 2000; Hsuet al., 1979), storage conditions LeBail et al., 1999; Ribotta et al., 2004; Giannou and Tzia,2007), thawing rate (Lucas et al., 2005).
A higher bread volume was observed with a prolonged mixing time in a study that com-bined the impact of selected improvers (ascorbic acid and α-amylase) (Rouille, 2000). Theimpact of prefreezing fermentation has been studied by numerous authors. Industrial prac-tice has confirmed that freezing must be achieved as fast as possible after shaping of thedough to minimise the start of fermentation. Dough temperature must be kept in the range of20◦C during mixing; the higher the temperature of the dough before freezing, the lower thebaking score. Zounis et al. (2002) found that a dough frozen at a lower temperature resultedin a better freeze tolerance. Stecchini et al. (2002) focus on the relationship between thefreeze tolerance of a baker’s yeast and dough water content, freezing, storage temperatures,and prefermentation before freezing. They observed that yeast viability was mostly affectedby the freezing temperature and by the storage temperature. The freezing rate being linkedto the freezing temperature (Plank, 1941), there was no clear evidence to suggest whetherthe freezing temperature or the freezing rate was the governing parameter to consider. Thesame authors observed that storage at temperatures below the glass transition temperature(Tg) gave the highest survival ratios; this result is logical, in that water mobility is stronglyreduced below the glass transition temperature. Nevertheless, Tg of a dough, which is in therange, or lower than, −30◦C (Ribotta and LeBail, 2007a) depends on its water content andon the formulation. Therefore, storage below Tg might appear out of scope for most sub-zeroindustrial mass storage.
Freezing also affects dough rheology as shown by Havet et al. (2000), Lu and Grant (1999)and Inoue and Bushuk (1991). This is attributed to a modification of the free:bound waterratio. Indeed, it has been shown that during storage the amount of frozen water (free water)increased with increasing storage duration (Lu and Grant, 1999). This phenomenon resultedin dehydration of the matrix and therefore in a change of the dough rheology which becamemore ‘elastic’.
The impact of the freezing rate is often mentioned as an important parameter. A generaltrend confirmed by several authors is that baker’s yeast is better preserved with a slowerfreezing rate. Neyreneuf and Delpuech (1993) used cryogenic freezing conditions and clearlydemonstrated this fact. Similar results were obtained by Havet et al. (2000) and LeBail et al.(1998) using dough sticks and freezing conditions closer to industrial freezers.
One of the major inaccuracies encountered in the literature lies in the evaluation of the‘freezing rate’ or ‘freezing velocity’. The disparity in geometry and in mode used for theevaluation of the freezing rate do not permit direct comparisons between the available studies.The term ‘freezing rate’ is generic and is rather used to compare the freezing processes on arelative basis. When a numerical value has to be given to the freezing rate, authors considerit as a global value that applies to the whole geometry of the sample. In fact, the freezingrate or freezing velocity is dependent on the location considered in a given geometry. Thefreezing rate can be numerically represented as the velocity of the phase change front (Plank,

BLUK139-Evans January 23, 2008 17:38
Freezing of Bakery and Dessert Products 187
1941) with distance/time as a unit or as a cooling velocity during phase change with ◦C/timeas a unit. Most authors use the latter approach using an equation (equation (9.1)) in which Tis the temperature and t the time. The SI unit of equation (9.1) is K s−1 but most authors useK min−1.
FT (r ) = T1 − T2
t1 − t2, in K min−1 (9.1)
A study on the evaluation of the freezing rate has been carried out by LeBail Apace and Cornier(1994) and has been applied to yeast activity in frozen dough (LeBail et al., 1998). Resultsshowed that the initial and final criterion of equation (9.1) should be a temperature 1◦C lowerthan the initial freezing point and a temperature ca. 10◦C below the initial freezing point,respectively, for levels ‘1’ and ‘2’ of equation (9.1). In the case of a cylindrical or sphericalgeometry, one can easily demonstrate that the velocity of the freezing front (or freezing rate)is increasing when the freezing front is travelling toward the centre of the geometry (Plank,1941). This has an impact on the freezing process applied to dough systems. When yeastis more tolerant to slower freezing rates, then the freezing process has to be slowed downwhen the freezing front is inside the geometry. A specific study has been carried out byLeBail et al. (2001). A comparison on the impact of the duration of freezing on the breadvolume was done with dough sticks (French baguettes). A higher bread volume was obtainedby withdrawing dough sticks from the freezer when its centre temperature was −5◦C incomparison to withdrawing the bread when its centre temperature reached −12◦C. Freezingwas completed by placing dough sticks in a static freezer (slow freezing). This result wasexplained by the fact that a slower freezing rate was applied in the first case. Grenier (2003)used magnetic resonance imaging as a tool to assess internal porosity of a dough stick duringfermentation (Grenier et al., 2003). The local porosity was observed in a dough stick (5 cmdiameter) during fermentation. In the case of a higher freezing rate, a significant differencewas observed between the dough porosity at surface and at centre. The higher density wasobserved at the centre location, which underwent the highest freezing rate, confirming theresults observed by most authors.
Storage of frozen dough seems to have a significant impact on the yeast performanceand in the baking performance of the frozen dough. Both storage temperature and stor-age duration are influential. Storage at a temperature lower than the glass transition of thedough seems to be preferable, even though the corresponding temperature level might beoutside the scope of most industrial storage conditions (Stecchini et al., 2002) as the glasstransition of a dough system is in the range of −30◦C. Several studies are available on theimpact of storage duration (Hsu et al., 1979; LeBail et al., 1999; Ribotta and LeBail, 2007b;Inoue and Bushuk, 1991; LeBail et al., 1998; Inoue and Bushuk, 1991; Wang and Ponte,1995; Wang and Ponte, 1994; Takasaki and Karasawa, 1992). During storage, ice clustersaffect the uniformity of the dough. During prolonged storage, water diffuses from the ma-trix towards ice clusters resulting in a decrease in the extensibility of the dough (Havet andLeBail, 1999) and in an increase of the amount of frozen water (Lu and Grant, 1999). Theuse of hydrocolloids is sometimes proposed to minimise this water diffusion. Temperaturefluctuation might have an important role as shown by LeBail et al. (1999) who comparedstable storage with storage in an interrupted cold chain. Three weeks of stable conditionswere found comparable to 1 week of storage in an interrupted cold chain in terms of breadvolume.
BLUK139-Evans January 23, 2008 17:38
188 Frozen Food Science and Technology
9.1.2.2 Formulation
Several studies are available on the impact of formulation on the freeze tolerance of dough.The basic formulations can be quite different from one study to the other, using or not, forexample, shortening. The quality of the basic ingredients first seems to be an important issue.The quality of the gluten can be as important as its amount, as shown by Inoue and Bushuk(1992). Flour with higher gluten is usually recommended for frozen dough (i.e. higher then12%). This can be obtained by using specific blends of flour or by adding vital gluten (Wangand Ponte, 1995, 1994).
Another point of interest is the yeast. Yeast amount is usually higher for frozen dough; oftenmultiplied by a factor of 2. Nevertheless, specific studies have focused on the developmentof freeze tolerant yeast (Stecchini et al., 2002; Baguena et al., 1991; Gelinas et al., 1994;Oda et al., 1986). Specific properties of the yeast appear to be important such as trehalosecontent (Meric et al., 1995) or lipid content (Murakami et al., 1996; Gelinas et al., 1991) forexample. Improvers for baking are often used and are made of a mix of selected ingredientssuch as specific amylases, gluten and ascorbic acid. Such mixes are developed and adjustedconstantly by specialised companies and they vary from one country to another dependingon the quality of the flour (for example, humid weather during growing might develop ahigher amylasic activity, dryer weather may result in more damaged starch and in possiblybetter ‘strength’ of the dough due to a modified amount and quality of gluten). Mixes arealso developed for specific applications such as frozen dough and part-baked applications.Amylases facilitate the release of free sugars for the fermentation. Gluten and ascorbic acidmake the rheology of the dough more tolerant to freezing. A specific study (Rouille et al.,2000) showed the combined effect of mixing time, ascorbic acid and α-amylases on selectedquality parameters (fermentation rate, bread volume). They observed that the bread volumewas positively correlated not only to ascorbic acid amount but also to the mixing time. Othertechnical parameters, such as the length of the dough stick at the end of the moulding machine,show that the dough is more elastic with a higher amount of ascorbic acid.
Shortening and emulsifiers have attracted a lot of interest (Matuda et al., 2005). The mostencountered emulsifiers are diacetyl tartrate ester of monoglycerides (DATEM) and sucroseesters. Such substances are most of the time combined with the use of shortening (El-Hadyet al., 1999). They have a combined effect and help in making the gas bubbles that areembedded in the dough during mixing, and that develop during fermentation, smaller andmore numerous (Zounis et al., 2002), giving the dough more tolerance to freezing. (Ribottaet al., 2004, pp. 37, 38). This results also in a foamier crumb texture (numerous cells ofuniform diameter). Such a ‘foamy’ crumb has not been researched for specific products suchas French baguette (crispy rolls) for which the consumers expect a crumb with irregularalveolar structure.
Recently, the use of gums and hydrocolloids have attracted research efforts. One of theexpected roles of hydrocolloids is to immobilise water in order to reduce the ‘freezable’water (or free frozen water) in the dough, resulting in an improved tolerance to storage. Someresearchers found that hydrocolloids can also have an effect of the retrogradation of starch(Ribotta et al., 2004, p. 39). The use of hydrocolloids in frozen dough tends to improve theirstability during storage. Ribotta et al. (2004) observed that guar gum and DATEM improvedbread volume and texture and resulted in a reduced staling rate. Nevertheless, they werenot able to counterbalance the negative effect of frozen storage on dough microstructure.Hydrocolloids are therefore thought mainly to interact with water distribution in the doughand with dough rheology, offering in principle a better tolerance to frozen storage.
BLUK139-Evans January 23, 2008 17:38
Freezing of Bakery and Dessert Products 189
9.1.3 Frozen part-baked bread
9.1.3.1 Introduction
The market share for frozen part-baked bread is growing and this product can be consideredas the success story of BOT. This is probably because of its convenience and because thetechnology is kept under control at an industrial level. Therefore, its production can bemanaged with well-defined protocols and quality targets, and its final transformation requiresminimally trained personnel. One may also mention that this concept of ‘frozen and partiallybaked’ applies to several other products such as frozen pizza, quiches and pies.
Literature references related to frozen part-baked bread are scarce. There are some Frenchreferences related to this product but the information available remains very general (Anony-mous, 1988, 2002). A French patent (LeDuff, 1985) concerns the process of partial baking.This patent is mainly related to the baking conditions; it describes an optimised bakingtemperature profile adapted to the production of part-baked bread. Monzie (2003) presentsspecific data on special breads (ethnic breads). Part-baked breads can indeed offer shops thepossibility to sell several types of breads, without having the constraints (as in the case ofscratch baking) of adjusting the production to the demand of consumers.
Specific problems (detachment) might arise when grains or seeds are applied onto thesurface of ethnic breads. A technological study was carried out by Bonnardel and Maitre(1988) who demonstrated that partial baking process induced higher water loss than conven-tional direct baking (4% versus 2.5%). These authors compared different baking conditions(10 min/210◦C, 15 min/190◦C, 20 min/170◦C) and observed that the water loss increased withthe duration of the baking process. More recently, Leuschner et al. (1998) and Leuschner et al.(1999) studied the impact of storage on the microbial quality and on the moisture distributionof part-baked breads.
Quality loss during frozen storage has been assessed by Vulicevic et al. (2004) in a9-month trial. The change in quality during the first month of storage was acceptable but itdegraded further subsequently. The impact of frozen storage was also studied by Barcenaset al. (2003). Miniature dough samples were set in DSC pans and were stored at −18◦C for7, 15 and 30 days. They were baked in situ and were kept as ‘bread’ samples and stored at4◦C for 2, 4 and 7 days. Amylopectin retrogradation, which is an indicator of bread staling,increased during storage at 4◦C after final baking and then stabilised after 7 days of storage. Itwas observed that this staling phenomenon increased with increasing storage duration. Carrand Tadini (2003) studied the impact of the amount of yeast and of vegetable shortening onthe organoleptic quality and on the texture of frozen part-baked bread. Increasing the amountof yeast resulted in a more aerated crumb, whereas increasing the shortening resulted in asofter crumb. Leuschner et al. (1997) studied the optimisation of the baking parameters forpartially baked bread.
9.1.3.2 Crust flaking of part-baked bread
One of the quality problems for frozen partially baked products is the quality of the crust interms of colour, glossiness and crispiness, Sometimes, flaking off of the crust (crust flakingalso called crust peeling) is mentioned by industry. There is very limited literature availableon this problem. The crust is a very specific part of a crispy roll (typically a French Baguette)and may contain up to one-third of the dry matter. The hydrothermal treatment undergoneby the bread during baking is applied to a crust dry area where non-gelatinised starch is still

BLUK139-Evans January 23, 2008 17:38
190 Frozen Food Science and Technology
Curling on the flanks
Clamp effect on tips
Fig. 9.1 Scheme showing the impact of crumb contraction during bread chilling and freezing. The clampeffect is developing on the tip of a crispy roll. In parallel, crumb contraction induces curling of the surfaceof the flank of the product, which has the thinner and therefore less mechanically resistant crust.
present. This affects the organoleptic perception of the consumer and also the nutritionalvalue of the bread.
The impact of process conditions on crust flaking has been studied by LeBail et al. (2005).The impact of fermentation condition (50% and 90% air humidity at 27◦C), chilling conditionafter partial baking (50–55% and 90–95% air humidity at 20◦C) and freezing condition(blast air freezing, bread centre temperature 35◦C, 45◦C or 55◦C at the freezer entrance) oncrust flaking of part-baked bread was investigated. Crust flaking was evaluated by crushing abaguette on the top and on the sides and collecting the crust flakes. Crust flaking was quantifiedfrom the mass ratio of crust to bread. An experimental design procedure was used to comparethe relative effect of the selected parameters. It was found that the chilling condition afterpartial baking was the most influential parameter on crust flaking. This showed that chillingis only second in order of importance as the reason for crust flaking. Other parameters werenot significantly influential; nevertheless, flaking was minimised by placing the product inthe freezer at −35◦C rather than at a higher temperature. This study showed that crust flakingwas reduced if higher air humidities were used during fermentation and chilling. The authorsobserved that the size of the crust flakes increase with increasing crust flaking ratio. Animportant observation is that even though crust flaking was only fully revealed by the finalbaking process, the phenomenon may be predicted and was obviously visible at the end ofthe freezing process. Two hypotheses are proposed by the authors to explain crust flaking;
Assumption (a): Ice concentration below the crustAssumption (b): A thermo-mechanical problem between the crust and crumb.
The first assumption is driven by the fact that during freezing, the centre of the bread remainshot for a certain duration while the freezing front is travelling from the surface of the bread.This situation induces a strong vapour pressure gradient, which results in moisture diffusionfrom the warmer locations (centre) toward the cooler location (freezing front). The accumula-tion of ice on the freezing front might expose the crumb–crust interface to mechanical stress.This assumption has been investigated by Hamdami et al. (2004a, 2004b, 2004c); they foundthat the small amount of water collected by the freezing front was not significant enough tobe considered the cause of crust flaking.
The second assumption is driven by the fact that bread contracts during chilling andfreezing. This fact can be visible on baked bread especially on the flanks of a baguette(curling of the surface). Crust flaking mostly occurs on the flanks and on the tip of a baguette.The scheme proposed in Fig. 9.1 explains the clamp effect that develops on the tips and thecurling of the flanks with thinner crust thickness and therefore these two result in deformationcaused by crumb contraction.

BLUK139-Evans January 23, 2008 17:38
Freezing of Bakery and Dessert Products 191
The evidence of crumb contraction was first assessed using magnetic resonance imaging(MRI) by Lucas et al. (2005). They found MRI signal amplitude to increase below the crustduring chilling and freezing; they attributed it to densification of the crumb–crust material.More recently, the impact of selected enzymes on crumb contraction was studied by Ribottaand LeBail (2007c). Relative strains corresponding to crumb contraction can reach a fewpercent during the chilling and freezing phases. The strain (contraction of the crumb) seemsto be related to the retrogradation phenomenon which corresponds to the recrystallisation ofmacromolecules that are gelatinised during baking. The contraction of the crumb exposes thecrust to stresses. Contraction stops once the crumb reaches the glass transition temperature.In this study, crumb contraction was studied using a Dynamic Mechanical Analyser operatedas a dilatometer. A piece of crumb (8-mm thick) was exposed to a temperature scan (3◦C permin) from 20◦C to −70◦C while crumb contraction was continuously logged.
Additional work (Ribotta and LeBail, 2007c) showed that crumb contraction seems to berelated to amylose recrystallisation, which occurs during the post-baking chilling process.Specific technological aids such as enzymes or adapted processing conditions may reduce thecontraction of the crumb; work on this is in progress. It also seems that the milder the bakingprocess, the greater the contraction of crumb. Optimisation of the partial baking conditionmay therefore also be an objective of further research.
9.1.3.3 Conclusion on frozen part-baked bread
One can easily see that the production of high-quality frozen part-baked bread remains achallenge for the food industry. The concept of quality varies from one country to another.Texture of the crust is obviously a central characteristic that is difficult to control; possiblyeach step of the process has its own role in the final crust quality. The quality of the flour,the mixing conditions, the fermentation conditions, condition of the batter at the end offermentation, the partial baking conditions, the chilling conditions, the freezing conditions,the storage conditions, the final baking conditions are process parameters that may impactthe final quality of the crust. The formulation is also very important and may need adaptationfrom traditional formulations for frozen part-baked production.
9.1.4 Freezing of partially fermented dough
Partially fermented dough (also called ‘ready to bake’ or ‘ovenrise’) has appeared in themarket over the last decade and has become especially popular over the last 5 years. The ob-jective of using partially fermented dough is to make a product that may ideally be transferreddirectly from the freezer to the oven.
Usually conventional blast air freezing equipment is used for freezing of prefermenteddough. A high freezing rate is recommended in the literature, and so an efficient freezershould be used. Cryogenic freezing may be used, even though the operating cost of suchequipment is hardly justified by the low cost of the bakery products.
The degree of fermentation before freezing plays an important role. The structure of thedough, which is made of closed cells will collapse due to gas contraction during freezing and.the volume that is lost has to be recovered during the thawing and baking phases. Hanneforthet al. (1994) recommend a fermentation ratio of 1/3 to 1/2 in comparison to full fermentation(volume ratio between non-frozen dough and fermented dough). Research work carried outby Rasanen (1998) investigated the frozen storage stability of pre-fermented frozen breaddough during frozen storage for 14 days at −20◦C. Shorter fermentation time (25 min versus
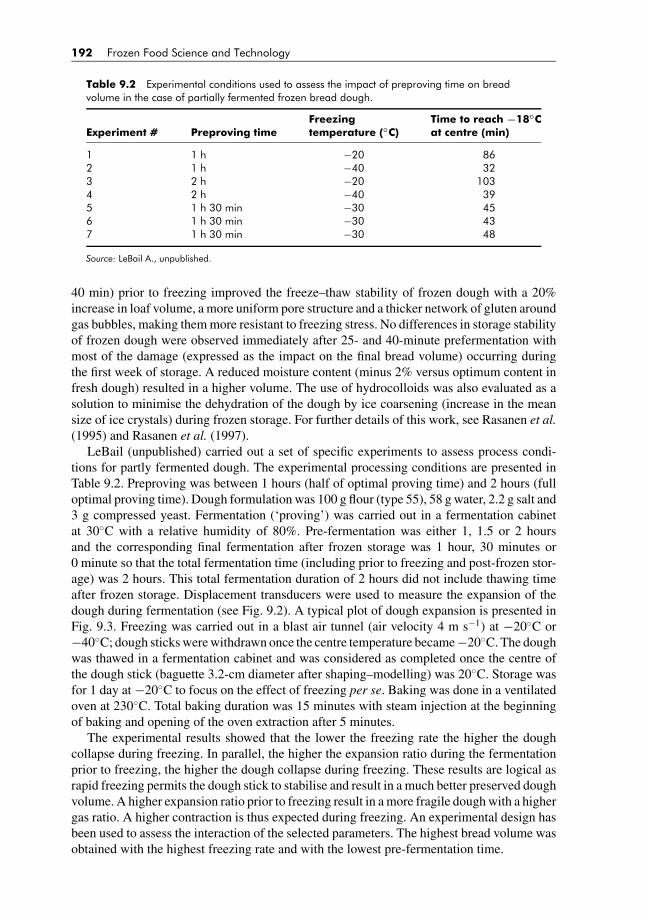
BLUK139-Evans January 23, 2008 17:38
192 Frozen Food Science and Technology
Table 9.2 Experimental conditions used to assess the impact of preproving time on breadvolume in the case of partially fermented frozen bread dough.
Freezing Time to reach −18◦CExperiment # Preproving time temperature (◦C) at centre (min)
1 1 h −20 862 1 h −40 323 2 h −20 1034 2 h −40 395 1 h 30 min −30 456 1 h 30 min −30 437 1 h 30 min −30 48
Source: LeBail A., unpublished.
40 min) prior to freezing improved the freeze–thaw stability of frozen dough with a 20%increase in loaf volume, a more uniform pore structure and a thicker network of gluten aroundgas bubbles, making them more resistant to freezing stress. No differences in storage stabilityof frozen dough were observed immediately after 25- and 40-minute prefermentation withmost of the damage (expressed as the impact on the final bread volume) occurring duringthe first week of storage. A reduced moisture content (minus 2% versus optimum content infresh dough) resulted in a higher volume. The use of hydrocolloids was also evaluated as asolution to minimise the dehydration of the dough by ice coarsening (increase in the meansize of ice crystals) during frozen storage. For further details of this work, see Rasanen et al.(1995) and Rasanen et al. (1997).
LeBail (unpublished) carried out a set of specific experiments to assess process condi-tions for partly fermented dough. The experimental processing conditions are presented inTable 9.2. Preproving was between 1 hours (half of optimal proving time) and 2 hours (fulloptimal proving time). Dough formulation was 100 g flour (type 55), 58 g water, 2.2 g salt and3 g compressed yeast. Fermentation (‘proving’) was carried out in a fermentation cabinetat 30◦C with a relative humidity of 80%. Pre-fermentation was either 1, 1.5 or 2 hoursand the corresponding final fermentation after frozen storage was 1 hour, 30 minutes or0 minute so that the total fermentation time (including prior to freezing and post-frozen stor-age) was 2 hours. This total fermentation duration of 2 hours did not include thawing timeafter frozen storage. Displacement transducers were used to measure the expansion of thedough during fermentation (see Fig. 9.2). A typical plot of dough expansion is presented inFig. 9.3. Freezing was carried out in a blast air tunnel (air velocity 4 m s−1) at −20◦C or−40◦C; dough sticks were withdrawn once the centre temperature became −20◦C. The doughwas thawed in a fermentation cabinet and was considered as completed once the centre ofthe dough stick (baguette 3.2-cm diameter after shaping–modelling) was 20◦C. Storage wasfor 1 day at −20◦C to focus on the effect of freezing per se. Baking was done in a ventilatedoven at 230◦C. Total baking duration was 15 minutes with steam injection at the beginningof baking and opening of the oven extraction after 5 minutes.
The experimental results showed that the lower the freezing rate the higher the doughcollapse during freezing. In parallel, the higher the expansion ratio during the fermentationprior to freezing, the higher the dough collapse during freezing. These results are logical asrapid freezing permits the dough stick to stabilise and result in a much better preserved doughvolume. A higher expansion ratio prior to freezing result in a more fragile dough with a highergas ratio. A higher contraction is thus expected during freezing. An experimental design hasbeen used to assess the interaction of the selected parameters. The highest bread volume wasobtained with the highest freezing rate and with the lowest pre-fermentation time.
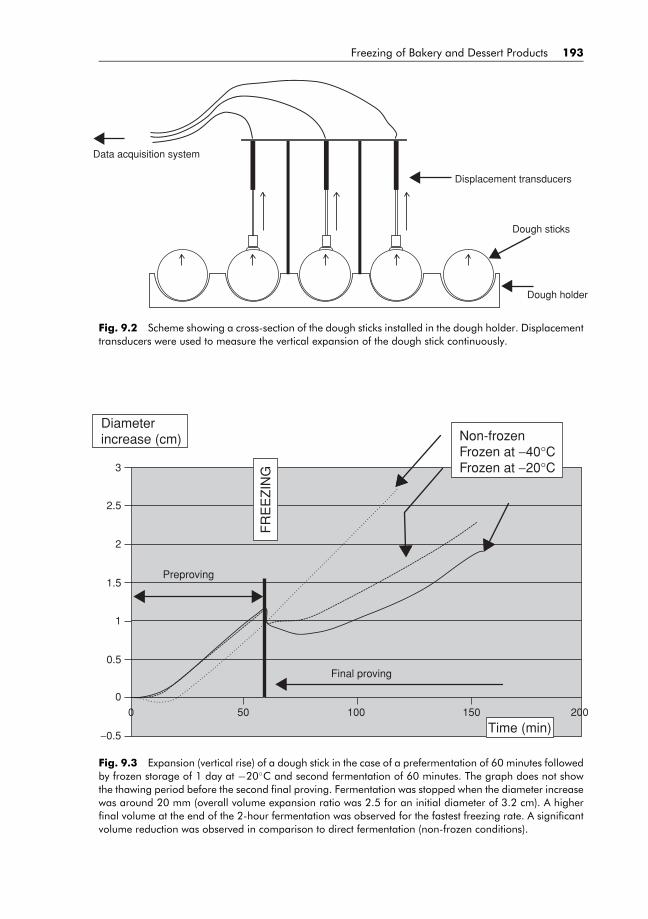
BLUK139-Evans January 23, 2008 17:38
Freezing of Bakery and Dessert Products 193
Dough holder
Dough sticks
Displacement transducers
Data acquisition system
Fig. 9.2 Scheme showing a cross-section of the dough sticks installed in the dough holder. Displacementtransducers were used to measure the vertical expansion of the dough stick continuously.
3
2.5
1.5
0.5
−0.5
2
1
0
50 100 150 2000
FR
EE
ZIN
G
Diameter increase (cm) Non-frozen
Frozen at −40°C Frozen at −20°C
Time (min)
Preproving
Final proving
Fig. 9.3 Expansion (vertical rise) of a dough stick in the case of a prefermentation of 60 minutes followedby frozen storage of 1 day at −20◦C and second fermentation of 60 minutes. The graph does not showthe thawing period before the second final proving. Fermentation was stopped when the diameter increasewas around 20 mm (overall volume expansion ratio was 2.5 for an initial diameter of 3.2 cm). A higherfinal volume at the end of the 2-hour fermentation was observed for the fastest freezing rate. A significantvolume reduction was observed in comparison to direct fermentation (non-frozen conditions).
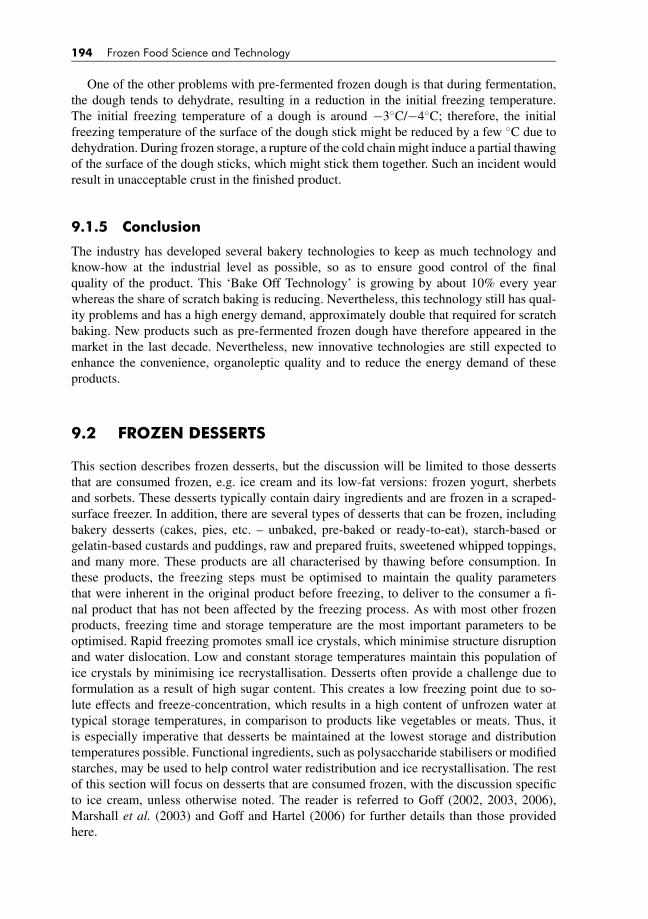
BLUK139-Evans January 23, 2008 17:38
194 Frozen Food Science and Technology
One of the other problems with pre-fermented frozen dough is that during fermentation,the dough tends to dehydrate, resulting in a reduction in the initial freezing temperature.The initial freezing temperature of a dough is around −3◦C/−4◦C; therefore, the initialfreezing temperature of the surface of the dough stick might be reduced by a few ◦C due todehydration. During frozen storage, a rupture of the cold chain might induce a partial thawingof the surface of the dough sticks, which might stick them together. Such an incident wouldresult in unacceptable crust in the finished product.
9.1.5 Conclusion
The industry has developed several bakery technologies to keep as much technology andknow-how at the industrial level as possible, so as to ensure good control of the finalquality of the product. This ‘Bake Off Technology’ is growing by about 10% every yearwhereas the share of scratch baking is reducing. Nevertheless, this technology still has qual-ity problems and has a high energy demand, approximately double that required for scratchbaking. New products such as pre-fermented frozen dough have therefore appeared in themarket in the last decade. Nevertheless, new innovative technologies are still expected toenhance the convenience, organoleptic quality and to reduce the energy demand of theseproducts.
9.2 FROZEN DESSERTS
This section describes frozen desserts, but the discussion will be limited to those dessertsthat are consumed frozen, e.g. ice cream and its low-fat versions: frozen yogurt, sherbetsand sorbets. These desserts typically contain dairy ingredients and are frozen in a scraped-surface freezer. In addition, there are several types of desserts that can be frozen, includingbakery desserts (cakes, pies, etc. – unbaked, pre-baked or ready-to-eat), starch-based orgelatin-based custards and puddings, raw and prepared fruits, sweetened whipped toppings,and many more. These products are all characterised by thawing before consumption. Inthese products, the freezing steps must be optimised to maintain the quality parametersthat were inherent in the original product before freezing, to deliver to the consumer a fi-nal product that has not been affected by the freezing process. As with most other frozenproducts, freezing time and storage temperature are the most important parameters to beoptimised. Rapid freezing promotes small ice crystals, which minimise structure disruptionand water dislocation. Low and constant storage temperatures maintain this population ofice crystals by minimising ice recrystallisation. Desserts often provide a challenge due toformulation as a result of high sugar content. This creates a low freezing point due to so-lute effects and freeze-concentration, which results in a high content of unfrozen water attypical storage temperatures, in comparison to products like vegetables or meats. Thus, itis especially imperative that desserts be maintained at the lowest storage and distributiontemperatures possible. Functional ingredients, such as polysaccharide stabilisers or modifiedstarches, may be used to help control water redistribution and ice recrystallisation. The restof this section will focus on desserts that are consumed frozen, with the discussion specificto ice cream, unless otherwise noted. The reader is referred to Goff (2002, 2003, 2006),Marshall et al. (2003) and Goff and Hartel (2006) for further details than those providedhere.
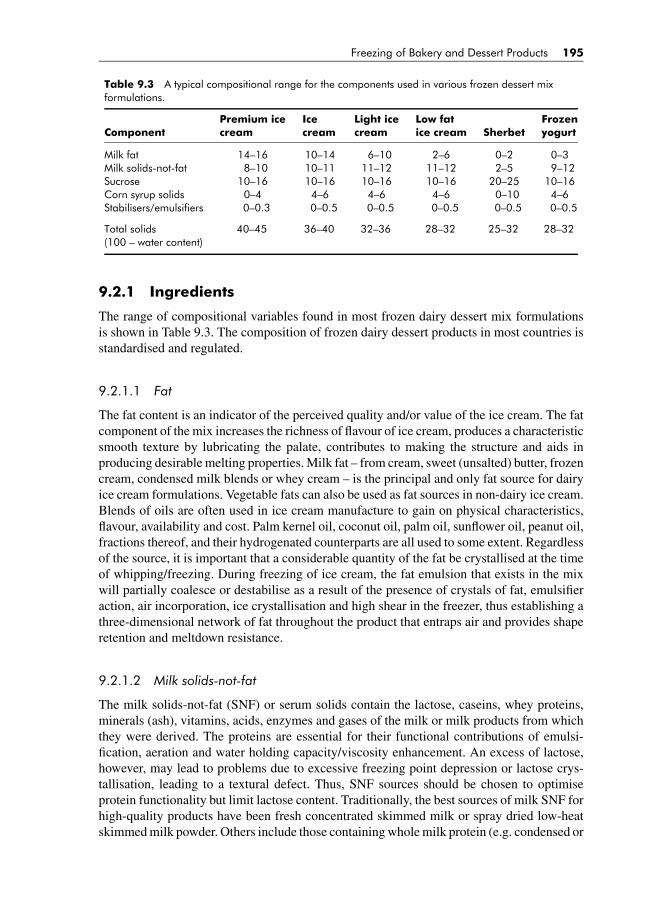
BLUK139-Evans January 23, 2008 17:38
Freezing of Bakery and Dessert Products 195
Table 9.3 A typical compositional range for the components used in various frozen dessert mixformulations.
Premium ice Ice Light ice Low fat FrozenComponent cream cream cream ice cream Sherbet yogurt
Milk fat 14–16 10–14 6–10 2–6 0–2 0–3Milk solids-not-fat 8–10 10–11 11–12 11–12 2–5 9–12Sucrose 10–16 10–16 10–16 10–16 20–25 10–16Corn syrup solids 0–4 4–6 4–6 4–6 0–10 4–6Stabilisers/emulsifiers 0–0.3 0–0.5 0–0.5 0–0.5 0–0.5 0–0.5
Total solids(100 – water content)
40–45 36–40 32–36 28–32 25–32 28–32
9.2.1 Ingredients
The range of compositional variables found in most frozen dairy dessert mix formulationsis shown in Table 9.3. The composition of frozen dairy dessert products in most countries isstandardised and regulated.
9.2.1.1 Fat
The fat content is an indicator of the perceived quality and/or value of the ice cream. The fatcomponent of the mix increases the richness of flavour of ice cream, produces a characteristicsmooth texture by lubricating the palate, contributes to making the structure and aids inproducing desirable melting properties. Milk fat – from cream, sweet (unsalted) butter, frozencream, condensed milk blends or whey cream – is the principal and only fat source for dairyice cream formulations. Vegetable fats can also be used as fat sources in non-dairy ice cream.Blends of oils are often used in ice cream manufacture to gain on physical characteristics,flavour, availability and cost. Palm kernel oil, coconut oil, palm oil, sunflower oil, peanut oil,fractions thereof, and their hydrogenated counterparts are all used to some extent. Regardlessof the source, it is important that a considerable quantity of the fat be crystallised at the timeof whipping/freezing. During freezing of ice cream, the fat emulsion that exists in the mixwill partially coalesce or destabilise as a result of the presence of crystals of fat, emulsifieraction, air incorporation, ice crystallisation and high shear in the freezer, thus establishing athree-dimensional network of fat throughout the product that entraps air and provides shaperetention and meltdown resistance.
9.2.1.2 Milk solids-not-fat
The milk solids-not-fat (SNF) or serum solids contain the lactose, caseins, whey proteins,minerals (ash), vitamins, acids, enzymes and gases of the milk or milk products from whichthey were derived. The proteins are essential for their functional contributions of emulsi-fication, aeration and water holding capacity/viscosity enhancement. An excess of lactose,however, may lead to problems due to excessive freezing point depression or lactose crys-tallisation, leading to a textural defect. Thus, SNF sources should be chosen to optimiseprotein functionality but limit lactose content. Traditionally, the best sources of milk SNF forhigh-quality products have been fresh concentrated skimmed milk or spray dried low-heatskimmed milk powder. Others include those containing whole milk protein (e.g. condensed or
BLUK139-Evans January 23, 2008 17:38
196 Frozen Food Science and Technology
sweetened condensed whole milk, milk protein concentrates, dry or condensed buttermilk),those containing casein (e.g. sodium caseinate), or those containing whey proteins (e.g. driedor condensed whey, whey protein concentrate, whey protein isolate).
9.2.1.3 Sweeteners
Sweeteners improve the texture and palatability of ice cream and enhance flavours. Theirability to lower the freezing point of a solution imparts a measure of control over thetemperature–hardness relationship. The most common sweetening agent is sucrose, aloneor in combination with other sugars. In determining the appropriate blend of sweeteners touse, the sweetness, freezing point depression and contribution to total solids – all have tobe considered. Sucrose and lactose are most commonly present in ice cream in the super-saturated or glassy state, with few crystals being present. In many ice cream formulations,sweeteners derived from corn syrup are substituted for all or a portion of the sucrose. Theuse of corn starch hydrolysis products (corn syrups or glucose solids) in ice cream is gener-ally perceived to provide greater smoothness by contributing to a firmer and more chewybody, to provide better meltdown characteristics, to reduce heat shock potential, whichimproves the shelf-life of the finished product, and to provide an economical source ofsolids.
9.2.1.4 Functional additives (stabilisers, emulsifiers)
Ice cream stabilisers are a group of hydrocolloid ingredients (usually polysaccharides) usedin ice cream formulations to produce smoothness in body and texture and retard or reduce thegrowth of ice and lactose crystals during storage, especially during periods of temperaturefluctuation, known as heat shock. Thus, by physical means, they effectively increase the shelf-life of ice cream. They also increase the viscosity of the mix, aid in suspension of flavouringparticles in the semi-frozen ice cream, produce a stable foam with easy cut-off and stiffnessat the barrel freezer for packaging, slow down moisture migration from the product to thepackage or the air in frozen product, and contributes to preventing shrinkage of the productvolume during storage. Stabilisers commonly used include: locust bean (carob) gum, guargum, carboxymethyl cellulose, sodium alginate, xanthan, and gelatin. Each stabiliser hasits own characteristics and often two or more of these stabilisers are used in combination tolend synergistic properties to each other and improve their overall effectiveness. Carrageenanis a secondary hydrocolloid used to prevent serum separation in the mix, which is usuallypromoted by one of the other stabilisers. Hence, it is found in most stabiliser blends
Small-molecule surfactants (emulsifiers) are usually integrated with the stabilisers in pro-prietary blends but their function and action are very different from those of the stabilisers.They are used to: (a) improve the aeration properties of the mix; (b) produce an ice cream atextrusion with good shape retention properties (referred to as ‘dryness’) to facilitate moulding,fancy extrusion and novelty product manufacture; (c) produce a smoother body and texture inthe finished product; and (d) produce a product with good shape-retention properties duringmelting. Their mechanism of action can be summarised as follows: they lower the fat–waterinterfacial tension in the mix, resulting in protein displacement from the fat globule surface,which in turn reduces the stability of the fat globule to partial coalescence that occurs duringthe whipping and freezing process, leading to the formation of an aggregated fat structure inthe frozen product which contributes greatly to texture and melt-down properties. Emulsifiersused in ice cream manufacture are of two main types: mono- and di-glycerides and sorbitan

BLUK139-Evans January 23, 2008 17:38
Freezing of Bakery and Dessert Products 197
esters. Of the latter, polysorbate 80 is a very strong promoter of fat destabilisation in icecream and is used in many commercial stabiliser/emulsifier blends.
9.2.1.5 Flavours
Liquid flavours and colours, those that are to be homogeneous throughout the frozen product,are added to the flavour tank prior to scraped-surface freezing while particulate flavours areadded post-freezing. While there are numerous flavours that exist for ice cream, there are a fewlimitations, such as the effect of the flavour addition on protein stability in the mix (ethanol,for example), the effect on freezing point depression (in the case of high sugar flavours), thewater activity balance between the frozen ice cream and the ingredient (as it affects watermigration), hardness of the flavour ingredient at product consumption temperatures, etc.
9.2.2 Processes
The manufacturing process for most of these products is similar. It involves the preparationof a liquid mix; whipping and freezing this mix dynamically under high shear to a soft, semi-frozen slurry; incorporation of flavouring ingredients to this partially frozen mix; packagingthe product, and further freezing (hardening) of the product under static, quiescent conditions.Swept (scraped)-surface freezers are used for the first freezing step, while forced convectionfreezers, such as air blast tunnels or rooms, or plate-type conduction freezers are used for thesecond freezing step.
9.2.2.1 Mixing, pasteurisation, homogenisation and aging
Ice cream processing operations can be divided into two distinct stages: mix manufactureand freezing operations (Fig. 9.4). The manufacture of ice cream mix involves the followingunit operations: combination and blending of ingredients, batch or continuous pasteurisation,homogenisation and ageing. Ingredients are chosen to supply the desired components, e.g.cream or butter to supply fat, on the basis of availability, ease of handling, desired qualityand cost. An algebraic solution of the formulation is required, since many of the ingredientssupply more than one component.
Pasteurisation is designed to kill pathogenic bacteria. In addition, it serves a useful rolein reducing the total bacterial load and in solubilising some of the components (proteins andstabilisers). Both batch (>∼69◦C for ∼30 min) and continuous (high temperature–short time,HTST, >∼80◦C for ∼15–25 s) systems are in common use.
Homogenisation is responsible for the formation of fat emulsion by forcing the hot mixthrough a small orifice under pressures of 15.5–18.9 MPa (2000–3000 psi gauge), dependingon the composition of the mix. Small fat globules are needed to establish the appropriatedegree of fat partial coalescence. A large increase in the surface area of the fat globules isresponsible in part for the formation of the fat globule membrane, comprised of adsorbed ma-terials that lower the interfacial free energy of the fat globules. With single-stage homogenis-ers, fat globules tend to cluster as bare fat surfaces come together or adsorbed moleculesshared. Therefore, a second homogenising valve is frequently placed immediately after thefirst with applied back pressures of 3.4 MPa (500 psi gauge), allowing more time for surfaceadsorption to occur.
An ageing time of 4 h or longer following mix processing prior to freezing is recommendedto produce a smoother texture and better quality product. The temperature of the mix should

BLUK139-Evans January 23, 2008 17:38
198 Frozen Food Science and Technology
Blending
Batch Pasteurization Homogenization
Continuous Pasteurization/Homogenization/Cooling
Ageing
Continuous Freezing
Packaging
Hardening Storage/Distribution
Batch Freezing/Whipping
Flavour/Colour addition
air incorporation
Particulate addition
Cooling
-Fat, 10–16% -Milk SNF, 9–12%
-Emulsifier, 0.1–0.2% -Water, 60–64%
Formulation
liquid ingredients dry ingredients
-Sweetener, 14–16% -Stabilizer, 0.1–0.2%
Fig. 9.4 Flow diagram of the ice cream manufacturing process.
be maintained as low as possible without freezing (≤4◦C). Ageing allows for hydration ofmilk proteins and stabilisers (some increase in viscosity occurs during the ageing period),crystallisation of the fat globules and membrane rearrangement. The appropriate ratio ofsolid:liquid fat must be attained at this stage, a function of temperature and the triglyceridecomposition of the fat used, as a partially crystalline emulsion is needed for partial coalescenceduring the whipping and freezing steps. Emulsifiers generally displace milk proteins fromthe fat surface during the ageing period.
9.2.2.2 Dynamic freezing
Ice cream freezing also consists of two distinct stages: passing mix through a swept (scraped)-surface heat exchanger under high shear conditions to promote extensive ice crystallisationand air incorporation; and freezing the packaged ice cream under conditions that promoterapid freezing and small ice crystal sizes. The concomitant freezing and whipping processis one of the most important unit operations for the development of quality, palatability, andyield of the finished product. Flavouring and colouring can be added as desired to the mixprior to passing through the barrel freezer, and particulate flavouring ingredients, such asnuts, fruits, candy pieces, or ripple sauces, can be added to the semi-frozen product at theexit from the barrel freezer prior to packaging and hardening.
Continuous freezers dominate the ice cream industry. In this type of process, mix is drawnfrom the flavouring tank into a swept-surface heat exchanger (Fig. 9.5), which is jacketedwith a liquid, boiling refrigerant (e.g. ammonia). Following the incorporation of air into the
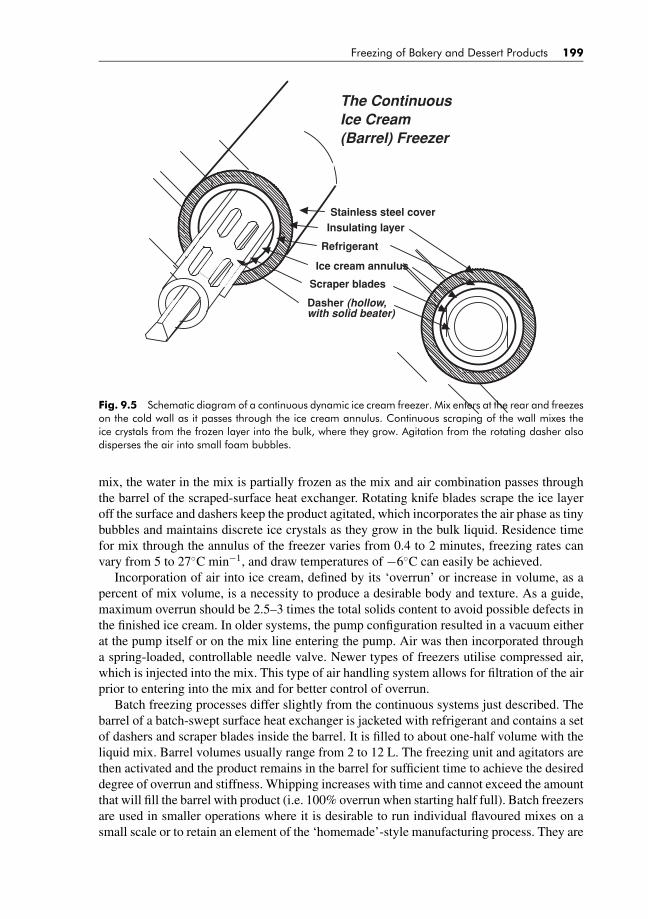
BLUK139-Evans January 23, 2008 17:38
Freezing of Bakery and Dessert Products 199
Insulating layer
Refrigerant
Ice cream annulus
Scraper blades
Stainless steel cover
Dasher (hollow, with solid beater)
The ContinuousIce Cream(Barrel) Freezer
Fig. 9.5 Schematic diagram of a continuous dynamic ice cream freezer. Mix enters at the rear and freezeson the cold wall as it passes through the ice cream annulus. Continuous scraping of the wall mixes theice crystals from the frozen layer into the bulk, where they grow. Agitation from the rotating dasher alsodisperses the air into small foam bubbles.
mix, the water in the mix is partially frozen as the mix and air combination passes throughthe barrel of the scraped-surface heat exchanger. Rotating knife blades scrape the ice layeroff the surface and dashers keep the product agitated, which incorporates the air phase as tinybubbles and maintains discrete ice crystals as they grow in the bulk liquid. Residence timefor mix through the annulus of the freezer varies from 0.4 to 2 minutes, freezing rates canvary from 5 to 27◦C min−1, and draw temperatures of −6◦C can easily be achieved.
Incorporation of air into ice cream, defined by its ‘overrun’ or increase in volume, as apercent of mix volume, is a necessity to produce a desirable body and texture. As a guide,maximum overrun should be 2.5–3 times the total solids content to avoid possible defects inthe finished ice cream. In older systems, the pump configuration resulted in a vacuum eitherat the pump itself or on the mix line entering the pump. Air was then incorporated througha spring-loaded, controllable needle valve. Newer types of freezers utilise compressed air,which is injected into the mix. This type of air handling system allows for filtration of the airprior to entering into the mix and for better control of overrun.
Batch freezing processes differ slightly from the continuous systems just described. Thebarrel of a batch-swept surface heat exchanger is jacketed with refrigerant and contains a setof dashers and scraper blades inside the barrel. It is filled to about one-half volume with theliquid mix. Barrel volumes usually range from 2 to 12 L. The freezing unit and agitators arethen activated and the product remains in the barrel for sufficient time to achieve the desireddegree of overrun and stiffness. Whipping increases with time and cannot exceed the amountthat will fill the barrel with product (i.e. 100% overrun when starting half full). Batch freezersare used in smaller operations where it is desirable to run individual flavoured mixes on asmall scale or to retain an element of the ‘homemade’-style manufacturing process. They are
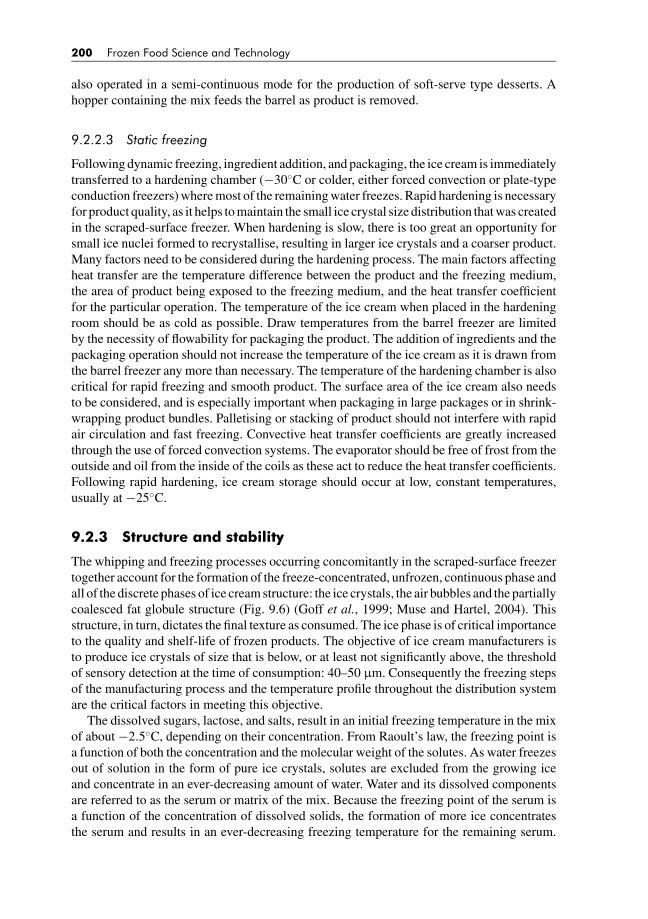
BLUK139-Evans January 23, 2008 17:38
200 Frozen Food Science and Technology
also operated in a semi-continuous mode for the production of soft-serve type desserts. Ahopper containing the mix feeds the barrel as product is removed.
9.2.2.3 Static freezing
Following dynamic freezing, ingredient addition, and packaging, the ice cream is immediatelytransferred to a hardening chamber (−30◦C or colder, either forced convection or plate-typeconduction freezers) where most of the remaining water freezes. Rapid hardening is necessaryfor product quality, as it helps to maintain the small ice crystal size distribution that was createdin the scraped-surface freezer. When hardening is slow, there is too great an opportunity forsmall ice nuclei formed to recrystallise, resulting in larger ice crystals and a coarser product.Many factors need to be considered during the hardening process. The main factors affectingheat transfer are the temperature difference between the product and the freezing medium,the area of product being exposed to the freezing medium, and the heat transfer coefficientfor the particular operation. The temperature of the ice cream when placed in the hardeningroom should be as cold as possible. Draw temperatures from the barrel freezer are limitedby the necessity of flowability for packaging the product. The addition of ingredients and thepackaging operation should not increase the temperature of the ice cream as it is drawn fromthe barrel freezer any more than necessary. The temperature of the hardening chamber is alsocritical for rapid freezing and smooth product. The surface area of the ice cream also needsto be considered, and is especially important when packaging in large packages or in shrink-wrapping product bundles. Palletising or stacking of product should not interfere with rapidair circulation and fast freezing. Convective heat transfer coefficients are greatly increasedthrough the use of forced convection systems. The evaporator should be free of frost from theoutside and oil from the inside of the coils as these act to reduce the heat transfer coefficients.Following rapid hardening, ice cream storage should occur at low, constant temperatures,usually at −25◦C.
9.2.3 Structure and stability
The whipping and freezing processes occurring concomitantly in the scraped-surface freezertogether account for the formation of the freeze-concentrated, unfrozen, continuous phase andall of the discrete phases of ice cream structure: the ice crystals, the air bubbles and the partiallycoalesced fat globule structure (Fig. 9.6) (Goff et al., 1999; Muse and Hartel, 2004). Thisstructure, in turn, dictates the final texture as consumed. The ice phase is of critical importanceto the quality and shelf-life of frozen products. The objective of ice cream manufacturers isto produce ice crystals of size that is below, or at least not significantly above, the thresholdof sensory detection at the time of consumption: 40–50 μm. Consequently the freezing stepsof the manufacturing process and the temperature profile throughout the distribution systemare the critical factors in meeting this objective.
The dissolved sugars, lactose, and salts, result in an initial freezing temperature in the mixof about −2.5◦C, depending on their concentration. From Raoult’s law, the freezing point isa function of both the concentration and the molecular weight of the solutes. As water freezesout of solution in the form of pure ice crystals, solutes are excluded from the growing iceand concentrate in an ever-decreasing amount of water. Water and its dissolved componentsare referred to as the serum or matrix of the mix. Because the freezing point of the serum isa function of the concentration of dissolved solids, the formation of more ice concentratesthe serum and results in an ever-decreasing freezing temperature for the remaining serum.
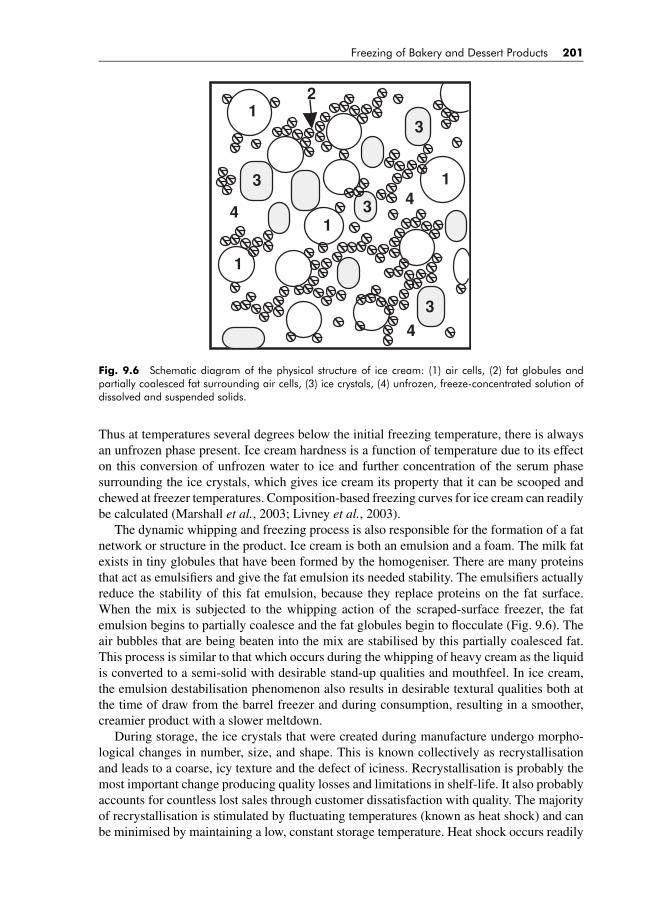
BLUK139-Evans January 23, 2008 17:38
Freezing of Bakery and Dessert Products 201
1
1
1
1
2
3
3
3
3
4
4
4
Fig. 9.6 Schematic diagram of the physical structure of ice cream: (1) air cells, (2) fat globules andpartially coalesced fat surrounding air cells, (3) ice crystals, (4) unfrozen, freeze-concentrated solution ofdissolved and suspended solids.
Thus at temperatures several degrees below the initial freezing temperature, there is alwaysan unfrozen phase present. Ice cream hardness is a function of temperature due to its effecton this conversion of unfrozen water to ice and further concentration of the serum phasesurrounding the ice crystals, which gives ice cream its property that it can be scooped andchewed at freezer temperatures. Composition-based freezing curves for ice cream can readilybe calculated (Marshall et al., 2003; Livney et al., 2003).
The dynamic whipping and freezing process is also responsible for the formation of a fatnetwork or structure in the product. Ice cream is both an emulsion and a foam. The milk fatexists in tiny globules that have been formed by the homogeniser. There are many proteinsthat act as emulsifiers and give the fat emulsion its needed stability. The emulsifiers actuallyreduce the stability of this fat emulsion, because they replace proteins on the fat surface.When the mix is subjected to the whipping action of the scraped-surface freezer, the fatemulsion begins to partially coalesce and the fat globules begin to flocculate (Fig. 9.6). Theair bubbles that are being beaten into the mix are stabilised by this partially coalesced fat.This process is similar to that which occurs during the whipping of heavy cream as the liquidis converted to a semi-solid with desirable stand-up qualities and mouthfeel. In ice cream,the emulsion destabilisation phenomenon also results in desirable textural qualities both atthe time of draw from the barrel freezer and during consumption, resulting in a smoother,creamier product with a slower meltdown.
During storage, the ice crystals that were created during manufacture undergo morpho-logical changes in number, size, and shape. This is known collectively as recrystallisationand leads to a coarse, icy texture and the defect of iciness. Recrystallisation is probably themost important change producing quality losses and limitations in shelf-life. It also probablyaccounts for countless lost sales through customer dissatisfaction with quality. The majorityof recrystallisation is stimulated by fluctuating temperatures (known as heat shock) and canbe minimised by maintaining a low, constant storage temperature. Heat shock occurs readily
BLUK139-Evans January 23, 2008 17:38
202 Frozen Food Science and Technology
in ice cream products. If the temperature during the frozen storage increases, some of the icecrystals melt, particularly the smaller ones as they have the highest free energy and lowestmelting point. Consequently, the amount of unfrozen water in the serum phase increases.Conversely, as temperatures decrease, water does not renucleate but rather refreezes on thesurface of larger crystals, resulting in the total number of crystals diminish and the meancrystal size increase. Temperature fluctuations are common during frozen storage, due to thecyclic nature of refrigeration systems and the need for automatic defrost. However, mishan-dling of product is probably the biggest culprit. If one tracks the temperature history of icecream during distribution, retailing, and finally consumption, one would find a great numberof temperature fluctuations. Each time the temperature changes, the ice to serum contentchanges, and the smaller ice crystals decrease in numbers or disappear while the larger onesgrow even larger, leading to a change in the mean crystal size distribution. Proper formulationwith stabilisers designed to combat heat shock is an essential defence against the inevitablegrowth of ice crystals.
REFERENCES
Anon, M.C., Le-Bail, A. and Leon, A.E. (2004). Effect of freezing on dough ingredients. In: Y.H. Hui, et al.eds. Handbook of Frozen Foods. New York: Marcel Dekker., pp. 571–580.
Anonymous. (2002). Le Pret a cuire, une revolution prometteuse. Filiere Gourmande 93, 24–26.Anonymous. (1988). Precuit surgele-precuit frais. Strategies Gourmandes June 1988: pp. 62–68.Baguena, R., Soriano, M.D., Martinez, A.M.A. and Barber, C.B.D. (1991). Viability and performance of pure
yeast strains in frozen wheat dough. Journal of Food Science 56(6), 1690–1694.Barcenas, M.E., Haros, M., Benedito, C. and Rosell, C.M. (2003). Effect of freezing and frozen storage on
the staling of partbaked bread. Food Research International 36, 863–869.Bonnardel, P. and Maitre, H. (1988). La technologie boulangere du pain francais precuit. Industries des
Cereales 51(fevrier 88), 31–37.Carr, L.G. and Tadini, C.C. (2003). Influence of yeast and vegetable shortening on physical and textural
parameters of frozen part baked French bread. Lebensmittel-Wissenschaft und Technologie 36, 609–614.El-Hady, E.A., El-Samahy, S.K. and Brummer, J.M. (1999). Effect of oxidants, sodium-stearoyl-2-lactylate
and their mixtures on rheological and baking properties of nonprefermented frozen doughs. Lebensmittel-Wissenschaft und Technologie 32(7), 446–454.
Fanta, G.F. and Christianson, D.D. (1996). Starch Hydrocolloids composites prepared by steam jet cooking.
Food Hydrocolloids 10(2), 173–178.Gelinas, P., Fiset, G., Willemot, C. and Goulet, J. (1991). Lipid content and cryotolerance of baker’s yeast in
frozen dough. Applied and Environmental Microbiology 57(2), 463–468.Gelinas, P., Lagimoniere, M. and Rodrigue, N. (1994). Performance of cream or compressed yeast in frozen
and nonfrozen doughs. Cereal Chemistry 71(2), 183–186.Giannou, V. and Tzia, C. (2007). Frozen dough bread: Quality and textural behavior during prolonged storage
– Prediction of final product characteristics. Journal of Food Engineering 79(3), 929–934.Goff, H.D. (2006). Ice cream. In: P.F. Fox and P.L.H. McSweeney, eds. Advanced Dairy Chemistry – 2. Lipids,
3rd edn. New York: Kluwer Academic, pp. 441–450.Goff, H.D. and Hartel, R.W. (2006). Ice cream and frozen desserts. In: Y. H. Hui, ed. Handbook of Food
Science, Technology and Engineering, Vol. 4 Boca Raton. FL: CRC/Taylor & Francis, pp. 154–1 to 154–48.Goff, H.D. (2002). Formation and stabilization of structure in ice cream and related products. Current Opinion
Colloid Interface Science 7, 432–437.Goff, H.D. (2003). Ice cream. In: P.F. Fox and P.L.H. McSweeney, eds. Advanced Dairy Chemistry – 1.
Proteins, 3rd edn. New York: Kluwer Academic, pp. 1063–1082.Goff, H.D., Verespej, E. and Smith, A.K. (1999). A study of fat and air structures in ice cream. International
Dairy Journal 9, 817–829.Grenier, A. (2003). Caracterisation par IRM et modelisation de transferts thermiques dans une matrice a
structure alveolee evolutive. Application a la congelation et decongelation-pousse d’un paton de pain, inSciences pour l’Ingenieur. Nantes: University of Nantes, p. 150.
BLUK139-Evans January 23, 2008 17:38
Freezing of Bakery and Dessert Products 203
Grenier, A., Lucas, T., Collewet, G. and Le Bail, A. (2003). Assessment by MRI of local porosity in dough dur-ing proving. theoretical considerations and experimental validation using a spin-echo sequence. MagneticResonance Imaging 21(9), 1071–1086.
Hamdami, N., Monteau, J.Y. and Le-Bail, A. (2004b). Heat and mass transfer in par-baked bread duringfreezing. Food Research International 37, 477–488.
Hamdami, N., Monteau, J.Y. and Le-Bail, A. (2004a). Thermophysical properties evolution of French partlybaked bread during freezing. Food Research International 37(7), 703–713.
Hamdami, N., Monteau, N. and Le-Bail, A. (2004c). Heat and moisture transfer simulation during freezingof bread. In: ICEF9 – 2004 International Conference Engineering and Food. Montpellier, France.
Hanneforth, U., Brack, G. and Valerius, U. (1994). Herstellung von Hefefeingebaeck aus vorgegaertenTiefkuehlteigen (in German).Title in English :Manufacture of fine yeasted products from prefermentedfrozen dough. Getreide, Mehl und Brot 48(4), 36–42.
Havet, M. and LeBail, A. (1999). Frozen bread dough: impact of the freezing rate and the storage durationon gassing power. In: Workshop ‘Process Engineering of Cereals’. Montpellier, France.
Havet, M., Mankai, M. and Le, B.A. (2000). Influence of the freezing condition on the baking performancesof French frozen dough. Journal of Food Engineering 45(3), 139–145.
Hsu, K.H., Hoseney, R.C. and Seib, P.A. (1979). Frozen Dough. III. Effects of Freezing and Storing Conditionson the Stability of Yeasted Doughs. Cereal Chemistry 56(5), 424–426.
Inoue, Y. and Bushuk, W. (1991). Studies on frozen bread doughs. I: Effects of frozen storage and freeze-thawcycles on baking and rheological properties. Cereal Chemistry 68, 627–631.
Inoue, Y. and Bushuk, W. (1991). Studies on frozen doughs. I. Effects of frozen storage and freeze-thawcycles on baking and rheological properties. Cereal Chemistry 68(6), 627–631.
Inoue, Y. and Bushuk, W. (1992). Studies on frozen doughs. II. Flour quality requirements for bread productionfrom frozen dough. Cereal Chemistry 69(4), 423–428.
Inoue, Y., Sapirstein, H.D. and Bushuk, W. (1995). Studies on frozen doughs. IV. Effect of shortening systemson baking and rheological properties. Cereal Chemistry 72(2), 221–225.
Kline, L. and Sugihara, T.F. (1968). Frozen bread doughs prepared by the straight dough method. The BakersDigest 42(5), 45–50.
LeBail, A. and Cornier, G. (1994). Control of the cooling rate during freezing : which cooling rate and whichcontrol parameters. Application to bread dough. In: ACOFOP III. Paris.
LeBail, A., Grinand, C., Le-Cleach, S., Martinez, S. and Quilin, E. (1999). Influence of storage conditionson frozen French bread dough. Journal of Food Engineering 39, 289–291.
LeBail, A., Monteau, J.Y., Margerie, F., Lucas, T., Chargelegue, A. and Reverdy, Y. (2005). Impact ofselected process parameters on crust flaking of frozen part baked bread. Journal of Food Engineering 69,503–509.
LeBail, A., Havet, M. and Hayert, M. (2001). Improvement of the baking performance of frozen dough by shortfreezing method. Application to French baguette. In: Rapid Cooling of Foods. Bristol, UK: InternationalInstitute of Refrigeration.
LeBail, A., Havet, M. and Pasco, M. (1998). Influence of the freezing rate and of storage duration on thegassing power of frozen bread dough. In: Symposium of the International Institute of Refrigeration. Nantes,France: International Institute of Refrigeration.
LeBail, A., Hamdami, N., Jury, V., Monteau, J.Y., Davenel, A., Lucas, T. and Ribotta, P. (2006). ExaminingCrust Problems Resulting from Processing Conditions with Respect to Freezing, Vol. 3. New FoodMagazine – Russell Publishing pp. 10–14.
LeDuff, L. (1985). Pain Francais precuit congele et son procede de fabrication.Leuschner, R.G.K., O’Callaghan, M.J.A. and Arendt, E.K. (1998). Bacili spoilage in part-baked and rebaked
brown soda bread. Journal of Food Science 63(5), 915–918.Leuschner, R.G.K., O’Callaghan, M.J.A. and Arendt, E.K. (1999). Moisture distribution and microbial qual-
ity of partbaked breads as related to storage and rebaking conditions. Journal of Food Science 64(3),543–546.
Leuschner, R.G.K., O’Callaghan, M.J.A. and Arendt, E.K. (1997). Optimization of baking parameters ofpart-baked and rebaked Irish brown soda bread by evaluation of some quality characteristics. InternationalJournal of Food Science and Technology 32, 487–493.
Livney, T., Verespej, E. and Goff, H.D. (2003). On the calculation of ice cream freezing curves. Milchwis-senschaft 58, 640–642.
Lu, W. and Grant, L.A. (1999). Effects of prolonged storage at freezing temperatures on starch and bakingquality of frozen doughs. Cereal Chemistry 76(5), 656–662.
BLUK139-Evans January 23, 2008 17:38
204 Frozen Food Science and Technology
Lucas, T., Quellec, S., Le-Bail, A. and Davenel, A. (2005). Chilling and freezing of part-baked breads. II.Experimental assessment of water phase changes and of structure collapse. Journal of Food Engineering70(2), 151–164.
Marshall, R.T., Goff, H.D. and Hartel, R.W. (2003). Ice Cream, 6th edn. New York: Kluwer Academic/PlenumPublishers.
Matuda, T.G., Parra, D.F., Lugao, A.B. and Tadini, C. (2005). Influence of vegetable shortening and emul-sifiers on the onfrozen water content and textural properties of frozen French bread dough. Lebensmittel-Wissenshaft und Technologie, 38, 275–280.
Meric, L., Lambert, G.S., Neyreneuf, O. and Richard, M.D. (1995). Cryoresistance of baker’s yeast Saccha-romyces cerevisiae in frozen dough: contribution of cellular trehalose. Cereal Chemistry 72(6), 609–615.
Monzie, S. (2003). Course a l’innovation. Filiere gourmande 95(Fevrier-Mars 2003), 32–33.Murakami, Y., Yokoigawa, K., Kawai, F. and Kawai, H. (1996). Lipid composition of commercial baker’s
yeasts having different freeze-tolerance in frozen dough. Bioscience, Biotechnology, and Biochemistry60(11), 1874–1876.
Muse, M.R. and Hartel, R.W. (2004). Ice cream structural elements that affect melting rate and hardness.Journal Dairy Science 87, 1–10.
Neyreneuf, O. and Delpuech, B. (1993). Freezing experiments on yeasted dough slabs. Effects of cryogenictemperatures on the baking performance. Cereal Chemistry 70(1), 109–111.
Oda, Y., Uno, K. and Otha, S. (1986). Selection of yeasts for breadmaking by the frozen-dough method.
Applied Environmental Microbiology Review 11, 339–356.Plank, R. (1941). Bietrage zur berechnung und bewertung der gefriergeschwindigkeit von lebensmittel.
Beihelft zur Zeitschrift fur die gesamte Kalte-industrie 3(10), 1–16.Rasanen, J., Harkonen, H. and Autio, K. (1995). Freeze-thaw stability of prefermented frozen lean wheat
doughs: effect of flour and fermentation time. Cereal Chemistry 72(6), 637–642.Rasanen, J. (1998). Prefermented Frozen Lean Wheat Doughs. VTT Publications p. 352.Rasanen, J., Laurikainen, T. and Autio, K. (1997). Fermentation stability and pore size distribution of fozen
prefermented lean wheat doughs. Cereal Chemistry 74(1), 56–62.Ribotta, P. and LeBail, A. (2007a). Effect of additives on the thermo-mechanical behaviour of dough systems
at sub-freezing temperatures. European Food Research and Technology 224, 519–524.Ribotta, P. and LeBail, A. (2007b). Thermo-physical assessment of bread during staling. Lebensmittel-
Wissenshaft und Technologie (in press).Ribotta, P. and Le-Bail, A. (2007c). Thermophysical and thermomechanical assessment of partially baked
bread during chilling and freezing process. Impact of selected enzymes on crumb contraction to preventcrust flaking. Journal of Food Engineering 78(3), 913–921.
Ribotta, P.D., Perez, G.T., Leon, A.E. and Anon, M.C. (2004). Effect of emulsifier and guar gum on microstructural, rheological and baking performance of frozen bread dough. Food Hydrocolloids 18(2), 305–313.
Rouille, J., Le-Bail, A. and Courcoux, P. (2000). Influence of formulation and mixing conditions on bread-making qualities of French frozen dough. Journal of Food Engineering 43(4), 197–203.
Stecchini, M.L., Maltini, E., Venir, E., Del-Torre, M. and Prospero, L. (2002). Properties of wheat dough atsub-zero temperatures and freeze tolerance of a baker’s yeast (Saccharomyces cerevisiae). Journal of FoodScience 67(6), 2196–2201.
Takasaki, S. and Karasawa, K. (1992). Effect of storage period on survival of freeze tolerant yeast and onthe rheological properties of frozen dough. Journal of Japanese Society of Food Science and Technology[Nippon Shokuhin Kogyo Gakkaishi] 39(9), 813–820.
Vulicevic, I.R., Abdel-Aal, E.-S.M., Mittal, G.S. and Lu, X. (2004). Quality and storage life of partbakedfrozen breads. Lebensmittel-Wissenshaft und Technologie, 37, 205–213.
Wang, Z.J. and Ponte, J.G. Jr. (1995). Storage stability of gluten-fortified frozen dough. Cereal Foods World40(11), 827–831.
Wang, Z.J. and Ponte, J.G.J. (1994). Improving frozen dough qualities with the addition of vital wheat gluten.
Cereal Foods World 39(7), 500–503.Wijnans, G.J.M. and Baal, H.C.I. (1997). Emulsifiers: sucrose esters of fatty acids. Food Technology Inter-
national Europe 35–37.Zounis, S., Quail, K.J., Wootton, M. and Dickson, M.R. (2002). Effect of final dough temperature on the
microstructure of frozen bread dough. Journal of Cereal Science 36(2), 135–146.

BLUK139-Evans January 23, 2008 17:38
10 Developing Frozen Products for theMarket and the Freezing ofReady-Prepared Meals
Ronan Gormley
SUMMARY
Frozen ready-meals are a major sector of the frozen foods market and a range of topicsregarding the market, preparation/assembly, health and safety, and the importance of product–process–package (PPP) and time–temperature–tolerance (TTT) elements is addressed. Thereis particular emphasis on freeze-chilling and sous vide-freezing of ready-meals, and ready-meal components, as the application of these processes to ready-meals is relatively new. Theconclusion is that freeze-chilling and sous-vide-freezing are suitable technologies for manyready-meals and ready-meal components, including sauces, and offer logistic and shelf-lifebenefits during distribution and retailing.
10.1 INTRODUCTION
The value of the ready-meal market in Europe is forecast to reach €13.4 billion by 2010 (Anon,2005a), which presents a major opportunity for processors and retailers. The diversity of theready-meals available continues to broaden with convenience products aimed at children,adolescents, working couples, families and the aged. This chapter addresses frozen ready-meals under the headings preparation and assembly, health and safety, product–process–package (PPP) and time–temperature–tolerance (TTT) considerations, freezing processes,freeze-chill and sous vide-freezing technologies. The application of freeze-chilling and sousvide-freezing to ready-meals is a relatively recent development and has been the subject ofconsiderable research activity at Ashtown Food Research Centre. For this reason, freeze-chilling and sous vide-freezing of ready-meal components and ready-meals are consideredin depth.
10.2 MARKET FOR READY-MEALS
The European (EU-15) ready-meal market is increasing steadily (Anon, 2005a) and frozenready-meal sales were valued in Europe at €600 million in 2005 (Anon, 2005b). The totalmarket (chilled and frozen) totalled nearly 2.3 million tonnes in 2005, with France accountingfor 592 and the UK 497 kilotonnes. Frozen ready-meals accounted for 857 kilotonnes in2005. In the UK, the demand is for high-quality authentic-tasting ready-meals (Birks, 1999)including ethnic dishes, fish dishes, vegetarian meals, pasta-based ready-meals, and largerfamily-sized portions. Investment in process technology to ensure maintenance of food quality
Frozen Food Science and Technology. Edited by Judith A. Evans
© 2008 Blackwell Publishing Ltd, ISBN: 978-1-4051-5478-9
BLUK139-Evans January 23, 2008 17:38
206 Frozen Food Science and Technology
during cooking, freezing and microwaving is a feature of these developments. Chilled ready-meals are often perceived by consumers as of higher quality than frozen (Vickers, 1999) andthis has acted against sales of the latter. In France, sales of complete frozen meals were worth€308 million in 2004 but were down 4.8% by value and up 1.2% by volume compared to2003. Lynn (2000) also showed a decline in frozen meal popularity in the UK in comparisonto the chilled. In contrast, the frozen dinners and entrees market rose 3.2% in the 12 weeks toSeptember 2005 in US with multi-serve meals (up 10.8%) and hand-held entrees (up 6.6%)being the key growth elements (Anon, 2005c).
10.3 PREPARATION AND ASSEMBLY
Ready-meals usually comprise protein (beef, pork, chicken, fish), carbohydrate (rice, pasta,potato), vegetable (carrots, peas, beans, sweet corn, onions, peppers) and sauce compo-nents. Cheese is often included, e.g. in lasagne, or as a topping. The sauces can be water(stocks, flavours) or oil (hollandaise, mayonnaise) based. The ratio of the components canvary considerably but a general figure is protein (15–20%), carbohydrate (40–50%), vegetable(15–20%) and sauce (20–30%). Some of these totals exceed 100% but the sauce often in-corporates the vegetable and spice components. Meals vary considerably around this basicformula as there is now a large range of ready-meals including ethnic and vegetarian items. Inpreparation, all the ingredients may be cooked on-site, or alternatively some may be cookedon-site and others bought-in as frozen product and then added to the meal during assembly.In on-site cooking, the protein components are cooked or par-cooked and are placed in thetray ‘as is’ or can be individually quick frozen (IQF) for inclusion in the trays at a laterstage during assembly. Carbohydrates are usually blast chilled after cooking/par-cookingwhile the vegetables are often delivered frozen to the trays. Trays may be compartmented forthe different components and in some cases all the ingredients may be in a vacuum bag asin sous vide cooking (see below). In the case of frozen assembly, the filled trays and productare given a final freeze before the product goes into frozen storage. In warm assembly, thesealed trays proceed to a freezer (blast or spiral freezer) for a full freezing process and arethen sent to frozen storage. Tasses (2001) described a new ready-meal tray that delivers ameal of similar quality to restaurant meals. The sterilised meal is placed in a plastic tray,which is then subjected to freezing and frozen storage. A serving dish is also provided whoseshape matches that of the carrier tray such that the frozen food can be transferred onto thedish prior to thawing. This can then be reheated and the ready-meal served.
10.4 HEALTH AND SAFETY
Ready-meals offer great potential for the inclusion of nutraceuticals and bioactive compoundsbut this has not been explored extensively to date. This has particular application in ready-meals for the elderly who may require supplements and are reluctant to consume them intablet form. Similarly, ready-meals for small children, pregnant women and others withparticular nutritional requirements represent a commercial opportunity that will be realisedin the relative short term. Khan (2000) has discussed ethnicity and health as related to healthand pleasure from foods and the growing consumer awareness of health issues. There isemphasis on ready-meals with lower fat and calorie contents and this trend will continue.Mitchell (personal communication, 2006) is working on reduced salt ethnic ready-meals

BLUK139-Evans January 23, 2008 17:38
Developing Frozen Products for the Market and the Freezing of Ready-Prepared Meals 207
with emphasis on sensory properties. Salt levels circa 33% of conventional levels are beingexplored and, on occasions, panellists are finding difficulty discriminating between spicinessand saltiness. Ethnic ready-meals have major potential in areas with high ethnic populations,e.g. the Indian population in regions of the UK (Darrington, 1999).
Safety is of paramount importance for all foods including frozen ready-meals. Safety isalso a relative concept and in this context frozen ready-meals are potentially safer than chilledbecause of the low storage temperature and ice content of the former. Fabrega Fernandez andForcadell Berenguer (1992) found that 69 of 353 ready-meals exceeded the legal maximumnumber of Lancefield group D Streptococcus, six exceeded the limit for Staphylococcusaureus, and nine contained Salmonella spp. An overview of the microbiological hazardsand controls relating to raw materials and processing of ready-meals has been preparedby Kyriakides and Batchford (2002) and they point to a number of potential black spots.Microbiological hazards relating to freeze-chilled (Redmond et al., 2004c) and sous vide-processed (Tansey et al., 2005) ready-meal components/meals have also been considered(see below). Process validation is a key component of ready-meal production as is the use ofequipment that is designed with efficient cleaning in mind (Holah, 2000).
10.5 PPP AND TTT CONSIDERATIONS
The successful marriage of the product–process–package (PPP) elements (Bøgh Sørensen,1990) is key in any food production process as are time–temperature–tolerance (TTT) con-siderations (van Arsdel et al., 1969). For ready-meals, most products are relatively robustfor cooking and freezing, with the exception of sauces, which need to be freeze–thaw stable.Some of the components of ready-meals are suited to IQF freezing such as peas or dicedcarrot. However, with most ready-meals the product in-tray needs to be frozen and this isa large unit size and so requires a system such as a spiral freezer to achieve a reasonablyfast freezing rate (i.e. core temperature of −20◦C in 0.5 h). Cryogenic freezing can also beused for delicate product but this process is usually too expensive for conventional ready-meals where cost margins are tight. Many frozen ready-meals are produced on a ‘just-in-timebasis’ and so deleterious changes during prolonged frozen storage are not a feature. However,temperatures fluctuating below the freezing point can cause icing and other changes in theproduct even over short (3 month) periods of frozen storage (Gormley et al., 2002).
Packaging trays for ready-meals must withstand the extremes of cold and hot as in freezingand frozen storage of the product at −30◦C followed by a heating step in a microwaveor convection oven. Crystalline polyethylene terephthalate (CPET) trays are best for thisapplication. The trays must also be consumer friendly in terms of attractiveness and easy-opening. Ready-meals are also being processed by sous vide and, in some cases, this isbeing followed by freezing rather than chilling (see below). The sous vide bags and sealsmust withstand vacuum conditions, pressure during the cooking phase, and low temperatureduring frozen storage.
Reheating is the final process before consumption and is normally conducted directly fromfrozen in a microwave, convection or household oven depending on where the ready-mealis going to be consumed. Swain et al. (1995) studied the effect of the initial temperatureof a food, and continuous use of a microwave oven, on the temperature of the food afterheating. As expected, low initial temperatures in the product (mashed potato) gave lowertemperatures after microwaving. Lower-powered microwave ovens were better in that theygave more uniform heating than higher powered versions when heating foods directly from

BLUK139-Evans January 23, 2008 17:38
208 Frozen Food Science and Technology
frozen. Two of five microwave ovens tested maintained a mean lowest temperature of >90◦Cin the mashed potato samples while in the other three the mean lowest temperature fell from81◦C to 71–76◦C after continuous use on a sequence of samples for 1.5 hours.
10.6 FREEZE-CHILL TECHNOLOGY
Chilled ready-meals are perceived to be of better quality than frozen. However, the formerhave a relatively short shelf-life while the latter offer better manufacturing and distributionflexibility, food safety and extended storage time (Kobs, 1997). Freeze-chilling is a dualprocess consisting of freezing and frozen storage followed by thawing and chilled retaildisplay (O’Leary et al., 2000). It has logistic advantages over chilling as it (i) allows bulkpreparation of frozen products followed by controlled batch release of thawed product intothe chill chain, (ii) enables ‘chilled’ products to reach distant markets more easily, and (iii)reduces the level of product recalls as it enables routine microbiological tests to be completedbefore the product is released from the factory. The reason for conducting the freeze-chillingtrials described below arose from the concern that freeze-chilling might predispose productsto more rapid quality deterioration in the chill phase of the process compared to chilled foodsthat had not been previously frozen. For example, the thawed food could be more susceptibleto microbial growth due to nutrients in the drip, and because freezing may open up thecell structure of vegetables and meats thereby adversely affecting colour, texture, vitaminretention and sensory acceptability. The research addressed the freeze-chilling of mashedpotatoes (three cultivars), carrots, green beans, lasagne, white sauces, and commercial ready-meals supplied by manufacturers. The elements of temperature abuse, tempering (thawing),re-freezing and modified atmosphere packaging were also investigated.
10.6.1 Procedures used
The process treatments, testing schedules and gas flushing details for the different productsare given in the text below. Texture measurement (probe penetration in mashed potato), colour(Hunter Lab), centrifugal drip, vitamin C content, taste panel acceptability, and total viablecounts (TVCs) were conducted, as appropriate to the product range, as described by Redmondet al. (2004c).
10.6.2 Freeze-chilling of mashed potato: different cultivars
The objective was to examine the effect of freeze-chilling on the quality of mash fromRooster, Golden Wonder and Maris Piper with a view to their use in ready-meals. The textureof mashed potato is critically important for acceptability and a soft mealy texture is preferredto one that is sticky, cohesive or gluey (Longree, 1950). The mashed potato (in plastic cups)was subjected to one of the following treatments: (i) Freeze-chill: blast freeze at −30◦C (airvelocity 3.75 m s–1) for 2.5 hours; store at −25◦C for 4 days; thaw overnight at 4◦C; storeat 4◦C for 4 days; test; (ii) Freeze: blast freeze at −30◦C for 2.5 hours; store at −25◦C for4 days; thaw overnight at 4◦C; test; (iii) Chill: store at 4◦C for 4 days; test; (iv) Fresh: cook,chill to 4◦C and then test.
Freeze-chilling and freezing led to less firm, less adhesive potato mash compared tochilling and preparing fresh (Fig. 10.1) (P < 0.001). This was most likely due to cell walldamage caused by ice crystal formation during the freezing process (Fennema, 1993). Of

BLUK139-Evans January 23, 2008 17:38
Developing Frozen Products for the Market and the Freezing of Ready-Prepared Meals 209
0
1
2
3
4
5
Fresh Chill Freeze-chill Freeze
Firm
ness
(N
)
Rooster
Golden Wonder
Maris Piper
Fig. 10.1 Firmness (penetration force) of fresh or processed mashed potato. Reprinted from Redmond,G.A., Gormley T.R. and Butler, F. (2003a), The effect of short- and long-term freeze-chilling on the qualityof mashed potato, Innovative Food Science and Emerging Technologies 4(1), 85–97, with permission fromElsevier.
the cultivars, Rooster produced a firmer, more adhesive mash than Golden Wonder or MarisPiper (P < 0.001). Chilling generally led to a brighter coloured mash (higher L/b value)than any of the other treatments. This finding was similar to that of O’Leary et al. (2000)for reconstituted potato flakes. Rooster mash had a lower L/b (P < 0.001) value than mashfrom Golden Wonder or Maris Piper. Freezing and freeze-chilling led to a higher centrifugaldrip than chilling or preparing fresh (Fig. 10.2). This may be due to the breakdown in cellstructure as a result of freezing with a consequent loss of fluids (IIR, 1986) on thawing. Mashfrom Rooster had a higher vitamin C content than that from Golden Wonder or Maris Piper
0
5
10
15
20
25
30
Fresh Chill Freeze-chill Freeze
Cen
trifu
gal d
rip (
%)
Rooster
Golden Wonder
Maris Piper
Fig. 10.2 Centrifugal drip (%) from fresh or processed mashed potato of cultivars. Reprinted from Red-mond, G.A., Gormley T.R. and Butler, F. (2003a), The effect of short- and long-term freeze-chilling on thequality of mashed potato, Innovative Food Science and Emerging Technologies 4(1), 85–97, with permissionfrom Elsevier.
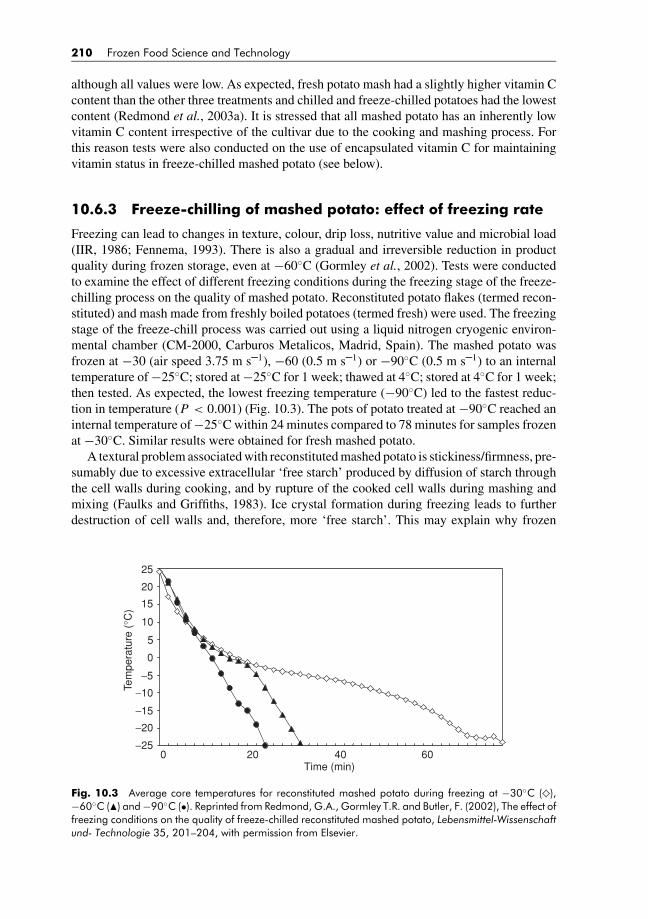
BLUK139-Evans January 23, 2008 17:38
210 Frozen Food Science and Technology
although all values were low. As expected, fresh potato mash had a slightly higher vitamin Ccontent than the other three treatments and chilled and freeze-chilled potatoes had the lowestcontent (Redmond et al., 2003a). It is stressed that all mashed potato has an inherently lowvitamin C content irrespective of the cultivar due to the cooking and mashing process. Forthis reason tests were also conducted on the use of encapsulated vitamin C for maintainingvitamin status in freeze-chilled mashed potato (see below).
10.6.3 Freeze-chilling of mashed potato: effect of freezing rate
Freezing can lead to changes in texture, colour, drip loss, nutritive value and microbial load(IIR, 1986; Fennema, 1993). There is also a gradual and irreversible reduction in productquality during frozen storage, even at −60◦C (Gormley et al., 2002). Tests were conductedto examine the effect of different freezing conditions during the freezing stage of the freeze-chilling process on the quality of mashed potato. Reconstituted potato flakes (termed recon-stituted) and mash made from freshly boiled potatoes (termed fresh) were used. The freezingstage of the freeze-chill process was carried out using a liquid nitrogen cryogenic environ-mental chamber (CM-2000, Carburos Metalicos, Madrid, Spain). The mashed potato wasfrozen at −30 (air speed 3.75 m s–1), −60 (0.5 m s–1) or −90◦C (0.5 m s–1) to an internaltemperature of −25◦C; stored at −25◦C for 1 week; thawed at 4◦C; stored at 4◦C for 1 week;then tested. As expected, the lowest freezing temperature (−90◦C) led to the fastest reduc-tion in temperature (P < 0.001) (Fig. 10.3). The pots of potato treated at −90◦C reached aninternal temperature of −25◦C within 24 minutes compared to 78 minutes for samples frozenat −30◦C. Similar results were obtained for fresh mashed potato.
A textural problem associated with reconstituted mashed potato is stickiness/firmness, pre-sumably due to excessive extracellular ‘free starch’ produced by diffusion of starch throughthe cell walls during cooking, and by rupture of the cooked cell walls during mashing andmixing (Faulks and Griffiths, 1983). Ice crystal formation during freezing leads to furtherdestruction of cell walls and, therefore, more ‘free starch’. This may explain why frozen
−10
−15
−20
−25
−5
0
5
20
25
15
10
200 40 60Time (min)
Tem
pera
ture
(°C
)
Fig. 10.3 Average core temperatures for reconstituted mashed potato during freezing at −30◦C (♦),−60◦C (�) and −90◦C (•). Reprinted from Redmond, G.A., Gormley T.R. and Butler, F. (2002), The effect offreezing conditions on the quality of freeze-chilled reconstituted mashed potato, Lebensmittel-Wissenschaftund- Technologie 35, 201–204, with permission from Elsevier.

BLUK139-Evans January 23, 2008 17:38
Developing Frozen Products for the Market and the Freezing of Ready-Prepared Meals 211
reconstituted mashed potato was firmer in the current study than chilled. Lowering the tem-perature of freezing resulted in a softer mash for rehydrated potato but not for fresh mashedpotato. Lowering the freezing temperature had no effect on vitamin C content, colour or sen-sory acceptability of mashed potato (fresh and reconstituted), but drip loss decreased linearly(P < 0.001) with temperature of freezing.
10.6.4 Vitamin C retention in freeze-chilled mashed potato
Vitamin C is a labile nutrient and losses occur in cooked, and then chilled vegetables (Williamset al., 1995), and also in freeze-chilled mashed potato (Decazes et al., 2001; O’Leary et al.,2000). To overcome this, the addition of encapsulated vitamin C to freeze-chilled mashedpotato was investigated. Cooled mashed potato sample sets (20 g per pot; cultivar Rooster)were prepared containing (a) ordinary vitamin C (OVC) (33 mg per 100 g), (b) encapsulatedvitamin C (EVC) (50 mg per 100 g), and (c) no vitamin C. All samples underwent one of thefollowing process treatments: (i) Fresh: cook and test, (ii) Chill: store at 4◦C for 8 days, (iii)Freeze-chill: blast freeze at −30◦C for 2.5 hours; store at −25◦C for 7 days; thaw overnightat 4◦C; store at 4◦C for 8 days; (iv) Freeze: blast freeze at −30◦C for 2.5 hours; store at−25◦C for 1.5 days; thaw overnight at 4◦C. The vitamin C content of the not-supplementedmashed potato (NVC) was low (circa 2 mg per 100 g) in the fresh and in the processedproducts (Fig. 10.4). This may have been due to the cooking and mashing of the potato. Thechill and freeze-chill treatments caused a dramatic reduction (P < 0.001) in the vitamin Ccontent of the samples with added OVC. In contrast, the chilled and freeze-chilled sampleswith added EVC had circa 15 mg per 100 g (Fig. 10.4) indicating that encapsulation wasexerting a protective effect during chilled storage. The freeze-only treatment resulted in agood retention of both the OVC and EVC (Fig. 10.4) (Redmond et al., 2003b). This resultwas expected as vitamin C is normally well retained in frozen foods (Favell, 1998).
5
0
30
25
20
15
10
Fresh
Vita
min
C (
mg
per
100
g)
Chill Freeze-chill Freeze
NVC
OVC
EVC
Fig. 10.4 Effect of process treatments (and fresh) on the vitamin C content of fresh and processed mashedpotato without added vitamin C (NVC), with added vitamin C (OVC) and with added encapsulated vitaminC (EVC). Reprinted from Redmond, G.A., Decazes, A.M., Gormley T.R. and Butler, F. (2003b), The vitaminC status of freeze-chilled mashed potato, Journal of Food Engineering, 56(2–3), 219–221, with permissionfrom Elsevier.
BLUK139-Evans January 23, 2008 17:38
212 Frozen Food Science and Technology
10.6.5 Freeze-chilling of steamed carrots and green beans
Steamed carrots and green beans are often used as components in ready-meals and the effectof short- and long-term freeze-chilling on their quality was investigated in a recent study(Redmond et al., 2004a). Freeze-chilling and freezing led to less firm (lower shear values)carrots than chilling or preparing fresh but this was not the case for green beans. Freeze-chilling and freezing led to a higher drip loss than the fresh or chill treatments for both carrotsand green beans. For carrots, drip loss from the fresh and chill treatments was low (average= 2.1%) compared to the freeze-chill and freeze treatments (average = 19.2%), whereas driploss from the fresh and chilled green beans was much higher (average = 22.1%), althoughsignificantly lower than the freeze-chilled or frozen green beans (average = 31.4%).
No difference was found in cooked carrot colour between the four treatments but differ-ences were found in cooked green bean colour, in that freeze-chilling and chilling led tolower hue angles (less green) than freezing or preparing fresh. No difference was found intotal viable count (TVC) values between the treatments for either carrots (average = 2.2log10 cfu g−1) or green beans (average = 3.2 log10 cfu g−1), and there was no difference insensory acceptability between the process treatments for steamed carrots. However, sensoryacceptability was lower for the fresh green beans than for processed beans. These data suggestthat freeze-chilling is a technology suitable for steamed carrots and green beans. (Redmondet al., 2004a).
10.6.6 Freeze-chilling of white sauces
Starch-based white sauces are frequent constituents of ready-meals. The sauce enhancesappearance and imparts a flavour sensation to the protein food which complements the eatingexperience. It also prevents dehydration and freezer-burn during storage. However, freezingtraditional white sauce releases water (syneresis) after thawing, which decreases productacceptability. It is important, therefore, that sauces for frozen ready-meals are freeze–thawstable and trials were conducted on white sauces made with two modified starches, i.e.Purity W, Thermflo (modified waxy maize starches), and National Frigex CL (modifiedtapioca starch). Each sauce was subjected to both freeze-chilling and chilling. The amount ofliquid separation (syneresis) in the freeze-chilled and chilled sauces was low (less than 4%)throughout the 8-day chilled display period. There was no difference in colour or viscosityof the chilled and freeze-chilled sauces during the period of chill storage (Dempsey, 2003).
Thermoflo and National Frigex CL modified starches were also used to investigate theeffect of freezing rates on syneresis, colour and rheology of freeze-chilled white sauces. Thewhite sauces were frozen at −30 (air speed 3.75 m s–1), −60 (0.5 m s–1) or −90◦C (0.5m s–1) to an internal temperature of −25◦C, and stored at −25◦C for 2 days followed byholding at 4◦C for 8 days. The level of syneresis in freeze-chilled sauces frozen at differentrates was less than 2%, regardless of freezing rate and there was no effect on viscosity orcolour of the samples. It was concluded, therefore, that the starches were freeze–thaw stableand were suitable for use in sauces in freeze-chill applications in ready-meals. (Dempsey,2003).
10.6.7 Freeze-chilling of lasagne
Lasagne is an increasingly popular ready-meal with average consumption per capita in Irelandof 0.32 kg annually, compared to 0.2 kg in the UK and 1.0 kg in Belgium (Anon, 2001a).

BLUK139-Evans January 23, 2008 17:38
Developing Frozen Products for the Market and the Freezing of Ready-Prepared Meals 213
Table 10.1 Effect of short-term frozen storage on the quality of freeze-chilled lasagne.
Fresh Chill Freeze Freeze-chill F test LSDa
Unheated lasagneCentrifugal drip (%) 0.84 1.56 10.07 3.41 P < 0.001 1.99Colour (L/b) 5.59 5.17 5.37 5.55 P < 0.05 0.29Shear value (N) 274 258 289 256 NS 48TVC (log10 cfu g−1) 1.76 1.95 3.62 4.03 P < 0.001 0.64
Heated lasagneCentrifugal drip (%) — 2.15 2.77 2.29 NS 1.57Colour (L/b) — 2.49 4.01 3.17 P < 0.01 0.7Shear value (N) — 216 229 232 NS 30Sensory acceptability 3.75 3.64 3.38 3.60 NS 0.54
Note: aLSD, Least significant difference.Reprinted from Redmond, G.A., Gormley, T.R. and Butler, F. (2004b), The effect of short- and long-term frozen storage withMAP on the quality of freeze-chilled lasagne, Lebensmittel-Wissenschaft und- Technologie 38(1), 81–87, with permissionfrom Elsevier.
Trials were conducted to examine the effect of freeze-chilling on the quality of beef lasagnes(unit size 300 g) (Redmond et al., 2004b). A fresh sample was used as control.
Freeze-chilled lasagnes had a brighter colour (L/b) than chilled lasagnes before heating, butthis was not evident after heating (Table 10.1). Frozen and freeze-chilled lasagne had higherdrip loss than fresh or chilled before heating but again this was not evident after heating.No difference was found in shear values or sensory acceptability between the treatments butfreeze-chilled and frozen lasagne had higher TVCs than chilled or fresh. This result wasunexpected as freezing usually gives a reduction in TVC values (Redmond et al., 2004b).All microbial counts were below the upper limit of log 5 cfu g−1 set out by the Food SafetyAuthority of Ireland for ready-to-eat meals at point of sale (Anon, 2001b).
Frozen and freeze-chilled lasagne had significantly higher drip loss values than freshor chilled before heating but not after heating. This could be due to structural damage tocomponents as a result of freezing (Khan and Vincent, 1996). However, it is likely thatmoisture redistribution took place during reheating thereby offsetting the adverse effects offreezing. This increase in drip loss for the unheated lasagne is not of major concern formanufacturers as the lasagnes are reheated before consumption. No difference was found intexture between freeze-chilled, frozen, chilled or fresh lasagne, either before or after reheatingsuggesting that storage conditions had little effect on the texture of the final heated product(Redmond et al., 2004b).
10.6.8 Long-term freezing of products
One of the advantages of freeze-chilling is that products can be stored frozen prior to chilledretail. Tests were conducted, therefore, to examine the effects of long-term frozen storage(up to 12 mo) prior to thawing and chilling, on the quality of mashed potato, steamed carrots,steamed green beans and lasagne. The products were subjected to one of the followingtreatments: (i) Freeze – chill: blast freeze at −30◦C for 2.5 hours; store at −25◦C for 0, 3, 6,9 or 12 months; thaw overnight at 4◦C; store at 4◦C for 6 or 7 days; (ii) Freeze: blast freeze at−30◦C for 2.5 hours; store at −25◦C for 0, 3, 6, 9 or 12 months; thaw overnight at 4◦C; test.
Frozen storage for up to 12 months followed by chilling led to a firmer product thanfreezing alone for mashed potato and green beans. Length of time in frozen storage had

BLUK139-Evans January 23, 2008 17:38
214 Frozen Food Science and Technology
0
1
2
3
4
5
6
FC carrot FZ carrot FC green bean FZ green bean
Tota
l via
ble
coun
t (cf
u g−
1 )
0 Month
3 Month
6 Month
9 Month
12 Month
Fig. 10.5 Effect of long-term frozen storage on the total viable count (TVC) values of frozen and freeze-chilled cooked carrots and green beans: frozen carrots (FZ carrot); frozen green beans (FZ green bean);freeze-chilled carrots (FC carrot); freeze-chilled green beans (FC green bean).
no effect on drip loss values of freeze-chilled or frozen mashed potato (average = 21%),cooked carrots (average = 26%) or green beans (average = 31%). Time in frozen storagereduced (P < 0.001) the brightness (i.e. lower Hunter L/b values) of freeze-chilled and frozenmashed potato. Process treatments were also different (P < 0.001) with freeze-chilled mashhaving a brighter colour (L/b value of 3.20) than frozen mash (2.98). Frozen storage timehad no effect on the colour (hue angle) of carrots (average = 45◦) or green beans (average= 118◦), and no difference was found between freeze-chilling and freezing. Length of timein frozen storage had no effect on the vitamin C content of mashed potato but freeze-chillingled to a reduction in vitamin C content compared to freezing (0.64 versus 1.68 mg per100 g, respectively) (Redmond et al., 2003a, 2003b). The length of time in frozen storagehad no effect on the sensory acceptability of the three products and no differences were foundin sensory acceptability between freeze-chilled and frozen carrots or green beans. However,freeze-chilling led to a lower (P < 0.01) sensory score (2.52) than freezing (2.75) for mashedpotato on a 5-point hedonic scale.
Length of time in frozen storage had no effect on the TVC values of freeze-chilled andfrozen mashed potato but did have an effect on values for both green beans and carrots(Fig. 10.5). For green beans, TVC values before frozen storage were higher than at any otherstorage time, while carrots stored for 9 months had the lowest TVC values. Freeze-chillingalso led to significantly higher TVC values than freezing for the products, which agrees withthe findings of O’Leary et al. (2000) for a range of products. However, all values for theprocessed samples were below the limit (log 5 cfu g−1) set by the Food Safety Authority ofIreland for cooked vegetable products at point of sale (Anon, 2001b). The overall findingssuggest that long-term frozen storage does not result in an increased microbial load in thefollow-on chill phase of the freeze-chill process for mashed potato, steamed carrots or greenbeans.
BLUK139-Evans January 23, 2008 17:38
Developing Frozen Products for the Market and the Freezing of Ready-Prepared Meals 215
In tests with freeze-chilled lasagne (commercially produced) the samples were stored at−30◦C for up to 12 months followed by thawing and chilling at 4◦C for 6 days. Frozenlasagne was used for comparison. The term ‘heated’ refers to samples microwaved at700 W as per the manufacturer’s instructions followed by cooling to 4◦C before testing.Drip losses tended to decrease with length of frozen storage time especially for the freeze-chilled samples. This may reflect increased water binding by the meat or pasta components ofthe lasagne. However, this was not reflected in product softness as lasagne stored frozen for12 months had the highest shear values. Sensory tests indicated a non-significant deteriorativetrend in sensory acceptability with increasing length of time in frozen storage as indicatedby sensory scores of 3.9 (6 mo), 3.6 (9 mo) and 3.4 (12 mo). Several panellists commentedon the pasta component of the meal being tough or leathery. However, even after 12 monthsof frozen storage, lasagnes were still acceptable (3.4 on a scale of 0 (unacceptable) to 5 (veryacceptable)) (Redmond et al., 2004b).
10.6.9 Modified atmosphere packaging (MAP) withfreeze-chilling
Trials were conducted to assess the synergistic effect, if any, of combining MAP with freeze-chilling on the quality and shelf-life of mashed potato, steamed carrots, steamed green beansand lasagne. The products were packed in: (i) air; (ii) CO2/N2 (40:60%); (iii) CO2/O2/N2
(40:30:30%); (iv) CO2 (100%); (v) N2 (100%); then blast frozen at −30◦C for 2.5 hours;stored at −25◦C for 3 weeks; chilled at 4◦C for 9 days; tested. The treatments had minimaleffects on colour, texture and centrifugal drip of the product range (Redmond et al., 2004c).TVCs were not influenced by the treatments with the exception of lasagne where an interaction(P < 0.05) was found between process treatment and atmosphere, i.e. TVCs increased inthe order air, CO2/N2 (40:60%), CO2/O2/N2 (40:30:30%) for the frozen lasagnes while theorder was the opposite for the freeze-chilled samples (Redmond et al., 2004b).
10.6.10 Temperature abuse of freeze-chilled products
Chilled and freeze-chilled foods may be more at risk of temperature abuse than frozen products(O’Leary et al., 2000) and a model study was conducted by Oxley (2003) to assess the effectsof different temperatures (4◦C, 7◦C, 10◦C) in the final chill phase of the freeze-chill process onTVCs (mashed potato) and psychrotrophic counts (mashed potato and steamed carrots) overan 8-day period. No significant difference was found for TVCs (potato) or for psychrotrophiccounts (potato or cooked carrot) between freeze-chilling and chilling on any of the test daysindicating that the freezing and thawing of the mashed potato and cooked carrot did not makethe products more susceptible to microbial growth over the chill storage period. However,increasing chilled storage temperatures in the chill phase of the freeze-chill process gave anincreased microbial growth for both carrots and potatoes. For example, mashed potato storedat 10◦C had a TVC of 6.5 compared to 3.1 and 1.3 log10 cfu g−1 for potato at 7◦C and 4◦C,respectively, on day 8. Similarly, psychrotrophic counts for cooked carrots after 8 days were8.6 (10◦C), 5.7 (7◦C) and 3.4 log10 cfu g−1 (4◦C). These data show that the products storedat 10◦C for 8-day post-thawing had unacceptable microbial counts and indicate the need forcareful temperature control in the final chill phase of the freeze-chill process (Oxley, 2003).While TVCs and psychrotrophic counts do not necessarily signify a safe or unsafe product,they are an index of the potential for growth of pathogens if such contamination was to occur.
BLUK139-Evans January 23, 2008 17:38
216 Frozen Food Science and Technology
10.6.11 Tempering of freeze-chilled products
Tempering (thawing) of freeze-chilled foods is of paramount importance to food companiesand a series of trials was conducted by Gerety (2004). The main trial involved tempering in acommercial unit (SB10, six-pallet unit; cubic capacity 20 m3) supplied by Dawson Rentals,which blows cycles of warm and cold air over the product being thawed. In the tests, 216commercially produced lasagne ready-meals were placed in 27 boxes (outers) (2 rows of 4in each box). T-type wire thermocouples were inserted in the geometric centre (core) andbetween the meal and plastic seal (surface) of 12 meals at random before freezing. The frozenmeals in the boxes were placed in the tempering unit in one of three box configurations: (a)separated, (air space between every box), (b) three together, (air space between groups ofthree boxes), and (c) stacked (no air spaces).
When the boxes were stacked in threes, the temperatures in the centremost boxes werecirca 10◦C lower at each testing time than the temperature in the more exposed boxes, andthe product surface and core temperatures were still circa −4◦C after 24 hours. This showsthat tight stacking is not an option and the best practice for efficient tempering is a separatedbox configuration.
10.6.12 Re-freezing of freeze-chilled products
Many prepared food products have ‘suitable for freezing’ stamped on the pack and consumersfreeze them for convenience and to extend shelf-life. However, with freeze-chilled foods homefreezing or refreezing means a second freezing, which may raise issues of product quality andsafety. A trial to address this involved freeze-chilled mashed potato, sliced steamed carrotsand commercially produced lasagne ready-meals. Frozen samples of the three products wereprepared (Redmond et al., 2004a, 2004b), held at −25◦C for 7 days, thawed overnight at 4◦C,stored at 4◦C for 7 days followed by testing (to determine baseline values, i.e. thaw 1 tests).The freeze-chilled samples were then refrozen by fast (blast freezing at −30◦C for 2.5 hours(air speed 3.75 m s–1) or slow (cabinet; still air at −25◦C) procedures and held at −25◦C for7 days. They were thawed at 4◦C overnight and tested again (i.e. thaw 2 tests). The colour,shear values, centrifugal drip loss and vitamin C (potatoes only) content of the freeze-chilledmashed potato, steamed sliced carrot and heated lasagne were not affected by refreezing (bothmethods) or thawing. However, refreezing/thawing did reduce the adhesiveness of the freeze-chilled mashed potato but the effect was small in practical terms. The microbial status of thefreeze-chilled (unheated) lasagne was not affected by refreezing/thawing and TVC valueswere below the upper limit of log10 5 cfu g−1 specified by the Food Safety Authority of Irelandfor ready-to-eat meals at point of sale (Anon, 2001b). These data suggest that freeze-chilledmashed potato, steamed sliced carrots, or lasagne can be refrozen/thawed without impairingquality or safety. However, it is imperative that no temperature abuse occurs during the chillphase of the freeze-chill process.
10.6.13 Overall outcomes on freeze-chilling
Freeze-chilling is a technology suitable for many ready-meals and ready-meal components,including sauces, and offers logistic and shelf-life benefits during distribution and retailing.Extended frozen storage (up to 1 yr) prior to chilling had little adverse effect on the qual-ity of a range of freeze-chilled products. Modified atmosphere packaging (MAP) did notbenefit the quality and shelf-life of freeze-chilled mashed potato, steamed carrots or lasagne.

BLUK139-Evans January 23, 2008 17:38
Developing Frozen Products for the Market and the Freezing of Ready-Prepared Meals 217
Freeze-chilled mashed potato, steamed sliced carrots and lasagne can be successfully refrozenprovided temperature abuse does not occur during the final chilled phase of the freeze-chilledprocess. Results from a commercial tempering unit showed that boxed ready-meals shouldbe stacked with air spaces between them to ensure adequate air thawing. Good manufac-turing practice (GMP) and HACCP are imperative throughout the freeze-chilling process.Freeze-chilled products should be labelled as ‘previously frozen’ for reasons of consumerinformation. A use-by date should also be employed and this label should be attached at thestart of the thawing process.
10.7 SOUS VIDE-FREEZING TECHNOLOGY
Sous vide processing is an interrupted catering system in which raw or par-cooked food issealed under vacuum in a laminated plastic pouch or container, heat-treated by controlledcooking, rapidly chilled and then reheated for service after a period of chilled storage (SVAC,1991). The chilled storage period is up to 21 days at 0–3◦C. The minimum recommendedthermal process for sous vide products is 90◦C for 10 minutes, or its time–temperatureequivalent (SVAC, 1991). This process ensures a minimum 6-log reduction in psychrotrophicClostridium botulinum spores and in vegetative pathogens such as Listeria, Salmonella andEscherichia coli.
Sous vide has been used mostly in the catering and food service sectors (Creed andReeve, 1998), but more recently it is being adopted by the ready-meals sector. Concernsabout the safety of sous vide products, mainly due to the potential for temperature abusein the chill chain, has prevented its widespread use (Betts, 1992). For this reason, the useof sous vide-freezing as an alternative to sous vide-chilling for ready-meal components hasbeen investigated in a major study (Tansey and Gormley, 2005; Tansey et al., 2003a, 2005)and selected findings are reported here. Sous vide-freezing has at least two advantages: (i) itminimizes the risk of growth of Clostridium botulinum spores, and (ii) it extends product shelf-life. A potential disadvantage is that it could offset some of the quality advantages of the sousvide process, especially product texture, due to structural damage by ice crystals. Ten differentfoods were studied in three groups: carbohydrates (potatoes, pasta and rice); vegetables(carrots and broccoli); and muscle foods (salmon, cod, chicken, beef and lamb). A P-SV-Fsystem for sous vide processing the 10 ready-meal components embracing pretreatments (P),sous vide cook time/temperature (SV), and freezing (F) post-sous vide cooking was developedand validated, and there was particular focus on the effects of the P-SV-F system on producttexture and overall quality.
10.7.1 Procedures used
Sous vide/freezing tests were conducted on carbohydrates (sliced potatoes, pasta, rice), veg-etables (sliced carrots, broccoli florets) and muscle foods (salmon portions, cod portions,chicken, beef and lamb pieces/cubes) as described by Tansey et al. (2005). All samplesreceived pretreatments (Table 10.3) prior to sous vide cooking. Cooking time (BarriquandSteriflow cooker) varied from food to food due to variation in heat transfer rates and thesize of the food pieces (Table 10.3). Pasteurisation values (P values) were recorded using anEllab time–temperature recorder. The sous vide products were blast frozen (2 h at −30◦C)or chilled (+4◦C) and tests conducted for sensory acceptability/comparison, shear, colour,gravity drip, centrifugal drip and moisture as well as specific tests such as β-carotene levels
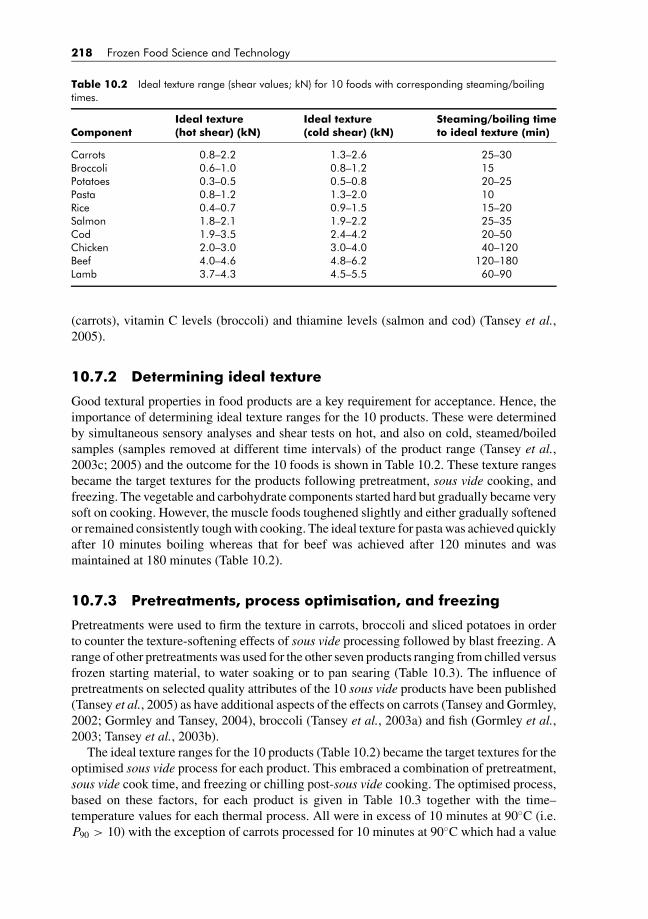
BLUK139-Evans January 23, 2008 17:38
218 Frozen Food Science and Technology
Table 10.2 Ideal texture range (shear values; kN) for 10 foods with corresponding steaming/boilingtimes.
Ideal texture Ideal texture Steaming/boiling timeComponent (hot shear) (kN) (cold shear) (kN) to ideal texture (min)
Carrots 0.8–2.2 1.3–2.6 25–30Broccoli 0.6–1.0 0.8–1.2 15Potatoes 0.3–0.5 0.5–0.8 20–25Pasta 0.8–1.2 1.3–2.0 10Rice 0.4–0.7 0.9–1.5 15–20Salmon 1.8–2.1 1.9–2.2 25–35Cod 1.9–3.5 2.4–4.2 20–50Chicken 2.0–3.0 3.0–4.0 40–120Beef 4.0–4.6 4.8–6.2 120–180Lamb 3.7–4.3 4.5–5.5 60–90
(carrots), vitamin C levels (broccoli) and thiamine levels (salmon and cod) (Tansey et al.,2005).
10.7.2 Determining ideal texture
Good textural properties in food products are a key requirement for acceptance. Hence, theimportance of determining ideal texture ranges for the 10 products. These were determinedby simultaneous sensory analyses and shear tests on hot, and also on cold, steamed/boiledsamples (samples removed at different time intervals) of the product range (Tansey et al.,2003c; 2005) and the outcome for the 10 foods is shown in Table 10.2. These texture rangesbecame the target textures for the products following pretreatment, sous vide cooking, andfreezing. The vegetable and carbohydrate components started hard but gradually became verysoft on cooking. However, the muscle foods toughened slightly and either gradually softenedor remained consistently tough with cooking. The ideal texture for pasta was achieved quicklyafter 10 minutes boiling whereas that for beef was achieved after 120 minutes and wasmaintained at 180 minutes (Table 10.2).
10.7.3 Pretreatments, process optimisation, and freezing
Pretreatments were used to firm the texture in carrots, broccoli and sliced potatoes in orderto counter the texture-softening effects of sous vide processing followed by blast freezing. Arange of other pretreatments was used for the other seven products ranging from chilled versusfrozen starting material, to water soaking or to pan searing (Table 10.3). The influence ofpretreatments on selected quality attributes of the 10 sous vide products have been published(Tansey et al., 2005) as have additional aspects of the effects on carrots (Tansey and Gormley,2002; Gormley and Tansey, 2004), broccoli (Tansey et al., 2003a) and fish (Gormley et al.,2003; Tansey et al., 2003b).
The ideal texture ranges for the 10 products (Table 10.2) became the target textures for theoptimised sous vide process for each product. This embraced a combination of pretreatment,sous vide cook time, and freezing or chilling post-sous vide cooking. The optimised process,based on these factors, for each product is given in Table 10.3 together with the time–temperature values for each thermal process. All were in excess of 10 minutes at 90◦C (i.e.P90 > 10) with the exception of carrots processed for 10 minutes at 90◦C which had a value

BLUK139-Evans January 23, 2008 17:38
Tab
le10.3
Opt
imis
edpr
etre
atm
ents
and
sous
vide
cook
ing
proc
ess
for
read
y-m
ealc
ompo
nent
s,w
hich
wer
ebl
astf
roze
nor
chill
ed(4
◦ C)a
ndw
ere
with
inth
eid
ealt
extu
rera
nge.
a
Com
pon
en
t(1
50
gin
sous
vid
eb
ag
s)P
re-t
rea
tmen
tC
ook
ing
tim
ea
nd
tem
pera
ture
bP
ast
eu
risa
tion
valu
es
(Pva
lues,
min
)St
ora
ge
Sen
sory
test
sc
(fro
zen
vs.ch
ill)
Car
rots
lices
(5m
m)
Blan
chat
50◦ C
for
15m
in,t
hen
blan
chat
90◦ C
for
2m
inw
ith0.
1%sa
ltan
dco
ol
10m
in,9
0◦C
30m
in,9
0◦C
P 70
>2
P 90
>10
Froz
enC
hille
d10
/10
Not
sign
ifica
nt
Broc
coli
flore
ts(1
0–50
ghe
ads)
Blan
chat
50◦ C
for
15m
in,t
hen
blan
chat
90◦ C
for
2m
inw
ith0.
1%sa
ltan
dco
ol
30m
in,9
0◦C
40m
in,9
0◦C
P 90
>10
P 90
>10
Froz
enC
hille
d6/
14N
otsi
gnifi
cant
Pota
tosl
ices
(5m
m)
Blan
chat
50◦ C
for
15m
in,t
hen
blan
chat
90◦ C
for
2m
inw
ith0.
1%sa
ltan
dco
ol
20m
in,9
0◦C
20m
in,9
0◦C
P 90
>10
P 90
>10
Froz
enC
hille
d10
/10
Not
sign
ifica
nt
Salm
onfil
let(
150
gpo
rtio
ns)
Non
e20
min
,90◦
C40
min
,90◦
CP 9
0>
10P 9
0>
10Fr
ozen
Chi
lled
8/12
Not
sign
ifica
ntC
odfil
let(
150
gpo
rtio
ns)
Non
e20
min
,90◦
C30
min
,90◦
CP 9
0>
10P 9
0>
10Fr
ozen
Chi
lled
8/12
Not
sign
ifica
ntPa
sta
shel
ls(R
oma)
Sim
mer
for
4m
inin
wat
erw
ith2%
vege
tabl
eoi
l,dr
ain
and
was
h.So
akin
wat
erw
ith2%
vege
tabl
eoi
land
drai
n
15m
in,9
0◦C
20m
in,9
0◦C
P 90
>10
P 90
>10
Froz
enC
hille
d11
/9N
otsi
gnifi
cant
Long
grai
nric
e(U
ncle
Ben’
slon
ggr
ain)
Soak
3pa
rts
wat
er:
1pa
rtric
efo
r3
h,ad
d2%
vege
tabl
eoi
land
drai
n40
min
,90◦
CP 9
0>
10Fr
ozen
11/9
Soak
2pa
rts
wat
er:
1pa
rtric
efo
r3
h,ad
d2%
vege
tabl
eoi
land
drai
n30
min
,90◦
CP 9
0>
10C
hille
dN
otsi
gnifi
cant
Beef
(dic
edsh
ould
er)
Sear
for
5m
inin
fryi
ngpa
nw
ithve
geta
ble
oil
200
min
,90◦
C20
0m
in,9
0◦C
P 90
>10
P 90
>10
Froz
enC
hille
d13
/7N
otsi
gnifi
cant
Lam
b(d
iced
shou
lder
)Se
arfo
r5
min
infr
ying
pan
with
vege
tabl
eoi
l20
0m
in,9
0◦C
200
min
,90◦
CP 9
0>
10P 9
0>
10Fr
ozen
Chi
lled
8/12
Not
sign
ifica
ntC
hick
en(d
iced
brea
st)
Sear
for
5m
inin
fryi
ngpa
nw
ithve
geta
ble
oil.
90m
in,9
0◦C
90m
in90
◦ CP 9
0>
10P 9
0>
10Fr
ozen
Chi
lled
9/11
Not
sign
ifica
nt
Not
e:aSe
eTa
ble
10.2
.b2n
dph
ase
ofBa
rriq
uand
reto
rtcy
cle.
c Pai
red
com
paris
on;
20ta
ster
s.
219

BLUK139-Evans January 23, 2008 17:38
220 Frozen Food Science and Technology
of P70 > 2. The cook time–temperature values (Table 10.3) are not product core temperaturesbut refer to the holding times/temperatures in the middle (2nd) phase of the Barriquand retortcycle; the other phases are come-up (1st) and cooling (3rd). Beef and lamb required muchlonger cooking times than the other products. Samples to be frozen after sous vide cookingreceived a shorter process than those to be chilled in the case of carrots, broccoli florets,salmon/cod fillets and pasta shells (Table 10.3).
Paired comparison taste panel tests indicated no statistically significant preference forfrozen versus chilled sous vide products (Table 10.3). This is a key finding as freezing post-sous vide cooking gives additional product safety without seriously impairing product quality.Freezing versus chilling post–sous vide cooking had a variable effect on the physico-chemicalproperties of the product range (Tansey et al., 2005). Some of these were statistically signif-icant but the differences were small in practical terms as indicated by the paired comparisontaste panel data (Table 10.3).
10.7.4 Effect of freezing rate and length of frozen storage
Rapid freezing is usually associated with high product quality and in this regard sous videsamples of the 10 products were frozen by cabinet (−20◦C; still air), air blast (−30◦C for2 h; air speed 3.75 m s–1) and liquid nitrogen (LN) (−196◦C) freezing methods. Theseprocedures represent slow, intermediate and fast freezing rates, respectively, and the effecton the texture (shear values), colour and gravity/centrifugal drip values of sous vide sampleswas evaluated. The impact of the different freezing methods on the quality parameters wassmall and the efficacy of LN as a rapid freezing medium was lessened due to the largeunit size (200 g) of the sous vide packs (Tansey et al., 2005). In further tests, Carbonell andOliveira (see Tansey et al., 2005) showed that high-pressure shift freezing gave frozen cookedpotatoes similar to just-cooked ones, particularly in terms of texture. This result is applicableto vegetables in general. However, the technology is expensive to acquire and to run, andmay lack robustness. A simpler low-cost fast-freezing method, which has application to sousvide packs, is immersion in an ethylene glycol solution.
Long-term frozen storage has the potential to adversely affect product quality due to icecrystal growth, moisture migration and oxidation (Gormley et al., 2002). The sous vide packsfor the 10 products in the trial were blast frozen (−35◦C for 2.5 h), stored at −20◦C and testedafter 0, 3, 6 and 9 months. Length of storage time at −20◦C had a statistically significanteffect on the colour parameters (Hunter Lab) of some of the 10 sous vide products. However,the magnitude of these effects was small in practical terms and would not have a major effecton product visual appearance as sensed by the consumer. Length of time at −20◦C had noeffect on the texture (shear values) of sous vide cooked broccoli, cod, salmon, chicken, beefor lamb. Pasta and rice samples became progressively firmer with storage time as indicatedby shear values of 3.11, 3.35, 3.44 and 3.66 (pasta), and 4.11, 4.67, 5.13 and 5.60 kN (rice)at the 0, 3, 6 and 9 month test dates. There was no pattern in the shear data for carrots orpotatoes (Tansey et al., 2005).
10.7.5 Safety aspects of sous vide processing
The traditional microbiological concern associated with sous vide processing is that a mildheat treatment in conjunction with vacuum packaging and an extended shelf-life (in chill)may pose a risk from the survival and growth of Clostridium botulinum and from toxinproduction. However, the introduction of a freezing step to the process, if properly controlled,
BLUK139-Evans January 23, 2008 17:38
Developing Frozen Products for the Market and the Freezing of Ready-Prepared Meals 221
will overcome this risk. Extensive microbiological trials were conducted as part of the P-SV-F system on the effects of sous vide processing and post-processing storage conditions onthe survival of food pathogens (Bourke and O’Beirne, 2003a, 2003b). The research focusedon the effects of different thermal treatments, pretreatments and preparation steps, stressconditions and combined thermal, freezing and frozen storage on the survival of a range ofpathogens. Specific aspects included: (a) strain effects on thermal resistance properties ofListeria spp.; (b) comparison of thermal resistance of E. coli O157:H7 and Salmonella spp.;(c) effects of stress conditions on the thermal resistance of L. innocua (Tansey et al., 2005).
10.7.6 Overall outcomes on sous vide freezing
A P-SV-F system for the sous vide cooking of ready-meal components (10 products) embrac-ing pretreatments (P), sous vide cook times/temperatures (SV), and freezing (F) post-sousvide cooking has been tested, optimised and validated. Taste panellists were unable to detect adifference between sous vide products that were frozen versus chilled after sous vide cooking.This is a key result as the former ensures safety and is easily managed (i.e. frozen storage),while the latter requires a carefully controlled chill chain. Rate of freezing, or long-term frozenstorage had a minimal effect on the quality attributes of the 10 sous vide cooked products.
Acknowledgements
Thanks are extended to Karen Hussey, Thomas Walshe, Lisa Darley, Anne Decazes, AliciaMarcilla, Sophie Noiret, Anne Jestin, Claudia Duelk, Anne Sainlot and Tanja Budde whoconducted elements of the freeze-chilling and sous vide work. Thanks are also extended tothe Irish Department of Agriculture and Food for funding the freeze-chilling and sous videresearch under the Food Institutional Research Measure (FIRM) as part of the Irish NationalDevelopment Plan.
REFERENCES
Anonymous (2001a). UK consumption of lasagne meals looks set to double. Frozen and Chilled Foods EuropeApril, 2.
Anonymous (2001b). Guidelines for the Interpretation of Results of Microbiological Analysis of Some Ready-to-eat Foods at Point of Sale. Guidance Note No. 3, Published by the Food Safety Authority of Ireland,Dublin, Ireland.
Anonymous (2005a). Opportunities still exist: EU ready-meals/ingredients market overview. Food Ingredientsand Analysis International 27(3), 4–6.
Anonymous (2005b). Disposals on the way?. Frozen Food Europe 17(6), 28–30.Anonymous (2005c). Scrumptious! (US frozen ready-meals market). Frozen Food Age 54(5), 14–17.Betts, G. (1992). The Microbiological Safety of Sous Vide Processing, Technical Manual No. 39, Campden
and Chorleywood Food Research Association [CCFRA], Chipping Campden, Gloucestershire, UK.Birks, S. (1999). The ‘eat go’ generation. Food Manufacture 74(2), 32–34.Bøgh-Sørensen, L. (1990). The TTT-PPP concept for chilled foods. In: P. Zeuthen, J.C., Cheftel, C., Eriksson,
T.R., Gormley, Linko, P. and K. Paulus, eds. Processing and Quality of Foods, Vol. 3: Chilled Foods: TheRevolution in Freshness. London and New York: Elsevier Applied Science, pp. 3.42–3.52.
Bourke, P. and O’Beirne, D. (2003a). Effects of sous vide processing and post-processing storage conditionson the survival of L. innocua in salmon and beef. In: Proceedings of the 33rd Annual Food Science andTechnology Research Conference. University College Cork, Cork, Ireland, p. 97.
BLUK139-Evans January 23, 2008 17:38
222 Frozen Food Science and Technology
Bourke, P. and O’Beirne, D. (2003b). Thermal inactivation of L. innocua in a range of sous vide modelproducts: some effects of prior heat stress and acid adaptation. In: Proceedings of the 1st FEMS Conferenceof European Microbiologists. Ljubljana, Slovenia, p. 136.
Creed, P.G. and Reeve, W. (1998). Principles and applications of sous vide processed foods. In: S. Gazala,ed. Sous Vide and Cook-Chill Processing for the Food Industry. Gaithersburg, MD: Aspen Publications,pp. 25–26.
Darrington, H. (1999). High noon at noon. Food Manufacture 74(7), 30–31.Decazes, A.M., Redmond, G.A., Gormley T.R. and Butler, F. (2001). Vitamin C retention in mashed potato.
In: Proceeding of 31st Annual Food Science and Technology Research Conference. University CollegeCork, Cork, Ireland, p. 45.
Dempsey, A. (2003). The Effect of Starch Type and Freezing Rates on Freeze-Chilled Starch-based Sauces.MSc thesis, University College Dublin, Dublin, Ireland.
Fabrega Fernandez, A. and Forcadell Berenguer, M.L. (1992). Microbiological study of frozen ready-mealsfor bulk sale. Alimentaria No. 229, 61–68.
Faulks, R.M. and Griffiths, N.M. (1983). Influence of variety, site and storage on physical, sensory andcompositional aspects of mashed potato. Journal of the Science of Food and Agriculture 34, 979–986.
Favell, D.J. (1998). A comparison of the vitamin C content of fresh and frozen vegetables. Food Chemistry62, 59–64.
Fennema, O. (1993). Frozen foods: challenges for the future. Food Australia 45, 374–380.Gerety, A. (2004). Investigation of the Thawing Process for Selected Ready-Meals and their Components.
MSc thesis, University College Dublin, Dublin, Ireland.Gormley, T.R. and Tansey, F.S. (2004). Emerging freeze-chill and sous vide technologies in the production
of ready-meals. European Food and Drink Review 1, 28–30.Gormley, T.R., Duelk, C. and Tansey, F.S. (2003). Sous vide/freezing of cod and salmon portions. Proceed-
ings of the Transatlantic Fisheries Technology Conference (TAFT). The Icelandic Fisheries Laboratories,Reykjavik, Iceland, pp. 66–67.
Gormley, T.R., Walshe, T., Hussey, K. and Butler, F. (2002). The effect of fluctuating vs constant frozen storagetemperature regime on some quality parameters of selected food products. Lebensmittel-Wissenschaft und-Technologie 35(2), 190–200.
Holah, J. (2000). Food processing equipment design and cleanability. FLAIR-FLOW EUROPE TechnicalManual No. F-FE 377A/00. Ashtown Food Research Centre, Teagasc, Dublin, Ireland, p. 47.
IIR (International Institute of Refrigeration). (1986). Recommendations for the Processing and Handling ofFrozen Foods, 3rd edn. Paris: IIR.
Khan, A.A. and Vincent, J.F.V. (1996). Mechanical damage induced by controlled freezing in apple andpotato. Journal of Texture Studies 27, 143–157.
Khan, Y. (2000). Product design: ready-meals. Food Ingredients and Analysis International, January/February,pp. 21–22, 25–26.
Kobs, L.(1997). Designing frozen foods. Food Product Design January, 27–43.Kyriakides, A. and Batchford, S. (2002). The microbiological safety and quality of ready-meals. In: Ready-
Meal Technology. Leatherhead Publishing, pp. 192–228.Longree, K. (1950). Quality problems in cooked, frozen potatoes. Food Technology 4, 98–104.Lynn, S. (2000). New packaging products for convenience foods. Packaging News June, 15–16.Mitchell, M. (2006). Ashtown Food Research Centre (Teagasc), Dublin, Ireland. Personal communication.O’Leary, E., Gormley, T.R., Butler, F. and Shilton, N. (2000). The effect of freeze-chilling on the quality of
ready-meal components. Lebensmittel-Wissenschaft und- Technologie 33(3), 217–224.Oxley, E. (2003). The Effect of Freeze-Chilling on the Quality and Shelf Life of Selected Ready-Meal Com-
ponents Under Varying Storage Temperature Conditions. MSc thesis, University College Dublin, Dublin,Ireland.
Redmond, G.A., Gormley T.R. and Butler, F. (2003a). The effect of short- and long-term freeze-chilling onthe quality of mashed potato. Innovative Food Science and Emerging Technologies 4(1), 85–97.
Redmond, G.A., Decazes, A.M., Gormley T.R. and Butler, F. (2003b). The vitamin C status of freeze-chilledmashed potato. Journal of Food Engineering 56(2–3), 219–221.
Redmond, G.A., Gormley, T.R. and Butler, F. (2004a). The effect of short- and long-term freeze-chilling onthe quality of cooked green beans and carrots. Innovative Food Science and Emerging Technologies 5(1),65–72.
Redmond, G.A., Gormley, T.R. and Butler, F. (2004b). The effect of short- and long-term frozen storage withMAP on the quality of freeze-chilled lasagne. Lebensmittel-Wissensehaft und- Technologie 38(1), 81–87.

BLUK139-Evans January 23, 2008 17:38
Developing Frozen Products for the Market and the Freezing of Ready-Prepared Meals 223
Redmond, G.A., Gormley, T.R., Butler, F., Dempsey, A., Oxley, E. and Gerety, A. (2004c). Freeze-Chilling ofReady-to-Eat Meal Components. End-of-Project Report. Ashtown Food Research Centre, Teagasc, Dublin,Ireland, p. 32.
SVAC (Sous Vide Advisory Board). (1991). Codes of Practice for Sous Vide Catering Systems. Tetbury,Gloucestershire, UK.
Swain, M.J., Foster, A.M., Phillips, I.C., Wilkins, T.J., James, S.J., Radhakrishnan, C.D. and Burfoot, D.(1995). Effect of Initial Temperature of Food and Continuous use of a Microwave Oven on the Temperatureof Food after Heating. UK: Ministry of Agriculture, Fisheries and Food Publications.
Tansey, F.S. and Gormley, T.R. (2002). Sous vide/freezing of ready-meals. Farm and Food Research 12(1),18–22.
Tansey, F.S. and Gormley, T.R. (2005). Sous vide/freezing technology for ready-meals. In: G.V. Barbosa M.S.Tapia and M.P. Cano, eds. Novel Food Processing Technologies. Boca Raton, FL: Marcel Decker/CRCPress, pp. 477–490.
Tansey, F.S., Budde, T. and Gormley, T.R. (2003a). The effect of sous vide/freezing technology on the qualityof broccoli florets. In: Proceedings of the 33rd Annual Food Science and Technology Research Conference.University College Cork, Cork, Ireland, p. 44.
Tansey, F.S., Duelk, C. and Gormley, T.R. (2003b). The effect of sous vide/freezing technology on the textureof salmon portions. Proceedings of the 12th World IUFOST Congress. Chicago, IL, www.iufost.org.
Tansey, F.S., Gormley, T.R., Bourke, P., O’Beirne, D. and Oliveira, J.C. (2003c). Texture, quality and safetyof sous vide/frozen foods. In: J.S.A. Edwards and I.B. Gustafsson, eds. Culinary Arts and Sciences 1V:Global and National Perspectives. Bournemouth University, Poole, UK, pp. 199–207.
Tansey, F., Gormley, T.R., Carbonell. S., Oliveira, J., Bourke, P. and O’Beirne, D. (2005). Developing sousvide/freezing systems for ready-meal components. End of Project Report. Ashtown Food Research Centre,Teagasc, Dublin, Ireland, p. 36.
Tasses, P. (2001). Process and Apparatus for Preparing Meals. European Patent Application, Patent No.1248537 A1.
van Arsdel, W.B., Copley, M.J. and Olson, R.L. (1969). Quality and Stability of Frozen Foods. New York:Wiley Interscience.
Vickers, R. (1999). Could the ice be melting for frozen ready-meals?. Food Processing (UK) 68(8), 17–18.Williams, P.G., Ross, H. and Brand Miller, J.C. (1995). Ascorbic acid and 5-methyltetrahydrofolate losses
in vegetables with cook/chill or cook/hot-hold in foodservice systems. Journal of Food Science 60(3),541–546.
BLUK139-Evans January 23, 2008 17:39
11 Frozen Storage
Noemi E. Zaritzky
The market for frozen food has expanded worldwide over the last 50 years to include a varietyof products. Even if a food product is adequately frozen, physico-chemical and biochemicalchanges during storage can lead to a degradation in its quality. Quality of frozen food ishighly dependent on storage temperature and there is a need for a constant and systematiccontrol on maintaining the required temperature throughout the frozen foods distribution inthe cold chain, from production to final consumption. Storage and transport conditions havegreat influence on the quality of frozen foods.
11.1 QUALITY LOSSES IN FROZEN FOOD
Ice formation involves a series of modifications that deteriorate food quality. Although thesemodifications slow down at low temperatures, they continue during frozen storage condi-tions. Physical and chemical changes can be described as deterioration mechanisms that areproduced during frozen storage causing quality losses in frozen foods.
11.1.1 Physical changes during frozen storage
The main physical changes during storage of frozen food are moisture migration and icerecrystallisation. Both phenomena are related to the stability of frozen water inside and onthe surface of the product (Fennema et al., 1973; Zaritzky, 2000).
11.1.1.1 Moisture migration
A slow freezing process of tissues can allow sufficient time for water migration due to osmoticforces from the inner region of a cell to the freeze-concentrated intercellular region. This canresult in cell desiccation, cell wall disruption, loss of turgor and crushing of the dried cell bythe large intercellular ice mass. These phenomena affect not only the texture of the frozenproduct, but also a significant drip loss during thawing and cooking can occur, leading to aloss of nutrients.
During frozen storage the existence of temperature gradients within a product createswater vapour pressure profiles resulting in moisture migration and relocation of the water,both within and from the product. There is an overall tendency for moisture to move into thevoid spaces around the foodstuff and to accumulate on the product surface and on the internalpackage surface. In packaged frozen food, moisture migration leads to ice formation inside
Frozen Food Science and Technology. Edited by Judith A. Evans
© 2008 Blackwell Publishing Ltd, ISBN: 978-1-4051-5478-9

BLUK139-Evans January 23, 2008 17:39
Frozen Storage 225
the package (Pham and Mawson, 1997). Temperature fluctuations (cooling–warming cycles)produce a net migration of moisture from the interior towards the surface of the foodstuff,or to the wrapping. The temperature of the packaging material follows the temperaturefluctuations in the storage room faster than the product itself. As the surrounding temperaturedecreases, moisture inside the pores sublimes and diffuses to the packaging film; whenambient temperature increases, the ice on the wrapping tends to diffuse back to the surface ofthe food; however, reabsorption of water in the original location is impossible, and the processcan be considered irreversible, producing undesirable weight losses. Moisture migration canbe minimised by maintaining small temperature fluctuations and small internal temperaturegradients and by the inclusion of internal barriers within the product and within the packaging.
Weight losses during freezing and frozen storage have economic consequences, unless theproduct is packaged in films of low water vapour permeability.
According to Pham and Mawson (1997) typical weight losses during meat processingare 1–2% during chilling, 1% during freezing, and about 0.5–1% per month during storageand transport, unless the product is packaged in an impervious film; the rate of sublimationdoubles for every 10◦C rise in temperature.
Freezer burn is a surface desiccation defect caused by sublimation that can occur whenfrozen tissues are stored without an adequate moisture barrier packaging. It manifests itselfas an opaque dehydrated surface, produced by moisture losses in frozen foods. An excessivedesiccation can accelerate oxidative alterations at the surface of the product. Freezer burnincreases oxygen contact with the food surface area and raises oxidative reactions, whichirreversibly alter colour, texture and flavour. It is caused by the sublimation of ice on thesurface region of the tissue where the water pressure of the ice is higher than the vapourpressure of the environment. In cold storage rooms the temperature of the freezing coil(evaporator) is always lower than the surrounding air, therefore ice forms and accumulateson the coil. As moisture is removed, the relative humidity of the air in the cold room drops.Since the water vapour pressure over the surface of the frozen product is higher than that ofthe air, a constant loss of water in the form of vapour is produced from unprotected materials;sublimation continues as long as this vapour pressure difference continues. Glazing, dippingor spraying a thin layer of ice on the surface of an unwrapped frozen product helps to preventdrying. Freezer burn is prevented if a product is packed in tight-fitting, water-proof, vapour-proof material, avoiding evaporation. Surface coating of prepared meals reduces the effectof this quality loss and may even add value to the product.
11.1.1.2 Recrystallisation of Ice
Slow freezing results in a low rate of nucleation and the production of a small number oflarge ice crystals, whereas fast freezing causes a high rate of nucleation leading to the for-mation of a large number of small ice crystals. However, during frozen storage ice crystalsundergo metamorphic changes. Recrystallisation reduces the advantages of fast freezing andincludes any change in the number, size, shape, orientation, or perfection of crystals follow-ing completion of initial solidification (Fennema et al., 1973). In frozen aqueous solutionsrecrystallisation is the process by which the average ice crystal size increases with time.Small ice crystals are thermodynamically unstable, having a high surface/volume ratio andtherefore a large excess of surface free energy. The net result of minimising free energy is thatthe number of crystals decreases at constant ice phase volume but their mean size increases(Sutton et al., 1996). Recrystallisation basically involves small crystals disappearing, large
BLUK139-Evans January 23, 2008 17:39
226 Frozen Food Science and Technology
crystals growing and crystals fusing together, and affects the quality of the product becausesmall ice crystals make the product quality better; large crystals often cause damage duringfreezing. As the temperature of an aqueous specimen increases within the subfreezing range,the rate of recrystallisation also increases (Rapatz and Luyet, 1959; Mac Kenzie and Luyet,1967; Reid et al., 1987).
There are different types of recrystallisation processes described in literature (Fennemaet al., 1973; Hartel, 2001; Zaritzky, 2006): (a) iso-mass, (b) migratory, (c) accretive, (d)pressure-induced, and (e) irruptive.
11.1.1.2.1 Surface iso-mass recrystallisationThis includes changes in the shape or internal structure of a crystal and reduction of thedefects as the crystal tends to a lower energy level maintaining a constant mass of ice. This‘rounding off’ process may be produced by surface diffusion of the water molecules. Icecrystals of irregular shape and large surface-to-volume ratio (dendritic crystals) adopt a morecompact configuration with a smaller surface-to-volume ratio and a lower surface energy.Sharper surfaces are less stable than flatter ones and show a tendency to become smootherover time.
11.1.1.2.2 Migratory recrystallisation or grain growthThis refers to the tendency of large crystals in a polycrystal system to grow at the expenseof the smaller ones. Ostwald ripening refers to migratory recrystallisation that occurs atconstant temperature and pressure due to differences in surface energy between crystals,which is proportional to the crystal curvature. Melting–diffusion–refreezing or sublimation–diffusion–condensation are possible mechanisms leading to an increase in average crystalsize, a decrease in the number of crystals, and a decrease in surface energy of the entirecrystalline phase. At constant temperature and pressure, migratory recrystallisation is theresult of differences in the surface energies of large and small crystals. The small crystals,with a very small radii of curvature, cannot bind the surface molecules as firmly as largercrystals, thus, small crystals exhibit lower melting points than large ones. Migratory recrys-tallisation is enhanced by temperature fluctuations inducing a melt–refreeze behaviour dueto ice content changes induced by temperature variations. Melt–refreeze behaviour can leadto complete disappearance of smaller crystals during warming and growth of larger crystalsduring cooling, or to a decrease in size of crystals during partial melting and regrowth ofexisting crystals during cooling. Melt–refreeze should occur to a greater extent at highertemperatures and more rapidly for smaller crystals.
11.1.1.2.3 Accretive recrystallisationThis is produced when contacting crystals join together increasing crystal size and decreasingthe number of crystals and surface energy of the crystalline phase. The proposed mechanismof crystal aggregation is surface diffusion. Accretion refers to a natural tendency of crystalsin close proximity to fuse together; the concentration gradients in the areas between themare high, thus, material is transported to the point of contact between crystals and a neck isformed. Further ‘rounding off’ occurs because a high-curvature surface like this has a naturaltendency to become planar. The number of molecules leaving a curved surface is larger thanthe number of molecules arriving on that surface. The continued exchange of molecules at theinterface serves to reduce the curvature of a single crystal (forming a sphere) or to reduce thenumber of small crystals by adding to the larger crystals.
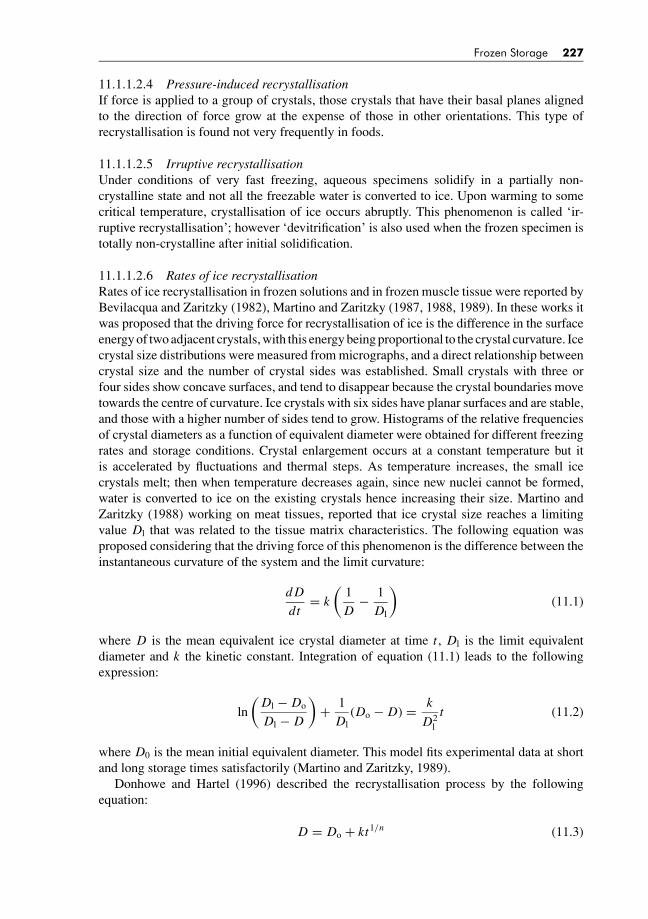
BLUK139-Evans January 23, 2008 17:39
Frozen Storage 227
11.1.1.2.4 Pressure-induced recrystallisationIf force is applied to a group of crystals, those crystals that have their basal planes alignedto the direction of force grow at the expense of those in other orientations. This type ofrecrystallisation is found not very frequently in foods.
11.1.1.2.5 Irruptive recrystallisationUnder conditions of very fast freezing, aqueous specimens solidify in a partially non-crystalline state and not all the freezable water is converted to ice. Upon warming to somecritical temperature, crystallisation of ice occurs abruptly. This phenomenon is called ‘ir-ruptive recrystallisation’; however ‘devitrification’ is also used when the frozen specimen istotally non-crystalline after initial solidification.
11.1.1.2.6 Rates of ice recrystallisationRates of ice recrystallisation in frozen solutions and in frozen muscle tissue were reported byBevilacqua and Zaritzky (1982), Martino and Zaritzky (1987, 1988, 1989). In these works itwas proposed that the driving force for recrystallisation of ice is the difference in the surfaceenergy of two adjacent crystals, with this energy being proportional to the crystal curvature. Icecrystal size distributions were measured from micrographs, and a direct relationship betweencrystal size and the number of crystal sides was established. Small crystals with three orfour sides show concave surfaces, and tend to disappear because the crystal boundaries movetowards the centre of curvature. Ice crystals with six sides have planar surfaces and are stable,and those with a higher number of sides tend to grow. Histograms of the relative frequenciesof crystal diameters as a function of equivalent diameter were obtained for different freezingrates and storage conditions. Crystal enlargement occurs at a constant temperature but itis accelerated by fluctuations and thermal steps. As temperature increases, the small icecrystals melt; then when temperature decreases again, since new nuclei cannot be formed,water is converted to ice on the existing crystals hence increasing their size. Martino andZaritzky (1988) working on meat tissues, reported that ice crystal size reaches a limitingvalue Dl that was related to the tissue matrix characteristics. The following equation wasproposed considering that the driving force of this phenomenon is the difference between theinstantaneous curvature of the system and the limit curvature:
d D
dt= k
(1
D− 1
Dl
)(11.1)
where D is the mean equivalent ice crystal diameter at time t , Dl is the limit equivalentdiameter and k the kinetic constant. Integration of equation (11.1) leads to the followingexpression:
ln
(Dl − Do
Dl − D
)+ 1
Dl(Do − D) = k
D2l
t (11.2)
where D0 is the mean initial equivalent diameter. This model fits experimental data at shortand long storage times satisfactorily (Martino and Zaritzky, 1989).
Donhowe and Hartel (1996) described the recrystallisation process by the followingequation:
D = Do + kt1/n (11.3)

BLUK139-Evans January 23, 2008 17:39
228 Frozen Food Science and Technology
where D is the mean crystalline diameter, D0 is the initial diameter, k is the recrystallisationrate and n is the power law exponent. Recrystallisation was studied in either model sugarsystems or in ice cream (Harper and Shoemaker, 1983; Sutton et al., 1996; Sutton et al.,1996) and results showed that ice crystals increased in size as a function of time to a power(1/n) between 0.33 and 0.5 (Donhowe and Hartel, 1996).
The addition of hydrocolloids (locust bean gum, guar gum, carrageenan, xanthan gum) isimportant in the case of ice cream to control ice recrystallisation (Regand and Goff, 2003).Hydrocolloids are also added in frozen gelatinised starch-based systems that are used as saucesin precooked foods. Ferrero et al. (1993a, 1993b, 1994) performed recrystallisation studieson corn starch pastes (10% w/w wet basis) and observed that the addition of hydrocolloidssuch as xanthan gum (0.3% w/w wet basis) to these pastes modified neither the size of icecrystals at different freezing rates nor ice recrystallisation rates compared to pastes withoutgum addition. Hydrocolloids are recommended as ice crystal inhibitors, but different studiesshow that the stabilisation character of hydrocolloids should be explained on another basis,such as their capability to undergo molecular entanglement in the freeze concentrated matrixsurrounding ice crystals (Ferrero et al., 1993a).
Ice crystal size influences the stable shelf-life of the product mainly by its effect on thetexture. This is important in products that are consumed in the frozen state (e.g. ice cream) inthese cases a coarse or sandy texture is normally observed when large ice crystals are present.
11.1.2 Chemical changes produced by freezing andfrozen storage
During the freezing of food, water is transferred into ice crystals and solutes concentrate inthe unfrozen matrix. Slow freezing results in a maximum ice crystal purity and maximumconcentration of solutes in the unfrozen phase, leading to equilibrium conditions (Fennemaet al., 1973).
In contrast, rapid freezing results in a considerable entrapment of solutes by growing crys-tals and a lower concentration of solutes in the unfrozen phase. The increasing concentrationof solutes in the unfrozen matrix increases the ionic strength and can produce changes affect-ing the biopolymer structures. Water structure and water–solute interactions may be alteredand interactions between macromolecules such as proteins may increase. Formation of icecrystals can produce the release of contents of food tissues; reactions that normally do notoccur in intact cells may occur as a consequence of the freezing process. The possibility thatenzymes come in contact with different substrates increases, leading to quality deteriorationduring frozen storage. Most enzymes exhibit substantial activity after freezing and thawingand many enzymes show significant activity in partially frozen systems. Freezing can giveunusual effects on chemical reactions; temperature and concentration of the reactants in theunfrozen phase (freeze concentration effects) are the main factors responsible for changesin the reaction rates in frozen products. In many frozen systems, reaction rates as a functionof temperature go through a maximum at some temperature below the initial freezing point.This is a consequence of opposing factors: low temperatures that bring reaction rates down,and increasing solute concentration in the unfrozen phase that may increase these reactionrates. For example, oxidation of myoglobin (meat pigment) was accelerated at temperaturesclose to −5◦C (Lanari et al., 1990; Lanari and Zaritzky, 1991).
The most important chemical changes that can proceed during freezing and frozen storageare: enzymatic reactions, protein denaturation, lipid oxidation, degradation of pigments andvitamins, and flavour deterioration (Zaritzky, 2006).

BLUK139-Evans January 23, 2008 17:39
Frozen Storage 229
11.1.2.1 Enzymatic reactions
Storage at low temperatures can decrease the activity of enzymes in tissues but cannot in-activate them. In raw products, hydrolases (enzymes catalysing hydrolytic cleavage) such aslipases (carboxylic ester hydrolases), phospholipases (phosphatid cleaving enzymes), pro-teases (hydrolases cleaving peptide bonds) etc., may remain active during frozen storage.Hydrolytic enzymes can produce quality deterioration in products that are not submitted tothermal treatments before freezing; however, blanching of vegetables or cooking of meatinactivates these enzymes (Sista et al., 1997). Lipases and phospholipases, hydrolyse esterlinkages of triacylglycerols and phospholipids, respectively; the hydrolysis of lipids can leadto undesirable flavour and textural changes. Certain lipases can remain active in frozen foodsystems stored even at −29◦C. Lipase activity is evident in the accumulation of free fattyacids. Freezing may accentuate lipolysis by disrupting the lysosomal membrane that releaseshydrolytic enzymes, especially at low freezing rates and under fluctuating temperatures.During storage, the release of short-chain free fatty acids can lead to hydrolytic rancidity,producing off flavours and may interact with proteins forming complexes that affect texture.
Proteases catalyse the hydrolysis of proteins to peptides and amino acids; in meat thisendogenous enzymes are considered beneficial, tenderising the muscles during rigor mortis(Sista et al., 1997). Conditioned meat on freezing not only retains the texture quality, but alsohas a smaller tendency to drip on thawing.
The browning of plant tissue is caused by enzymatic oxidation of phenolic compoundsin the presence of oxygen. Disruption of cells by ice crystals can start enzymatic browningby facilitating contact between o-diphenol oxidase and its substrate. The oxido-reductasesare of primary importance because their action leads to off-flavour and pigment bleaching invegetables, and to browning in some fruits.
In vegetable and fruit tissues, endogenous pectin methyl esterases catalyses the removal ofthe methoxyl groups from pectins. In the case of frozen strawberries, these enzymes producegelation during storage. Hydrolytic enzymes, such as chlorophylases and anthocyanasespresent in plants, may catalyse destruction of pigments in frozen tissues affecting the colour,if they are not inactivated by blanching.
11.1.2.2 Protein denaturation
The main causes of freeze-induced damage to proteins are ice formation and recrystallisation,dehydration, salt concentration, oxidation, changes in lipid groups and the release of certaincellular metabolites. Freeze-induced protein denaturation, and related functionality lossesare commonly observed in frozen fish, meat, poultry, egg products and dough.
During freezing, proteins are exposed to an increased concentration of salts in the unfrozenphase; the high ionic strength can produce competition with existing electrostatic bonds, mod-ifying the native protein structure. Losses in functional properties of proteins are commonlyanalysed by comparing water-holding capacity, viscosity, gelation, emulsification, foamingand whipping properties. Freezing has an important effect in decreasing water-holding capac-ity of muscle systems on thawing, producing changes also in protein solubility. This decreaseoccurs during freezing, because water–protein associations are replaced by protein–proteinassociations or other interactions (Xiong, 1997). Proteins exposed to the aqueous medium ofthe biological tissues have a hydrophobic interior, and charged (or polar) side chains in thesurface. The migration of water molecules from the interior of the tissue during extracellularfreezing leads to a more dehydrated state disrupting protein–solvent interactions. Protein
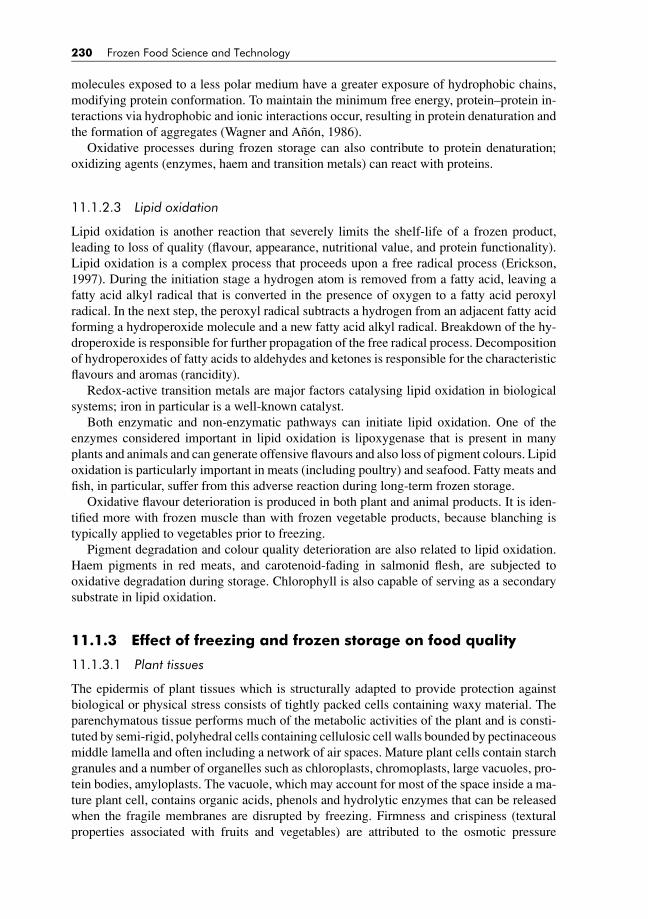
BLUK139-Evans January 23, 2008 17:39
230 Frozen Food Science and Technology
molecules exposed to a less polar medium have a greater exposure of hydrophobic chains,modifying protein conformation. To maintain the minimum free energy, protein–protein in-teractions via hydrophobic and ionic interactions occur, resulting in protein denaturation andthe formation of aggregates (Wagner and Anon, 1986).
Oxidative processes during frozen storage can also contribute to protein denaturation;oxidizing agents (enzymes, haem and transition metals) can react with proteins.
11.1.2.3 Lipid oxidation
Lipid oxidation is another reaction that severely limits the shelf-life of a frozen product,leading to loss of quality (flavour, appearance, nutritional value, and protein functionality).Lipid oxidation is a complex process that proceeds upon a free radical process (Erickson,1997). During the initiation stage a hydrogen atom is removed from a fatty acid, leaving afatty acid alkyl radical that is converted in the presence of oxygen to a fatty acid peroxylradical. In the next step, the peroxyl radical subtracts a hydrogen from an adjacent fatty acidforming a hydroperoxide molecule and a new fatty acid alkyl radical. Breakdown of the hy-droperoxide is responsible for further propagation of the free radical process. Decompositionof hydroperoxides of fatty acids to aldehydes and ketones is responsible for the characteristicflavours and aromas (rancidity).
Redox-active transition metals are major factors catalysing lipid oxidation in biologicalsystems; iron in particular is a well-known catalyst.
Both enzymatic and non-enzymatic pathways can initiate lipid oxidation. One of theenzymes considered important in lipid oxidation is lipoxygenase that is present in manyplants and animals and can generate offensive flavours and also loss of pigment colours. Lipidoxidation is particularly important in meats (including poultry) and seafood. Fatty meats andfish, in particular, suffer from this adverse reaction during long-term frozen storage.
Oxidative flavour deterioration is produced in both plant and animal products. It is iden-tified more with frozen muscle than with frozen vegetable products, because blanching istypically applied to vegetables prior to freezing.
Pigment degradation and colour quality deterioration are also related to lipid oxidation.Haem pigments in red meats, and carotenoid-fading in salmonid flesh, are subjected tooxidative degradation during storage. Chlorophyll is also capable of serving as a secondarysubstrate in lipid oxidation.
11.1.3 Effect of freezing and frozen storage on food quality
11.1.3.1 Plant tissues
The epidermis of plant tissues which is structurally adapted to provide protection againstbiological or physical stress consists of tightly packed cells containing waxy material. Theparenchymatous tissue performs much of the metabolic activities of the plant and is consti-tuted by semi-rigid, polyhedral cells containing cellulosic cell walls bounded by pectinaceousmiddle lamella and often including a network of air spaces. Mature plant cells contain starchgranules and a number of organelles such as chloroplasts, chromoplasts, large vacuoles, pro-tein bodies, amyloplasts. The vacuole, which may account for most of the space inside a ma-ture plant cell, contains organic acids, phenols and hydrolytic enzymes that can be releasedwhen the fragile membranes are disrupted by freezing. Firmness and crispiness (texturalproperties associated with fruits and vegetables) are attributed to the osmotic pressure
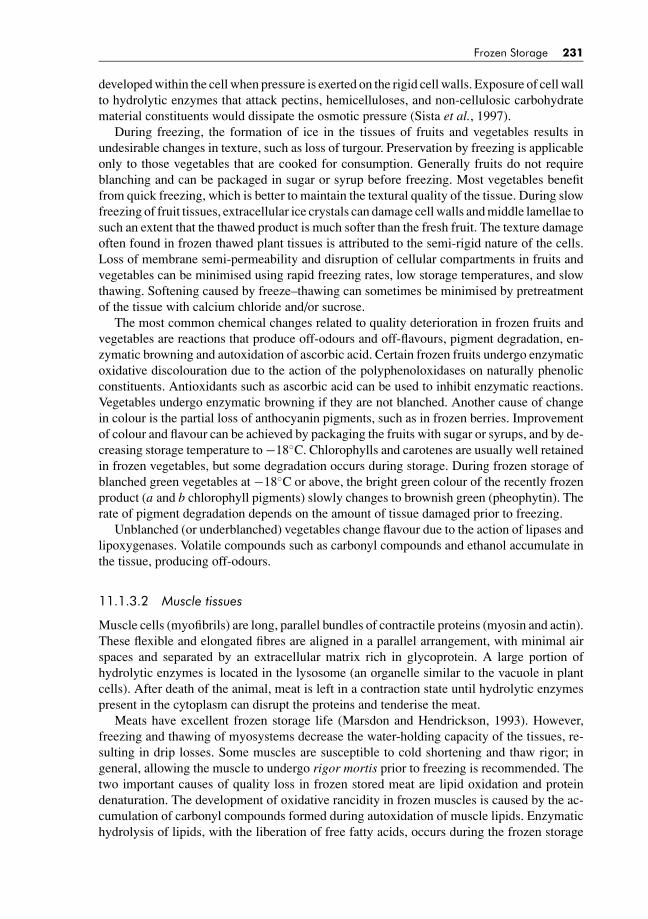
BLUK139-Evans January 23, 2008 17:39
Frozen Storage 231
developed within the cell when pressure is exerted on the rigid cell walls. Exposure of cell wallto hydrolytic enzymes that attack pectins, hemicelluloses, and non-cellulosic carbohydratematerial constituents would dissipate the osmotic pressure (Sista et al., 1997).
During freezing, the formation of ice in the tissues of fruits and vegetables results inundesirable changes in texture, such as loss of turgour. Preservation by freezing is applicableonly to those vegetables that are cooked for consumption. Generally fruits do not requireblanching and can be packaged in sugar or syrup before freezing. Most vegetables benefitfrom quick freezing, which is better to maintain the textural quality of the tissue. During slowfreezing of fruit tissues, extracellular ice crystals can damage cell walls and middle lamellae tosuch an extent that the thawed product is much softer than the fresh fruit. The texture damageoften found in frozen thawed plant tissues is attributed to the semi-rigid nature of the cells.Loss of membrane semi-permeability and disruption of cellular compartments in fruits andvegetables can be minimised using rapid freezing rates, low storage temperatures, and slowthawing. Softening caused by freeze–thawing can sometimes be minimised by pretreatmentof the tissue with calcium chloride and/or sucrose.
The most common chemical changes related to quality deterioration in frozen fruits andvegetables are reactions that produce off-odours and off-flavours, pigment degradation, en-zymatic browning and autoxidation of ascorbic acid. Certain frozen fruits undergo enzymaticoxidative discolouration due to the action of the polyphenoloxidases on naturally phenolicconstituents. Antioxidants such as ascorbic acid can be used to inhibit enzymatic reactions.Vegetables undergo enzymatic browning if they are not blanched. Another cause of changein colour is the partial loss of anthocyanin pigments, such as in frozen berries. Improvementof colour and flavour can be achieved by packaging the fruits with sugar or syrups, and by de-creasing storage temperature to −18◦C. Chlorophylls and carotenes are usually well retainedin frozen vegetables, but some degradation occurs during storage. During frozen storage ofblanched green vegetables at −18◦C or above, the bright green colour of the recently frozenproduct (a and b chlorophyll pigments) slowly changes to brownish green (pheophytin). Therate of pigment degradation depends on the amount of tissue damaged prior to freezing.
Unblanched (or underblanched) vegetables change flavour due to the action of lipases andlipoxygenases. Volatile compounds such as carbonyl compounds and ethanol accumulate inthe tissue, producing off-odours.
11.1.3.2 Muscle tissues
Muscle cells (myofibrils) are long, parallel bundles of contractile proteins (myosin and actin).These flexible and elongated fibres are aligned in a parallel arrangement, with minimal airspaces and separated by an extracellular matrix rich in glycoprotein. A large portion ofhydrolytic enzymes is located in the lysosome (an organelle similar to the vacuole in plantcells). After death of the animal, meat is left in a contraction state until hydrolytic enzymespresent in the cytoplasm can disrupt the proteins and tenderise the meat.
Meats have excellent frozen storage life (Marsdon and Hendrickson, 1993). However,freezing and thawing of myosystems decrease the water-holding capacity of the tissues, re-sulting in drip losses. Some muscles are susceptible to cold shortening and thaw rigor; ingeneral, allowing the muscle to undergo rigor mortis prior to freezing is recommended. Thetwo important causes of quality loss in frozen stored meat are lipid oxidation and proteindenaturation. The development of oxidative rancidity in frozen muscles is caused by the ac-cumulation of carbonyl compounds formed during autoxidation of muscle lipids. Enzymatichydrolysis of lipids, with the liberation of free fatty acids, occurs during the frozen storage

BLUK139-Evans January 23, 2008 17:39
232 Frozen Food Science and Technology
of meats. Fish and pork, which contain a higher proportion of more reactive polyunsaturatedfatty acids, are more susceptible to the development of rancidity.
In red meats, colour is determined by the relative concentration of purple myoglobin,bright red oxymyoglobin and brown metmyoglobin. Freezing–thawing accelerates pigmentoxidation and the production of metmyoglobin. The colour of meats may become unattractiveto the consumer; this may be due either to desiccation of the meat surface with the consequentdevelopment of grey areas (attributed to light scattering effects without ice crystals) or to thedarker colour of myoglobin compared to oxymyoglobin.
Metmyoglobin formation in red meats and carotenoid bleaching in fish and poultry tendtowards parallel fat oxidation (Haard, 1997). In the case of fish, the major problems found dur-ing freeze processing are oxidative deterioration, dehydration, toughening, loss of juiciness,and excessive drip.
11.1.3.3 Ice cream
During its manufacture it is very important to produce a large number of small ice crystals toget an optimal texture. Recrystallisation is the most important change during frozen storagethat produces quality losses and limits the storage life. Storage temperature fluctuations mustbe avoided (Kennedy, 2000; Goff, 2006).
11.1.3.4 Cheese
During the freezing and frozen storage of cheese, the body and texture become more crumblyand mealy. An increase in the unordered structure of proteins in frozen cheese is consistentwith the greater proteolysis and damage to the microstructure, affecting the viscoelasticproperties (Bertola et al., 1996; Graiver et al., 2004; Goff, 2006).
11.1.3.5 Frozen eggs
Liquid egg products are pasteurised to eliminate Salmonella before freezing. Appropriatefreezing processes generally cause minor changes in raw egg white; however, freezing eggyolk at a temperature below −6◦C causes gelation that is an irreversible change in its fluidtexture leading to an undesirable product. Addition of cryoprotectants improves the qualityand extends the shelf-life. For frozen egg products sodium chloride and sucrose at a level of10% are commonly added to the yolk to prevent gelation. Syrup, glycerin, phosphates andsugars can also be used. Fast freezing results in less gelation both of egg yolk and of wholeegg due to lesser damage to protein structure (Lai, 2006).
11.1.3.6 Frozen ready meals
They are complex multi-component products with a wide variety of ingredients that arecooked and then frozen (Creed, 2006). The modes of deterioration in frozen convenience foodsduring frozen storage are: rancidity in meat portions, weeping and curdling of sauces anddiscolouration. They normally include sauces, gravies which act as protective agents for thesolid elements, minimising dehydration and reducing rancidity development. Lipid oxidationleads to flavour deterioration; colour changes can also result from pigment degradation in meatand vegetables because of lipid oxidation. Sauces based on gelatinised starch are composed
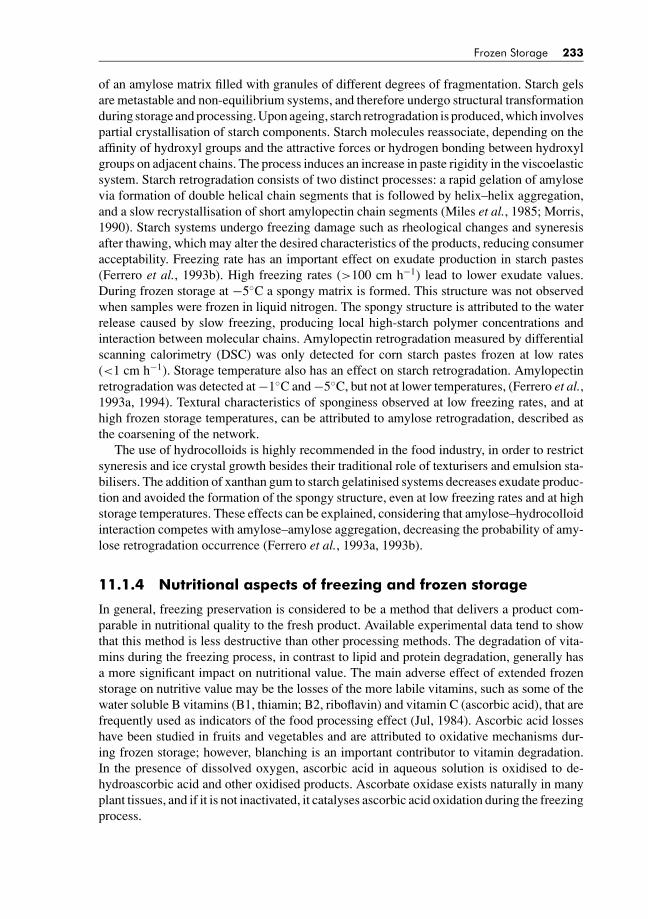
BLUK139-Evans January 23, 2008 17:39
Frozen Storage 233
of an amylose matrix filled with granules of different degrees of fragmentation. Starch gelsare metastable and non-equilibrium systems, and therefore undergo structural transformationduring storage and processing. Upon ageing, starch retrogradation is produced, which involvespartial crystallisation of starch components. Starch molecules reassociate, depending on theaffinity of hydroxyl groups and the attractive forces or hydrogen bonding between hydroxylgroups on adjacent chains. The process induces an increase in paste rigidity in the viscoelasticsystem. Starch retrogradation consists of two distinct processes: a rapid gelation of amylosevia formation of double helical chain segments that is followed by helix–helix aggregation,and a slow recrystallisation of short amylopectin chain segments (Miles et al., 1985; Morris,1990). Starch systems undergo freezing damage such as rheological changes and syneresisafter thawing, which may alter the desired characteristics of the products, reducing consumeracceptability. Freezing rate has an important effect on exudate production in starch pastes(Ferrero et al., 1993b). High freezing rates (>100 cm h−1) lead to lower exudate values.During frozen storage at −5◦C a spongy matrix is formed. This structure was not observedwhen samples were frozen in liquid nitrogen. The spongy structure is attributed to the waterrelease caused by slow freezing, producing local high-starch polymer concentrations andinteraction between molecular chains. Amylopectin retrogradation measured by differentialscanning calorimetry (DSC) was only detected for corn starch pastes frozen at low rates(<1 cm h−1). Storage temperature also has an effect on starch retrogradation. Amylopectinretrogradation was detected at −1◦C and −5◦C, but not at lower temperatures, (Ferrero et al.,1993a, 1994). Textural characteristics of sponginess observed at low freezing rates, and athigh frozen storage temperatures, can be attributed to amylose retrogradation, described asthe coarsening of the network.
The use of hydrocolloids is highly recommended in the food industry, in order to restrictsyneresis and ice crystal growth besides their traditional role of texturisers and emulsion sta-bilisers. The addition of xanthan gum to starch gelatinised systems decreases exudate produc-tion and avoided the formation of the spongy structure, even at low freezing rates and at highstorage temperatures. These effects can be explained, considering that amylose–hydrocolloidinteraction competes with amylose–amylose aggregation, decreasing the probability of amy-lose retrogradation occurrence (Ferrero et al., 1993a, 1993b).
11.1.4 Nutritional aspects of freezing and frozen storage
In general, freezing preservation is considered to be a method that delivers a product com-parable in nutritional quality to the fresh product. Available experimental data tend to showthat this method is less destructive than other processing methods. The degradation of vita-mins during the freezing process, in contrast to lipid and protein degradation, generally hasa more significant impact on nutritional value. The main adverse effect of extended frozenstorage on nutritive value may be the losses of the more labile vitamins, such as some of thewater soluble B vitamins (B1, thiamin; B2, riboflavin) and vitamin C (ascorbic acid), that arefrequently used as indicators of the food processing effect (Jul, 1984). Ascorbic acid losseshave been studied in fruits and vegetables and are attributed to oxidative mechanisms dur-ing frozen storage; however, blanching is an important contributor to vitamin degradation.In the presence of dissolved oxygen, ascorbic acid in aqueous solution is oxidised to de-hydroascorbic acid and other oxidised products. Ascorbate oxidase exists naturally in manyplant tissues, and if it is not inactivated, it catalyses ascorbic acid oxidation during the freezingprocess.
BLUK139-Evans January 23, 2008 17:39
234 Frozen Food Science and Technology
11.1.5 Microbiology of frozen products
Microbial deterioration mechanism is not a problem in frozen foods because they are stored attemperatures below the lower limits of microbial growth (approximately −10◦C). However,with temperature fluctuations during storage and distribution, these may become significant.The major objective of freezing as a method for food preservation is to prolong storage lifeof the products by retarding or inhibiting microbial growth. Freezing (and the subsequentfrozen storage) can produce certain lethality in some micro-organisms but this process isvery slow and variable, depending on the type of foodstuff. Freezing cannot be regarded as amethod to reduce microbial contamination; for this reason, hygienic and sanitary conditionsprior to processing are very important. Storage temperatures below −10◦C inhibit bacterialgrowth, whereas yeasts and moulds cannot multiply below −12◦C and −18◦C, respectively(Zaritzky, 2000).
11.1.6 Glass transition temperature and stability of frozen food
Most food materials can be considered biopolymers and exist in an amorphous state. Meltingof crystalline polymers results in the formation of an amorphous system, which can besupercooled to a viscoelastic, rubbery state or to a solid glassy state. The glass transitiontakes place when a completely amorphous polymer undergoes a transition from a vitreousstate to a high-mobility rubbery state where diffusion-controlled changes occur. The effectof water as a plasticiser of food systems is manifested as a depression of the glass transitiontemperature of the amorphous components. Below the glass transition temperature (Tg),polymer material becomes glassy, and the molecular motion is so slow, that crystallisationdoes not occur in a finite period of time; thus, deterioration governed by diffusion is inhibited.At temperatures above Tg and below the crystal melting temperature (Tm), the material isrubbery and sufficient motion of polymers occur to allow crystallisation. Ice formation infood materials results in freeze concentration of the solutes; non-equilibrium ice formationis a typical phenomenon of rapidly cooled biological materials at low temperatures. Freezeconcentration and lowering of temperature increase the viscosity of the unfrozen phase untilthis concentrated solution becomes a glass (Roos, 1995). The glass transition temperature ofa slowly frozen sample is higher than that of a rapidly cooled sample, and is considered tobe the glass transition temperature of the freeze-concentrated solute matrix surrounding the icecrystals in a maximally frozen solution (T ′
g) (Levine and Slade, 1986). At this temperaturethe unfrozen water in the matrix is unable to freeze and then ice formation ceases withinthe time-scale of normal measurement (Franks, 1985; Goff, 1997; Levine and Slade, 1988,1991; Roos and Karel, 1991; Le Meste et al., 2002).
Below T ′g the unfrozen matrix takes on solid properties because of reduced molecular
motion, which is responsible for the marked reduction in translational, not rotational, mobility(Slade and Levine, 1995; Roos and Karel, 1991). Solutions cooled rapidly to temperatureslower than T ′
g show non-equilibrium ice formation. In rapidly cooled systems being in theglassy state, ice-formation can occur during rewarming (exothermic devitrification) at atemperature above T ′
g (Roos and Karel, 1991a, 1991b) and ice is produced by crystallisationof the immobilised water, before the onset of ice melting. Roos and Karel (1991) suggestedthat formation of such maximally frozen solutions in the unfrozen matrix requires annealingslightly below the initial ice melting temperature within the maximally frozen solution. Thecryostabilisation of frozen foods is related to the possibility of maintaining the productbelow the glass transition temperature of the freeze concentrated matrix (T ′
g), or to modify

BLUK139-Evans January 23, 2008 17:39
Frozen Storage 235
the formulation of the food to increase glass transition temperatures to above normal storagetemperatures. If a product is stored at a temperature below T ′
g it may be expected to becomposed of ice and a freeze-concentrated phase in the glassy state and long-term stabilitymay be predicted. If the storage temperature is between T ′
g and Tm, the freeze-concentratedphase is not in the glassy state, it is more diluted (rubbery) and processes governed bydiffusion are not inhibited. These processes can lead to deterioration during food storage.Frozen foods stored below T ′
g are stable to ice recrystallisation and other physical changes(Fennema, 1996).
Food systems based on gelatinised starch may undergo important textural changes relatedto amylose and amylopectin retrogradation (Miles et al., 1985; Morris, 1990); they can showsyneresis (exudate production) and a spongy texture due to slow freezing and frozen storageat relatively high temperatures. These changes may make such products unacceptable for theconsumer. As starch retrogradation is a recrystallisation process, it is controlled by diffusionand depends on solute mobility in the system.
Working with a frozen gelatinised starch system, Ferrero et al. (1996) demonstrated thatstorage at temperatures below T ′
g minimises physical changes in the concentrated matrix.Using DSC, they reported T ′
g onset values ranging between −4.5◦C and −5.5◦C for annealedfrozen starch pastes; Slade and Levine (1991) reported similar temperature ranges. Rapidfrozen samples stored at −10◦C and −20◦C had a homogeneous structure without a spongynetwork; they showed no evidence of starch retrogradation because at temperatures belowT ′
g amylose and amylopectin chains in concentrated matrix have a reduced mobility thatlimits the molecular association responsible for the crystallisation (retrogradation) of starchmolecules. The addition of hydrocolloids such as xanthan gum helps to maintain in thefrozen samples the rheological characteristics of unfrozen starch pastes, even under lowfreezing rate conditions. Xanthan gum does not prevent amylopectin retrogradation, becauseamylopectin remains in the starch granule but inhibits the development of a spongy structureproduced by amylose retrogradation. Ferrero et al. (1996) demonstrated that the additionof small quantities of hydrocolloids (in the ranges used in common formulations) did notchange T ′
g of the samples, but had an important role in minimising structural damage infrozen starch systems; they improved rheological properties related to amylose retrogradation.Additionally, hydrocolloids can make systems in the rubbery state more viscous, decreasingmolecular mobility and avoiding retrogradation related to sponge formation (Ferrero et al.,1994).
Frequently, low molecular solutes such as sucrose are added to starch–water systems;the addition of sucrose shifts T ′
g from −5◦C towards a lower value of −23◦C. By measuringviscoelastic properties, Ferrero and Zaritzky (2000) reported amylose retrogradation (spongystructure and high values of the dynamic complex modulus G∗1) during common storagetemperatures such as −18◦C. This behaviour was not observed in quickly frozen samplesstored at −80◦C whose G* values coincided practically with those of the just quickly frozensample. Results can be explained again considering that sample storage temperature (−18◦C)lay above T ′
g (−23◦C) allowing molecular mobility.Kasapis (2006) reported that the glass transition measured by calorimetry (DSC) remains
unaltered by the presence of low levels of polysaccharide; however, the mechanical profileof the rubber-to-glass transition is strongly influenced by the polysaccharide, particularly if
1 G* is the complex viscoelastic shear modulus of a material (G∗ = G′ + iG′′) and represents the contributions ofG′ (the shear storage modulus or elastic component) and G′′ (the shear loss modulus or viscous component).

BLUK139-Evans January 23, 2008 17:39
236 Frozen Food Science and Technology
its network forming is affecting the rheological properties of the system. Reduction in thediffusion kinetics and increase in the relaxation time of the unfrozen phase in the presenceof polysaccharide as monitored by stress relaxation studies, confirmed the utility of a three-dimensional network in the stabilisation at sub-zero temperatures.
Reid et al. (2003) have reported the following T ′g values (mobility temperatures) us-
ing DSC and a capacitance cell: −20◦C (potato), −23◦C (green been), −24◦C (broccoli),−29◦C (spinach), −20◦C (apricot), −25◦C (plum), −30◦C (pear), −27◦C (apple), −33◦C(strawberry), −27◦C (salmon), −30◦C (cod), −24◦C and −34◦C (beef), −23◦C (chicken).Knowledge of the influence of factors such as freezing rate and composition of the systemon glass transition temperature would help to determine adequate formulations, processingor storage conditions in order to enhance frozen foods shelf-life.
11.2 TEMPERATURE REQUIREMENTS DURINGFROZEN STORAGE
Frozen foods deteriorate during storage by different mechanisms and low temperatures arerequired to maintain the food quality. Deterioration is accentuated by the fluctuating time–temperature environment during storage.
The required temperature conditions need to be maintained in the cold chain from theproducer to the consumer assuring a temperature of −18◦C – a limit set by the majority ofinternational regulations.
Monitoring and control of the cold chain is a prerequisite for reliable quality managementand optimisation (Giannakourou et al., 2006). According to the EU Directive 89/108 (QuickFrozen Food Directive, QFF), after quick freezing, the product should be maintained at −18◦Cor colder after thermal stabilisation (Anonymous, 1989). Some frozen foods (broilers, beef,butter) have a fairly long storage life even at −12◦C whereas foods such as lean fish requirestorage temperatures around −28◦C. In the United States a temperature of −18◦C or colderis recommended; however, ice creams require −23◦C or colder. The EU Directive 92/1(Anonymous, 1992) requires that a temperature-recording device must be installed in eachstorage facility to register and store for at least a year the temperature data of air surroundingthe perishable food.
Legislation on control of transport equipment and temperatures during transport has beengetting more and more strict. The Quick Frozen Food Directive requires that the temperatureof quick frozen food must be maintained at −18◦C or colder at all points of the product, withpossible brief upward fluctuations of no more than 3◦C during transport.
Storage temperatures can fluctuate significantly over the complete cold chain. Typically,−23◦C has been the average for the manufacturer’s cold store with a maximum target of nomore than −18◦C during fluctuations. This may rise to −18◦C during distribution to eitherthe wholesaler or the retailer. A further rise in the mean is quoted at retail level. Although−18◦C is the target, the norm is to maintain it at least at −15◦C. The fluctuations become evengreater when the consumer enters the chain, because this transport can start surface thawing(McKenna, 2006). The domestic freezer will probably be close to that in the retail outlet, butcan have large variations. In addition, temperature changes during the defrost cycles at bothretail and domestic levels can have a significant impact. However, it is generally admittedthat fluctuations of 3–5◦C may occur in any one part of the chain.
Fluctuations in storage temperature significantly affect the shelf-life of the product. Theamplitude of the ambient thermal fluctuation is reduced inside the package; besides it was
BLUK139-Evans January 23, 2008 17:39
Frozen Storage 237
mathematically demonstrated that ambient temperature fluctuations with large oscillationperiods cause higher amplitude fluctuations inside the product, this situation being moredetrimental to the quality of frozen food, than short oscillation periods (Zaritzky, 1982).
11.3 SHELF-LIFE OF FROZEN FOOD
The shelf-life of a frozen food is a complex concept that depends on the characteristics ofthe food product and the environmental conditions to which the food is exposed after beingsubjected to the freezing process. Packaging also plays an important role in maintaining thequality of foods. The International Institute of Refrigeration (IIR, 1986) has recommendedtwo definitions: practical storage life (PSL) and high-quality life (HQL).
The practical storage life (PSL) or acceptability time is the period of proper frozen storageafter freezing of an initial high-quality product, through which the frozen food retains itsquality characteristics and is suitable for consumption or for use in further process.
High-quality life parameter (HQL) is defined as the storage period through which the initialquality was maintained from the time of freezing up to the point where 70% of the trainedtaste panel members are capable of detecting a noticeable difference between the frozenfood stored at different temperatures and the corresponding controls stored at −40◦C in atriangular sensory test; therefore this parameter is also known as Just Noticeable Difference(JND).
The three main factors that affect product quality of any given frozen food are: initialquality of the original foodstuff, processing and packaging of the product, and temperatureand duration of storage. For any specific frozen product, which mode determines its shelf-life,depends on the product characteristics (raw materials, ingredients, formulation), prefreezingtreatment, freezing process, packaging film, and storage temperature. Besides, the shelf-lifeof a frozen food can be extended through ingredient selection, process modification andchange of package or storage conditions.
Data on practical storage and high-quality life of different frozen foods have been reportedin literature (Van Arsdel et al., 1969; Jul, 1984). Table 11.1 shows values of PSL adaptedfrom IIR (Anonymous, 1986).
The ratios between practical storage life (PSL) and HQL for frozen foods range between2 and 3. Reported values are the following: 1.9–2.0 for lean meat, 2.0–2.4 for fatty meat,1.9–2.2 for lean fish, 2.4–2.7 for fatty fish, 3.1–3.5 for vegetables, 2.8–3.1 for fruit and 2.8–3 for precooked foods. Considering that PSL values are greater than the HQL values, thedetermination of HQL in frozen foods can be used to shorten shelf-life testing times (Fu andLabuza, 1997).
11.3.1 Shelf-life testing
Shelf-life testing consists basically of selecting the quality characteristics, which deterioratemost rapidly in time and the mathematical modelling of the change. Quality characteristics,which depend on the specific product, usually require professional judgement.
The criterion for the end of shelf-life may be variable depending on the definition of productquality grade, so the shelf-life of a product may also be variable. Chemical oxidations thatcause an off-flavour development and loss of colour are readily recognisable by consumers.
Several frozen foods deteriorate mainly by slow chemical reactions such as loss of nutri-tional value. For example, the vitamin C content of some frozen fruits and vegetables may

BLUK139-Evans January 23, 2008 17:39
238 Frozen Food Science and Technology
Table 11.1 Effect of storage temperature on practical storage life (in months) of frozen foods.
Storage temperature ◦C
Product −12◦C −18◦C −24◦C
FruitsPeaches, apricots, cherries (raw) 4 18 >24Raspberries, strawberries (raw) 5 24 >24Raspberries, strawberries (in sugar) 3 24 >24Concentrated fruit juice — 24 >24
VegetablesAsparagus (with green spears) 3 12 >24Beans (green) 4 15 >24Broccoli — 15 24Brussels sprouts 6 15 >24Carrots 10 18 >24Cauliflower 4 12 24Cut corn 4 15 18Mushrooms 2 8 >24Peas 6 24 >24Peppers (red and green) — 6 12French fried potatoes 9 24 >24Spinach 4 18 >24Onions — 10 15
Meat and meat productsBeef, ground/minced 6 10 15Beef steaks 8 18 24Veal steaks 6 12 15Lamb steaks 12 18 24Pork steaks 6 10 15Bacon (sliced, vacuum packed) 12 12 12Chicken (whole or cuts) 9 18 >24Turkey (whole) 8 15 >24Liver 4 12 18
SeafoodFatty fish (lazed) 3 5 >9Lean fish 4 9 >12Shrimps (cooked/peeled) — 2 5
EggsWhole egg — 12 >24
Milk productsButter (lactic, unsalted, pH 4.7) 15 18 20Butter (lactic, salted, pH 4.7) 8 12 14Cream — 12 15Ice cream 1 6 24
Bakery and confectioneryCakes (cheese, chocolate, fruit) — 15 24Breads — 3 —Raw dough — 12 18
Source: IIR Recommendations for the Processing and Handling of Frozen Foods. International Institute of Refriger-ation, Paris, 1986.
BLUK139-Evans January 23, 2008 17:39
Frozen Storage 239
fall below the required standard before sensory quality becomes inadequate. The criteria forshelf-life may also vary depending on the sensitivity of the consumer. For consumers, taste,odour, and appearance are the most obvious criteria; in academia and in the industry, bothsensory evaluation and instrumental measurements of a given quality index (e.g. vitamin Clevel) are usually conducted.
Since 1950 different time–temperature–tolerance (TTT) experiments have been performedby the USDA Western Regional Research Center in Albany, California to analyse the sta-bility of a great number of frozen foods (fruits, vegetables and meats) stored at differenttemperatures for various periods of time (Van Arsdel et al., 1969; Jul, 1984). The qualitywas measured by organoleptic testing carried out by taste panels, and by various objectivemeasurements such as ascorbic acid deterioration, the change of chlorophyll to pheophytin,etc. Results were expressed as straight lines in a semi-logarithmic diagram as stability time(number of days taken to undergo a certain amount of quality deterioration) versus storagetemperature. The PSL of frozen foods depends not only on time and temperature of storage,but also to a large extent on product, process and packaging; these are the so-called PPPfactors introduced by Jul (1984). In general, the changes in quality during frozen storage atdifferent temperatures are cumulative and irreversible; these changes are normally smaller atlower temperatures, thus storage temperature is the determinant factor that governs qualityand shelf-life.
Reid et al. (2003) have proposed a new method for accelerated shelf-life prediction forfrozen foods which requires around 60 days and involves direct determination of shelf-livesat the more elevated storage temperature (where the change is more rapid), coupled withinformation on the mobility temperature (T ′
g). The authors measured mobility temperaturesof typical foods, chlorophyll and ascorbic acid retentions in plant tissues, myofibrillar pro-tein solubility in meat muscle and dimethylamine content in fish muscle. The role of T ′
g indiffusion-controlled processes is clear; however, its influence on chemical reactions has tobe investigated more deeply.
11.3.2 Modelling the loss of quality in frozen food
The knowledge of shelf-life is very important in the development of any new frozen foodproduct, or when changes of packaging or storage/distribution conditions are introduced.This life must at least exceed the minimum distribution time required from the processor tothe consumer.
Quality is a complex attribute of food, which influences the degree of its acceptability tothe consumer. In the case of frozen food, physical phenomena that lead to quality changesand kinetics of chemical reactions, play an important role in food shelf-life. The change offood quality can be represented by the loss of one or more quality index (e.g. flavour, colour,vitamin C) and by the formation of undesirable products (e.g. peroxide value).
These quality factors can be sensory parameters or can be measured using instrumentalanalysis. Chemical and physical analysis such as moisture, nutrient loss, free fatty acids,peroxides, oxidative volatiles (e.g. hexanals) and colour that correlates closely to sensoryattributes can supplement sensory techniques increasing the confidence level of the results(Fu and Labuza, 1997). Once a frozen product starts its distribution from the manufacturer’splant to warehouse, distribution centre, retail store and finally consumer freezer, the rate ofquality loss is primarily temperature dependent.
Considering that the representative quality factor (P) changes with time (t), the followingkinetic equation can be proposed, where k is the apparent reaction rate constant and n the
BLUK139-Evans January 23, 2008 17:39
240 Frozen Food Science and Technology
apparent order of the reaction:
d P
dt= k Pn. (11.4)
Most published data related to quality deterioration do not give rate constants as a function oftemperature; they are in the form of an overall storage life (end-point analysis) as a functionof storage temperature. The storage life θ can be considered determined by a defined value ofthe property Pθ . Integrating equation (11.4) with n = 0 (zero order reaction) the followingis obtained:
f0(Pθ ) = Pθ − P0 = kθ (11.5)
where P0 is the initial quality value, Pθ corresponds to the quality value at the end of shelf-life θ and f0(Pθ ) is the quality function for a zero order reaction, evaluated at the end ofthe storage life. Equation (11.5) implies that the rate of quality loss is constant at constantstorage temperature.
For a first order reaction, the change in quality follows an exponential decay with storagetime then:
f1(Pθ ) = ln
(Pθ
P0
)= kθ (11.6)
where f1(Pθ ) is the quality function of the first order reaction evaluated at θ .As can be seen in equations (11.5) and (11.6), the shelf-life (θ ) of a frozen food depends
on storage temperature and is determined by a defined quality change given by the functionf (Pθ ). The product kθ will be constant at different storage temperatures and equal to thechange in the property defined by the test conducted to determine the storage life. The shelf-life θ of the frozen food stored at a constant temperature is then inversely proportional tothe rate constant k. However, when it is necessary to determine, at a given temperature, theeffect of time on a quality property, knowledge of the reaction kinetics is necessary. Themajority of food reactions that have been studied have been characterized as pseudo-zero orpseudo-first order. When a reaction has less than 50% conversion, the zero and first ordersmight be indistinguishable in goodness of fit (Labuza, 1979).
If the end of shelf-life is within less than 20% conversion, for practical purposes either apseudo-zero or pseudo-first order model can be used.
The temperature dependence of the deterioration rate constant can be described throughthe Arrhenius equation:
ln k = ln k0 − Ea
RT(11.7)
where k0 is a pre-exponential factor; Ea is the activation energy in J mol−1; R is the universalgas constant (8.3144 J mol−1 K); T is the absolute temperature. Activation energy canbe calculated from the slope of the linear plot of lnk as a function of reciprocal absolutetemperature (1/T ). A higher value of Ea means that the reaction is more temperature sensitive,and a small change in T produces a large change in the rate constant. The ratios between therate constants k and k1 corresponding to the absolute temperatures T and T1 and between

BLUK139-Evans January 23, 2008 17:39
Frozen Storage 241
storage life values θ and θ1, can be calculated as follows:
ln
(k
k1
)= − Ea
R
(1
T− 1
T1
)= ln
(θ1
θ
)(11.8)
where the following relationship was considered: k · θ = k1 · θ1. Equation (11.8) shows thatactivation energy values can be estimated from shelf-life data evaluated at least at threedifferent temperatures around those normally used for frozen storage of the product undertest. Rodriguez and Zaritzky (1983) plotting 1/θ values (PSL data of frozen beef, obtainedfrom Jul, 1969) as a function of 1/T , estimated that the activation energy for frozen beefdeterioration is 39.5 kJ mol−1. Other authors (Giannakourou et al., 2006) reported activationenergy values of Ea = 136.8 kJ mol−1 for ascorbic loss and Ea = 79.2 kJ mol−1 for colourloss, both in frozen green peas.
The Q10 approach is often used for estimation of the temperature acceleration of shelf-life. Q10 of a food product indicates the magnitude of the increase in the rate of deterio-ration (k) when the temperature is increased by 10◦C and can be calculated from shelf-lifevalues:
Q10 = k at temp T + 10◦C
k at temp T= θ at T
θ at T + 10◦C(11.9)
Besides, Q10 can be related to the Arrhenius equation and the shelf-life model through thefollowing expression:
Q10 = exp
(10Ea
RT (T + 10)
)= θT
θT +10(11.10)
Q10 values ranging between 2 and up to 20 have been reported for frozen foods: 2 for frozenbeef, 4 for pork sausage, 3.2 for ground hamburger, 3.5 for raw poultry, 9 for fatty fish, 3.2for fried poultry, 8 for pork (Labuza, 1982; Jul, 1984; Labuza and Schmidt, 1985).
Frozen foods are often exposed to a variable temperature environment. In such cases,the change in the quality property P depends on the kinetics of the reaction. The qualityfunction f (P) (zero or first order) of the food stored for the total time ttot under changingenvironmental conditions can be estimated from the following integral:
f (P) =∫ ttot
ok(T (t))dt (11.11)
where the kinetic constant k is a function of temperature that changes with time.If the temperature function T (t) is discretised in small time increments (ti ) of constant
temperature Ti , then the change in the quality property is given by (Giannakourou et al.,2006):
f (P) = kref
∑i
exp
[−Ea
R
(1
Ti− 1
Tref
)]ti . (11.12)

BLUK139-Evans January 23, 2008 17:39
242 Frozen Food Science and Technology
Using equation (11.12), the extent of quality loss (change in the property P given byf (P)) during frozen storage can be calculated when both the kinetic equation and the time–temperature history are known.
There is a continuous quality loss in frozen storage that is in general cumulative, thus thetotal quality loss through freezing, storage, transport and distribution can be calculated byadding the losses at each step of the process.
When the loss of quality follows a zero order reaction, the fraction of shelf-life consumedat each stage in which temperature remained constant, can be estimated as follows:
Pi − P0
Pθ − P0= t
θ(11.13)
where P0 is the initial quality value, Pθ the quality value at the end of shelf-life θ and Pi thequality value after the stage at constant temperature Ti . Only when deterioration reaction islinear with time (zero order reaction), shelf-life loss can be considered equivalent to the lossof quality. In this case the fraction of quality lost is equal to the ratio between the intervalof time at a given temperature and the shelf-life at this particular temperature. Then thepercentage of PSL that the frozen food retains is given by:
% quality retained =(
1 − tT
θT
)100 (11.14)
When the temperature history of the product is known, the fraction of shelf-life consumedcan be calculated as the sum of the exposure times at each temperature interval tT i dividedby the shelf-life at that temperature θT i .
Thus the final quality retained by the frozen food submitted to different time–temperatureintervals can be calculated assuming that the rule of additivity is valid for frozen foods (Jul,1984), which means that the loss of remaining storage life or quality can be calculated fromthe knowledge of the prior time–temperature sequences the product has been exposed to
% quality retained =(
1 −m∑1
tTi
θTi
)100 = 1 − ttotal
θTeff
(11.15)
An effective storage temperature Teff can be defined as that constant temperature exposurewhich causes during the total exposure time (ttotal) the same quality change as the variabletemperature condition does.
Knowing the percentage of quality retained by the food submitted to variable temperaturesand knowing the total exposure time, it is possible to calculate the storage life at the effectivetemperature (θTeff) and by interpolation the effective temperature (Teff).
In conclusion, to quantify the percentage of quality retained by the food after frozenstorage at different temperatures, it is not only necessary to know the activation energy valuesof the reactions but also the kinetic equations that represent the deterioration rate. When thiskinetics is of zero order, a simplified expression given by equation (11.15) can be applied. Asan indicative case study, the quality loss of frozen peas was analysed by Giannakourou et al.(2006) using kinetic equations that described green colour change and L-ascorbic oxidation;besides, activation energy values of these reactions allowed us to predict shelf-life of frozenproducts for different time–temperature scenarios.

BLUK139-Evans January 23, 2008 17:39
Frozen Storage 243
11.3.3 Time–temperature integrators
Temperature of both the food and the environment should be monitored, to obtain an efficientrecord of the product history. Measurements can be carried out either by mechanical or byelectronic equipment with or without the potential of recording and storing an electronic fileof data. The three principal kinds of sensors are thermocouples, platinum resistances andthermistors (Giannakourou et al., 2006).
An alternatively way to individually monitor the temperature conditions through the coldchain is the use of a time–temperature indicator/integrator (TTI). The operation of a TTIis based on mechanical, chemical or enzymatic systems that change irreversibly from thetime of its activation. The rate of the change has to increase at higher temperatures in amanner similar to most deterioration food reactions. The change is usually expressed as avisible response (colour development and colour movement, etc.). The TTI can keep trackof an accumulated time–temperature distribution function to which a perishable product issubjected from the point of manufacture to the display shelf of the retail outlet, or even tothe consumer (Fu and Labuza, 1997). These devices are attached on the food itself or outsidethe packaging. The time–temperature integrators show a physical or a colour change andan essential condition is that the energy of activation of this device shall coincide with theenergy of activation of the frozen food deterioration, that means having the same temperaturesensitivity as the food they are monitoring (Rodriguez and Zaritzky, 1983). The ultimatepurpose of their application is the translation of their reading to the quality status of the foodthrough an appropriate algorithm.
The commercial devices available in the international market and the extensive work thathas been published on TTI development for frozen food, have been reviewed by Giannakourouet al. (2006).
11.4 PACKAGING OF FROZEN FOOD
Packaging plays a key role in protecting the frozen product from contamination by externalsources and from damage during its passage from the food producer to the consumer. Thekey functions of food package are: protection, preservation and presentation. Protection isnecessary to prevent the following: external biological contamination; dehydration causedby moisture loss and freeze burn; oxidation of lipids, flavours, colours and vitamins; loss orgain of aromas; and physical damage (abrasion, fracture and compression) during storage andtransport (Krochta, 2006). Frozen food packaging materials must be able to withstand lowtemperatures of −25◦C to −30◦C without embrittlement and sometimes high temperatures,such as microwave and boil-in-bag products.
The materials used, besides being specifically for food, must be chemically inert, non-toxic and prevent the transfer of foreign odours or flavours. They must be stable, elastic,tear-resistant, and proof against water vapour and volatile substances. The alterations andlosses in aroma and flavour, enzymatic browning and oxidation of ascorbic acid that takeplace in the presence of oxygen suggest that such packaging materials should be used that areimpervious to oxygen or permit removal of the oxygen from inside the package either by cre-ating a partial vacuum or by injecting inert gases. They must also offer protection against light,particularly UV rays. They should be adaptable to different automatic packaging systems, ofan appropriate size and shape for easy storing and distribution, and ready for opening. Pack-ages should be effective as thermal insulators to limit possible temperature fluctuations within

BLUK139-Evans January 23, 2008 17:39
244 Frozen Food Science and Technology
the product. A variety of primary packaging are currently employed including plain, coated,metallised, laminated plastic films, lidded plastic trays and thermoforms often contained inpaperboard sleeves or cartons.
The materials most commonly used for frozen food packaging include (i) paperboard andmoulded pulp that have poor barrier properties but good structural resistance and provideprotection against physical damage; (ii) plastic materials with excellent moisture, oxygenand aroma barriers; (iii) semi-rigid plastic containers that have good structural properties;and (iv) aluminium that is a total barrier to moisture, oxygen, and aroma.
The most commonly used plastic packaging materials are:
– low-density polyethylene (LDPE), high-density polyethylene (HDPE), and polypropylene(PP): these are excellent moisture barriers but have poor oxygen barrier properties;
– polyvinylidene chloride (PVDC)/polyvinyl chloride (PVC) copolymer that are excellentmoisture, oxygen and aroma barriers.
– ethylene vinyl alcohol (EVOH) copolymer and polyamide (Nylon) with poor moisturebarrier properties and excellent oxygen and aroma barrier properties;
– polyethylene terephthalate (PET), with good moisture, oxygen and aroma barrier and goodheat resistance; the heat resistance is even greater in crystallised polyethylene terephthalate(CPET).
LPDE is one of the most common plastics used, providing good protection against moistureloss as a flexible film pouch or as a coating on paper board.
Heat resistant HDPE and PP film pouches are used for boil-in-bag or microwavablepouches. PP can be used to form trays or coat paperboard trays that are microwavable. Heatresistant PET can be used to form trays or coated paperboard trays that are dual ovenable.Coating the LDPE or HDPE with or PET or PVDC/PVC copolymer increases the oxygenbarrier properties. Layers of EVOH or polyamide (that are moisture sensitive) between layersof PE provide a good oxygen barrier.
Irreversible dehydration of frozen meat will occur at the surface unless it is packaged inair-tight, vapour-resistant material; for example, plastic bags or trays in conjunction withstretch wraps. To protect frozen meat from rancid and freezer burn, PE bags and PVC orPVDC films are used with expanded polystyrene (EPS) trays that is a foamed form of PSwhich has a very low density but is a rigid material.
In the case of poultry, the skin-tight PVDC film package is adequate; poultry pieces areput into bags and transferred to a rotary vacuumising machine which packages the productwith clip closures and bag neck trimming. When shrunk, the bags form a second skin aroundthe poultry, which are then either frozen in brine or in blast freezers. Water absorption isnegligible and the function of oxygen barrier is sufficient to prevent fats from becomingrancid. Materials used for packaging include PVDC film and a range of laminates with PE.For packaging frozen fish, PVDC is used in vacuum packaging. This system provides abetter alternative to glazing process. It eliminates moisture loss on initial freezing, drip losson thawing, weight loss on glaze, and reduces labour and time needed for traditional glazing.The lightly vacuumised package enables the fish to retain its fresh characteristics throughoutthe entire distribution. Packaging material, such as PET film, is also used for fish productsin pillow pack style. The film is reverse printed on the treated side and laminated with PE.This laminate possesses barrier properties and is puncture-resistant over a wide range oftemperatures, giving protection during transportation (Lee, 2006).
The majority of frozen fruits and vegetables are packaged in plastic films, such asdeep freeze grades of PE, made into pillow-type packs on vertical form-fill-seal machines.

BLUK139-Evans January 23, 2008 17:39
Frozen Storage 245
Vegetables are packaged commonly with LDPE as moisture barriers. Ethylene vinyl acetate(EVA) bags have mechanical resistance for large weights of product with the necessary mois-ture barrier, have good heat-seal properties, and remain flexible at freezer temperatures. Asthe contents of these larger packages are not generally consumed all at once, a reclosablefeature on the package is often used.
Frozen bread is packaged in LDPE bags; for frozen desserts such as ice cream, frozensorbets, mousses, and puddings, thermoformed high-impact polystyrene (HIPS) containersare often used (Lee, 2006).
REFERENCES
Anonymous. (1986). Recommendations for the Processing and handling of frozen foods. International Insti-tute of Refrigeration, IIR, Paris, France.
Anonymous. (1989). EU Directive 89/108 on the Approximations of the laws of the Members States relatedto Quick frozen Foodstuffs for Human Consumption, Brussels, Official Journal, L40 pp. 34–37.
Anonymous. (1992). EU Directive 92/1. Monitoring of Temperatures in the Means of Transport, Warehousingand Storage of Quick Frozen Foods for Human Consumption, Brussels, Official Journal, L34, pp. 28–29.
Bertola, N.C., Califano, A.N., Bevilacqua, A.E. and Zaritzky, N.E (1996). Textural changes and proteoly-sis of low moisture Mozzarella cheese frozen under various conditions. Lebensmittel Wissenschaft undTechnologie 29, 470–474.
Bevilacqua, A.E. and Zaritzky, N.E. (1982). Ice recrystallization in frozen beef. Journal of Food Science 47,1410–1414.
Creed, P. (2006). Quality and Safety of frozen ready meals. In: D.W. Sun, ed. Handbook of Frozen FoodProcessing and Packaging. Boca Raton, FL: CRC/Taylor & Francis Group, pp. 459–476.
Donhowe, D.P. and Hartel, R. (1996). Recrystallization of ice in ice cream during controlled acceleratedstorage. International Dairy Journal 6, 1191–1208.
Erickson, M.C. (1997). Lipid oxidation: flavor and nutritional quality deterioration in frozen food. In: M.C.Erickson and Y.C. Hung, eds. Quality in Frozen Food. New York: Chapman & Hall, pp. 141–173.
Fennema, O.R., Powrie, W.D. and Marth, E.H. (1973). Low Temperature Preservation of Foods and LivingMatter. New York: Marcel Dekker, pp. 3–207.
Fennema, O.R. (1996). Water and ice. In: O. Fennema, ed. Food Chemistry, 3rd edn. New York: MarcelDekker, pp. 17–94.
Ferrero, C., Martino, M. and Zaritzky, N. (1993a). Stability in frozen starch pastes. Effect of freezing, storageand xanthan gum addition. Journal of Food Processing and Preservation 17(3), 191–211.
Ferrero, C., Martino, M. and Zaritzky, N. (1993b). Effect of freezing rate and xanthan gum on the propertiesof corn starch and wheat flour pastes. International Journal Food Science and Technology 28, 481–498.
Ferrero, C., Martino, M. and Zaritzky, N. (1994). Corn starch, xanthan gum interaction and its effect on thestability during storage of frozen gelatinized suspensions. Starch/Starke 46, 300–308.
Ferrero, C., Martino, M. and Zaritzky, N. (1996). Effect of hydrocolloids on starch thermal transitions, asmeasured by DSC. Journal of Thermal Analysis 47, 1247–1266.
Ferrero, C. and Zaritzky, N. (2000). Effect of freezing rate and frozen storage on starch-sucrose-hydrocolloidsystems. Journal of the Science of Food and Agriculture 80, 2149–2158.
Franks, F. (1985). Biophysics and Biochemistry at Low Temperatures. Cambridge: Cambridge UniversityPress, pp. 39–52.
Fu, B. and Labuza, T. (1997). Shelf life testing: procedures and prediction methods. In: M.C. Erickson andY.C. Hung, eds. Quality in Frozen Food. New York: Chapman & Hall, pp. 377–415.
Giannakourou, M.C., Taoukis, P., and Nychas, G.J. (2006). Monitoring and control of cold chain freezing.In: D.W. Sun, ed. Handbook of Frozen Food Processing and Packaging. Boca Raton, FL: CRC/Taylor &Francis Group, pp. 279–307.
Goff, H.D. (1997). Measurement and interpretation of the glass transition in frozen foods. In: M.C. Ericksonand Y.C. Hung, eds. Quality in Frozen Food. New York: Chapman & Hall, pp. 29–50.
Goff, H.D. (2006). Quality and Safety of frozen dairy products. In: D.W. Sun, ed. Handbook of Frozen FoodProcessing and Packaging. Boca Raton, FL: CRC/Taylor & Francis Group, pp. 441–457.
Golden, D.A. and Arroyo-Gallyoun, L. (1997). Relationship of frozen food quality to microbial survival. In:M.C. Erickson and Y.C. Hung, eds. Quality in Frozen Food. New York: Chapman & Hall, pp. 174–193.
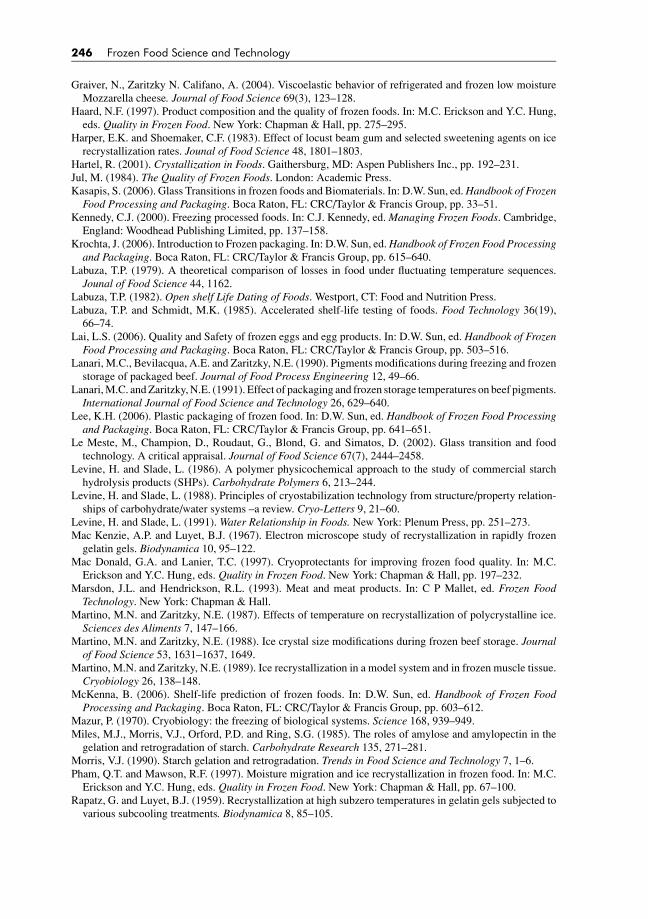
BLUK139-Evans January 23, 2008 17:39
246 Frozen Food Science and Technology
Graiver, N., Zaritzky N. Califano, A. (2004). Viscoelastic behavior of refrigerated and frozen low moistureMozzarella cheese. Journal of Food Science 69(3), 123–128.
Haard, N.F. (1997). Product composition and the quality of frozen foods. In: M.C. Erickson and Y.C. Hung,eds. Quality in Frozen Food. New York: Chapman & Hall, pp. 275–295.
Harper, E.K. and Shoemaker, C.F. (1983). Effect of locust beam gum and selected sweetening agents on icerecrystallization rates. Jounal of Food Science 48, 1801–1803.
Hartel, R. (2001). Crystallization in Foods. Gaithersburg, MD: Aspen Publishers Inc., pp. 192–231.Jul, M. (1984). The Quality of Frozen Foods. London: Academic Press.Kasapis, S. (2006). Glass Transitions in frozen foods and Biomaterials. In: D.W. Sun, ed. Handbook of Frozen
Food Processing and Packaging. Boca Raton, FL: CRC/Taylor & Francis Group, pp. 33–51.Kennedy, C.J. (2000). Freezing processed foods. In: C.J. Kennedy, ed. Managing Frozen Foods. Cambridge,
England: Woodhead Publishing Limited, pp. 137–158.Krochta, J. (2006). Introduction to Frozen packaging. In: D.W. Sun, ed. Handbook of Frozen Food Processing
and Packaging. Boca Raton, FL: CRC/Taylor & Francis Group, pp. 615–640.Labuza, T.P. (1979). A theoretical comparison of losses in food under fluctuating temperature sequences.
Jounal of Food Science 44, 1162.Labuza, T.P. (1982). Open shelf Life Dating of Foods. Westport, CT: Food and Nutrition Press.Labuza, T.P. and Schmidt, M.K. (1985). Accelerated shelf-life testing of foods. Food Technology 36(19),
66–74.Lai, L.S. (2006). Quality and Safety of frozen eggs and egg products. In: D.W. Sun, ed. Handbook of Frozen
Food Processing and Packaging. Boca Raton, FL: CRC/Taylor & Francis Group, pp. 503–516.Lanari, M.C., Bevilacqua, A.E. and Zaritzky, N.E. (1990). Pigments modifications during freezing and frozen
storage of packaged beef. Journal of Food Process Engineering 12, 49–66.Lanari, M.C. and Zaritzky, N.E. (1991). Effect of packaging and frozen storage temperatures on beef pigments.
International Journal of Food Science and Technology 26, 629–640.Lee, K.H. (2006). Plastic packaging of frozen food. In: D.W. Sun, ed. Handbook of Frozen Food Processing
and Packaging. Boca Raton, FL: CRC/Taylor & Francis Group, pp. 641–651.Le Meste, M., Champion, D., Roudaut, G., Blond, G. and Simatos, D. (2002). Glass transition and food
technology. A critical appraisal. Journal of Food Science 67(7), 2444–2458.Levine, H. and Slade, L. (1986). A polymer physicochemical approach to the study of commercial starch
hydrolysis products (SHPs). Carbohydrate Polymers 6, 213–244.Levine, H. and Slade, L. (1988). Principles of cryostabilization technology from structure/property relation-
ships of carbohydrate/water systems –a review. Cryo-Letters 9, 21–60.Levine, H. and Slade, L. (1991). Water Relationship in Foods. New York: Plenum Press, pp. 251–273.Mac Kenzie, A.P. and Luyet, B.J. (1967). Electron microscope study of recrystallization in rapidly frozen
gelatin gels. Biodynamica 10, 95–122.Mac Donald, G.A. and Lanier, T.C. (1997). Cryoprotectants for improving frozen food quality. In: M.C.
Erickson and Y.C. Hung, eds. Quality in Frozen Food. New York: Chapman & Hall, pp. 197–232.Marsdon, J.L. and Hendrickson, R.L. (1993). Meat and meat products. In: C P Mallet, ed. Frozen Food
Technology. New York: Chapman & Hall.Martino, M.N. and Zaritzky, N.E. (1987). Effects of temperature on recrystallization of polycrystalline ice.
Sciences des Aliments 7, 147–166.Martino, M.N. and Zaritzky, N.E. (1988). Ice crystal size modifications during frozen beef storage. Journal
of Food Science 53, 1631–1637, 1649.Martino, M.N. and Zaritzky, N.E. (1989). Ice recrystallization in a model system and in frozen muscle tissue.
Cryobiology 26, 138–148.McKenna, B. (2006). Shelf-life prediction of frozen foods. In: D.W. Sun, ed. Handbook of Frozen Food
Processing and Packaging. Boca Raton, FL: CRC/Taylor & Francis Group, pp. 603–612.Mazur, P. (1970). Cryobiology: the freezing of biological systems. Science 168, 939–949.Miles, M.J., Morris, V.J., Orford, P.D. and Ring, S.G. (1985). The roles of amylose and amylopectin in the
gelation and retrogradation of starch. Carbohydrate Research 135, 271–281.Morris, V.J. (1990). Starch gelation and retrogradation. Trends in Food Science and Technology 7, 1–6.Pham, Q.T. and Mawson, R.F. (1997). Moisture migration and ice recrystallization in frozen food. In: M.C.
Erickson and Y.C. Hung, eds. Quality in Frozen Food. New York: Chapman & Hall, pp. 67–100.Rapatz, G. and Luyet, B.J. (1959). Recrystallization at high subzero temperatures in gelatin gels subjected to
various subcooling treatments. Biodynamica 8, 85–105.
BLUK139-Evans January 23, 2008 17:39
Frozen Storage 247
Reid, D.S., Kotte, K., Kilmartin, P. and Young, M. (2003). A new method for accelerated shelf-life predictionfor frozen foods. Journal of the Science of Food and Agriculture 83(10), 1018–1021.
Regand, A. and Goff, H.D. (2003). Structure and ice recrystallization in frozen stabilized ice cream modelsolutions. Food Hydrocolloids 17, 95–102.
Reid, D.S. (1983). Fundamental physicochemical aspects of food freezing. Food Technology 37, 110–115.Reid, D.S. (1994). Basic physical phenomena in the freezing and thawing of plant and animal tissue. In: C.P.
Mallet, ed. Frozen Food Technology. Glasgow: Blackie Academic and Professional, pp. 1–19.Reid, D.S. (1997). Overview of physical/chemical aspects of freezing. In: M.C. Erickson and Y.C. Hung, eds.
Quality in Frozen Food. New York: Chapman & Hall, pp. 10–28.Reid, D.S., Alviar, M.S. and Lim M.H. (1987). The rates of change of ice crystal size in model systems stored
at different temperatures relevant to the storage of frozen food. In: Proceedings of the XVI InternationalCongress of Refrigeration, Austria. Vol. C. pp. 397–401.
Rodrıguez, N. and Zaritzky, N.E. (1983). Development of a time-temperature integrator-indicator for frozenbeef. Journal of Food Science 48, 1526–1531.
Roos, Y. (1995). Phase Transitions in Foods. Food Science and Technology International Series. AcademicPress.
Roos, Y. and Karel, M. (1991a). Non-equilibrium ice formation in carbohydrate solutions. Cryo-Letters 12,367–376.
Roos, Y. and Karel, M. (1991b). Applying state diagrams to food processing and development. Food Tecnology45, 6668–71107.
Roos, Y. and Karel, M. (1991c). Amorphous and delayed ice formation in sucrose solutions. InternationalJournal of Food Science and Technology 26, 553–566.
Sista, R.V., Erickson, M.C. and Shewfelt, R.L. (1997). Quality deterioration in frozen foods associated withhydrolytic enzyme activities. In: M.C. Erickson and Y.C. Hung, eds. Quality in Frozen Food. New York:Chapman & Hall, pp. 101–110.
Slade, L. and Levine, H. (1991). Beyond water activity: recent advances based on an alternative approach tothe assessment of food quality and safety. Critical Reviews in Food Science and Nutrition 30, 115–360.
Slade, L. and Levine, H. (1995). Glass transitions and water-food structure interactions. In: J.E. Kinsella, andS.L. Taylor, eds. Advances in Food Nutrition Research, Vol. 38. San Diego: Academic Press, pp. 103–269.
Sutton, R.L., Lips, A., Piccirillo, G. and Sztehlo, A. (1996). Kinetics of ice recrystallization in aqueousfructose solutions. Journal of Food Science 61(4), 741–745.
Sutton, R.L., Lips, A. and Piccirillo, G. (1996). Recrystallization in aqueous fructose solutions as affected bylocust bean gum. Journal of Food Science 61(4), 746–748.
Van Arsdel, W.B., Copley, M.J. and Olson, R.L. (1969). Quality and Stability of Frozen Foods Time-Temperature-Tolerance and its Significance. New York: Wiley Interscience.
Velasco, P.J., Lim, M.H., Pangborn, R.M. and Whitaker J.R. (1989). Enzymes responsible for off-flavor andoff-aroma in blanched and frozen-stored vegetables. Biotechnology and Applied Biochemistry 11, 118–127.
Wagner, J.R. and Anon, M.C. (1986). Effect of frozen storage on protein denaturation in bovine muscle I:Myofibrillar ATPase activity and differential scanning calorimetric studies. Journal of Food Technology21, 9–18.
Wiliams, D.C., Lim, M.H., Chen, A.O., Pangborn, R.M. and Whitaker J.R. (1986). Blanching of vegetablesfor freezing- which indicator enzyme to choose. Food Technology 40, 130–140.
Xiong, Y.L. (1997). Protein denaturation and functionality losses. In: M.C. Erickson and Y.C. Hung, eds.Quality in Frozen Food. New York: Chapman & Hall, pp. 111–140.
Yamamoto, K. (1990). Electron microscopy of thermal aggregation of myosin. Journal of Biochemistry108(6), 896–898.
Zaritzky, N.E. (1982). Mathematical simulation of the thermal behavior of frozen meat during its storage anddistribution. Journal of Food Process Engineering 6, 15–36.
Zaritzky, N. (2000). Factors affecting the stability of frozen foods. In: C.J. Kennedy, ed. Managing FrozenFoods. Cambridge, England: Woodhead Publishing Limited, pp. 111–133.
Zaritzky, N. (2006). Physical–chemical principles in freezing. In: D.W. Sun, ed. Handbook of Frozen FoodProcessing and Packaging. Boca Raton, FL: CRC/Taylor & Francis Group, pp. 3–33.
Zaritzky, N.E. and Ferrero, C. (2006). Glass transition and rheological behavior in forzen starch-sucrose-hydrocolloids systems. In: P. Buera, J. Welti Chanes, P. Lillford and H. Corti eds. Water Properties ofFood, Pharmaceutical and Biological Material. Boca Raton, FL: CRC Press, Taylor and Francis Group,pp. 309–324.

BLUK139-Evans January 23, 2008 17:42
12 Freeze Drying
Andy Stapley
12.1 INTRODUCTION
Drying, like freezing, is primarily a method of food preservation, and is also one of the oldestmethods of food preservation. An advantage of drying over freezing is that the dried productis shelf stable and thus generally requires only a sealed container to keep it for months oreven years at ambient temperature. Refrigeration, on the other hand, requires a power supply,which if interrupted can jeopardise the safety and quality of the product. A further advantageof drying is that the removal of water reduces the weight and volume of the product, which aidsstorage and transport. The main disadvantage of drying, however, is that the product quality(resemblance to the original undried product) is generally not as high upon rehydration asfrozen foods are upon thawing. Particular problems are changes in texture (for solid foods)and the loss of aromas.
Most drying processes involve the evaporation of liquid water to water vapour, but freezedrying instead occurs as a result of sublimation of ice directly to water vapour. The basicsteps in a freeze drying process are briefly described as follows, and these will be examinedin more detail in the rest of the chapter.
(i) The food is first frozen (usually on trays) which results in the formation of ice crystalswithin the food and the non-ice phase becoming freeze concentrated.
(ii) The frozen material is then exposed to a headspace with a partial pressure of water vapourwell below the equilibrium vapour pressure of ice at the temperature of the material (seeFig. 12.1). This causes the sublimation of the ice crystals (primary sublimation) and alsodesorption of non-crystalline water present within the food matrix (secondary drying).The very low partial pressure of water vapour in the headspace is generally achievedby placing a condenser unit in close proximity to the food. The temperature of thecondenser surface should be significantly lower than that of the drying material (typically−60◦C)
(iii) In conventional freeze drying a vacuum is maintained in the freeze drying chamber,typically via the use of a vacuum pump. A common misconception is that the primarypurpose for the vacuum pump is to remove water vapour. However, water removal isachieved far more effectively by the condenser. The vacuum pump is instead mainlyused to remove air (and other non-condensable gases desorbed from the food) from thechamber. The reason is that the gases slow down the rate of transfer of water vapourfrom the food to the condenser.
Frozen Food Science and Technology. Edited by Judith A. Evans
© 2008 Blackwell Publishing Ltd, ISBN: 978-1-4051-5478-9
BLUK139-Evans January 23, 2008 17:42
Freeze Drying 249
1
10
100
1,000
10,000
100,000
−60 −40 −20 0 20 40 60 80 100
Pre
ssur
e (P
a)(lo
g sc
ale)
Temperature (°C)
ICE
VAPOUR
LIQUID
Triple point
Equilibriumor saturation lines
Fig. 12.1 Phase diagram of water showing the variation of equilibrium vapour pressure of water withtemperature. At temperatures below the triple point pure water exists as solid ice.
(iv) As sublimation is an endothermic process, heat must be applied to the frozen food tosustain the sublimation process. However, the temperature of the food must always bemaintained below its ‘collapse’ temperature (which is related to the glass transitiontemperature). Not only must the ice crystals not melt, but also the frozen food matrixmust maintain rigidity if a properly freeze dried food is to be obtained. The collapsetemperature is not constant, but rises as the moisture content in the food matrix is reduced.
If the process is performed correctly then the resulting freeze dried product will have thefollowing attributes:
(i) For a sufficiently dried product the collapse temperature will have risen far above ambienttemperature. The product will therefore have a rigid structure at ambient temperatureand be shelf stable.
(ii) If the sample has been consistently maintained below the collapse temperature through-out drying then the ice crystals will leave behind voids (which the crystals once occupied)as they sublime. This results in a highly porous structure with excellent rehydration prop-erties as the water is sucked into the pores by capillary action on wetting. This enablesrelatively large objects such as meat steaks to be rehydrated more successfully than thosedried using other methods. The presence of pores also speeds the sublimation process(see Section 12.2.3) by providing easy routes for water vapour to escape the solid.
(iii) Freeze dried products are maintained at much lower temperatures than other dryingprocesses. Reactions associated with the much higher temperatures that occur in otherdrying processes (such as the Maillard browning reaction) therefore do not occur to sucha large extent in freeze drying.
(iv) Freeze drying is also good at retaining volatile flavour and aroma compounds in com-parison to high-temperature drying processes.
(v) The formation of ice crystals during the freezing step can be problematic in materialswhich already possess a microstructure. This is a particular problem for cellular materialsuch as plants and meat, but can be minimised by fast freezing, which produces smallcrystals.

BLUK139-Evans January 23, 2008 17:42
(a)
(c)
(b)
(d)
(g)
(i)
(h)
(e) (f)
Fig. 12.2 Examples of freeze dried foods. (a) coffee, (b) prawns, (c) chicken, (d) peach, (e) strawberry,(f) cranberry, (g) raspberries, (h) chives, (i) tarragon. Pictures (d), (e), (f) and (g) reproduced by kind per-mission of Molda AG.
250

BLUK139-Evans January 23, 2008 17:42
Freeze Drying 251
Notwithstanding, the overall quality of freeze dried produce is usually superior to that ofother dried foods for reasons (ii), (iii) and (iv). Almost any moisture-containing food can befreeze dried, including meat, fruits, vegetables and beverages. However, freeze dried productsare usually more expensive than those obtained from other techniques for the followingreasons:
(i) The drying chamber must be designed for vacuum operation. The main issues are struc-tural strength (to resist buckling) and the avoidance of air leaks into the system (whichbrings undesired humidity as well as gas into the chamber).
(ii) The condenser presents a heavy refrigeration burden as it typically operates in the rangebetween −40◦C and −60◦C, and must extract the same amount of heat in condensationfrom the condenser coils as that which is provided by heating to sublime the ice fromthe food. The food must also first be frozen which also incurs an energy cost.
(iii) Freeze drying is a slow process, taking many hours. This requires very large-scaleequipment in order to produce acceptable throughput for bulk food manufacture.
Consequently, both the capital and operating costs of freeze dryers are high. So althoughalmost any moisture-containing food can be freeze dried, it is generally only niche foodsthat are freeze dried on a commercial basis. The most widespread examples include (seeFig. 12.2):
(i) Freeze dried tea and coffee. Coffee is by far the most widely sold freeze driedproduct.
(ii) Freeze dried meat and vegetables are popular in mountaineering, camping, military andastronaut rations and other ‘instant’ meals which are readily prepared by the simpleaddition of boiling water.
(iii) Freeze dried fruits such as strawberries, cranberries and raspberries are an increasinglypopular additive to breakfast cereals where milk is added.
(iv) Freeze dried herbs.(v) Freeze dried pet food for dogs (meat), for cats (fish) and for fish (krill, worms).
In all these examples it can be noted that the freeze dried produce is more convenient to storeor carry than the equivalent fresh or frozen produce, and this in many instances compensatesfor any reduction in quality.
12.2 THE FOOD MATERIAL SCIENCE OF FREEZE DRYING
In order to appreciate the requirements of a freeze drying process, it is important to understandhow the freezing and drying environments affect the food material. Perhaps the most importantconcept, which is key to sample collapse, is that of the glass transition.
12.2.1 The glass transition
The glass transition is a highly useful concept in understanding the behaviour of a widevariety of food materials. It was first used by (synthetic) polymer scientists to describe therelatively sudden change in mechanical properties of amorphous (non-crystalline) polymersfrom a hard, brittle, ‘glassy’ state to a soft ‘rubbery’ material as they are heated over a

BLUK139-Evans January 23, 2008 17:42
252 Frozen Food Science and Technology
matter of only a few degrees Celsius. The change is fundamentally different to melting inthat there is no enthalpy or volume change (as occurs when crystals melt) and that it onlyoccurs in amorphous materials. The change nevertheless corresponds to a substantial increasein the mobility of molecules, which are almost immobile in the glassy state. The mid-pointaround which the change in properties occurs is commonly referred to as the glass transitiontemperature (Tg), although it is important to remember that the change in properties spans asmall temperature range of approximately 10–20 K (Roos and Karel, 1991). The concept ofa glass transition was not generally used in food science or food processing circles until the1980s and 1990s, upon when it was extensively disseminated.
The glass transition has now been observed in a wide range of amorphous food materialsincluding sugars as well as food polymers such as proteins and starch. Many food materialsare also able to crystallise but this does not tend to occur in freeze drying (for reasons seeSection 12.2.2.1).
The glass transition temperature depends strongly on molecular weight, so, for example,dry starch has a Tg of 220◦C whereas sucrose has a Tg of 62◦C (Roos, 1997). Amorphouswater (which is extremely difficult to produce without forming ice crystals instead) has aTg of around −135◦C. When food materials are combined such that they are in contact ona molecular level (such as in a solution) the glass transition of the resulting mixture canbe correlated by the Gordon–Taylor equation (Gordon and Taylor, 1952) which calculates aweighted average Tg from the individual components according to their mole fractions andan empirically determined constant (here denoted by κ):
Tg = w1Tg1+ κw2Tg2
w1 + κw2
(12.1)
Thus, when small molecules are mixed with larger molecules they depress the apparentglass transition temperature of the larger molecule. The small molecules are said to act as‘plasticisers’. The most effective plasticiser by far in food processing is water which, due toits low Tg value, is able to cause very significant reductions in Tg when mixed with othermaterials. Water is also, of course, virtually ubiquitous in food formulations. The loweringof Tg by the addition of water to a substance explains why moist foods are generally softer intexture than dry foods (e.g. cooked rice versus uncooked rice grains, fresh bread versus drybread, chewy sweets versus hard sweets).
In freeze drying the main requirement is to maintain the product in the glassy state (i.e.below the glass transition temperature) during the whole of the drying period. However,in order to fully understand what occurs in freeze drying it is necessary to also considerthe role of ice formation. Both processes are best understood with reference to a statediagram.
12.2.2 The use of state diagrams
The state diagram for an example system of sucrose and water system is shown in Fig. 12.3(Roos and Karel, 1991; Roos, 1997). It shows how the following vary with composition:
(i) The glass transition temperature.(ii) The equilibrium melting temperature of ice below which ice is stable. Note that this falls
below 0◦C as the sucrose concentration increases due to freezing point depression.

BLUK139-Evans January 23, 2008 17:42
Freeze Drying 253
−140
−120
−100
−80
−60
−40
−20
0
20
40
60
80
0 0.2 0.4 0.6 0.8 1Sucrose content (wt%)
Tem
pera
ture
(°C
)
T 'm
T 'g
C'g
Sucrosesolubility line
Ice melting line
Glass transition line
a
bb i
c
d
Ice crystals +freeze concentrated solution
Glassy state
Sucrosecrystalsstable
Solution phase
ci
Fig. 12.3 State diagram of sucrose solution (after Roos, 1997). A typical path of a 20% sucrose solutionundergoing freezing ((a) to (c)) followed by freeze drying ((c) to (d)) is shown by the dotted line.
(iii) There is also an equilibrium saturation line for sucrose crystals, to the right of whichsucrose crystals are stable.
Similar diagrams can also be drawn for most food materials, including multi-component foodsystems, if all the non-aqueous components are treated as a single ‘lumped’ component for thepurpose of using the Gordon–Taylor equation. This has been applied to fruits, which containmixtures of cellular pulp, ascorbic and citric acids and various sugars (da Silva et al., 2006),and tuna (Rahman et al., 2003). Although the glass transition line may differ significantlyfor different materials (due to the different Tg of the dry material), the equilibrium meltingline will not vary substantially.
The entire freeze drying process can be followed on this diagram. As an example take asa starting material a 20% sucrose solution at room temperature (at position marked ‘a’ onthe chart).
12.2.2.1 Freezing
Removing heat from the solution initially causes it to cool to ‘b’, at a few degrees belowthe equilibrium melting line. A few degrees of sub-cooling is required to initiate nucleationand crystallisation of ice crystals (‘bi’). The formation of an ice phase depletes water fromthe solution phase, which consequently becomes more concentrated with respect to sucrose.The solution phase thus now moves in the direction of ‘c’ on the chart. Due to the freezingpoint depression effect the temperature required to maintain ice formation declines steadily,and the solution becomes increasingly viscous as it becomes more concentrated. As thesolution approaches the glass transition line at ‘c’ the solution becomes so viscous that icecrystallisation ceases and the composition of the viscous solution is now temporarily fixed
BLUK139-Evans January 23, 2008 17:42
254 Frozen Food Science and Technology
at C ′g. The ice phase will be at the same temperature at ci. This is the end of the freezing
stage.Point ‘c’ is known as the maximally freeze concentrated solution, as it is not possible to
freeze concentrate further. There are a number of points to be made here:
(i) To ensure the maximum degree of freeze concentration, the solution must be held be-tween T ′
m and T ′g. At temperatures higher than T ′
m freeze concentration will cease at alower concentration due to insufficient sub-cooling. At temperatures lower than T ′
g thereis a risk that freeze concentration will cease when the glass transition is met at a lowerconcentration. However, if the temperature is again raised to the optimal temperaturezone then the solution can be ‘annealed’ to rectify this.
(ii) Assuming the temperature is held between T ′m and T ′
g, the maximum concentration ofthe freeze concentrated phase (C ′
g) is independent of the starting composition. However,the starting composition will determine the proportion of ice that can be formed, whichcan be calculated by a simple mass balance assuming a value of C ′
g.(iii) The state diagram suggests that sucrose crystals can form at the eutectic point. However,
as the crystallisation kinetics of sucrose are much slower than that of water, there isgenerally not sufficient time during the freezing process for sucrose crystallisation tooccur. As the rest of the freeze drying process and subsequent storage take place in theglassy state, there is no further opportunity for sucrose to crystallise, and for this reasonfreeze drying is a popular method of producing food stuffs in the amorphous state (Roos,1997).
12.2.2.2 Freeze drying
Once the solution has been maximally frozen, the freeze drying process can begin by exposingthe sample to a low vapour pressure headspace. This results in the sublimation of the pure icecrystals (known as primary drying) and desorption of water from the glassy phase (secondarydrying) via exposed surfaces of the matrix. If the freeze concentrated solution is kept below theglass transition temperature then the sublimation of ice crystals leaves behind pores withinthe rigid structure, which increases the surface area for secondary drying. As the freezeconcentrated phase undergoes secondary drying it is able to rise to a higher temperaturewithout collapse occurring as the glass transition temperature rises. Therefore a trajectorysuch as from ‘c’ to ‘d’ can be followed.
The sublimation process requires heat for the sample to maintain its temperature. Heattransfer to the sample is thus an important aspect of freeze dryer design.
12.2.3 Importance of the freezing step
The crystallisation of water to form pure ice crystals is a two-step process, requiring crystals tofirst nucleate and then grow. Both nucleation and growth processes require the solution to besupercooled below the equilibrium melting temperature of the aqueous solution by typically atleast a couple of degrees Celsius. The rate of nucleation (the rate of formation of new crystalsper unit volume) generally increases exponentially with the degree of supercooling, whereasthe growth of crystals (the rate of increase in size) tends to increase in a less dramatic, linearfashion. Thus, as the temperature falls and the degree of supercooling increases, the nucleationrate increases more rapidly than the growth rate. Therefore slow cooling rates (which produces

BLUK139-Evans January 23, 2008 17:42
Freeze Drying 255
low supercooling) tend to favour growth and results in a small number of large crystals. Onthe other hand high cooling rates (equals high supercooling) tend to favour nucleation, whichproduces a larger number of smaller crystals (Oetjen, 1999; Rothmayr, 1975).
When cooling any object, however, the fastest rates of cooling invariably occur at thesurface and the slowest rates in the centre. Thus, smaller crystals are generally found at thesurface and larger crystals in the interior.
The freezing stage, being the first stage, is critical to the overall success of the freezedrying process, for the following reasons:
(i) The sizes, shapes and distribution of crystals within the food as it freezes, translatedirectly into the sizes, shapes and distribution of pores in the final product. This not onlyaffects the rehydration behaviour and appearance of the freeze dried product, but alsothe density.
(ii) Achievement of a connected network of crystals greatly assists the freeze drying process,as this results in a relatively easy path for water molecules to escape from the inside ofthe food through the pore network that takes its place. Achieving of a connected networkof crystals generally requires a high water content in the initial feed (of around 80%).Thus, paradoxically, it can be faster to freeze-dry a product where the liquid feed hasa higher initial moisture content (and is able to form a pore network) than one with alower moisture content (where a network is not formed) and water is forced, in part, todiffuse through the food matrix. For a given material it is usually also found that slowercooling leading to larger crystals is more conducive to a connected network and fasterfreeze drying (Kochs et al., 1993).
(iii) As mentioned earlier, small crystals must be produced if cellular material is to be freezedried, to avoid rupture of cell walls. This overrides drying rate considerations for suchfoods.
12.3 EQUIPMENT AND OPERATION
12.3.1 Introduction
12.3.1.1 Freezing
The general principles of freezing are outlined in other chapters in this book and these alsoapply here. In most instances the food is frozen on trays, either by contacting the tray with acooled support surface, contacting the food with a cryogenic liquid (such as liquid nitrogen),or by air-blast freezing. There is generally a conductive resistance within the food, whichlimits the transport of heat from the food. In some freeze drying processes the trays areribbed or finned to increase heat transfer rates in both freezing and freeze drying stages. Therate of freezing is important in determining ice crystal size, shape and distribution, whichhas important ramifications for damage to cells and the pore structure of the freeze driedproduct.
Freeze drying of beverages is generally performed from a concentrated solution which ispreviously prepared either by vacuum evaporation or by freeze concentration. In the com-mercial freeze drying of coffee a concentrated solution of typically 40% solids is used forfreeze drying. This results in a relatively small fraction of ice forming but porosity is instead
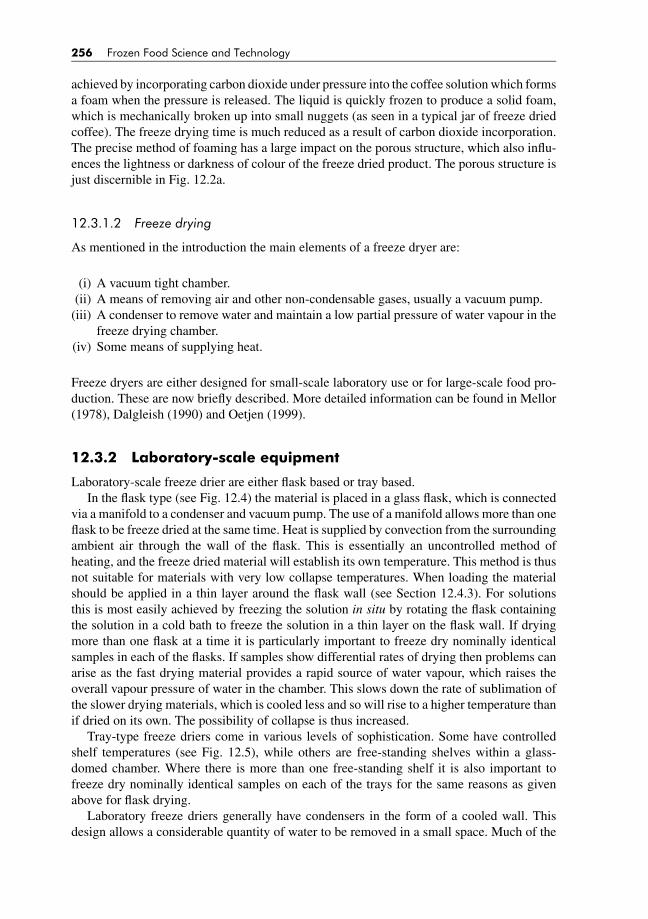
BLUK139-Evans January 23, 2008 17:42
256 Frozen Food Science and Technology
achieved by incorporating carbon dioxide under pressure into the coffee solution which formsa foam when the pressure is released. The liquid is quickly frozen to produce a solid foam,which is mechanically broken up into small nuggets (as seen in a typical jar of freeze driedcoffee). The freeze drying time is much reduced as a result of carbon dioxide incorporation.The precise method of foaming has a large impact on the porous structure, which also influ-ences the lightness or darkness of colour of the freeze dried product. The porous structure isjust discernible in Fig. 12.2a.
12.3.1.2 Freeze drying
As mentioned in the introduction the main elements of a freeze dryer are:
(i) A vacuum tight chamber.(ii) A means of removing air and other non-condensable gases, usually a vacuum pump.
(iii) A condenser to remove water and maintain a low partial pressure of water vapour in thefreeze drying chamber.
(iv) Some means of supplying heat.
Freeze dryers are either designed for small-scale laboratory use or for large-scale food pro-duction. These are now briefly described. More detailed information can be found in Mellor(1978), Dalgleish (1990) and Oetjen (1999).
12.3.2 Laboratory-scale equipment
Laboratory-scale freeze drier are either flask based or tray based.In the flask type (see Fig. 12.4) the material is placed in a glass flask, which is connected
via a manifold to a condenser and vacuum pump. The use of a manifold allows more than oneflask to be freeze dried at the same time. Heat is supplied by convection from the surroundingambient air through the wall of the flask. This is essentially an uncontrolled method ofheating, and the freeze dried material will establish its own temperature. This method is thusnot suitable for materials with very low collapse temperatures. When loading the materialshould be applied in a thin layer around the flask wall (see Section 12.4.3). For solutionsthis is most easily achieved by freezing the solution in situ by rotating the flask containingthe solution in a cold bath to freeze the solution in a thin layer on the flask wall. If dryingmore than one flask at a time it is particularly important to freeze dry nominally identicalsamples in each of the flasks. If samples show differential rates of drying then problems canarise as the fast drying material provides a rapid source of water vapour, which raises theoverall vapour pressure of water in the chamber. This slows down the rate of sublimation ofthe slower drying materials, which is cooled less and so will rise to a higher temperature thanif dried on its own. The possibility of collapse is thus increased.
Tray-type freeze driers come in various levels of sophistication. Some have controlledshelf temperatures (see Fig. 12.5), while others are free-standing shelves within a glass-domed chamber. Where there is more than one free-standing shelf it is also important tofreeze dry nominally identical samples on each of the trays for the same reasons as givenabove for flask drying.
Laboratory freeze driers generally have condensers in the form of a cooled wall. Thisdesign allows a considerable quantity of water to be removed in a small space. Much of the
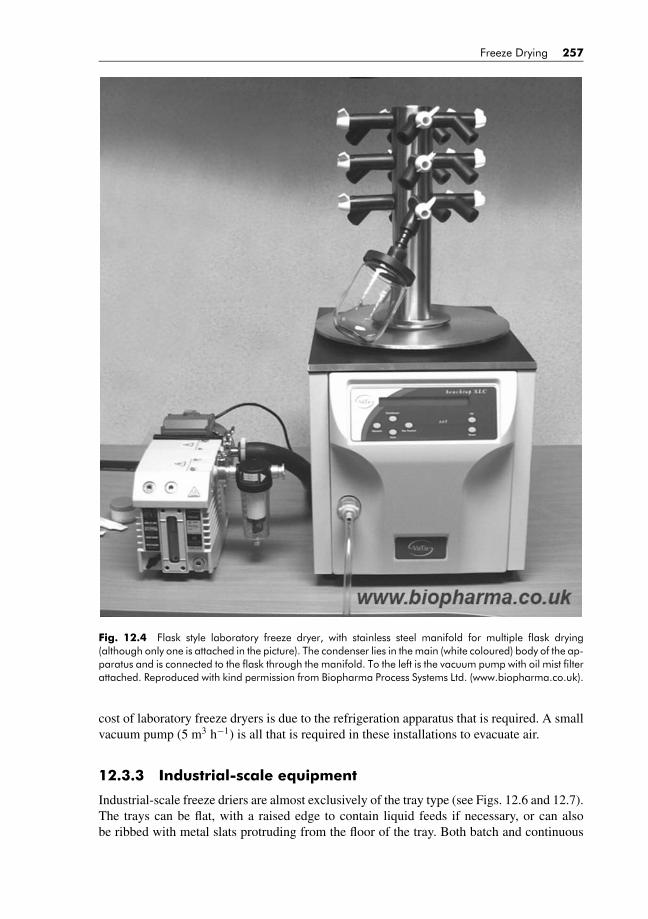
BLUK139-Evans January 23, 2008 17:42
Freeze Drying 257
Fig. 12.4 Flask style laboratory freeze dryer, with stainless steel manifold for multiple flask drying(although only one is attached in the picture). The condenser lies in the main (white coloured) body of the ap-paratus and is connected to the flask through the manifold. To the left is the vacuum pump with oil mist filterattached. Reproduced with kind permission from Biopharma Process Systems Ltd. (www.biopharma.co.uk).
cost of laboratory freeze dryers is due to the refrigeration apparatus that is required. A smallvacuum pump (5 m3 h−1) is all that is required in these installations to evacuate air.
12.3.3 Industrial-scale equipment
Industrial-scale freeze driers are almost exclusively of the tray type (see Figs. 12.6 and 12.7).The trays can be flat, with a raised edge to contain liquid feeds if necessary, or can alsobe ribbed with metal slats protruding from the floor of the tray. Both batch and continuous
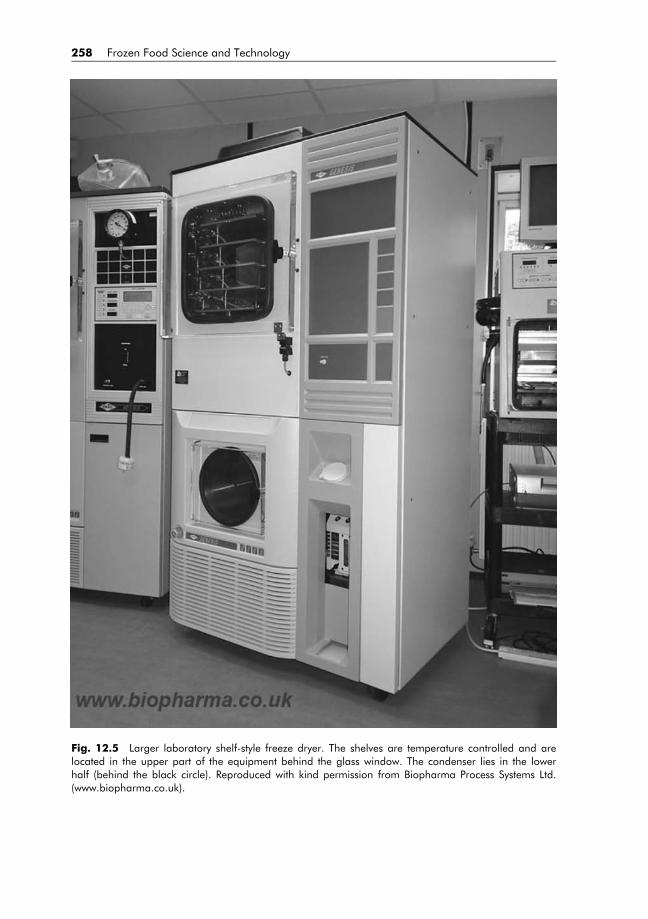
BLUK139-Evans January 23, 2008 17:42
258 Frozen Food Science and Technology
Fig. 12.5 Larger laboratory shelf-style freeze dryer. The shelves are temperature controlled and arelocated in the upper part of the equipment behind the glass window. The condenser lies in the lowerhalf (behind the black circle). Reproduced with kind permission from Biopharma Process Systems Ltd.(www.biopharma.co.uk).
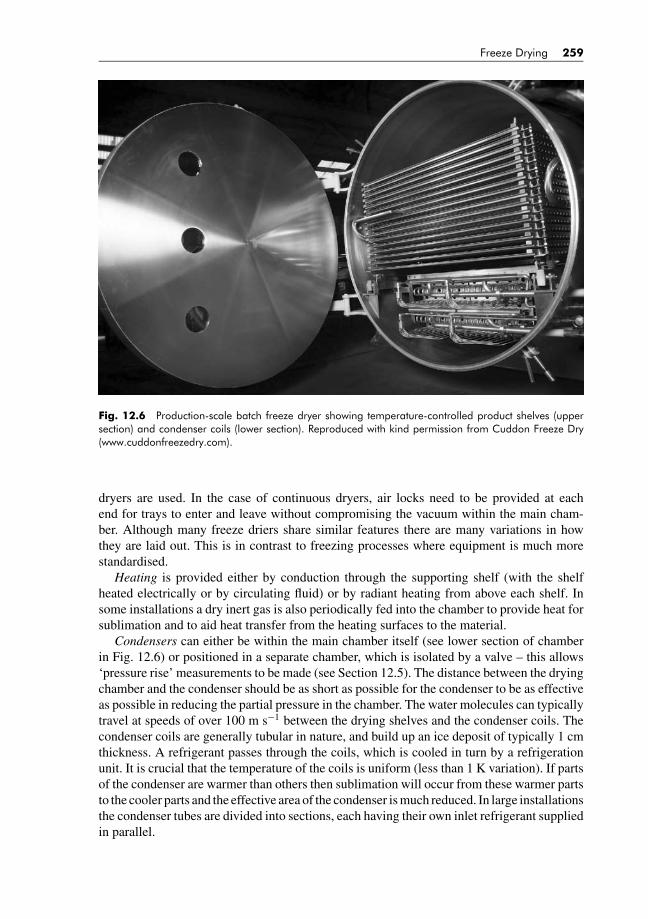
BLUK139-Evans January 23, 2008 17:42
Freeze Drying 259
Fig. 12.6 Production-scale batch freeze dryer showing temperature-controlled product shelves (uppersection) and condenser coils (lower section). Reproduced with kind permission from Cuddon Freeze Dry(www.cuddonfreezedry.com).
dryers are used. In the case of continuous dryers, air locks need to be provided at eachend for trays to enter and leave without compromising the vacuum within the main cham-ber. Although many freeze driers share similar features there are many variations in howthey are laid out. This is in contrast to freezing processes where equipment is much morestandardised.
Heating is provided either by conduction through the supporting shelf (with the shelfheated electrically or by circulating fluid) or by radiant heating from above each shelf. Insome installations a dry inert gas is also periodically fed into the chamber to provide heat forsublimation and to aid heat transfer from the heating surfaces to the material.
Condensers can either be within the main chamber itself (see lower section of chamberin Fig. 12.6) or positioned in a separate chamber, which is isolated by a valve – this allows‘pressure rise’ measurements to be made (see Section 12.5). The distance between the dryingchamber and the condenser should be as short as possible for the condenser to be as effectiveas possible in reducing the partial pressure in the chamber. The water molecules can typicallytravel at speeds of over 100 m s−1 between the drying shelves and the condenser coils. Thecondenser coils are generally tubular in nature, and build up an ice deposit of typically 1 cmthickness. A refrigerant passes through the coils, which is cooled in turn by a refrigerationunit. It is crucial that the temperature of the coils is uniform (less than 1 K variation). If partsof the condenser are warmer than others then sublimation will occur from these warmer partsto the cooler parts and the effective area of the condenser is much reduced. In large installationsthe condenser tubes are divided into sections, each having their own inlet refrigerant suppliedin parallel.
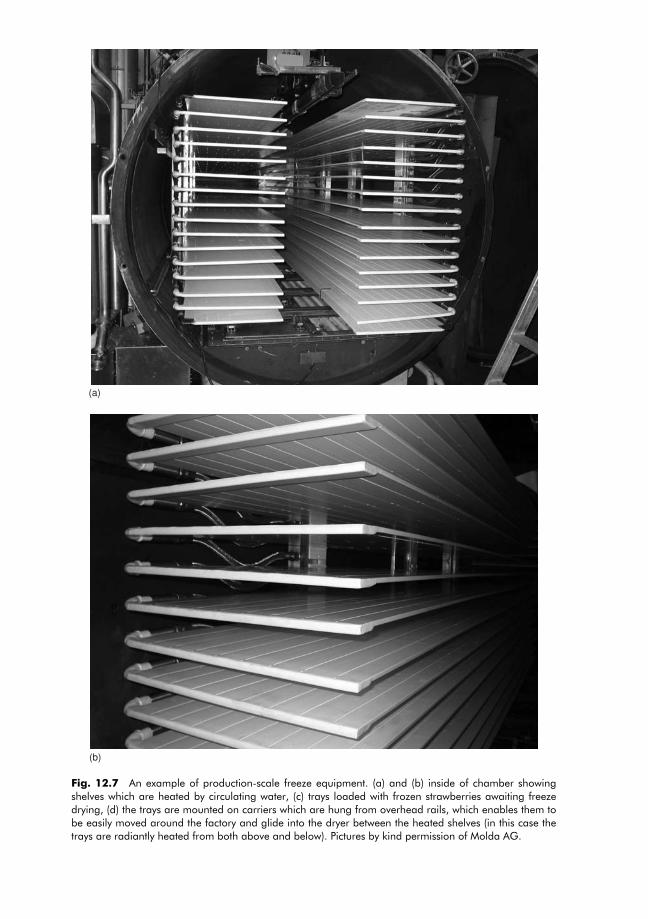
BLUK139-Evans January 23, 2008 17:42
(a)
(b)
Fig. 12.7 An example of production-scale freeze equipment. (a) and (b) inside of chamber showingshelves which are heated by circulating water, (c) trays loaded with frozen strawberries awaiting freezedrying, (d) the trays are mounted on carriers which are hung from overhead rails, which enables them tobe easily moved around the factory and glide into the dryer between the heated shelves (in this case thetrays are radiantly heated from both above and below). Pictures by kind permission of Molda AG.
260
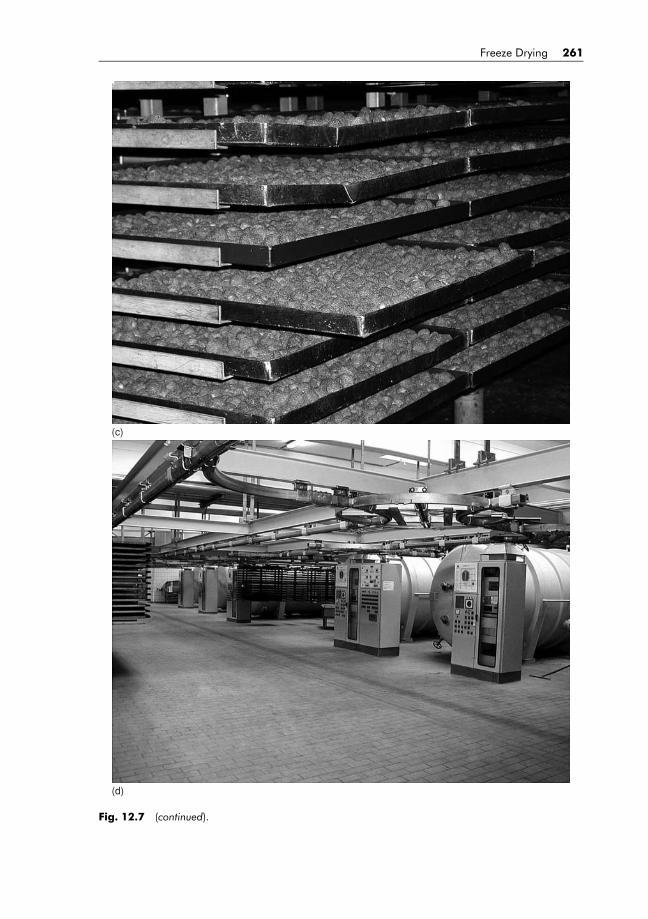
BLUK139-Evans January 23, 2008 17:42
Freeze Drying 261
(c)
(d)
Fig. 12.7 (continued).
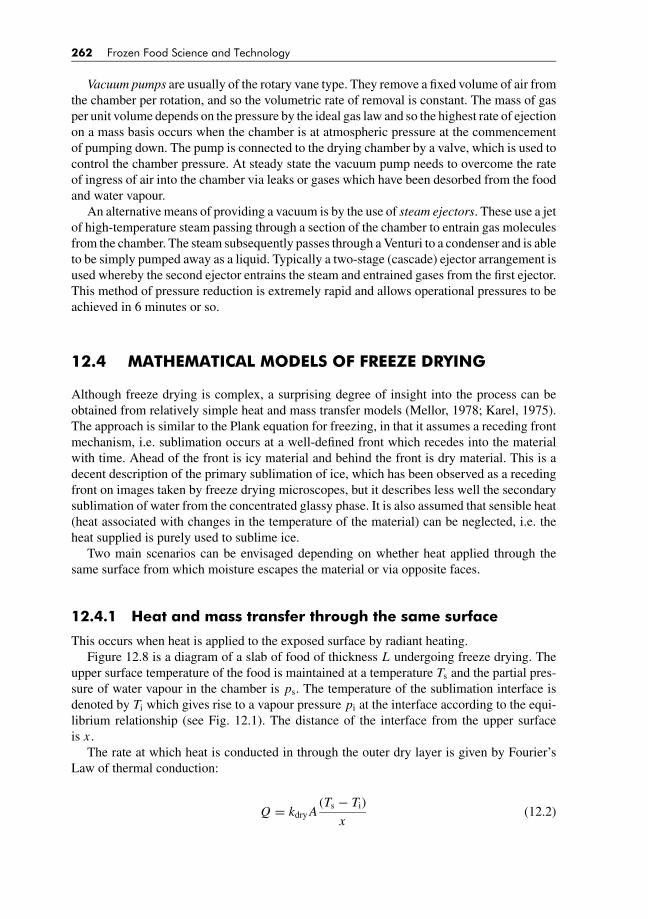
BLUK139-Evans January 23, 2008 17:42
262 Frozen Food Science and Technology
Vacuum pumps are usually of the rotary vane type. They remove a fixed volume of air fromthe chamber per rotation, and so the volumetric rate of removal is constant. The mass of gasper unit volume depends on the pressure by the ideal gas law and so the highest rate of ejectionon a mass basis occurs when the chamber is at atmospheric pressure at the commencementof pumping down. The pump is connected to the drying chamber by a valve, which is used tocontrol the chamber pressure. At steady state the vacuum pump needs to overcome the rateof ingress of air into the chamber via leaks or gases which have been desorbed from the foodand water vapour.
An alternative means of providing a vacuum is by the use of steam ejectors. These use a jetof high-temperature steam passing through a section of the chamber to entrain gas moleculesfrom the chamber. The steam subsequently passes through a Venturi to a condenser and is ableto be simply pumped away as a liquid. Typically a two-stage (cascade) ejector arrangement isused whereby the second ejector entrains the steam and entrained gases from the first ejector.This method of pressure reduction is extremely rapid and allows operational pressures to beachieved in 6 minutes or so.
12.4 MATHEMATICAL MODELS OF FREEZE DRYING
Although freeze drying is complex, a surprising degree of insight into the process can beobtained from relatively simple heat and mass transfer models (Mellor, 1978; Karel, 1975).The approach is similar to the Plank equation for freezing, in that it assumes a receding frontmechanism, i.e. sublimation occurs at a well-defined front which recedes into the materialwith time. Ahead of the front is icy material and behind the front is dry material. This is adecent description of the primary sublimation of ice, which has been observed as a recedingfront on images taken by freeze drying microscopes, but it describes less well the secondarysublimation of water from the concentrated glassy phase. It is also assumed that sensible heat(heat associated with changes in the temperature of the material) can be neglected, i.e. theheat supplied is purely used to sublime ice.
Two main scenarios can be envisaged depending on whether heat applied through thesame surface from which moisture escapes the material or via opposite faces.
12.4.1 Heat and mass transfer through the same surface
This occurs when heat is applied to the exposed surface by radiant heating.Figure 12.8 is a diagram of a slab of food of thickness L undergoing freeze drying. The
upper surface temperature of the food is maintained at a temperature Ts and the partial pres-sure of water vapour in the chamber is ps. The temperature of the sublimation interface isdenoted by Ti which gives rise to a vapour pressure pi at the interface according to the equi-librium relationship (see Fig. 12.1). The distance of the interface from the upper surfaceis x .
The rate at which heat is conducted in through the outer dry layer is given by Fourier’sLaw of thermal conduction:
Q = kdry A(Ts − Ti)
x(12.2)

BLUK139-Evans January 23, 2008 17:42
Freeze Drying 263
Free surface
Ice interface
Dry material
x = 0
x = x
x = L
Icy material
MOISTURE
HEAT
ps, Ts
pi, Ti
Shelf
Fig. 12.8 Retreating front model for freeze drying by radiant heating.
This is equated to the rate of energy used in sublimation, i.e.
Q = λM (12.3)
The sublimation rate can also be expressed in two further equations. First, it is equal to therate of flow of vapour through the dry layer (assuming a pseudo-steady state), which is drivenby the gradient in water vapour pressure:
M = bdry A(pi − ps)
x(12.4)
We can also relate the rate of sublimation (M) to the velocity of the sublimation front (dx /dt)with the following steps:
Volume swept out
Time= A
dx
dt(12.5)
where A is the area of the front (equivalent to the top surface area of the slab). Multiplyingby the dry solids density (mass of dry solids per unit volume) then gives:
Mass of dry solid swept out
Time= ρ A
dx
dt(12.6)
Finally, the sublimation rate is obtained by multiplying by the difference in dry-basis moisturecontent of the food (mass of water per unit mass of dry solids) on either side of the front:
M = Mass of water sublimed
Time= ρ A(m ice − mdry)
dx
dt(12.7)
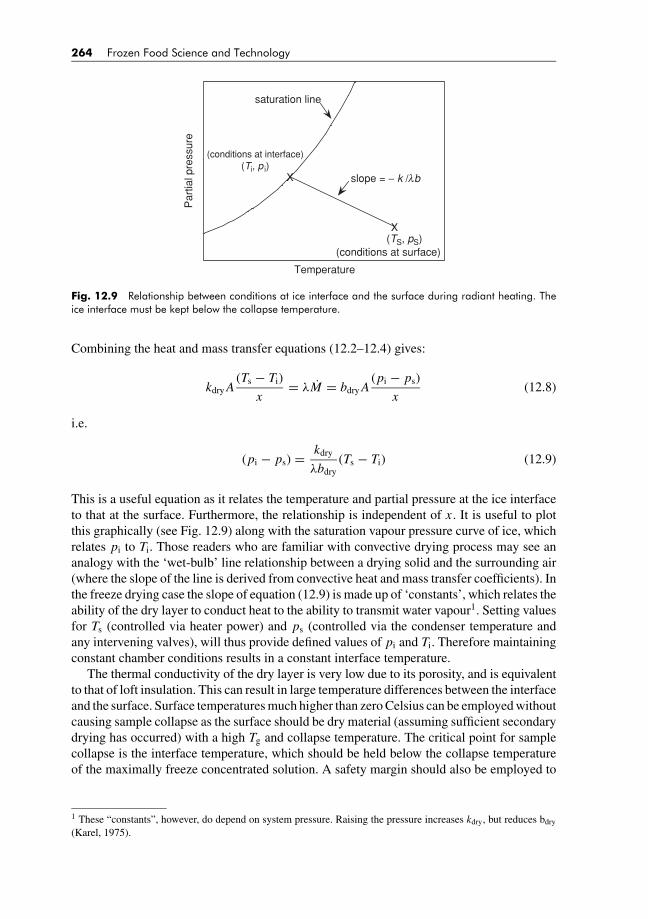
BLUK139-Evans January 23, 2008 17:42
264 Frozen Food Science and Technology
Temperature
(TS, pS)X
X slope = − k /lb
saturation line
(conditions at surface)
(conditions at interface)(Ti, p i)
Par
tial p
ress
ure
Fig. 12.9 Relationship between conditions at ice interface and the surface during radiant heating. Theice interface must be kept below the collapse temperature.
Combining the heat and mass transfer equations (12.2–12.4) gives:
kdry A(Ts − Ti)
x= λM = bdry A
(pi − ps)
x(12.8)
i.e.
(pi − ps) = kdry
λbdry
(Ts − Ti) (12.9)
This is a useful equation as it relates the temperature and partial pressure at the ice interfaceto that at the surface. Furthermore, the relationship is independent of x . It is useful to plotthis graphically (see Fig. 12.9) along with the saturation vapour pressure curve of ice, whichrelates pi to Ti. Those readers who are familiar with convective drying process may see ananalogy with the ‘wet-bulb’ line relationship between a drying solid and the surrounding air(where the slope of the line is derived from convective heat and mass transfer coefficients). Inthe freeze drying case the slope of equation (12.9) is made up of ‘constants’, which relates theability of the dry layer to conduct heat to the ability to transmit water vapour1. Setting valuesfor Ts (controlled via heater power) and ps (controlled via the condenser temperature andany intervening valves), will thus provide defined values of pi and Ti. Therefore maintainingconstant chamber conditions results in a constant interface temperature.
The thermal conductivity of the dry layer is very low due to its porosity, and is equivalentto that of loft insulation. This can result in large temperature differences between the interfaceand the surface. Surface temperatures much higher than zero Celsius can be employed withoutcausing sample collapse as the surface should be dry material (assuming sufficient secondarydrying has occurred) with a high Tg and collapse temperature. The critical point for samplecollapse is the interface temperature, which should be held below the collapse temperatureof the maximally freeze concentrated solution. A safety margin should also be employed to
1 These “constants”, however, do depend on system pressure. Raising the pressure increases kdry, but reduces bdry
(Karel, 1975).

BLUK139-Evans January 23, 2008 17:42
Freeze Drying 265
allow for the fact that in practice secondary drying needs to be given sufficient time to occurbehind the primary sublimation front.
Once the interface conditions are established, the drying kinetics (position of the subli-mation front with respect to time can be derived by considering either equations (12.2) and(12.3) (heat transfer), or equation (12.4) (mass transfer)). As both are linked (via equation(12.9)) both approaches will yield the same numerical result:
λM = kdry A(Ts − Ti)
x= λρ A(m ice − mdry)
dx
dt(12.10)
⇒∫ L
0
xdx =∫ L
0
kdry(Ts − Ti)
λρ(m ice − mdry)dt (12.11)
⇒[
x2
2
]L
0
= kdry(Ts − Ti)
λρ(m ice − mdry)t = L2
2(12.12)
t = λρ(m ice − mdry)
2kice(Ts − Ti)L2 (12.13)
Referring back to equation (12.9), this is equivalent to writing
t = ρ(m ice − mdry)
2bdry(pi − ps)L2 (12.14)
Thus, the fastest times are obtained with as large as possible �T and �p, which requiresoperating at the highest interface temperature possible without causing collapse. It can alsobe seen from this approximate model that the freeze drying time is proportional to the squareof the thickness of the sample. Thus, halving the thickness will reduce drying times byapproximately a factor of four. The freeze drying process is therefore best suited to foodswhich can be prepared in small particles or slices (of the order of a centimetre or less).
12.4.2 Heat and mass transfer through opposite surfaces
This scenario is relevant to heated shelf arrangements. We will thus consider a convectiveheat transfer resistance between the heating medium and the bottom surface of the solid, anda conductive resistance within the solid (Fig. 12.10).
The heat conduction relation becomes:
Q = kice A(Ts − Ti)
L − x(12.15)
but all the other equations (12.3–12.7) are unchanged.Thus, if the heat and mass transfer equations are now combined, we have:
kice A(Ts − Ti)
(L − x)= λM = λbdry A
(pi − ps)
x(12.16)
Note that, in contrast to the previous case the interface conditions now vary with the depthof the front (x) as this does not cancel as before. However, the thermal conductivity used in

BLUK139-Evans January 23, 2008 17:42
266 Frozen Food Science and Technology
Ice interface
Dry material
x = 0
x = x
x = L
Icy material
MOISTURE
HEAT
ps
pi, Ti
Tshelf
Free surface
Shelf
Fig. 12.10 Retreating front model for freeze drying by contact (shelf) heating.
equation (12.16) now refers to that of icy material, which is a very good conductor of heat(kice is typically of the order of 2 W m−1 K−1). Thus, Ti will only be slightly higher than Ts,and one can assume that the shelf temperature controls the interface temperature.
If Ts, and thus Ti and pi, is kept constant then integration of the mass transfer relationcan be performed in an identical manner to produce equation (12.14). This yields the sameequation as for the radiant heating case; however, it should be recognised that the two casesdiffer in how the interface conditions pi and Ti are established.
12.4.3 Freeze drying of laboratory flasks
The shelf-heating scenario can be further extended to the laboratory flask system. Here theresistance to heat transfer can be modelled by a heat transfer coefficient which is dominatedby the natural convection component between the outside of the glass flask and the ambientair temperature in the room where the flask is situated (Fig. 12.11). As before, we neglectthe thermal resistance of the icy layer, and the heat capacity of the sample. The heat transferrelationship is again the only equation that changes, and can be written as:
Q = UA(Tair − Ti) (12.17)
where U is the overall heat transfer coefficient between the ambient air (at Tair) and the icefront.
Combining with equations (12.3–12.7) yields:
UA(Tair − Ti) = λM = λbdry A(pi − ps)
x(12.18)
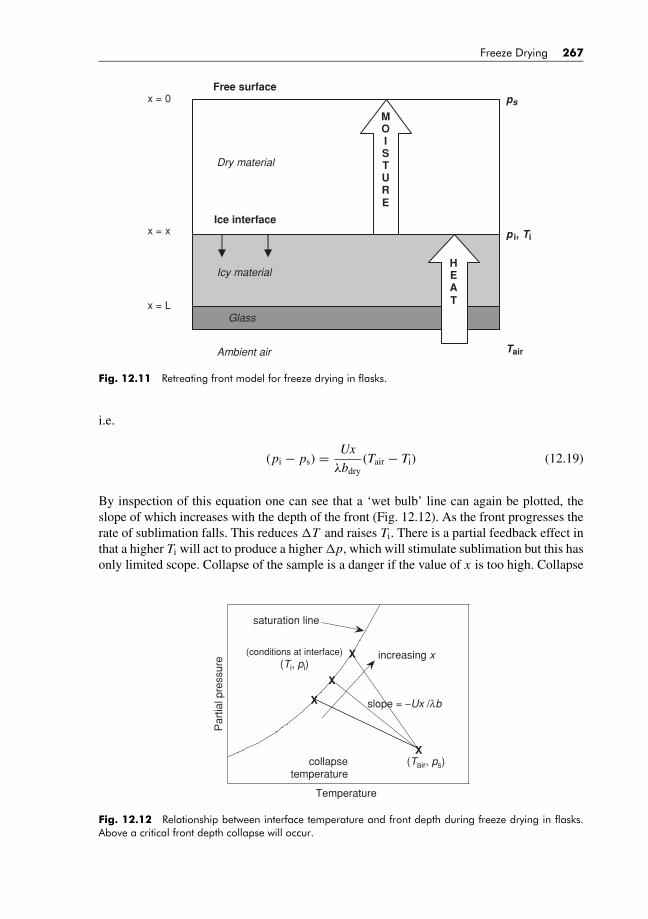
BLUK139-Evans January 23, 2008 17:42
Freeze Drying 267
Free surface
Ice interface
Dry material
x = 0
x = x
x = L
Icy material
MOISTURE
ps
p i, Ti
Glass
Ambient air Tair
HEAT
Fig. 12.11 Retreating front model for freeze drying in flasks.
i.e.
(pi − ps) = Ux
λbdry
(Tair − Ti) (12.19)
By inspection of this equation one can see that a ‘wet bulb’ line can again be plotted, theslope of which increases with the depth of the front (Fig. 12.12). As the front progresses therate of sublimation falls. This reduces �T and raises Ti. There is a partial feedback effect inthat a higher Ti will act to produce a higher �p, which will stimulate sublimation but this hasonly limited scope. Collapse of the sample is a danger if the value of x is too high. Collapse
Temperature
(Tair, ps)X
X slope = −Ux /lb
saturation line
(conditions at interface)(Ti, pi)
Par
tial p
ress
ure
X
X increasing x
collapsetemperature
Fig. 12.12 Relationship between interface temperature and front depth during freeze drying in flasks.Above a critical front depth collapse will occur.
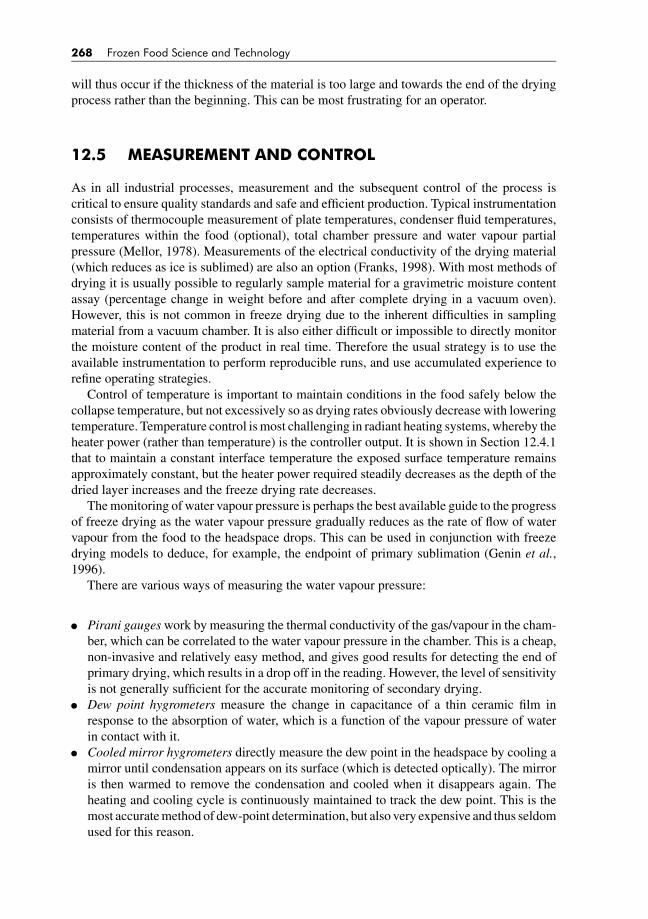
BLUK139-Evans January 23, 2008 17:42
268 Frozen Food Science and Technology
will thus occur if the thickness of the material is too large and towards the end of the dryingprocess rather than the beginning. This can be most frustrating for an operator.
12.5 MEASUREMENT AND CONTROL
As in all industrial processes, measurement and the subsequent control of the process iscritical to ensure quality standards and safe and efficient production. Typical instrumentationconsists of thermocouple measurement of plate temperatures, condenser fluid temperatures,temperatures within the food (optional), total chamber pressure and water vapour partialpressure (Mellor, 1978). Measurements of the electrical conductivity of the drying material(which reduces as ice is sublimed) are also an option (Franks, 1998). With most methods ofdrying it is usually possible to regularly sample material for a gravimetric moisture contentassay (percentage change in weight before and after complete drying in a vacuum oven).However, this is not common in freeze drying due to the inherent difficulties in samplingmaterial from a vacuum chamber. It is also either difficult or impossible to directly monitorthe moisture content of the product in real time. Therefore the usual strategy is to use theavailable instrumentation to perform reproducible runs, and use accumulated experience torefine operating strategies.
Control of temperature is important to maintain conditions in the food safely below thecollapse temperature, but not excessively so as drying rates obviously decrease with loweringtemperature. Temperature control is most challenging in radiant heating systems, whereby theheater power (rather than temperature) is the controller output. It is shown in Section 12.4.1that to maintain a constant interface temperature the exposed surface temperature remainsapproximately constant, but the heater power required steadily decreases as the depth of thedried layer increases and the freeze drying rate decreases.
The monitoring of water vapour pressure is perhaps the best available guide to the progressof freeze drying as the water vapour pressure gradually reduces as the rate of flow of watervapour from the food to the headspace drops. This can be used in conjunction with freezedrying models to deduce, for example, the endpoint of primary sublimation (Genin et al.,1996).
There are various ways of measuring the water vapour pressure:� Pirani gauges work by measuring the thermal conductivity of the gas/vapour in the cham-ber, which can be correlated to the water vapour pressure in the chamber. This is a cheap,non-invasive and relatively easy method, and gives good results for detecting the end ofprimary drying, which results in a drop off in the reading. However, the level of sensitivityis not generally sufficient for the accurate monitoring of secondary drying.� Dew point hygrometers measure the change in capacitance of a thin ceramic film inresponse to the absorption of water, which is a function of the vapour pressure of waterin contact with it.� Cooled mirror hygrometers directly measure the dew point in the headspace by cooling amirror until condensation appears on its surface (which is detected optically). The mirroris then warmed to remove the condensation and cooled when it disappears again. Theheating and cooling cycle is continuously maintained to track the dew point. This is themost accurate method of dew-point determination, but also very expensive and thus seldomused for this reason.
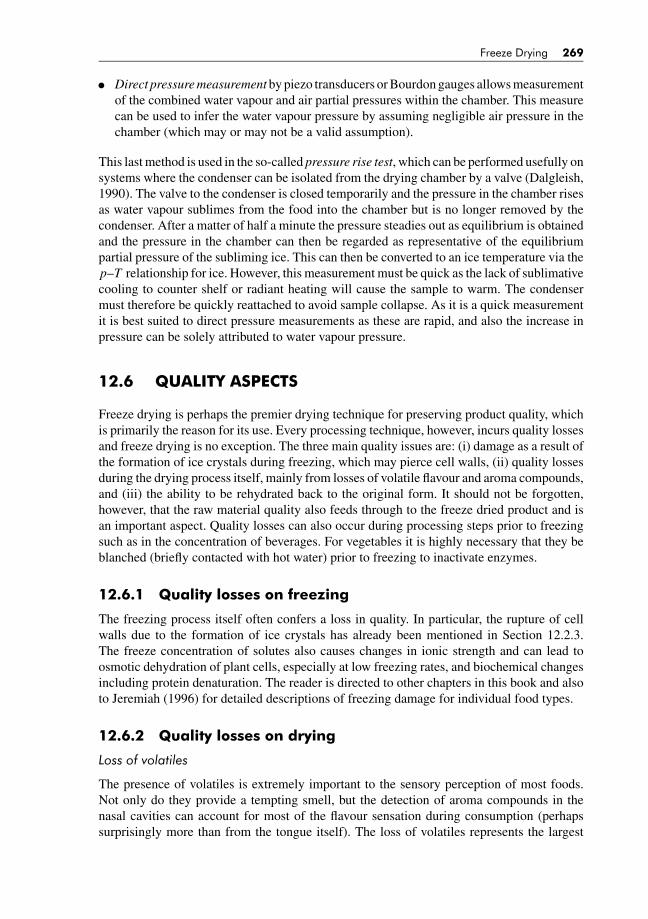
BLUK139-Evans January 23, 2008 17:42
Freeze Drying 269� Direct pressure measurement by piezo transducers or Bourdon gauges allows measurementof the combined water vapour and air partial pressures within the chamber. This measurecan be used to infer the water vapour pressure by assuming negligible air pressure in thechamber (which may or may not be a valid assumption).
This last method is used in the so-called pressure rise test, which can be performed usefully onsystems where the condenser can be isolated from the drying chamber by a valve (Dalgleish,1990). The valve to the condenser is closed temporarily and the pressure in the chamber risesas water vapour sublimes from the food into the chamber but is no longer removed by thecondenser. After a matter of half a minute the pressure steadies out as equilibrium is obtainedand the pressure in the chamber can then be regarded as representative of the equilibriumpartial pressure of the subliming ice. This can then be converted to an ice temperature via thep–T relationship for ice. However, this measurement must be quick as the lack of sublimativecooling to counter shelf or radiant heating will cause the sample to warm. The condensermust therefore be quickly reattached to avoid sample collapse. As it is a quick measurementit is best suited to direct pressure measurements as these are rapid, and also the increase inpressure can be solely attributed to water vapour pressure.
12.6 QUALITY ASPECTS
Freeze drying is perhaps the premier drying technique for preserving product quality, whichis primarily the reason for its use. Every processing technique, however, incurs quality lossesand freeze drying is no exception. The three main quality issues are: (i) damage as a result ofthe formation of ice crystals during freezing, which may pierce cell walls, (ii) quality lossesduring the drying process itself, mainly from losses of volatile flavour and aroma compounds,and (iii) the ability to be rehydrated back to the original form. It should not be forgotten,however, that the raw material quality also feeds through to the freeze dried product and isan important aspect. Quality losses can also occur during processing steps prior to freezingsuch as in the concentration of beverages. For vegetables it is highly necessary that they beblanched (briefly contacted with hot water) prior to freezing to inactivate enzymes.
12.6.1 Quality losses on freezing
The freezing process itself often confers a loss in quality. In particular, the rupture of cellwalls due to the formation of ice crystals has already been mentioned in Section 12.2.3.The freeze concentration of solutes also causes changes in ionic strength and can lead toosmotic dehydration of plant cells, especially at low freezing rates, and biochemical changesincluding protein denaturation. The reader is directed to other chapters in this book and alsoto Jeremiah (1996) for detailed descriptions of freezing damage for individual food types.
12.6.2 Quality losses on drying
Loss of volatiles
The presence of volatiles is extremely important to the sensory perception of most foods.Not only do they provide a tempting smell, but the detection of aroma compounds in thenasal cavities can account for most of the flavour sensation during consumption (perhapssurprisingly more than from the tongue itself). The loss of volatiles represents the largest
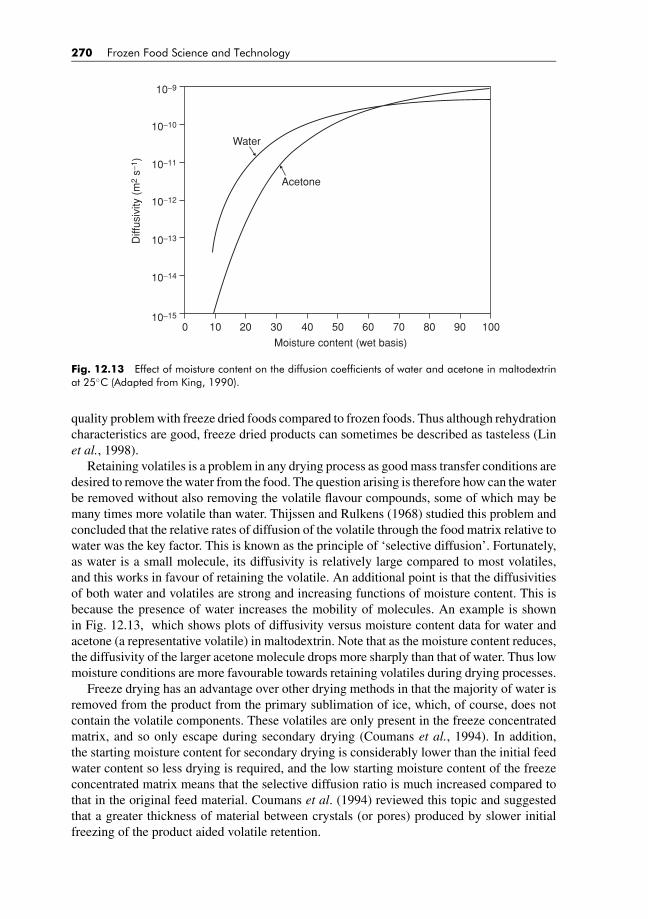
BLUK139-Evans January 23, 2008 17:42
270 Frozen Food Science and Technology
0 10
Diff
usiv
ity (
m2
s−1 )
20 30 40
Moisture content (wet basis)
50 60 70 80 90 100
Water
Acetone
10−9
10−10
10−11
10−12
10−13
10−14
10−15
Fig. 12.13 Effect of moisture content on the diffusion coefficients of water and acetone in maltodextrinat 25◦C (Adapted from King, 1990).
quality problem with freeze dried foods compared to frozen foods. Thus although rehydrationcharacteristics are good, freeze dried products can sometimes be described as tasteless (Linet al., 1998).
Retaining volatiles is a problem in any drying process as good mass transfer conditions aredesired to remove the water from the food. The question arising is therefore how can the waterbe removed without also removing the volatile flavour compounds, some of which may bemany times more volatile than water. Thijssen and Rulkens (1968) studied this problem andconcluded that the relative rates of diffusion of the volatile through the food matrix relative towater was the key factor. This is known as the principle of ‘selective diffusion’. Fortunately,as water is a small molecule, its diffusivity is relatively large compared to most volatiles,and this works in favour of retaining the volatile. An additional point is that the diffusivitiesof both water and volatiles are strong and increasing functions of moisture content. This isbecause the presence of water increases the mobility of molecules. An example is shownin Fig. 12.13, which shows plots of diffusivity versus moisture content data for water andacetone (a representative volatile) in maltodextrin. Note that as the moisture content reduces,the diffusivity of the larger acetone molecule drops more sharply than that of water. Thus lowmoisture conditions are more favourable towards retaining volatiles during drying processes.
Freeze drying has an advantage over other drying methods in that the majority of water isremoved from the product from the primary sublimation of ice, which, of course, does notcontain the volatile components. These volatiles are only present in the freeze concentratedmatrix, and so only escape during secondary drying (Coumans et al., 1994). In addition,the starting moisture content for secondary drying is considerably lower than the initial feedwater content so less drying is required, and the low starting moisture content of the freezeconcentrated matrix means that the selective diffusion ratio is much increased compared tothat in the original feed material. Coumans et al. (1994) reviewed this topic and suggestedthat a greater thickness of material between crystals (or pores) produced by slower initialfreezing of the product aided volatile retention.
BLUK139-Evans January 23, 2008 17:42
Freeze Drying 271
12.6.3 Loss of quality on storage
Freeze dried foods should be stored in a sealed container to prevent further loss of volatiles.Many deteriorative reactions progress very slowly, if at all, if the food is maintained in theglassy state, and especially if stored under an inert atmosphere. Thus, even with long periodsof storage, reactions such as the Maillard reaction take place to an extent that is small thoughfinite (Kawai et al., 2005). If the food contains fats, the fats can oxidise over time and becomerancid. For this reason freeze drying is not often used for fatty produce.
12.6.4 Rehydration ability
Freeze dried foods are almost universally accepted as superior in their ability to rehydrate incomparison to those dried by other methods. This is as a result of their porous structure (Linet al., 1998). If cellular damage is kept to a minimum then 90% rehydration of plant materialcan be routinely achieved.
12.6.5 Avoidance of collapse
Avoidance of collapse – either during freeze drying or in subsequent storage – is by farthe most important factor determining the quality of freeze dried produce (Levi and Karel,1995). Collapse causes a dramatic increase in the loss of volatiles, in shrinkage, in lossof rehydration capability and in allowing deteriorative reactions to occur. For this reasoncollapse must always be avoided in freeze drying and a safety margin included in freezedrying operations. Various workers report collapse occurring at temperatures 2–3 K aboveTg (Pikal and Shah, 1990) or midway between T ′
g and T ′m values (Knopp et al., 1998).
12.7 ALTERNATIVE METHODS OF FREEZE DRYING
The primary aim of this chapter has been to set out the main techniques of what may betermed conventional freeze drying. The process, however, remains expensive compared toother methods of dehydration. To counter this a number of variations have been researched.
12.7.1 Microwave heating
Microwave freeze drying was first experimented upon in the 1950s as a way of providingthe heat of sublimation more uniformly to a sample. The combination of low thermal con-ductivities of the gas phase (due to low pressures) and the dry solid phase (due to porosity)means that heat transfer in conventional freeze drying is poor. Microwaves, on the otherhand, by-pass both the gas and dry layer, and are readily absorbed by the ice phase. Variousresearchers (e.g. Cohen and Yang, 1995) have reported increased rates of freeze drying withmicrowaves compared to conventional methods, but the method still has not been widelycommercialised. The main problems are as follows (Karel, 1975):
(i) Microwaves are an expensive form of energy (10–20 times that of steam).(ii) Microwaves can ‘glow discharge’ that can lead to ionisation of gases, which can cause
a loss of food quality.

BLUK139-Evans January 23, 2008 17:42
272 Frozen Food Science and Technology
(iii) Microwaving is difficult to control as liquid water absorbs microwave radiation morestrongly than ice. Inhomogeneities in microwave heating are commonplace, and thus ifany ice were to melt accidentally as a result then a thermal ‘runaway’ effect would ensueas the water would preferentially absorb the microwaves.
12.7.2 Atmospheric freeze drying
Although sublimation in conventional freeze drying occurs under a vacuum it is perfectlypossible for sublimation to occur in air at atmospheric pressure so long as the partial pressureof water vapour is below psat. Indeed, this is by far the most common form of freeze dryingon planet earth – it occurs naturally on a massive scale from the snow and ice which cover alarge part of the earth’s surface. Experiments in atmospheric freeze drying of foods date backto Meryman (1959) who freeze dried small samples of liver and recirculated air back througha packed desiccant bed. An industrial process using atmospheric freeze drying is currently inoperation (Dtech A/S, Norway), in which food particles are freeze dried in a fluidised bed bycold air with a relative humidity of 30%. The gas picks up humidity in the fluidised bed but isthen recirculated through a condenser to remove water before being reheated. The condenserand heater are integrated via a heat pump and this allows substantial energy savings to bemade which is not possible with the conventional freeze dryer design.
Other workers have continued Meryman’s idea of using an absorbent material, but includedit in close proximity to the drying material in a fluidised bed (e.g. Wolff and Gilbert, 1990;Lombrana and Villaran, 1997; Di Matteo et al., 2003). This means that there are no condensercosts and water vapour molecules do not have to travel far once they have left the food,which increases the drying rate. The process is essentially internally mass transfer controlledfor 1 cm size solids. A disadvantage is that the desiccant has to be separated completelyfrom the food afterwards and that the risk of contamination of the food by the desiccantremains.
12.7.3 Spray-freeze-drying
Spray-freeze-drying, as its name suggests, is a two-stage process in which a liquid feedcontaining a dissolved solid is first sprayed into a cold gas or cryogenic liquid to form frozenparticles, which are then freeze dried in a fluidised bed. The small particle size providesthe potential for substantially shorter freeze drying times than usually found as freeze dryingtimes approximately scale with the square of the linear dimensions of the object (see equations(12.12) and (12.13)). The process requires efficient heat transfer to the individual particles,which can be achieved by fluidisation. This was applied by Malecki et al. (1970) who firstspray froze solutions in liquid nitrogen and then freeze dried, using atmospheric air, eggalbumin at −20◦C and apple juice at −34◦C (which proved difficult). A process along theselines has been patented by Glatt AG (Mumenthaler and Leuenberger, 1991). A problem withthis process, however, is that the small particles elutriate 1 cm the bed and dry instead in theair filters at the exit of the freeze drying chamber.
12.7.4 Sub-atmospheric fluidised bed freeze drying
A further possible means of improving fluidised bed processes is to apply a partial vacuum.As an example, if the process is operated at 0.1 bar then the mass of gas required wouldbe approximately one-tenth of the amount required at 1 bar, significantly reducing the mass
BLUK139-Evans January 23, 2008 17:42
Freeze Drying 273
of gas that is required to be recirculated (Anandharamakrishnan et al., 2006). This resultsin a reduced energy cost for recirculating and drying the gas, and reduces the likelihoodof particles being swept away from the fluidised bed. Thus sub-atmospheric operation isparticularly suited to small particles. However, a vacuum capability does increase the capitalcost and operational difficulties of the plant.
12.8 CONCLUSIONS
Freeze drying still remains a niche area in food processing. The major difficulty will always bethe low collapse temperatures that are common in food systems (especially those containingsignificant quantities of sugars). The low temperatures and consequently low vapour pressuresof water limit mass transfer rates. It is possible that new methods of freeze drying improveon drying time, which would bring a greater range of foods into the domain of freeze dryingin the future.
NomenclatureA area of slab/ice front (m2)b permeability (s)k thermal conductivity (W m−1 K−1)L slab thickness (m)m dry basis moisture content (kg kg−1)
M sublimation rate (kg s−1)p vapour pressure of water (Pa)Q heat flow (W)t time (s)T temperature (K)U overall heat transfer coefficient (W m−2 K−1)w mole fractionx distance of interface from surface (m)
Greek charactersκ fittable constant in the Gordon–Taylor equationρ dry solids density (mass of dry solids per unit volume) (kg m−3)λ latent heat of sublimation (J kg−1)
Subscripts
air of air (outside flask)dry of dry regiong glass transitioni at ice interfaceice of icy regions at surface1,2 component 1,2

BLUK139-Evans January 23, 2008 17:42
274 Frozen Food Science and Technology
REFERENCES
Anandharamakrishnan, C., Khwanpruk, K., Rielly, C.D. and Stapley, A.G.F. (2006). Spray-freeze-drying atsub-atmospheric pressures. In: I. Farkas, ed. Drying 2006. Hungary: Szent Istvan University, pp. 636–642.
Cohen, J.S. and Yang, T.C.S. (1995). Progress in Food Dehydration. Trends in Food Science & Technology6(1), 20–25.
Coumans, W.J., Kerkhof, P.J.A.M. and Bruin, S. (1994). Theoretical and practical aspects of aroma retentionin spray-drying and freeze-drying. Drying Technology 12(1–2), 99–149.
da Silva, M.A., Sobral, P.J.A. and Kieckbusch, T.G. (2006). Water sorption and glass transition of freeze-driedCamu-Camu (Myrciaria dubia (Hbk) McVaugh) pulp. Journal of Thermal Analysis and Calorimetry 84(2),435–439.
Dalgleish, J.M. (1990). Freeze-Drying for the Food Industries. London: Elsevier.Di Matteo, P., Donsi, G. and Ferrari, G. (2003). The role of heat and mass transfer phenomena in atmospheric
freeze-drying of foods in a fluidised bed. Journal of Food Engineering 59(2–3), 267–275.Franks, F. (1998). Freeze-drying of bioproducts: putting principles into practice. European Journal of Phar-
maceutics and Biopharmaceutics 45(3), 221–229. 98.Genin, N., Rene, F. and Corrieu, G. (1996). A method for on-line determination of residual water content and
sublimation end-point during freeze-drying. Chemical Engineering and Processing 35(4), 255–263.Gordon, M. and Taylor, J.S. (1952). Ideal copolymers and the 2nd-order transitions of synthetic rubbers .1.
Non-crystalline copolymers. Journal of Applied Chemistry 2(9), 493–500.Heldman, D.R. and Hohner, G.A. (1974). Analysis of atmospheric freeze-drying. Journal of Food Science
39(1), 147–155.Jeremiah, L.E. (ed.) (1996). Freezing effects on food quality. New York: Marcel Dekker.Karathanos, V.T., Anglea, S.A. and Karel, M. (1996). Structural collapse of plant materials during freeze-
drying. Journal of Thermal Analysis 47(5), 1451–1461.Karel, M. (1975). Heat and mass transfer in freeze drying. In: S.A. Goldblith, L. Rey and W.W. Rothmayr.
International Course on Freeze Drying and Advanced Food Technology. London: Academic Press,pp. 177–202.
Kawai, K., Hagiwara, T., Takai, R. and Suzuki, T. (2005). The rate of non-enzymatic browning reaction inmodel freeze-dried food system in the glassy state. Innovative Food Science & Emerging Technologies6(3), 346–350.
King, C.J. (1990) Spray drying food liquids and the retention of volatiles. Chemical Engineering Progress86(6), 33–39.
Knopp, S.A., Chongprasert, S. and Nail, S. L. (1998). The relationship between type TMDSC curve of frozensucrose solutions and collapse during freeze-drying. Journal of Thermal Analysis and Calorimetry 54(2),659–672.
Kochs, M., Korber, C., Heschel, I. and Nunner, B. (1993). The influence of the freezing process on vapor trans-port during sublimation in vacuum-drying freeze-drying of macroscopic samples. International Journal ofHeat and Mass Transfer 36(7), 1727–1738.
Levi, G. and Karel, M. (1995). Volumetric shrinkage (collapse) in freeze-dried carbohydrates above theirglass-transition temperature. Food Research International 28(2), 145–151.
Lin, T.M., Durance, T.D. and Scaman, C.H. (1998). Characterization of vacuum microwave, air and freezedried carrot slices. Food Research International 31(2), 111–117.
Lombrana, J.I. and Villaran, M.C. (1997). The influence of pressure and temperature on freeze-dryingin an adsorbent medium and establishment of drying strategies. Food Research International 30(3–4),213–222.
Malecki, G.J., Shinde, P., Morgan, A.I. and Farkas, D.F. (1970). Atmospheric fluidized bed freeze drying.FoodTechnology 24(5), 601–603.
Mellor, J.D. (1978). Fundamentals of Freeze Drying. London: Academic Press.Meryman, H.T. (1959). Sublimation freeze-drying without vacuum. Science 130(3376), 628–629.Mumenthaler, M. and Leuenberger, H. (1991). Atmospheric spray-freeze drying – a suitable alternative in
freeze-drying technology. International Journal of Pharmaceutics 72(2), 97–110.Oetjen, G.W. (1999). Freeze Drying. Weinheim: Wiley.Pikal, M.J. and Shah, S. (1990). The collapse temperature in freeze-drying – dependence on measurement
methodology and rate of water removal from the glassy phase. International Journal of Pharmaceutics 62,165–186.

BLUK139-Evans January 23, 2008 17:42
Freeze Drying 275
Rahman, M.S., Kasapis, S., Guizani, N. and Al-Amri, O.S. (2003). State diagram of tuna meat: freezing curveand glass transition. Journal of Food Engineering 57(4), 321–326.
Roos, Y.H. (1997). Frozen state transitions in relation to freeze drying. Journal of Thermal Analysis 48(3),535–544.
Roos, Y.H. and Karel, M. (1991). Phase-transitions of amorphous sucrose and frozen sucrose solutions.Journal of Food Science 56(1), 266–267.
Rothmayr, W.W. (1975). Basic knowledge of freeze drying. In: S.A. Goldblith, L. Rey and W.W. Rothmayreds. International Course on Freeze Drying and Advanced Food Technology. London: Academic Press.
Thijssen, H.A.C. and Rulkens, W.H. (1968). Retention of aromas in drying liquid foods. de Ingenieur 80(47),45–56.
Wolff, E. and Gibert, H. (1990). Atmospheric freeze-drying .1. Design, experimental investigation and energy-saving advantages. Drying Technology 8(2), 385–404.

BLUK139-Evans February 6, 2008 15:43
13 Frozen Food Transport
Girolamo Panozzo
13.1 TRANSPORT AND STORAGE
Storage conditions should be maintained during transport. Transport vehicles are essentiallycold stores on wheels but are more difficult to maintain at the correct storage temperaturethan large cold stores due to several factors:
(a) supplementary heat is introduced during loading and unloading the vehicle;(b) defrosting has a more severe effect on foods compared to refrigerated stores (more
restricted space for the coils, more humid air inlet);(c) possible close contact between the foods and the lateral walls, through loading and dis-
placements of the cargo, connected to the forces that the road circulation generates in thecargo (centrifugal forces).
Regarding (a), two aspects are important: the first is the time that is required for the loading/unloading operation (the time must be the lowest possible) and the second is the level ofprotection of the cargo during these operations (Fig. 13.1) (Meffert, 1975).
Regarding (c), the problem can be severe when the vehicle is not operating and the sun isirradiating the roof and a lateral wall. In this case the external surface temperature can reachvalues close to 90◦C and the internal surface temperature can be increased as a function ofthe proximity of the cargo to the wall (Fig. 13.2) (Panozzo and Cortella, 2006).
13.2 MODES OF TRANSPORT
The essential component of any system to transport frozen food is an insulated container.International transport vehicles have to comply with the ATP and ISO rules, where an overallcoefficient of heat transfer (K coefficient) is defined and must be lower than 0.4 W m−2 K−1
(ISO, 1996) (United Nations Economic Commission for Europe, Inland Transport Commit-tee, 1970). The overall coefficient of heat transfer, which represents the insulating capacityof the equipment, is defined by the following formula:
K = W S−1�T −1
where W is the thermal capacity required in a body of mean surface area S to maintain theabsolute difference �T between the mean inside temperature Ti and the mean outside tem-perature Te, during continuous operation, when the mean outside temperature Te is constant.
The second main component is a refrigerating unit or a system to store energy at a tem-perature lower than that prescribed for the transport.
Frozen Food Science and Technology. Edited by Judith A. Evans
© 2008 Blackwell Publishing Ltd, ISBN: 978-1-4051-5478-9
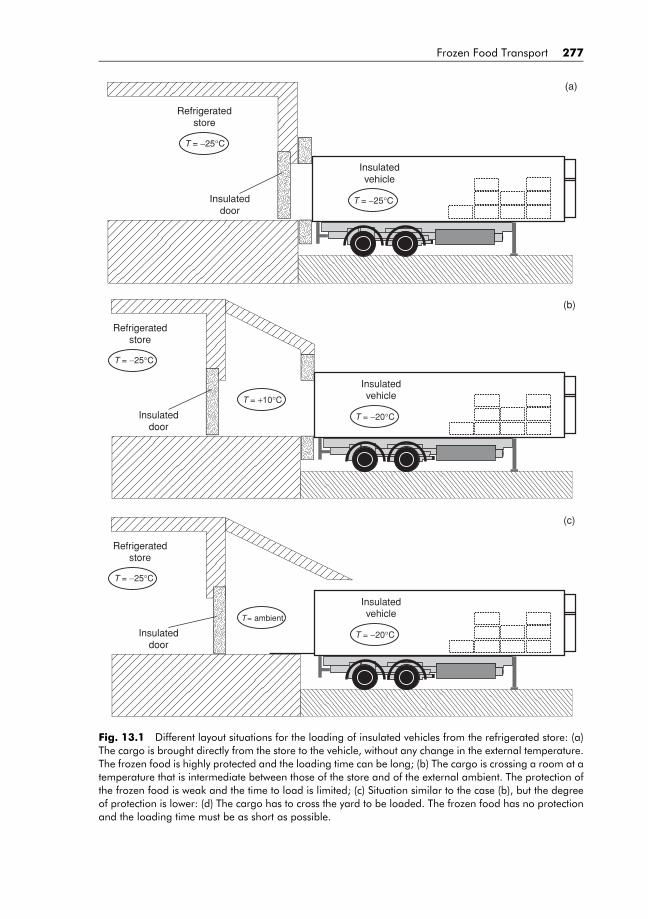
BLUK139-Evans February 6, 2008 15:43
Frozen Food Transport 277
Refrigerated store
Insulated door
Insulated vehicle
T = −25°C
T = −25°C
(a)
Refrigerated store
Insulated door
Insulated vehicle
T = −25°C
T = +10°C
T = −20°C
(b)
Refrigerated store
Insulated door
Insulated vehicle
T = −25°C
T = ambient
T = −20°C
(c)
Fig. 13.1 Different layout situations for the loading of insulated vehicles from the refrigerated store: (a)The cargo is brought directly from the store to the vehicle, without any change in the external temperature.The frozen food is highly protected and the loading time can be long; (b) The cargo is crossing a room at atemperature that is intermediate between those of the store and of the external ambient. The protection ofthe frozen food is weak and the time to load is limited; (c) Situation similar to the case (b), but the degreeof protection is lower: (d) The cargo has to cross the yard to be loaded. The frozen food has no protectionand the loading time must be as short as possible.
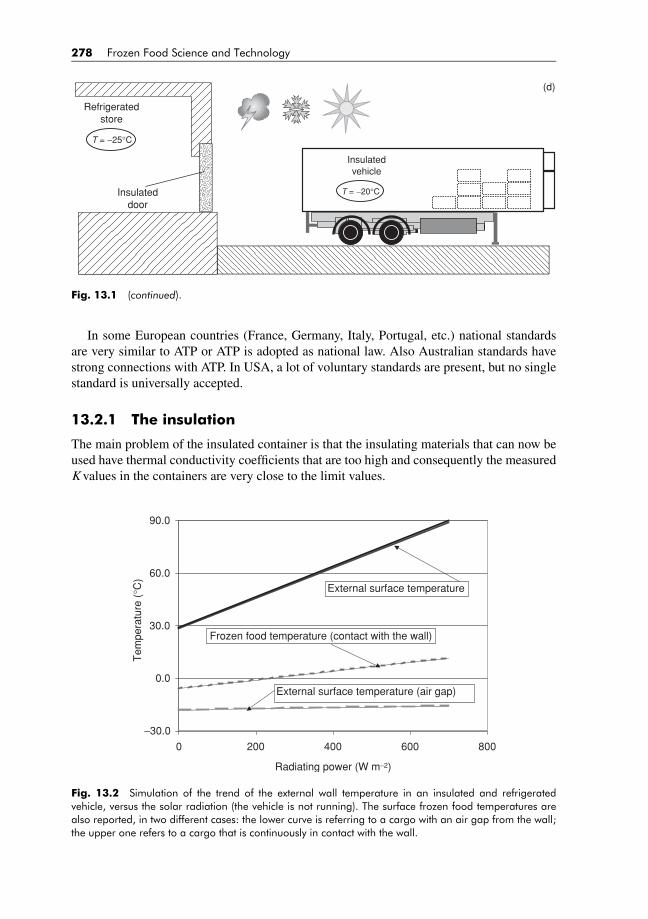
BLUK139-Evans February 6, 2008 15:43
278 Frozen Food Science and Technology
Refrigerated store
Insulated door
Insulated vehicle
T = −25°C
T = −20°C
(d)
Fig. 13.1 (continued).
In some European countries (France, Germany, Italy, Portugal, etc.) national standardsare very similar to ATP or ATP is adopted as national law. Also Australian standards havestrong connections with ATP. In USA, a lot of voluntary standards are present, but no singlestandard is universally accepted.
13.2.1 The insulation
The main problem of the insulated container is that the insulating materials that can now beused have thermal conductivity coefficients that are too high and consequently the measuredK values in the containers are very close to the limit values.
−30.0
0.0
30.0
Tem
pera
ture
(°C
) 60.0
90.0
0 200 400 600 800
Radiating power (W m−2)
External surface temperature
Frozen food temperature (contact with the wall)
External surface temperature (air gap)
Fig. 13.2 Simulation of the trend of the external wall temperature in an insulated and refrigeratedvehicle, versus the solar radiation (the vehicle is not running). The surface frozen food temperatures arealso reported, in two different cases: the lower curve is referring to a cargo with an air gap from the wall;the upper one refers to a cargo that is continuously in contact with the wall.

BLUK139-Evans February 6, 2008 15:43
Frozen Food Transport 279
Fig. 13.3 Schematic drawing of the stowing bars between the internal walls surface and the frozen foodcargo, in order to create some channels for the refrigerated air circulation. The return channels are madeby the free spaces in the pallets.
The K values can be improved by enlarging the lateral wall thicknesses, but this thenreduces the internal loading area available for storage. In Europe most cargo is palletised.A double pallet is 2.4 m wide whereas the width of European ATP vehicles are 2.6 m.Consequently, the wall thickness cannot be greater than 0.1 m and this is insufficient toprovide enough space for pallets and the insulation thickness that is necessary for a low Kvalue. Some manufacturers try to overcome this difficulty by increasing the thickness of theother walls (mainly the roof and the floor, as it is difficult to increase the front and rear wallthickness without affecting the ease of movement of the rear door and the correct positioningof the refrigerating unit on the front wall). This solution can reduce the K value; it also has aninfluence on the insulation ageing (the ageing is a function of the average thermal thickness),but is expansive and can increase the weight of the insulated container (Giuri, 2006).
13.2.2 Air circulation
For a frozen cargo, the air flow must circulate around the volume of the cargo, in order toremove the heat that enters from the walls. For this purpose, a sufficient air gap must bemaintained between the cargo and the walls (this can be created using a corrugated sheet inthe internal surface of the vehicle or positioning some thick stowing bars between the cargoand the wall; Fig. 13.3) (Amodio and Cioffi, 1985). The use of roof ducts is fundamental:these ducts are normally manufactured from textile material and have different lengths: theshorter one should be open at one-third of the length of the roof, and the longer one at three-fourths of the length of the vehicle (Fig. 13.4). The air flow rate is therefore sub-divided intoa direct flow from the refrigerating unit immediately after the fans of the evaporator, and intoa secondary flow that is directed from the ducts. The direct flow should be about the 20%of the total flow, the shorter duct will provide approximately 50% of the flow and the longerduct the residual 30% (IIR, 1995) (IIR, 1999).
13.2.3 Refrigerating power
The most widely used system to refrigerate the inlet of the vehicle is a vapour compressionmechanical system. Several configurations are possible, as shown in Table 13.1 (Stimat andNational Research Council Italy, 1982).
For many years R12 was used as the refrigerant in these systems. R502 was an alternativechoice, mainly for frozen containers. These refrigerants were banned by the Montreal Protocol
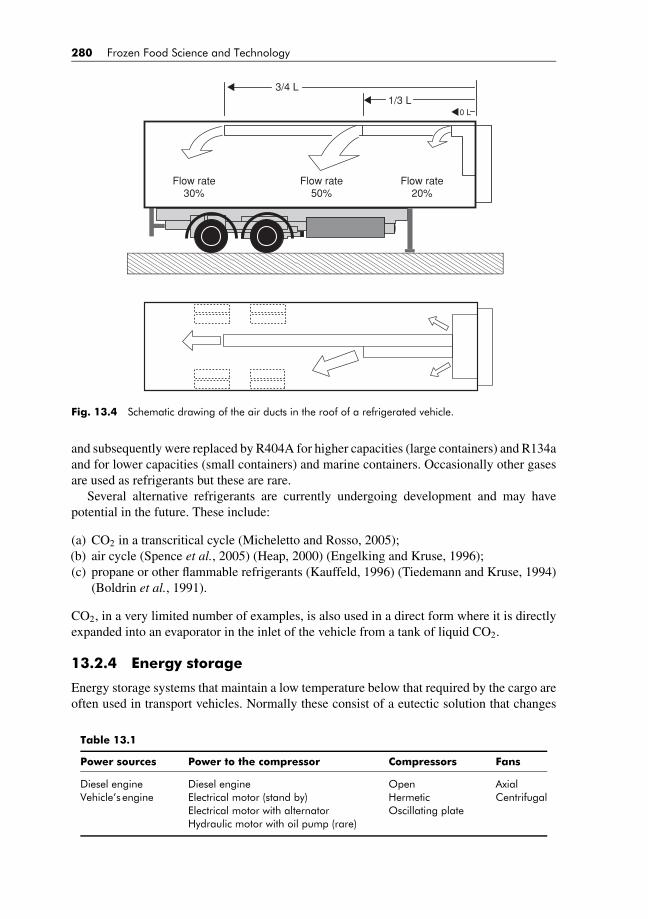
BLUK139-Evans February 6, 2008 15:43
280 Frozen Food Science and Technology
3/4 L
Flow rate 30%
Flow rate 50%
Flow rate 20%
1/3 L0 L
Fig. 13.4 Schematic drawing of the air ducts in the roof of a refrigerated vehicle.
and subsequently were replaced by R404A for higher capacities (large containers) and R134aand for lower capacities (small containers) and marine containers. Occasionally other gasesare used as refrigerants but these are rare.
Several alternative refrigerants are currently undergoing development and may havepotential in the future. These include:
(a) CO2 in a transcritical cycle (Micheletto and Rosso, 2005);(b) air cycle (Spence et al., 2005) (Heap, 2000) (Engelking and Kruse, 1996);(c) propane or other flammable refrigerants (Kauffeld, 1996) (Tiedemann and Kruse, 1994)
(Boldrin et al., 1991).
CO2, in a very limited number of examples, is also used in a direct form where it is directlyexpanded into an evaporator in the inlet of the vehicle from a tank of liquid CO2.
13.2.4 Energy storage
Energy storage systems that maintain a low temperature below that required by the cargo areoften used in transport vehicles. Normally these consist of a eutectic solution that changes
Table 13.1
Power sources Power to the compressor Compressors Fans
Diesel engine Diesel engine Open AxialVehicle’s engine Electrical motor (stand by) Hermetic Centrifugal
Electrical motor with alternator Oscillating plateHydraulic motor with oil pump (rare)

BLUK139-Evans February 6, 2008 15:43
Frozen Food Transport 281
phase at a low temperature (Ba, 1991). The solution is contained in a series of plates placed inthe roof of the vehicle. Alternatively, the solution can be introduced in plastic tubes (Fig. 13.5)(Grosskopf, 1982). These systems have the following three advantages compared to directexpansion compression refrigeration cycles:
Eutectic plates
CompressorCondenserFan
(a)
Eutectic tubes
CompressorCondenserFan
(b)
Eutectic plates
Quick connections
to other vehicles
CompressorCondenserFan
from other vehicles
(c)
Fig. 13.5 Eutectic systems. (a) Layout of the plates. Normally the plates are placed under the roof. If afurther plate is necessary, it can be placed in the rear or front wall, that are normally without doors (dottedplates). (b) Like (a), but with tubes in the place of the plates; (c) Eutectic plates whose compressor andcondenser are not on board (like (a) and (b)) but separate. The separate refrigerating unit can feed morevehicles in the same time.
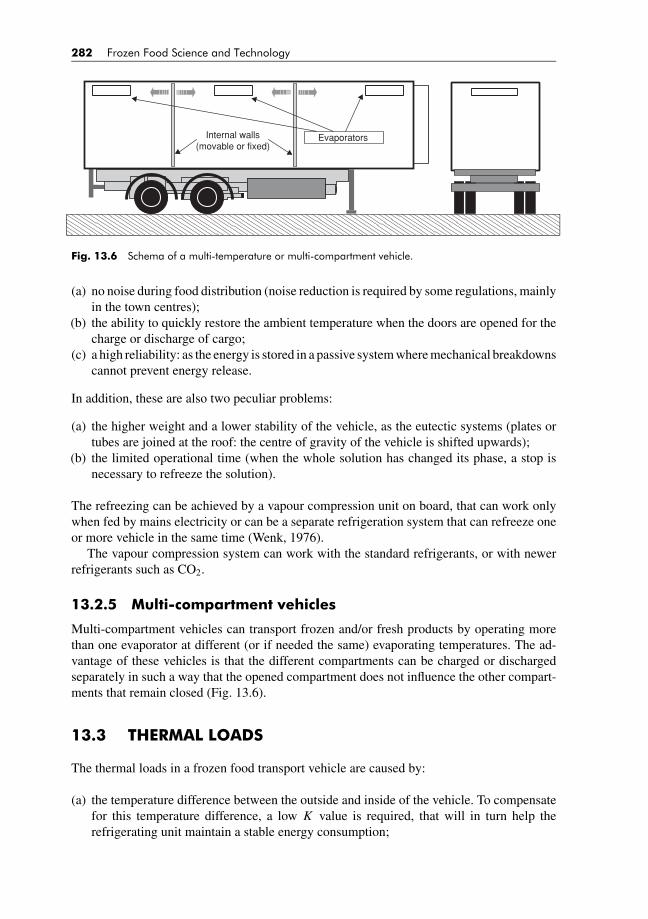
BLUK139-Evans February 6, 2008 15:43
282 Frozen Food Science and Technology
EvaporatorsInternal walls (movable or fixed)
Fig. 13.6 Schema of a multi-temperature or multi-compartment vehicle.
(a) no noise during food distribution (noise reduction is required by some regulations, mainlyin the town centres);
(b) the ability to quickly restore the ambient temperature when the doors are opened for thecharge or discharge of cargo;
(c) a high reliability: as the energy is stored in a passive system where mechanical breakdownscannot prevent energy release.
In addition, these are also two peculiar problems:
(a) the higher weight and a lower stability of the vehicle, as the eutectic systems (plates ortubes are joined at the roof: the centre of gravity of the vehicle is shifted upwards);
(b) the limited operational time (when the whole solution has changed its phase, a stop isnecessary to refreeze the solution).
The refreezing can be achieved by a vapour compression unit on board, that can work onlywhen fed by mains electricity or can be a separate refrigeration system that can refreeze oneor more vehicle in the same time (Wenk, 1976).
The vapour compression system can work with the standard refrigerants, or with newerrefrigerants such as CO2.
13.2.5 Multi-compartment vehicles
Multi-compartment vehicles can transport frozen and/or fresh products by operating morethan one evaporator at different (or if needed the same) evaporating temperatures. The ad-vantage of these vehicles is that the different compartments can be charged or dischargedseparately in such a way that the opened compartment does not influence the other compart-ments that remain closed (Fig. 13.6).
13.3 THERMAL LOADS
The thermal loads in a frozen food transport vehicle are caused by:
(a) the temperature difference between the outside and inside of the vehicle. To compensatefor this temperature difference, a low K value is required, that will in turn help therefrigerating unit maintain a stable energy consumption;

BLUK139-Evans February 6, 2008 15:43
Frozen Food Transport 283
(b) the actual thermal load on a vehicle is very different from the thermal load used in thestandard tests: not only the external temperature can be higher than +30◦C used in thetests, but also solar radiation is not part of a standard test. The solar radiation can bedirect or indirect (from surrounding walls and the ground). The influence of radiation isespecially high when the vehicle is stopped and the external air velocity is low: when thevehicle is moving, the high surface heat transfer coefficient reduces the radiative effecton the vehicle (Panozzo and Cortella, 2006);
(c) the air speed outside and inside the container can change the actual K value comparedto the tested value, often increasing the value. The air speed during the standard tests is1–2 m s−1, while the external air speed on the road may be 20 ÷ 30 m s−1;
(d) external warm air can enter the vehicle during operation due to differences in pressurebetween the inside and outside of the vehicle (this difference is due to the reduced pressureof the air at low temperature but more to the aerodynamic effects of the air all aroundthe vehicle). An additional effect is the so-called ‘pumping’ of the lateral walls that arenot absolutely rigid and inflect and deflect owing to the alternate eddies that are formedalong the lateral walls during operation. This effect ‘pumps’ the cold air out and the warmair in (this effect is obviously greater in long vehicles) (Bodenheimer; Bachmaier andBornschlegl, 1965; Schausberger et al., 1969);
(e) when the doors are opened, an exchange from external and internal air occurs, generatinga supplementary infiltration heat load for the vehicle. This effect is more important forsmaller vehicles that are dedicated to local delivery and is quite negligible for the long-distance transport vehicles that are normally closed at the beginning of the journey andonly opened at arrival.
13.4 AGEING
13.4.1 Insulated containers
The importance of the K value has been highlighted previously. The change in the K valuewith time and ‘ageing’ of the insulation are important factors that cannot be underestimated. Itis impossible to forecast the real ageing of a vehicle as the experimental data vary dramaticallyand only an average curve can be obtained (Figs. 13.7a,b) to explain the basic physicalphenomena of ageing (Panozzo et al.; Boldrin et al., 1990; Panozzo, 1999; Giuri, 2006).
An important factor affecting ageing is the average temperature of service of the vehicleand therefore, the aging in frozen food transport is the most severe. Another factor is thedistance travelled per year by the vehicle. The physical phenomena of the ageing process are:
(a) migration of the air outside into the cells of the foam of the insulator material;(b) migration of the blowing gas from the cells:(c) condensation of water in the cells;(d) damage to the cells that transform the closed cells in open cells (Klempner and Frisch,
1991).
In the case of (a) and (b) probably only the first phenomenon is important in vehicles thatare built by the sandwich technique: the second one is too slow to have any significant effect(Fig. 13.7a).

BLUK139-Evans February 6, 2008 15:43
284 Frozen Food Science and Technology
10
20
40
60
80
100
120
30 100 10,000 1,000,000
00
10
20
30
40
50
60
5 10
Years
Years
INV
%IN
V %
15 20 25 30
(b)
(a)
Fig. 13.7 Average ageing curve for insulated vehicles. (a) The first figure is the theoretical ageing curvefor a vehicle (logarithmic scale). The first inflection point represents the air inlet in the polyurethane cells;the second one represents the loss of blowing fluid from the cells: the theory shows that air is the mainfactor responsible for ageing. INV% is the percent increase of the K value with time. In other words,if k0 is the new vehicle value and kn is the value after n years, we can write k0 = kn[1 + (INV%/100)].Consequently, INV% = 100[(kn − k0)/k0]. (b) The curve (in linear time scale) shows the useful period of thecurve (corresponding to the standard life of a refrigerated vehicle). (c) The curve is plotted together with theexperimental points: a large dispersion of data is evident. This dispersion makes it impossible to forecastthe expected ageing rate for a single sample. The points signed by x-shaped characters are the averagevalues of the experimental values per each year: these points are quite well fitted by the average curve.
Sandwich panels consist of strong skins (fibreglass-reinforced epoxidic resin or metalsheet) bonded to a core of insulating material (polyurethane foam, polystyrene foam).
In the case of water condensation in the cells, Fig. 13.8 demonstrates that not only thethermal conductivity of the foam is affected by the condensation, but also the slope of thecurve of the thermal conductivity versus the temperature (the phenomenon is correlated withthe characteristic slope of the curve for the solid materials, in this specific case, the ice).
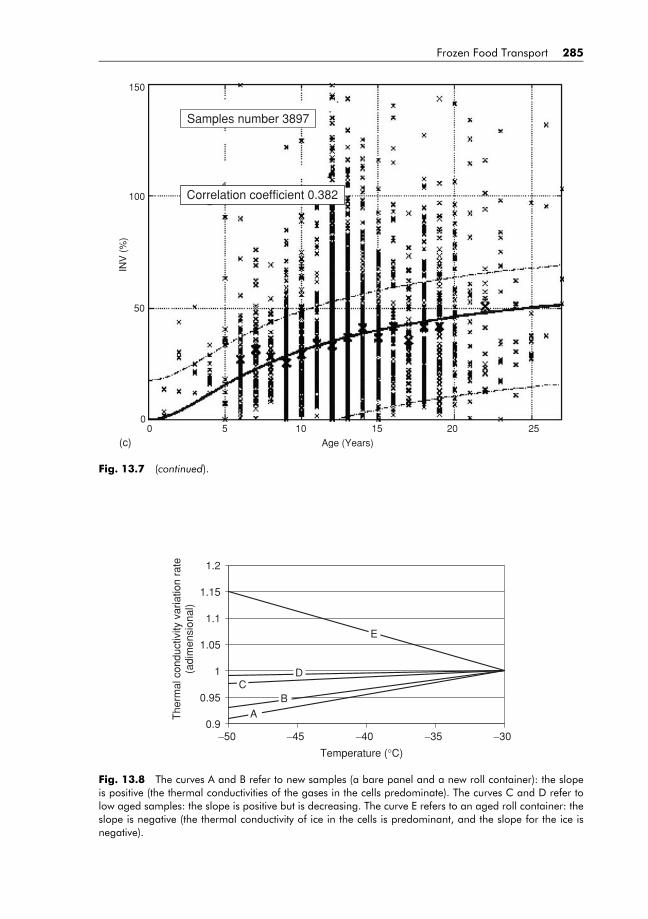
BLUK139-Evans February 6, 2008 15:43
Frozen Food Transport 285
150
100
INV
(%
)
50
00 5 10 15
Age (Years)
20 25
Samples number 3897
Correlation coefficient 0.382
(c)
Fig. 13.7 (continued).
0.9
0.95
1
1.05
1.1
1.15
1.2
−50 −45 −40 −35 −30
Temperature (°C)
The
rmal
con
duct
ivity
var
iatio
n ra
te(a
dim
ensi
onal
)
AB
CD
E
Fig. 13.8 The curves A and B refer to new samples (a bare panel and a new roll container): the slopeis positive (the thermal conductivities of the gases in the cells predominate). The curves C and D refer tolow aged samples: the slope is positive but is decreasing. The curve E refers to an aged roll container: theslope is negative (the thermal conductivity of ice in the cells is predominant, and the slope for the ice isnegative).

BLUK139-Evans February 6, 2008 15:43
286 Frozen Food Science and Technology
13.4.2 Refrigerating units
In practice, the performance of refrigerating units deteriorates over time and can be attributedprimarily to a lack of maintenance of the units, a situation that is reversible. Only a smallpercentage of the deterioration is due to the real irreversible ageing of the units (Fig. 13.9).In all cases, if a good maintenance program is carried out, ageing of the refrigeration unitswould be just a fraction of the ageing of the insulation (Fig. 13.10) (Panozzo et al., 2003).
13.5 COMPARISON BETWEEN FRESH AND FROZENPRODUCT TRANSPORT
The main difference between fresh and frozen product is that the fresh product (fruits, vegeta-bles, not completely ripened cheese) often has a metabolic charge (this charge is increasingwith increasing temperature) while frozen foods have no supplementary charge. Conse-quently, a fresh cargo must be ventilated in such a way as to allow ventilation to every partof the cargo so that the temperature will not be increased in any position. On the contrary,a frozen cargo must be as compact as possible and air circulation is only required to theexternal surface of the compact cargo. The thermal inertia of the frozen cargo is large andtherefore the ventilated air inside the vehicle only has to remove the heat transferred acrossthe insulation from outside the vehicle.
Test standards require the temperature of transport vehicles to be not higher than −20◦C.If the transport vehicle were to maintain the same conditions as many refrigerated stores,the transport temperature would be −25◦C to −30◦C. This situation implies that the Kvalue should be lower than prescribed by the standards, and that, the loss of performance ofthe refrigerating unit at lower temperature must be considered (Fig. 13.11 shows a typicalcurve of the power and COP of a unit).
13.6 STANDARDS AND CLASSIFICATION
The most used standard is ISO 1492 ‘Thermal containers’ that provides, together with dataabout the mechanical properties of the containers, thermal characteristics such as the K valueof the container and its air leakage rate. The level of the air leakage rate is used to correct theK value. This standard is the basis for many certification and testing registers.
The ATP (Agreement on the international carriage of perishable foodstuff and on thespecial equipment to be used for such carriage) is an international agreement. The treatyhas currently been signed by the following European countries: Albania, Austria, Belarus,Belgium, Bosnia and Herzegovina, Bulgaria, Croatia, Czech Republic, Denmark, Esto-nia, Finland, France, Georgia, Germany, Greece, Hungary, Ireland, Italy, Latvia, Lithuania,Luxembourg, Monaco, Montenegro, the Netherlands, Norway, Poland, Portugal, Romania,Russian Federation, Serbia, Slovakia, Slovenia, Spain, Sweden, the former Yugoslav Re-public of Macedonia and the United Kingdom. The following non-European countries havealso signed the ATP: Azerbaijan, Kazakhstan, Morocco, Tunisia, United States, Moldovaand Uzbekistan. Switzerland signed the Agreement but has not ratified it. In Europe, Iceland,Malta, Cyprus and Ukraine have not signed the Agreement so far.
The text is deposited at the United Nations in New York and changes are discussed annuallyat an international conference in Geneva. Although ATP is mandatory only for the countries
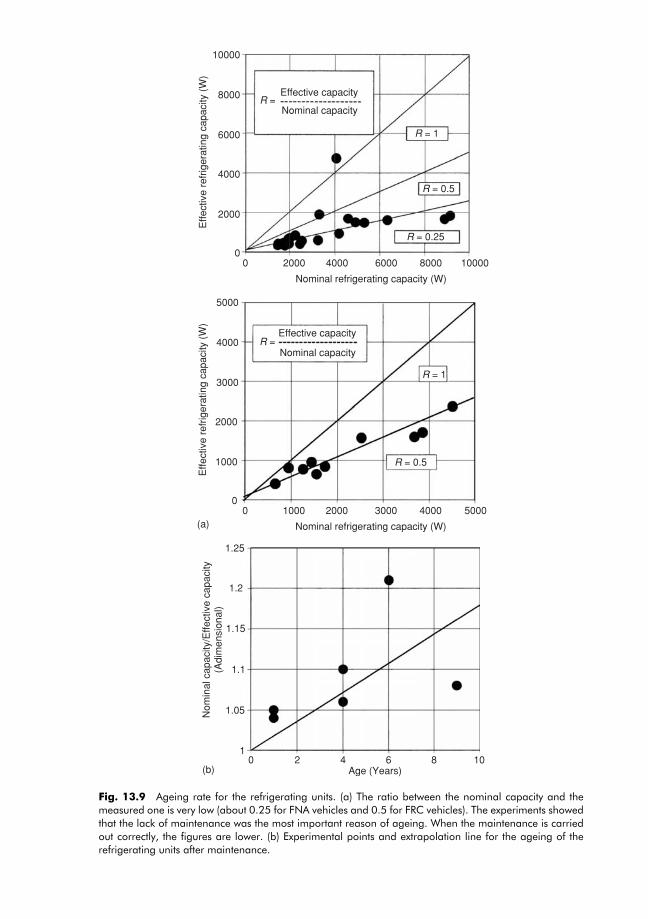
BLUK139-Evans February 6, 2008 15:43
Effective capacity
Nominal capacityR =
R = 1
R = 0.5
R = 0.25
00
2000
4000
2000
4000
6000
8000
10000
6000
Nominal refrigerating capacity (W)
Effe
ctiv
e re
frig
erat
ing
capa
city
(W
)
8000 10000
Effective capacity
Nominal capacityR =
R = 1
R = 0.5
00
1000
2000
1000
2000
3000
4000
5000
3000
Nominal refrigerating capacity (W)
Effe
ctiv
e re
frig
erat
ing
capa
city
(W
)
4000 5000(a)
1.25
1.2
1.15
1.1
1.05
10 2 4
Age (Years)
Nom
inal
cap
acity
/Effe
ctiv
e ca
paci
ty
(Adi
men
sion
al)
6 8 10(b)
Fig. 13.9 Ageing rate for the refrigerating units. (a) The ratio between the nominal capacity and themeasured one is very low (about 0.25 for FNA vehicles and 0.5 for FRC vehicles). The experiments showedthat the lack of maintenance was the most important reason of ageing. When the maintenance is carriedout correctly, the figures are lower. (b) Experimental points and extrapolation line for the ageing of therefrigerating units after maintenance.
287
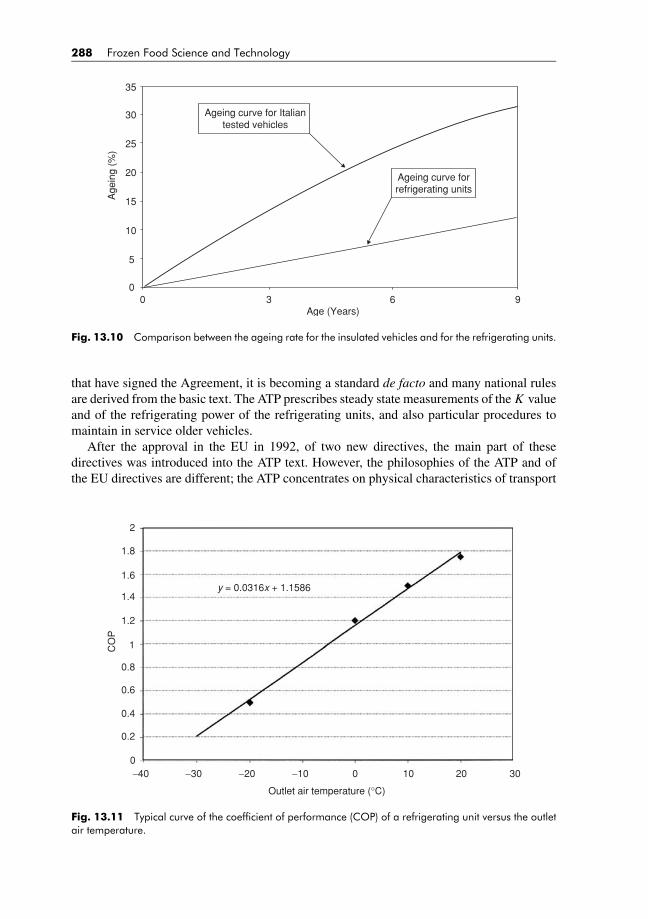
BLUK139-Evans February 6, 2008 15:43
288 Frozen Food Science and Technology
35
Ageing curve for Italian tested vehicles
Ageing curve for refrigerating units
30
25
20
15
10
5
00 3
Age (Years)
Age
ing
(%)
6 9
Fig. 13.10 Comparison between the ageing rate for the insulated vehicles and for the refrigerating units.
that have signed the Agreement, it is becoming a standard de facto and many national rulesare derived from the basic text. The ATP prescribes steady state measurements of the K valueand of the refrigerating power of the refrigerating units, and also particular procedures tomaintain in service older vehicles.
After the approval in the EU in 1992, of two new directives, the main part of thesedirectives was introduced into the ATP text. However, the philosophies of the ATP and ofthe EU directives are different; the ATP concentrates on physical characteristics of transport
2
1.8
1.6y = 0.0316x + 1.1586
1.4
1.2
0.8
0.6
0.4
0.2
0−40 −30 −20 −10 0
Outlet air temperature (°C)
CO
P
10 20 30
1
Fig. 13.11 Typical curve of the coefficient of performance (COP) of a refrigerating unit versus the outletair temperature.
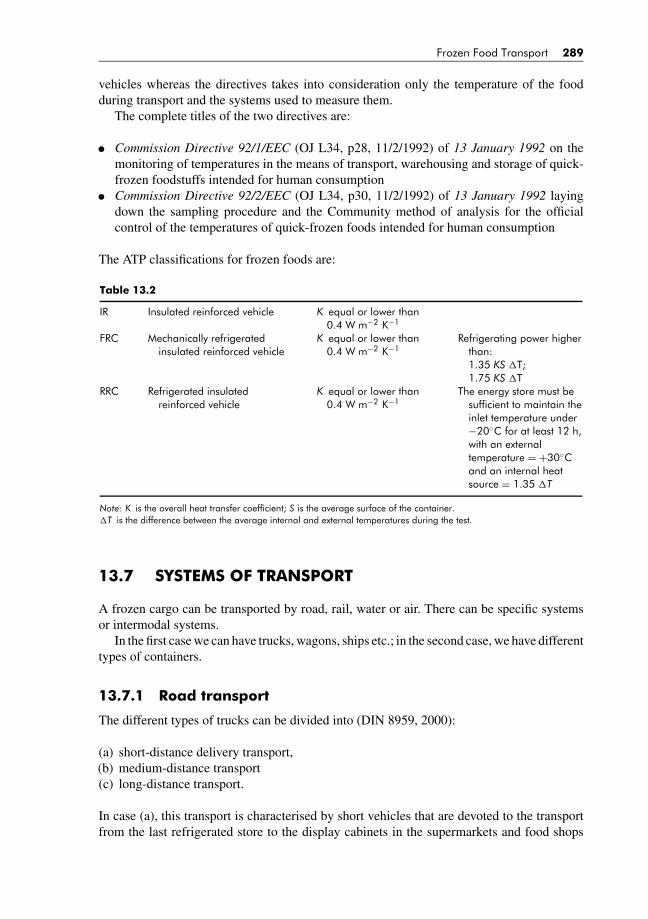
BLUK139-Evans February 6, 2008 15:43
Frozen Food Transport 289
vehicles whereas the directives takes into consideration only the temperature of the foodduring transport and the systems used to measure them.
The complete titles of the two directives are:� Commission Directive 92/1/EEC (OJ L34, p28, 11/2/1992) of 13 January 1992 on themonitoring of temperatures in the means of transport, warehousing and storage of quick-frozen foodstuffs intended for human consumption� Commission Directive 92/2/EEC (OJ L34, p30, 11/2/1992) of 13 January 1992 layingdown the sampling procedure and the Community method of analysis for the officialcontrol of the temperatures of quick-frozen foods intended for human consumption
The ATP classifications for frozen foods are:
Table 13.2
IR Insulated reinforced vehicle K equal or lower than0.4 W m−2 K−1
FRC Mechanically refrigeratedinsulated reinforced vehicle
K equal or lower than0.4 W m−2 K−1
Refrigerating power higherthan:1.35 KS �T;1.75 KS �T
RRC Refrigerated insulatedreinforced vehicle
K equal or lower than0.4 W m−2 K−1
The energy store must besufficient to maintain theinlet temperature under−20◦C for at least 12 h,with an externaltemperature = +30◦Cand an internal heatsource = 1.35 �T
Note: K is the overall heat transfer coefficient; S is the average surface of the container.�T is the difference between the average internal and external temperatures during the test.
13.7 SYSTEMS OF TRANSPORT
A frozen cargo can be transported by road, rail, water or air. There can be specific systemsor intermodal systems.
In the first case we can have trucks, wagons, ships etc.; in the second case, we have differenttypes of containers.
13.7.1 Road transport
The different types of trucks can be divided into (DIN 8959, 2000):
(a) short-distance delivery transport,(b) medium-distance transport(c) long-distance transport.
In case (a), this transport is characterised by short vehicles that are devoted to the transportfrom the last refrigerated store to the display cabinets in the supermarkets and food shops
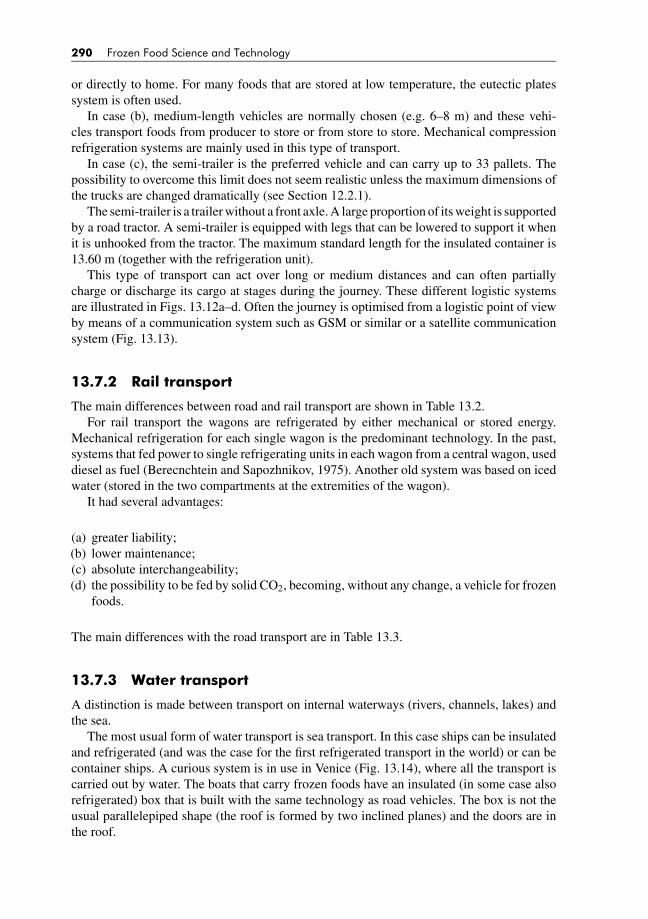
BLUK139-Evans February 6, 2008 15:43
290 Frozen Food Science and Technology
or directly to home. For many foods that are stored at low temperature, the eutectic platessystem is often used.
In case (b), medium-length vehicles are normally chosen (e.g. 6–8 m) and these vehi-cles transport foods from producer to store or from store to store. Mechanical compressionrefrigeration systems are mainly used in this type of transport.
In case (c), the semi-trailer is the preferred vehicle and can carry up to 33 pallets. Thepossibility to overcome this limit does not seem realistic unless the maximum dimensions ofthe trucks are changed dramatically (see Section 12.2.1).
The semi-trailer is a trailer without a front axle. A large proportion of its weight is supportedby a road tractor. A semi-trailer is equipped with legs that can be lowered to support it whenit is unhooked from the tractor. The maximum standard length for the insulated container is13.60 m (together with the refrigeration unit).
This type of transport can act over long or medium distances and can often partiallycharge or discharge its cargo at stages during the journey. These different logistic systemsare illustrated in Figs. 13.12a–d. Often the journey is optimised from a logistic point of viewby means of a communication system such as GSM or similar or a satellite communicationsystem (Fig. 13.13).
13.7.2 Rail transport
The main differences between road and rail transport are shown in Table 13.2.For rail transport the wagons are refrigerated by either mechanical or stored energy.
Mechanical refrigeration for each single wagon is the predominant technology. In the past,systems that fed power to single refrigerating units in each wagon from a central wagon, useddiesel as fuel (Berecnchtein and Sapozhnikov, 1975). Another old system was based on icedwater (stored in the two compartments at the extremities of the wagon).
It had several advantages:
(a) greater liability;(b) lower maintenance;(c) absolute interchangeability;(d) the possibility to be fed by solid CO2, becoming, without any change, a vehicle for frozen
foods.
The main differences with the road transport are in Table 13.3.
13.7.3 Water transport
A distinction is made between transport on internal waterways (rivers, channels, lakes) andthe sea.
The most usual form of water transport is sea transport. In this case ships can be insulatedand refrigerated (and was the case for the first refrigerated transport in the world) or can becontainer ships. A curious system is in use in Venice (Fig. 13.14), where all the transport iscarried out by water. The boats that carry frozen foods have an insulated (in some case alsorefrigerated) box that is built with the same technology as road vehicles. The box is not theusual parallelepiped shape (the roof is formed by two inclined planes) and the doors are inthe roof.

BLUK139-Evans February 6, 2008 15:43
FRC
(a)
FN
AIN
FR
C
FNA
INF
RC
FRC
(b)
FRC
(c)
Fig. 13.12 Different schemes of transport of frozen foods. (a) Standard circulation of semi-trailers ofdifferent owners for different producers, stores and shops. (b) Typical circulation for multi-compartmentvehicles: the logistic simplification is evident. (c) The roll containers circulation: only the phase of the deliveryto the shops is changed with reference to the situation (a). (d) Typical circulation for home delivery vehicles.The owner of the vehicles is also the producer of the frozen foods or the vehicles are in exclusive servicefor the producer. (e) Legend for the previous schemes.
291
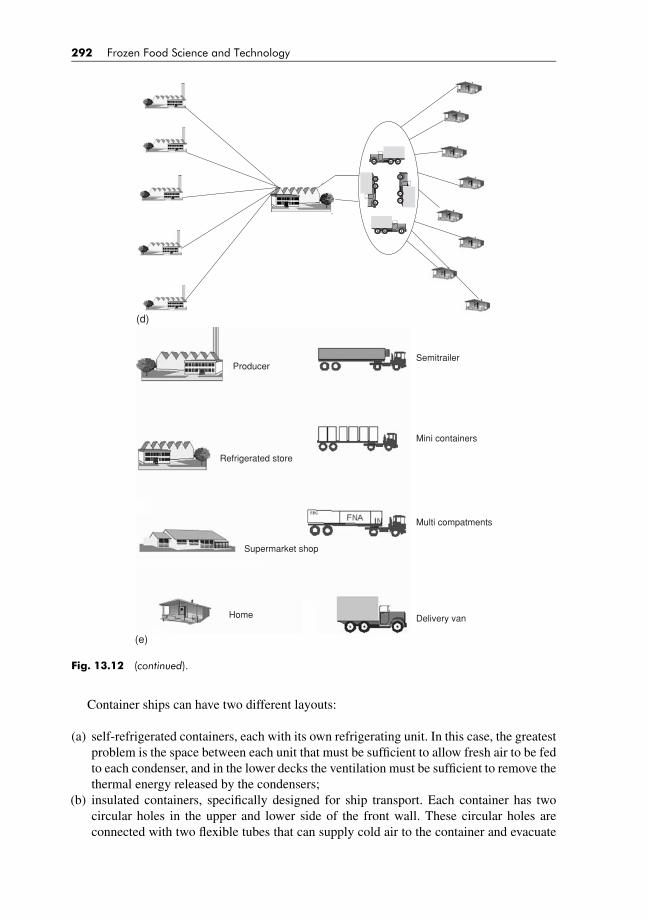
BLUK139-Evans February 6, 2008 15:43
292 Frozen Food Science and Technology
FRC
(d)
Producer
Refrigerated store
Supermarket shop
Home
Semitrailer
Mini containers
Multi compatments
Delivery van
(e)
Fig. 13.12 (continued).
Container ships can have two different layouts:
(a) self-refrigerated containers, each with its own refrigerating unit. In this case, the greatestproblem is the space between each unit that must be sufficient to allow fresh air to be fedto each condenser, and in the lower decks the ventilation must be sufficient to remove thethermal energy released by the condensers;
(b) insulated containers, specifically designed for ship transport. Each container has twocircular holes in the upper and lower side of the front wall. These circular holes areconnected with two flexible tubes that can supply cold air to the container and evacuate
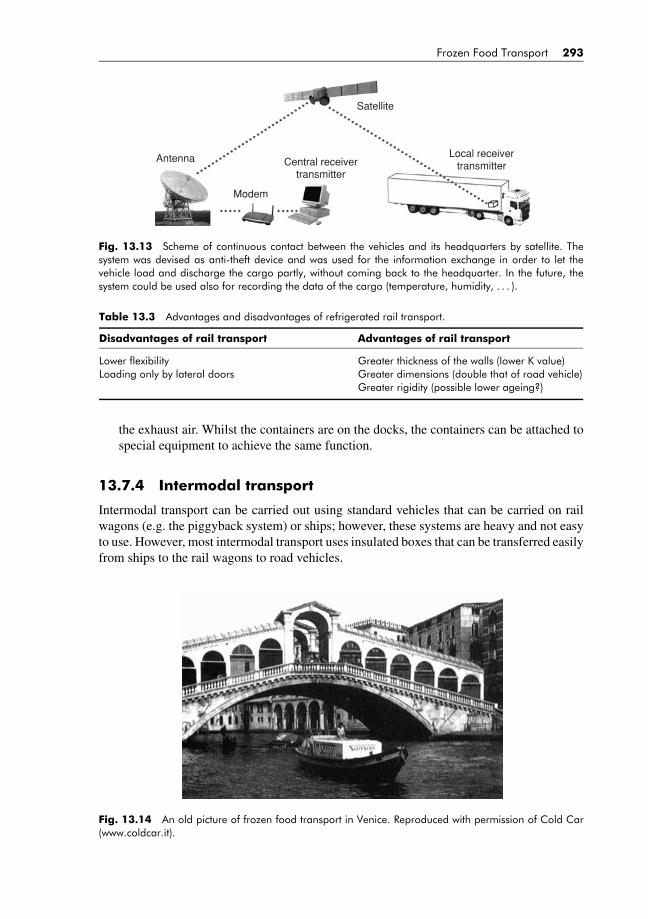
BLUK139-Evans February 6, 2008 15:43
Frozen Food Transport 293
Antenna
Modem
Satellite
Local receivertransmitterCentral receiver
transmitter
Fig. 13.13 Scheme of continuous contact between the vehicles and its headquarters by satellite. Thesystem was devised as anti-theft device and was used for the information exchange in order to let thevehicle load and discharge the cargo partly, without coming back to the headquarter. In the future, thesystem could be used also for recording the data of the cargo (temperature, humidity, . . . ).
Table 13.3 Advantages and disadvantages of refrigerated rail transport.
Disadvantages of rail transport Advantages of rail transport
Lower flexibility Greater thickness of the walls (lower K value)Loading only by lateral doors Greater dimensions (double that of road vehicle)
Greater rigidity (possible lower ageing?)
the exhaust air. Whilst the containers are on the docks, the containers can be attached tospecial equipment to achieve the same function.
13.7.4 Intermodal transport
Intermodal transport can be carried out using standard vehicles that can be carried on railwagons (e.g. the piggyback system) or ships; however, these systems are heavy and not easyto use. However, most intermodal transport uses insulated boxes that can be transferred easilyfrom ships to the rail wagons to road vehicles.
Fig. 13.14 An old picture of frozen food transport in Venice. Reproduced with permission of Cold Car(www.coldcar.it).

BLUK139-Evans February 6, 2008 15:43
294 Frozen Food Science and Technology
Table 13.4 Classification of the vehicles for the frozen foods transport, as prescribed by ATP.
Type of container UseStandard(dimensions)
Standard (Thermalcharacteristics)
(a) ISO thermal containers Road, rail, water Yes (ISO 1942) Yes (ISO 1492)(b) IATA containers Air, road Yes (but adapted to
each plane)No
(c) Swap bodies Rail, road Yes (UIC) Yes (ATP)(d) Roll containers Road to road No Yes (ATP)(e) Mini containers Road to road No Yes (EN 12571)
These containers can be sub-divided as shown in Table 13.4.
Case (a): the dimensions are standard for width and height (8′) and the length is a multipleof 10′ (to a maximum of 40′). The thermal characteristic required by ISO 1942 isperfectly compatible with ATP. They can be attached to the frame of the vehiclesby four corner fittings and can be stacked in a row of six containers.
Case (b): they are normally not parallelepiped as are adapted to the airplane shape. Insulationis poor (or absent) and the refrigeration can in some cases be solid CO2. The mainthermal problems concern the airport as during the flight the external temperatureis very low.
Case (c): they are movable boxes that can be transferred from railways frames to road framesby mechanical forks or lifts, but they cannot be stacked.
Case (d): they are containers whose maximal dimension does not exceed 2 m, without anysystem for moving and blocking. They can be insulated but also refrigerated (me-chanical systems, Peltier systems, and CO2 systems). An example of a roll containeris shown in Fig. 13.15. Roll containers are not standardised and there is some doubtthat they can be considered ATP vehicles; a proposal to introduce the roll containerinto the ATP is under discussion. Their structure can be similar to that of roadvehicles (assembling from sandwich panels) or can be made by a ‘rotomouldingsystem’. The typical characteristic of this system is the construction of an externalshell for the insulating foam by moulding polyethylene in big boxes that by rotat-ing, can generate a cave shell in a monolithic system. The shell can be filled bypolyurethane, expanded in situ, while the walls are contained in a rigid system toavoid deformations during the expansion (Panozzo et al., 2006).
Case (e): they are similar to the roll containers but cannot be defined as vehicles. The issueof where to put the border between a real transport systems and simple packagingsystems is subject of an ongoing debate. This problem impacts on the standardtests for these boxes. ATP standards can be used or specific standards such asEN 12571. The philosophies of the two standards are completely different. WhileATP requires steady state measurements of the global heat transfer coefficient, EN12571 requires only transient tests concerning the time that a certain quantity ofa specific material can be maintained at a temperature higher (or lower) than aspecific value. A typical EN 12571 test is reported in Fig. 13.16.
The main advantage of the use of mini containers is that the container can be filled directlyin the cold store and opened directly at the end destination, without any break in the cold

BLUK139-Evans February 6, 2008 15:43
(a)
(b)
Qui
ck p
ipe
join
t for
the
inle
t of t
he s
now
Pla
stic
insu
late
d pl
ate
(onl
y fo
r pr
oduc
ts to
be
stor
ed o
ver
C)
Air
circ
ulat
ion
chan
nels
Tan
k fo
r th
e dr
y ic
e sn
ow
(sol
id C
O2)
Fig
.13.1
5Ro
llco
ntai
ner
pict
ure,
and
sche
mat
icof
itspr
inci
palc
ompo
nent
s.
295
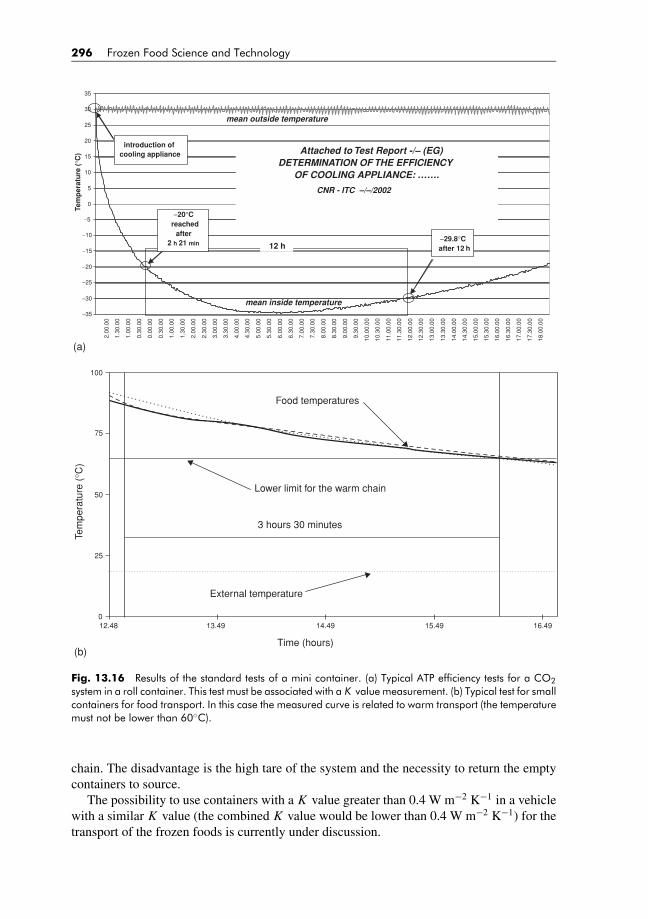
BLUK139-Evans February 6, 2008 15:43
296 Frozen Food Science and Technology
−35
−30
−25
−20
−15
−10
−5
0
5
10
15
20
25
30
35
2.00
.00
1.30
.00
1.00
.00
0.30
.00
0.00
.00
0.30
.00
1.00
.00
1.30
.00
2.00
.00
2.30
.00
3.00
.00
3.30
.00
4.00
.00
4.30
.00
5.00
.00
5.30
.00
6.00
.00
6.30
.00
7.00
.00
7.30
.00
8.00
.00
8.30
.00
9.00
.00
9.30
.00
10.0
0.00
10.3
0.00
11.0
0.00
11.3
0.00
12.0
0.00
12.3
0.00
13.0
0.00
13.3
0.00
14.0
0.00
14.3
0.00
15.0
0.00
15.3
0.00
16.0
0.00
16.3
0.00
17.0
0.00
17.3
0.00
18.0
0.00
12 h
introduction ofcooling appliance Attached to Test Report -/– (EG)
DETERMINATION OF THE EFFICIENCYOF COOLING APPLIANCE: …….
CNR - ITC –/–/2002
−20°Creached
after2 h 21 min
−29.8°Cafter 12 h
mean outside temperature
mean inside temperature
Tem
per
atu
re (
°C)
(a)
Food temperatures
Lower limit for the warm chain
3 hours 30 minutes
External temperature
Time (hours)
Tem
pera
ture
(°C
)
12.480
25
50
75
100
14.4913.49 15.49 16.49
(b)
Fig. 13.16 Results of the standard tests of a mini container. (a) Typical ATP efficiency tests for a CO2system in a roll container. This test must be associated with a K value measurement. (b) Typical test for smallcontainers for food transport. In this case the measured curve is related to warm transport (the temperaturemust not be lower than 60◦C).
chain. The disadvantage is the high tare of the system and the necessity to return the emptycontainers to source.
The possibility to use containers with a K value greater than 0.4 W m−2 K−1 in a vehiclewith a similar K value (the combined K value would be lower than 0.4 W m−2 K−1) for thetransport of the frozen foods is currently under discussion.

BLUK139-Evans February 6, 2008 15:43
Frozen Food Transport 297
13.8 ENERGY LABELLING
The energy labelling system is widely used for domestic appliances and is mandatory inseveral countries, including the EU.
Using as a basis an energy labelling scheme for refrigerated display cabinets, a labellingscheme for transport vehicles was studied and adopted. The basic value for the labelling wasthe K value with the results from the air-tightness test added (van Gerwen et al., 1999). Thebasic philosophy was that no expensive measurement should be required. Only a very simplemeasure of the absorption coefficient of the external surface was proposed. All the otherparameters were derived from geometrical considerations and from the presence or absenceof some installations (e.g. bulk head, air ducts). The transport vehicle was classified using twodifferent and separate labels: one connected to the insulation and the other to the refrigeratingunit. . The largest problem was the effect of ageing which could not be predicted: the energyconsumption of a refrigerated vehicle is mostly dependent on the aged K coefficient, butthis value cannot be forecast for a new vehicle, at least at the actual stage of the technology.This issue is currently being studied by a number of organisations and countries (GermanGovernment, Germanischer Lloyds, Transfrigoroute International, International Institute ofRefrigeration).
13.9 LIMIT VALUES
13.9.1 Global heat transfer coefficients
The recommended K values for frozen and fresh foods are 0.4 and 0.7 W m−2 K−1, re-spectively. Much discussion is on (especially regarding the K value for frozen foods) thedifficulties in obtaining these K values using normal lateral wall thicknesses and the almostpractical impossibility of maintaining these values after 6 years of service (the ATP prescribesthe first check of in-service vehicles after 6 yr).
Theoretically, these K values should be justified by some physical reason connected withthe physical and biological changes during the transport of foodstuffs. However, the valuesappear to be based on the fact that historically pallets were not widely used and 100 mmof cork was the main form of insulation. Plotting the K values that are possible in theseconditions (Fig. 13.17) we find the values are very close to the standard limits.
Although K values are based on what was physically achievable with early vehicles ratherthan on any physiological changes in the food there are good reasons to maintain low Kvalues. These include:
(a) the possibility of contact between frozen foods and walls (see paragraph 12.1, point c);(b) being able to maintain food temperature during any breakdowns or increased heat loads
on the vehicle;(c) reduced heat gain from ambient and consequently reduced refrigerating power and energy
consumption.
13.9.2 Safety coefficient
The refrigeration unit safety coefficient is currently 1.75 (the refrigerating power must behigher than 1.75 KS�T), and 1.35 for an efficiency test. The value 1.35 was an empirical
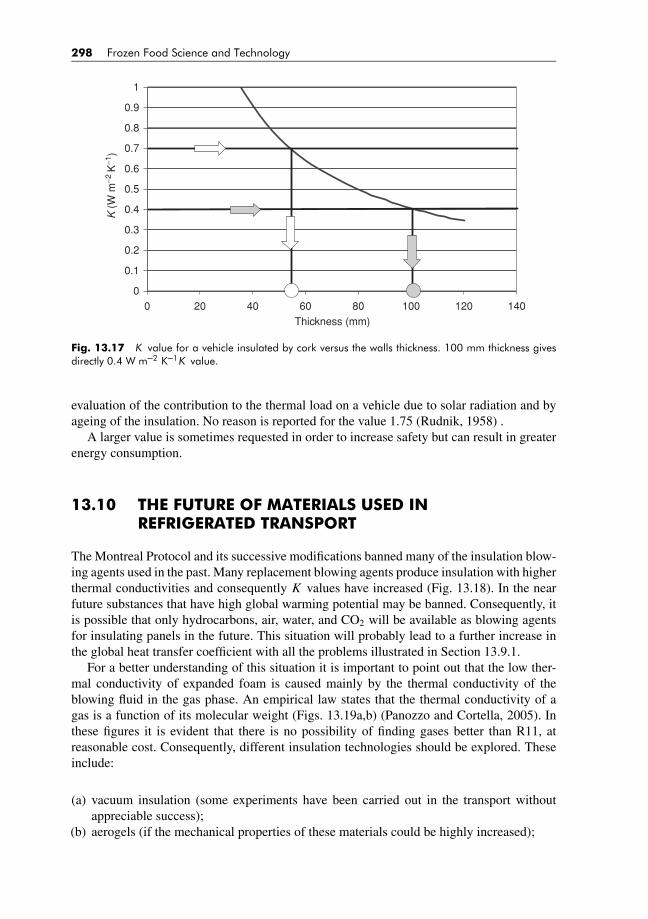
BLUK139-Evans February 6, 2008 15:43
298 Frozen Food Science and Technology
0
0.1
0.2
0.3
0.4
0.5
0.6
0.7
0.8
0.9
1
0 20 40 60 80 100 120 140Thickness (mm)
K (
W m
−2 K
−1)
Fig. 13.17 K value for a vehicle insulated by cork versus the walls thickness. 100 mm thickness givesdirectly 0.4 W m–2 K–1K value.
evaluation of the contribution to the thermal load on a vehicle due to solar radiation and byageing of the insulation. No reason is reported for the value 1.75 (Rudnik, 1958) .
A larger value is sometimes requested in order to increase safety but can result in greaterenergy consumption.
13.10 THE FUTURE OF MATERIALS USED INREFRIGERATED TRANSPORT
The Montreal Protocol and its successive modifications banned many of the insulation blow-ing agents used in the past. Many replacement blowing agents produce insulation with higherthermal conductivities and consequently K values have increased (Fig. 13.18). In the nearfuture substances that have high global warming potential may be banned. Consequently, itis possible that only hydrocarbons, air, water, and CO2 will be available as blowing agentsfor insulating panels in the future. This situation will probably lead to a further increase inthe global heat transfer coefficient with all the problems illustrated in Section 13.9.1.
For a better understanding of this situation it is important to point out that the low ther-mal conductivity of expanded foam is caused mainly by the thermal conductivity of theblowing fluid in the gas phase. An empirical law states that the thermal conductivity of agas is a function of its molecular weight (Figs. 13.19a,b) (Panozzo and Cortella, 2005). Inthese figures it is evident that there is no possibility of finding gases better than R11, atreasonable cost. Consequently, different insulation technologies should be explored. Theseinclude:
(a) vacuum insulation (some experiments have been carried out in the transport withoutappreciable success);
(b) aerogels (if the mechanical properties of these materials could be highly increased);

BLUK139-Evans February 6, 2008 15:43
Frozen Food Transport 299
(c) reduction of the insulation cell dimensions (if the cell diameter in the insulating foamcould be reduced by a factor of 100, the thermal conductivity of this hypothetical foamshould be the same of a vacuum foam, and the blowing agent should have no importance,also ageing should be reduced for these materials) (Smoluchowski, 1898) (De Ponte,1987).
Refrigeration system refrigerants
The refrigerants used in the refrigerating units of vehicles have also been affected by the Mon-treal Protocol but the replacement fluids have had little practical effect on the performances
0
0.005
0.01
0.015
0.02
0.025
0.03
0.035
0.04
1994 1996 1998 2000 2002 2004 2006 2008 2010 2012
Years
The
rmal
con
duct
ivity
(W
m−1
K−1
)
Line of the thermal conductivities of the blowing agents
Line of the thermal conductivity of a theoreticalpolyurethane expanded by the listed gases
1996 2004 2005 2010R11 R141b R356mff cPentanoR12 R22 R125 n Pentano
R134a CO2R152a AriaR245caR245ebR365mfc
(a)
0
0.1
0.2
0.3
0.4
0.5
0.6
0.7
0.8
0.9
1
1.1
1994 1996 1998 2000 2002 2004 2006 2008 2010 2012
Years
t = 50mm
t = 70 mm
t = 100mm
1996 2004 2005 2010R11 R141b R356mff cPentanoR12 R22 R125 n Pentano
R134a CO2R152a AriaR245caR245ebR365mfc
ATP limits for the frozen foodsGlo
bal h
eat t
rans
fer
coef
ficie
nt
(b)
Fig. 13.18 Average values respectively for the thermal conductivity of the blowing fluid (gas), of theexpanded polyurethane and of the global heat transfer coefficient for insulated vehicles, when the blowingfluid is changed. It can be seen that it is difficult to be lower than the limit value for frozen especially in thefuture, when some fluids now in use will be probably banned (and this will be impossible with a thicknessof 50–60 mm).
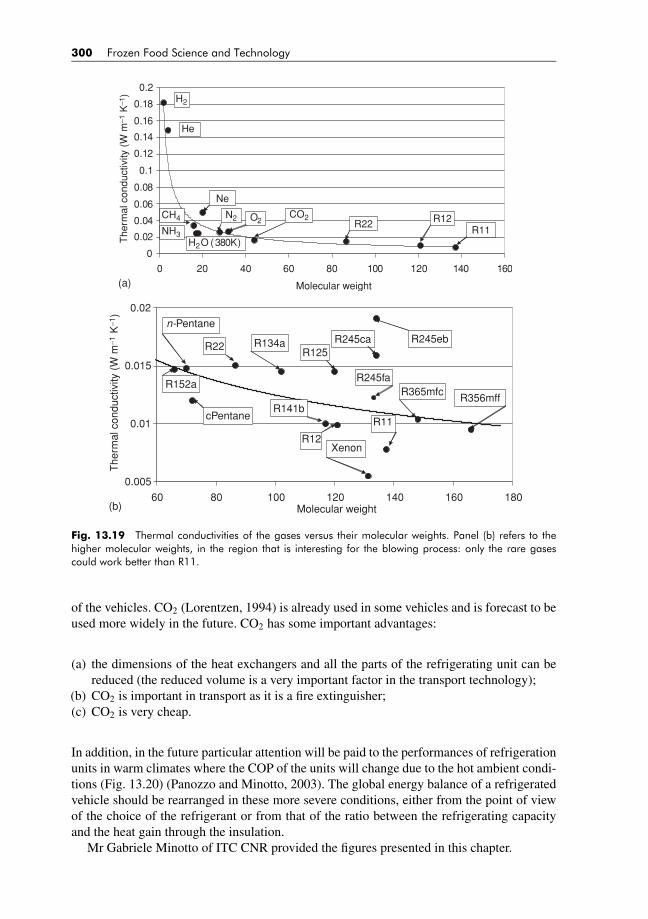
BLUK139-Evans February 6, 2008 15:43
300 Frozen Food Science and Technology
0
0.08
0.06
0.04
0.02
0.1
0.18
0.16
0.14
0.12
0.2
200 40 60 80 100 120 140 160
Molecular weight
The
rmal
con
duct
ivity
(W
m−1
K−1
) H2
He
Ne
CH4
NH3H2O (380 K)
N2 O2CO2
R22 R12R11
(a)
0.005
0.01
0.015
0.02
60 80 100 120 140 160 180Molecular weight
The
rmal
con
duct
ivity
(W
m−1
K−1
)
R152a
R22 R134aR125
R141b
R12
R245ebR245ca
R11
R356mff
n-Pentane
cPentane
R365mfc
Xenon
R245fa
(b)
Fig. 13.19 Thermal conductivities of the gases versus their molecular weights. Panel (b) refers to thehigher molecular weights, in the region that is interesting for the blowing process: only the rare gasescould work better than R11.
of the vehicles. CO2 (Lorentzen, 1994) is already used in some vehicles and is forecast to beused more widely in the future. CO2 has some important advantages:
(a) the dimensions of the heat exchangers and all the parts of the refrigerating unit can bereduced (the reduced volume is a very important factor in the transport technology);
(b) CO2 is important in transport as it is a fire extinguisher;(c) CO2 is very cheap.
In addition, in the future particular attention will be paid to the performances of refrigerationunits in warm climates where the COP of the units will change due to the hot ambient condi-tions (Fig. 13.20) (Panozzo and Minotto, 2003). The global energy balance of a refrigeratedvehicle should be rearranged in these more severe conditions, either from the point of viewof the choice of the refrigerant or from that of the ratio between the refrigerating capacityand the heat gain through the insulation.
Mr Gabriele Minotto of ITC CNR provided the figures presented in this chapter.

BLUK139-Evans February 6, 2008 15:43
Frozen Food Transport 301
1.2
1.4
1.6
1.8
2
2.2
2.4
2.6
2.8
30 35 40 45 50 55 60Condensation temperature (°C)
CO
P (
adim
ensi
onal
)
R404
R 717R 717
R410
R134 a
R22R 290
Fig. 13.20 COP referred to the most used refrigerants versus the condensation temperature. Clearly, thecondensation temperature is a function of the external air temperature. When the external air temperatureis increasing, the COP is decreasing with a different slope. If we do not take into account R717 (Ammonia)and R22 (possible future ban), the performances of the other fluids are diverging more and more withincreasing temperature. The best performances of R134a at high temperatures could explain its wider usein marine containers.
REFERENCES
Amodio, U. and Cioffi, E. (1985). T.W.V. experiments – decisive conclusions reached. In: Proceedings of theMeetings of Commissions D2, D3 IIR and International Center for Transportation Studies, Roma. March13–15, pp. 31–48.
Ba, A. (1991). Studio di un sistema di accumulo termico per un frigorifero domestico fotovoltaico per utilizzoin climi caldi. (Study of a thermal storage system for a domestic photovoltaic refrigerator to be used inwarm climate). Il Freddo. November–December 1991, 45(6), 588–595.
Bachmaier, W. and Bornschlegl, A. (1965). The influence of air leakage on the K-factor of special equipmentfor the road transport of perishable foodstuffs. Bull IIF-IIR Annexe 65-3, Cracow, 135–147.
Berecnchtein, M.G. and Sapozhnikov, S.A. (1975). Nouvelle section frigorifique a cinq wagons pour letransport ferroviaire del l’URSS. In: Proceedings of the XIV International Congress of Refrigeration.Moscow. pp. 335–344.
Bodenheimer, B.A. Coping with air exchange. Refrigerated Transporter. June 77, 32–34.Boldrin, B., Minotto, G., Panozzo, G., Toniolo, B. and Varotto, G. (1990). Ageing of insulated vehicles.
statistical elaboration of tests results. Boldrin, B. et al. (1990). Ageing of insulated vehicles. statisticalelaboration of tests results. IIF-IIR Commission B2,C2, D1, D2/3, Dresden 1990–9.
Boldrin, B., Minotto, G., Panozzo, G., Toniolo, B. and Varotto, G. (1991). Propane as an alternative refrigerantin foodstuffs transport. In: Proceedings of the XVIII International Congress of Refrigeration, Vol. 4.
Montreal. pp. 2062–2067.De Ponte, F. (1987). Ricerca sui materiali isolanti: stato dell’arte e prospettive. (Today research on insulating
materials and an insight into the future). La Termotecnica, May pp. 25–30.DIN 8959. Insulated food carriers, 2000-9.Engelking, S. and Kruse, H. (1996). Development of air cycle technology for transport refrigeration. Pro-
ceedings of the 1996 International Refrigeration Conference, Purdue University.; pp. 349–356.

BLUK139-Evans February 6, 2008 15:43
302 Frozen Food Science and Technology
Giuri, S. (2006). Analisi statistica sulla velocita di degrado delle caratteristiche termiche dei veicoli isolate;(Statistical analysis about the ageing velocity the thermal characteristics of insulated vehicles). DegreeThesis. University of Padova DFT. 10 March.
Grosskopf, P. (1982). Zur Whal der richtigen Transportkaelteanlage. DKV Tagungsbericht. 9. Jahrgang .Essen. 407–427.
Heap, R.D. (2000). Transport refrigeration: maintaining and enhancing living standards. Temperature 22(7),19–20 (2000.07).
IIR (1995). Guide to refrigerated transport.IIR (1999). Control of the cold chain for quick-frozen foods handbook.ISO. (1996). 1496-2 E. Series 1, Freight Containers —Specification and testing— Part 2: Thermal containers.
p. 51.Kauffeld, M. (1996). The use of hydrocarbons in transport cooling. KI Luft Kaltetech 32(3), 107–110.Klempner, D. and Frisch, K.C. (1991). Polimeric Foams. Hanser Publishers, p. 41.Lorentzen, G. (1994). Revival of carbon dioxide as a refrigerant. International Journal of Refrigeration 17(5),
292–301.Meffert, H.F.Th. (1975). Recent developments in the transport of perishable under refrigeration. In: Proceed-
ings of the XIV International Congress of Refrigeration, Moscow pp. 301–320.Micheletto, A. and Rosso, G. (2005). State-of-the-art of low-temperature delivery bodies using a two-stage
transcritical carbon dioxide cycle: development and applications + erratum. Bull. IIF-IIR, March, 85(2005-3), pp. 4–15.
Panozzo, G. (1999). Parameters affecting the ageing of the insulated vehicles. In: XX International Congressof Refrigeration. Sydney. 1999.
Panozzo, G. and Cortella, G. (2005). Refrigerated transport of deep frozen foods: problems with the materialsfor thermal insulation after the international ban of the HCFC’S. EUROFREEZE 2005: Individual QuickFreezing of Foods. Sofia Bulgaria. Jan 13–15.
Panozzo, G. and Cortella, G. (2006). Connections between standards and technologies in perishable foodstuffstransport. In: Proceedings of the 3rd Central European Congress on Food, Sofia (Bulgaria). pp. 1–8, 22–24maggio.
Panozzo, G. and Minotto, G. (2003). The refrigerated transport in warm countries. Short course about‘Refrigerated Transport’. In: 21st Intenational Congress of Refrigeration. USA: Washington D.C.August 17–22.
Panozzo, G., Amantia, M., Barizza, A. and Rossi, S. (2003). Ageing of mechanical refrigerating units forrefrigerated transport. In: 21st Intenational Congress of Refrigeration. Washington D.C. August 17–22.
Panozzo, G., Minotto, G., Martini, R. and Giordana, E. (2006). Dry ice snow in mini containers. InnovativeEquipment and Systems for Comfort and Food Preservation. New Zealand: Auckland. February 16–18.
Panozzo, G., Boldrin, B., Minotto, G., Toniolo, B. and Biancardi, N. Ageing of insulated vehicles. theoreticalmodel and experimental analysis. In: XIX International Congress of Refrigeration, Vol. II. The Hague 95.pp. 583–589.
Rudnik, H.E. (1958). Die entwicklung von kaeltesaetzen fuer schienen- und strassenfahrzeuge. (Developmentof refrigerating plants for railway and trucks). Kaeltetechnik. 10 Jarhgang Heft 8/1958, pp. 244–248.
Schausberger, H., Kriha, J. and Zellhofer, J. (1969). Investigations into the problem of leakage of refrigeratorvans at the international vehicle testing station of ORE/UIC in Vienna. Bull IIF-IIR Annexe 69-3, Vienna,133–142.
Smoluchowski, M. (1898). On conduction of heat by rarefied gases. Philosophical Magazine, Vol. 46pp. 192–206. Available from http://en.wikipedia.org/wiki/Marian Smoluchowski.
Spence, S.W.T., Doran, W.J. and Artt, D.W. (2005). Performance analysis of a feasible air-cycle refrigerationsystem for road transport. International Journal of Refrigeration 28(3), 381–388.
Stimat and National Research Council Italy. (1982). Agrotrans.Tiedemann, T. and Kruse, H. (1994). Long-term solutions with hydrocarbons. Purdue Refrig. Short Course
266–308.van Gerwen, R.J.M., van der Sluis, S.M., Schiphouwer, H., Bennahmias, R., David, R., Guilpart, J., Slama, T.
and Panozzo, G. (1999). Energy labelling of refrigerated transport equipment. Final report. TNO Report.TNO-MEP–R 99/065. February.
United Nations Economic Commission for Europe, Inland Transport Committee. (1970). Agreement on theInternational Carriage of Perishable Foodstuffs and on the Special Equipment to be used for such Carriage.Geneva: United Nations. Including amendments thereto up to Sept 2003. p. 81.
Wenk, C. (1976). Befoerderung im Werksverher. Besondere befoerderungsmittel fuer leicht verderblicheLebensmittel. 11 Teil II, 1976-TUEV. 102–114.
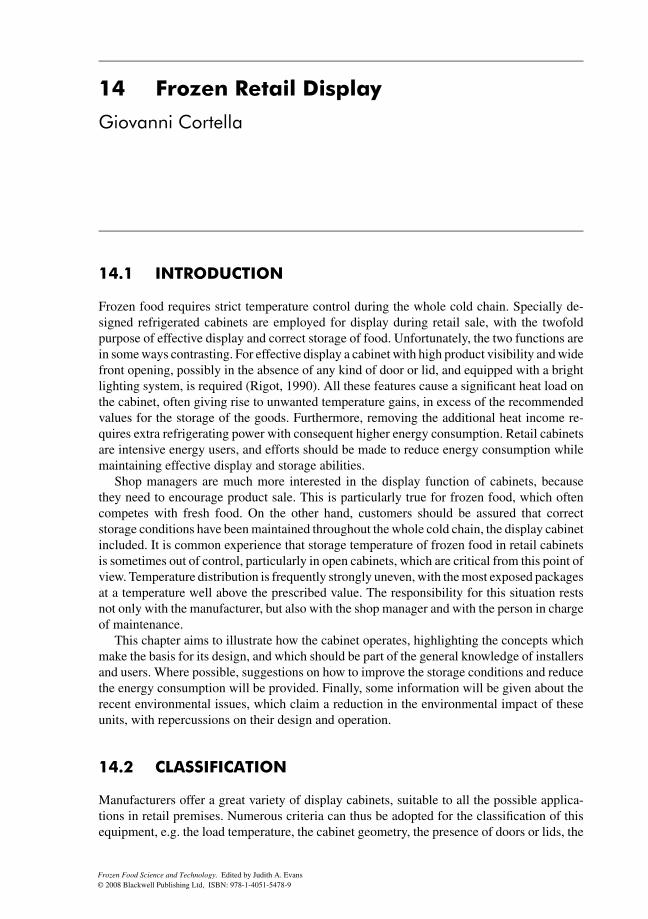
BLUK139-Evans January 23, 2008 17:45
14 Frozen Retail Display
Giovanni Cortella
14.1 INTRODUCTION
Frozen food requires strict temperature control during the whole cold chain. Specially de-signed refrigerated cabinets are employed for display during retail sale, with the twofoldpurpose of effective display and correct storage of food. Unfortunately, the two functions arein some ways contrasting. For effective display a cabinet with high product visibility and widefront opening, possibly in the absence of any kind of door or lid, and equipped with a brightlighting system, is required (Rigot, 1990). All these features cause a significant heat load onthe cabinet, often giving rise to unwanted temperature gains, in excess of the recommendedvalues for the storage of the goods. Furthermore, removing the additional heat income re-quires extra refrigerating power with consequent higher energy consumption. Retail cabinetsare intensive energy users, and efforts should be made to reduce energy consumption whilemaintaining effective display and storage abilities.
Shop managers are much more interested in the display function of cabinets, becausethey need to encourage product sale. This is particularly true for frozen food, which oftencompetes with fresh food. On the other hand, customers should be assured that correctstorage conditions have been maintained throughout the whole cold chain, the display cabinetincluded. It is common experience that storage temperature of frozen food in retail cabinetsis sometimes out of control, particularly in open cabinets, which are critical from this point ofview. Temperature distribution is frequently strongly uneven, with the most exposed packagesat a temperature well above the prescribed value. The responsibility for this situation restsnot only with the manufacturer, but also with the shop manager and with the person in chargeof maintenance.
This chapter aims to illustrate how the cabinet operates, highlighting the concepts whichmake the basis for its design, and which should be part of the general knowledge of installersand users. Where possible, suggestions on how to improve the storage conditions and reducethe energy consumption will be provided. Finally, some information will be given about therecent environmental issues, which claim a reduction in the environmental impact of theseunits, with repercussions on their design and operation.
14.2 CLASSIFICATION
Manufacturers offer a great variety of display cabinets, suitable to all the possible applica-tions in retail premises. Numerous criteria can thus be adopted for the classification of thisequipment, e.g. the load temperature, the cabinet geometry, the presence of doors or lids, the
Frozen Food Science and Technology. Edited by Judith A. Evans
© 2008 Blackwell Publishing Ltd, ISBN: 978-1-4051-5478-9
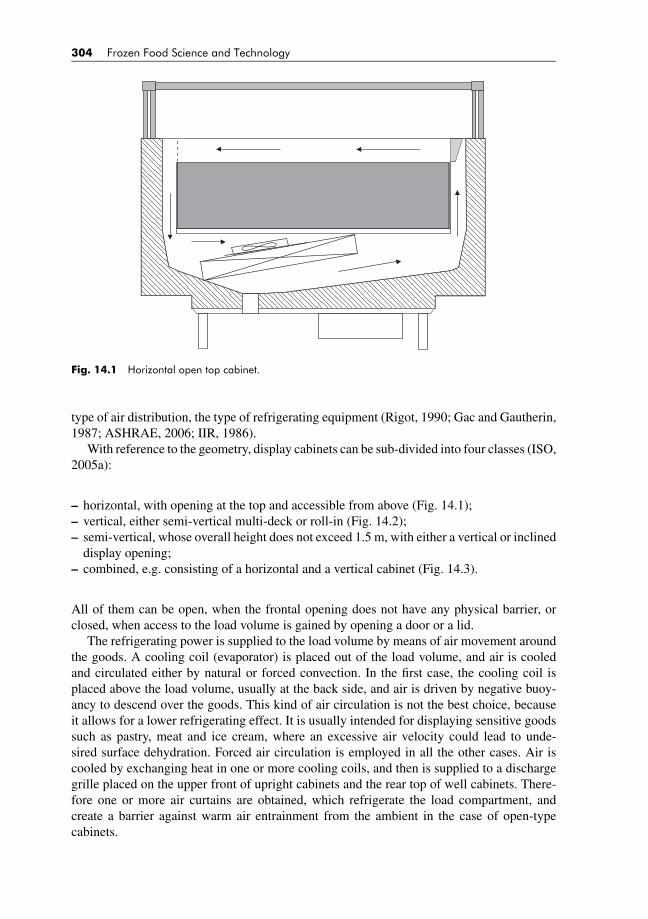
BLUK139-Evans January 23, 2008 17:45
304 Frozen Food Science and Technology
Fig. 14.1 Horizontal open top cabinet.
type of air distribution, the type of refrigerating equipment (Rigot, 1990; Gac and Gautherin,1987; ASHRAE, 2006; IIR, 1986).
With reference to the geometry, display cabinets can be sub-divided into four classes (ISO,2005a):
– horizontal, with opening at the top and accessible from above (Fig. 14.1);– vertical, either semi-vertical multi-deck or roll-in (Fig. 14.2);– semi-vertical, whose overall height does not exceed 1.5 m, with either a vertical or inclined
display opening;– combined, e.g. consisting of a horizontal and a vertical cabinet (Fig. 14.3).
All of them can be open, when the frontal opening does not have any physical barrier, orclosed, when access to the load volume is gained by opening a door or a lid.
The refrigerating power is supplied to the load volume by means of air movement aroundthe goods. A cooling coil (evaporator) is placed out of the load volume, and air is cooledand circulated either by natural or forced convection. In the first case, the cooling coil isplaced above the load volume, usually at the back side, and air is driven by negative buoy-ancy to descend over the goods. This kind of air circulation is not the best choice, becauseit allows for a lower refrigerating effect. It is usually intended for displaying sensitive goodssuch as pastry, meat and ice cream, where an excessive air velocity could lead to unde-sired surface dehydration. Forced air circulation is employed in all the other cases. Air iscooled by exchanging heat in one or more cooling coils, and then is supplied to a dischargegrille placed on the upper front of upright cabinets and the rear top of well cabinets. There-fore one or more air curtains are obtained, which refrigerate the load compartment, andcreate a barrier against warm air entrainment from the ambient in the case of open-typecabinets.
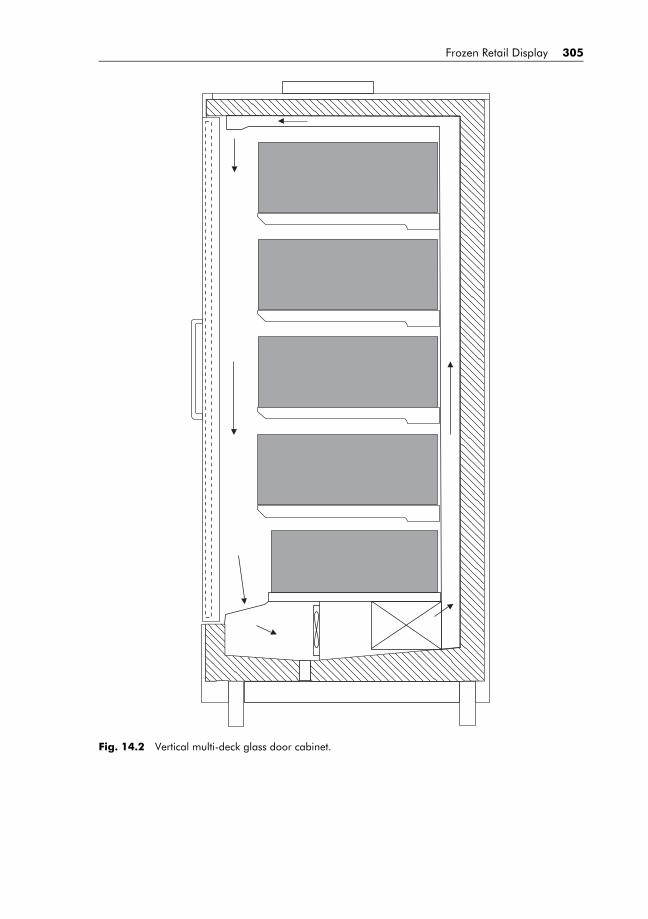
BLUK139-Evans January 23, 2008 17:45
Frozen Retail Display 305
Fig. 14.2 Vertical multi-deck glass door cabinet.
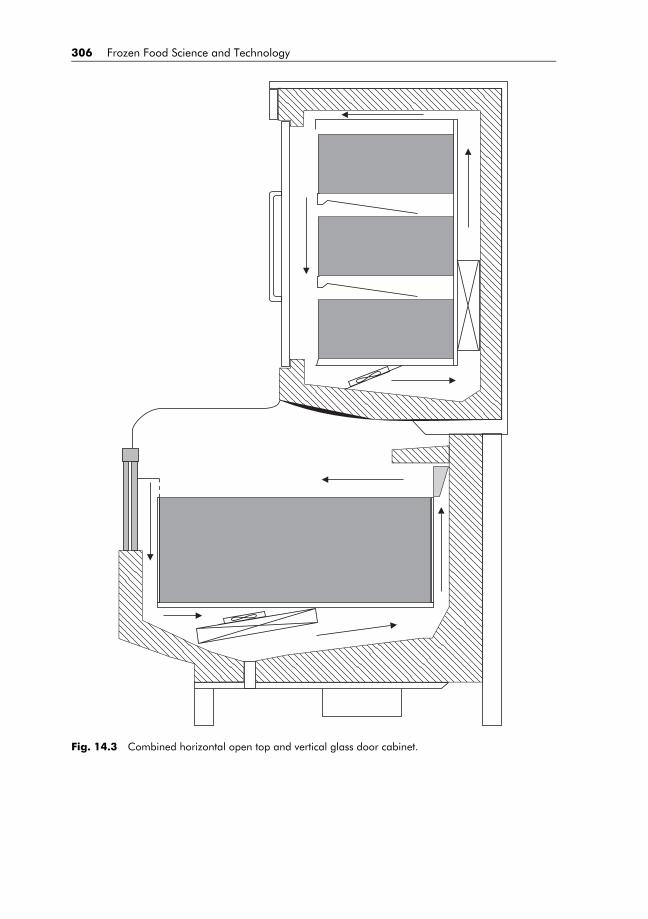
BLUK139-Evans January 23, 2008 17:45
306 Frozen Food Science and Technology
Fig. 14.3 Combined horizontal open top and vertical glass door cabinet.

BLUK139-Evans January 23, 2008 17:45
Frozen Retail Display 307
When frozen food has to be displayed, only a small number of classes of cabinets canbe effectively used. First of all, frozen food sale is essentially a self-service sale, thereforeserve-over counters are not considered. Second, when temperature in the load compartment isaround −20◦C, heat is exchanged to a great extent with the external ambient, by conduction,air entrainment and radiation. A huge amount of refrigerating power is necessary, whichcannot usually be exchanged by natural convection, thus requiring forced air circulation. Inorder to establish optimal storage conditions for the goods and reduce the energy consumptionas much as possible, horizontal cabinets are preferred. In this case, due to air stratification,infiltration of ambient air is low and as for open units, and major part of the heating load is dueto radiant heat. Unfortunately, the display function is less effective, because only the upperlayer of products is visible by the customer, and the ratio load volume/floor space is not toogood. Horizontal cabinets are preferred for high-turnover products, and for soft-packagedproducts, which are best stacked horizontally. The alternative option for a best display isrepresented by vertical multi-deck cabinets. Some vertical cabinets for frozen food are notfitted with any door or lid and in this case the warm air entrainment from the ambient becomescritical, the energy consumption is probably the highest among all the cabinets, and the correctstorage conditions are difficult to guarantee. To prevent uninterrupted air entrainment fromthe ambient, vertical cabinets for frozen food are commonly fitted with glass doors, whichare sometimes treated with a reflective external layer to reduce radiant heat exchange.
Temperature requirements are almost all common for frozen foods, with the exceptionof ice creams which require a lower storage temperature (−20 to −24◦C) (ASHRAE, 2006;IIR, 1986) and specifically designed cabinets for serving soft ice cream at −15± 1◦C (oftenreferred to as ‘dipping cabinets’). These units are open at the rear, to allow staff to scoop icecream portions. Cooling of the upper side of the ice cream containers is crucial in these units,because melting due to radiant heat must be avoided, while reducing temperature fluctuationsto prevent ice crystals growth.
In the following sections horizontal open or closed cabinets, and vertical closed cabinetswill be considered, which are the most widely used units for frozen food display.
14.3 DESIGN
According to the vocabulary of the EN 23953 Standard (ISO, 2005a), a refrigerated dis-play cabinet is a cabinet cooled by a refrigerating system which enables chilled and frozenfoodstuffs placed therein for display to be maintained within prescribed temperature limits.This definition states that display cabinets are intended only to maintain food at the correctstorage temperature, not to reduce its temperature from a higher value. Therefore goods mustbe loaded at the correct temperature. However, even if the cabinet is not designed for coolingdown goods, it is equipped with a refrigerating unit of significant power. The reason for thisrequirement resides in a considerable heat gain from the ambient, which takes place in avariety of ways.
14.3.1 Heat balance
For a correct evaluation of the refrigerating power requirement, it is necessary to assessthe overall heat balance of the display cabinet, i.e. identify and quantify all the possible heatexchanges between the refrigerated load volume and its surroundings (Billiard and Gautherin,1993; Clodic and Pan, 2002).
BLUK139-Evans January 23, 2008 17:45
308 Frozen Food Science and Technology
Since the ambient temperature is always higher than that of the load volume, heat exchangecan take place by conduction through the solid walls of the cabinet. However, such walls aresandwich panels or triple glazed glass doors with low overall thermal conductivity, thusleading to a minor heat gain when compared to the other sources. This heat gain acts on therefrigerating power requirement only, and scarcely influences the load temperature, becauseair ducts and air curtains completely surround the load volume.
Air infiltration takes place through the front opening in the case of open cabinets, or eachtime the door/lid is open in the case of closed cabinets. This is one of the major heat sourcesespecially for open cabinets. In such a case, one or more air curtains are established, withthe purpose of creating a barrier against warm air entrainment from the external environment(Navaz et al., 2005). However, air curtains are effective only in horizontal cabinets, wherecold air stratification helps preventing warm air infiltration, while their efficacy is a crucialproblem for vertical cabinets for frozen food. Their correct exploitation is one of the key-points for a successful design of the display cabinet (Cortella, 2002). Since air curtains areeffective only to some extent, vertical cabinets for frozen food are usually of the closed typeonly. In some countries, also the horizontal cabinets for frozen food are commonly equippedwith glass lids. In this case, cooling of the load in some small units can be obtained byconduction, with the evaporator placed on the side walls (‘chest freezers’).
During the time that the shop is closed, it is helpful to reduce air infiltration in opencabinets. For this reason, open cabinets are often equipped with ‘night covers’ or ‘nightcurtains’ to cover the open area in horizontal and vertical cabinets.
Radiative heat transfer takes place through openings and transparent glass. It is due tothe temperature difference between the load surface and the room ceiling, walls or any otherobject situated in front of the cabinets, here included lighting appliances. It can assumesignificant values, because it is governed by the difference in the fourth power of the absolutetemperature of the two surfaces, and by their emissivity. The emissivity of a surface is anattribute to determine the ability of the surface to emit and absorb thermal radiation. It rangesfrom 0 (perfect reflector) to 1 (the black body, a perfect absorber and emitter). In the caseof frozen food, the temperature difference between the load and the warm surfaces can besignificant and, furthermore, the emissivity of the packages and walls is usually quite high(about 0.9). This is one of the most important reasons why an uneven temperature distributionof food is encountered in frozen food display cabinets. Packages situated in the uppermostlayer (in horizontal cabinets) or in the front (on the shelves of a vertical cabinet) are subjectto radiative heat transfer, and show a temperature few degrees higher when compared to theother packages in the cabinet (Nesvadba, 1985).
Further heat gains take place from internal sources, such as lighting, defrosting and demist-ing devices.
High-intensity lighting is usually preferred by retailers, who ask, as an example, for lightsplaced under each shelf in vertical multi-shelf cabinets. This choice causes a huge heatingeffect on the packages by radiation, and should be avoided, together with the use of spotlights.High-efficiency lights, such as fluorescent lights or LEDs, should be preferred (Narendranand Raghavan, 2002).
Defrosting devices are always installed in the cabinets, in order to keep the cooling coilsand the air ducts clear of any deposition of ice.
Demisting devices are used in the presence of glass door, in order to facilitate the evapo-ration of water mist which deposits on the internal side of the door when it is open. Further,electric heaters often heat up the doorstop to prevent ice formation, or other surfaces, whichmight get in contact with the customers and feel unpleasantly cold.
BLUK139-Evans January 23, 2008 17:45
Frozen Retail Display 309
The heat produced by all the sources listed above need to be removed by the refrigeratingapparatus of the display cabinet, so as to maintain the goods at a constant temperature.
14.3.2 Air distribution
Heat removal from the load volume is performed by means of air circulation. It has beenalready mentioned that air circulation can take place by natural convection or can be forcedby fans. In the case of display cabinets for frozen food, air is usually forced by fans, in orderto establish an adequate heat exchange at the cooling coil and obtain an even air distribution.In the case of open cabinets, forced air circulation is necessary to create the air curtains.
All the display cabinets shown in Figs. 14.1–14.3 are refrigerated by forced air circulation.Air is moved by fans placed underneath the load volume, and is cooled in a cooling coil
where a refrigerating medium provides heat removal. It is then supplied to a plenum with thepurpose of generating a uniform distribution and finally it is forced through a honeycomb to asymmetrical discharge grille. Here one or more air curtains are obtained, and air is returned tofans through a return grille placed at the bottom of the air curtain. Air curtains have differentpurpose depending on the type of cabinet.
14.3.2.1 Open cabinets
In the case of open cabinets, air curtains provide a barrier against warm air entrainment fromthe ambient. Cold air moves downwards because of its velocity at the discharge grille andbecause of buoyancy, but along its path the curtain width increases, and its velocity decreases.The curtain also impacts onto shelves and food, thus increasing the possibility that only afraction of the discharged air will be returned at the return grille, while the residual willoverspill the bottom of the cabinet. In order to respect a mass balance, an equal mass ofair from the ambient will be entrained in the air curtain and conveyed to the return grill.This occurrence will cause an unpleasant feeling to the customers (the so-called ‘cold feeteffect’) and a noticeable increase in the refrigeration power requirement, due to the necessityof cooling and dehumidifying the ambient air which has been entrained.
It has been shown that air infiltration accounts for 60–75% of the total refrigeration load(Rigot, 1990; Axell and Fahlen, 2002), thus emphasising the necessity for the best designof this component of the cabinet. The ratio of the mass flow rate of ambient air entrained tothe total mass flow rate at the return grill is defined the ‘induction factor’, and it is a helpfulindicator of the effectiveness of an air curtain (Rigot, 1990). For the sake of an experimentalevaluation, it can be written in terms of air temperature:
mambient
mreturn
= treturn − tdischarge
tambient − tdischarge
In horizontal open cabinets for frozen food usually only one air curtain is established, takingadvantage of air stratification which prevents warm air infiltration. In this case, particularcare should be taken in choosing the air velocity, in order to avoid strong turbulence, whichcould promote heat and mass exchange with the ambient.
In vertical open cabinets for frozen food usually up to three air curtains are established, atdifferent air temperatures. The internal curtain is maintained at a low temperature (i.e. about−30◦C), and performs heat removal from the goods, contrasting heat gains from radiation,lighting and defrosting. The central curtain is maintained at approximately 0◦C, and acts as

BLUK139-Evans January 23, 2008 17:45
310 Frozen Food Science and Technology
the barrier to prevent air infiltration from the ambient. The external curtain usually consistsof ambient air drawn from the top of the cabinet. Its purpose is to damp cold air curtainfluctuations, which could amplify air entrainment, and to protect the air inner curtains fromambient air movement.
14.3.2.2 Closed cabinets
In the case of closed cabinets, forced air distribution follows the same path as described foropen cabinets. Only one air curtain is designed in this case, whose function is mainly todistribute cooled air throughout the load volume while contrasting heat gain from radiationand lighting on the frontal surface of goods. Nevertheless, during door or lid opening the aircurtain acts as a barrier against air infiltration, even if the strong turbulence induced by thedoor movement prevents an effective operation in vertical cabinets.
In vertical cabinets, when the door is open, glass fogging occurs, because condensationof atmospheric humid air takes place on the internal cold surface of the door. This is amajor concern for the display of products. As soon as the door is closed, rapid defoggingmust be achieved to re-establish proper visibility of the product. Defogging is achieved bya combination of air movement supplied by the air curtain, and glass heating by means ofelectric heaters embedded in the door.
Glass fogging is a crucial problem also on the external side of the doors, in hot and humidclimatic conditions. For this reason, glass doors and lids are often triple glazed, in orderto reduce heat transmission through the structure and keep the external surface temperatureabove the dew point temperature of the ambient, thus avoiding vapour condensation.
14.3.3 Refrigerating equipment
Display cabinets need refrigeration equipment to adequately cool air which, in turn, contraststhe numerous heat gains so as to keep food at the correct temperature. Depending on therefrigerating equipment, display cabinets can be classified as integral units incorporatingtheir own condensing units or as remote cabinets with remote condensing units (ISO, 2005a,2005b). In the cabinets of the first type, an entire refrigerator is contained in the unit, whichonly needs a power supply connection and for this reason is also named a ‘stand alone’ unit.If this unit is of the open type, a drainage piping is sometimes required, to evacuate waterafter the defrosting operation (in closed cabinets a smaller amount of water is produced,which can be removed by evaporation). In remote cabinets, the unit is connected to a centralrefrigerating system which serves the whole low-temperature cabinets within a supermarket;only the evaporator and the expansion device are contained in the unit, while compressor andcondenser are placed outside the selling area.
In order to reduce the amount of refrigerant required for the system, it is possible to makeuse of a secondary fluid, which is cooled in a centralised refrigerating system and circulated,to distribute the refrigerating power to all the cabinets (indirect refrigerating system). Thiskind of system is less energy efficient; however, it permits an important reduction in the totalamount of refrigerant used, and makes possible the use of toxic or flammable refrigerants,since the refrigerating system can be confined (Nyvad and Lund, 1996). This is an importantissue because the refrigerants adopted in remotely operated refrigerating systems are almostexclusively halogenated hydrocarbons where strong pressure is being put towards the use ofnatural refrigerants such as ammonia, carbon dioxide and hydrocarbons. This topic will bedealt with in a later section.
BLUK139-Evans January 23, 2008 17:45
Frozen Retail Display 311
Whatever refrigerating means is adopted, one or more cooling coils are used in the cabinetsto refrigerate air. Because their surface temperature is well below 0◦C (usually below −35◦C),the cooling coils are subject to frost deposition due to air dehumidification. This is particularlytrue in the case of open cabinets, where air infiltration from the ambient takes place, and isemphasized in warm and humid climates. A defrosting device is therefore needed, whoseoperation should be cyclical and able to keep the coil and any air ducts clear of ice. Apart fromthe energy consumption of this device, an important consequence of its use is the unavoidabletemperature rise of the products, due to the lack of any cooling effect during the defrostingcycles, and to the undesirable heat supply.
14.4 OPERATION
Retail cabinets are intended for the display of perishable food at the correct storage temper-ature. Various standards are in force in order to compare the performance of different units,and to classify their ability to display goods at different temperatures. Even after the cabinetis designed and its compliance with the standards is verified, its performance is not guaran-teed at every operating condition. The influence of ambient conditions on the performance iscrucial, because unexpected radiative load or air movement can cause excessive temperaturefluctuations. The performance of a display cabinet strongly depends also on its installation,operation and maintenance. Furthermore, other important factors that affect the performanceof a cabinet are the way it is loaded, the use of night covers and the operation of the defrostingdevice.
14.4.1 Standards in force
Various standards are in force, e.g. the EN Standard 23953 (ISO, 2005a, 2005b) and theASHRAE Standard 72-2005 (ASHRAE, 2005). In the following section the EN Standardwill be discussed, which is in force in Europe. The ASHRAE Standard is similar in scope,although there are some differences between the exact test conditions for the two standards.
The EN Standard aims to give requirements for the construction and the performance ofcabinets, to specify test conditions for checking that such requirements are satisfied and to listthe characteristics to be declared by the manufacturer (ISO, 2005b). The performance of thecabinets is measured in terms of storage temperature of goods and of energy consumption.Strict prescriptions are given to perform the ‘temperature test’, which has to be carried out ina test room whose climate conditions are specified and controlled, and with the cabinet fullyloaded with packages (that have the same thermal properties as lean meat) made of water,cellulose and some additives, whose composition, dimensions and thermal characteristicsare detailed. Doors or lids, if any, shall be opened cyclically with prescribed time period andangle.
Different climate conditions are considered in the standard, and the climate classes arelisted in Table 14.1. Depending on the test result, the cabinet is assigned to a temperatureclass among those listed in Table 14.2. The temperature limits refer to the highest and lowesttemperature of the warmest and coldest package in a 24-hour test.
It is important to note that test conditions may be considerably different from normaloperating conditions in a retail store. Compliance with the requirements of the standarddoes not imply a correct operation when the cabinet is installed in the store, becauseof different climate conditions, loading arrangement, thermal properties of the load and

BLUK139-Evans January 23, 2008 17:45
312 Frozen Food Science and Technology
Table 14.1 Climate classes according to the EN 23953 Standard (ISO, 2005b).
Climate class Dry bulb temperature (◦C) Relative humidity (%) Dew point (◦C)
0 20 50 9.31 16 80 12.62 22 65 15.23 25 60 16.74 30 55 20.05 40 40 23.96 27 70 21.17 35 75 30.08 23.9 55 14.3
settings of the unit. It is thus clear that the user has a responsibility to ensure the correctstorage conditions and should operate the unit with full awareness of the consequences ofany choices. In the following, some suggestions are given about proper installation and opera-tion, with the purpose of obtaining the best storage conditions with the lowest possible energyconsumption.
14.4.2 Installation
Display cabinets should be certified for compliance with the Standard in force, and should beassigned a temperature class and a climate class. In other words, compliance with the standardmeans that the cabinet is able to keep food at the defined storage temperature (temperatureclass), when it is operated in an environment with the ambient conditions defined in theclimate class.
Thus, the first step for a retailer is the choice of the cabinet belonging to the most appropriatetemperature class, bearing in mind that cabinets are not designed to lower food temperature,but only to maintain it.
The second step is the choice of the climate class which better fits the actual ambientconditions in the shop. This choice should be made with full awareness, especially in thecase of retail premises situated in warmer countries or not supplied with an air conditioningsystem.
The third step is correct installation, to reproduce to the highest degree the test conditionsat which the cabinet has been designed. In particular, air conditions and radiative load shouldbe controlled, especially for open cabinets.
Table 14.2 Temperature classes according to the EN 23953 Standard (ISO, 2005b).
Highest temperature of Lowest temperature of Lowest temperature ofClass the warmest package (◦C) the coldest package (◦C) the warmest package (◦C)
L1 ≤−15 na ≤−18L2 ≤−12 na ≤−18L3 ≤−12 na ≤−15M1 ≤+5 ≥−1 naM2 ≤+7 ≥−1 naH1 ≤+10 ≥+1 naH2 ≤+10 ≥−1 na
S Special classification
BLUK139-Evans January 23, 2008 17:45
Frozen Retail Display 313
Air conditions to control are: temperature, humidity and velocity (Axell and Fahlen, 2002;Gautherin and Srour, 1995). High ambient temperature is often the cause of an increased riskof load temperature fluctuation, and it always leads to a higher energy consumption. Theeffect of high ambient humidity is also significant (Howell et al., 1999). Because of airentrainment in the load volume, water vapour condensation occurs on the air ducts and on thecooling coil, thus leading to frost build-up. The higher the air humidity is, the faster ice buildsup, with consequent premature reduction of the air flow rate due to blockage, thus requiringmore frequent defrosting operations. Finally, ambient air velocity is crucial especially in thecase of open cabinets. It has been demonstrated that even slow air movements (<0.2 m s−1)parallel to the opening interfere with the air curtains. Air entrainment can be promoted, andthe induction factor significantly increased. 3D effects can also take place in the air curtain,leading to an uneven load temperature distribution (D’Agaro et al., 2006a). If the ambientair movement is directed against the cabinet opening, disruption of the air curtain can takeplace, with severe consequence on the storage conditions of goods.
In general, the cabinets should be placed as far as possible from doors, windows, air dif-fusers, and customers’ habits should be investigated so as to install cabinets at the end of theirshopping paths (Larson et al., 2005). In this way, only customers interested in buying frozenfood will walk in front of the cabinets, thus reducing ambient air movement. Furthermore,frozen goods will be the last items to be picked up, and the time of their exposure to ambienttemperature will be reduced.
An air conditioning system in the retail shop could be helpful with regard to the optimaloperating conditions, provided that air diffusers do not promote excessive air movementclose to the cabinet opening. In many cases, especially for large stores, it is preferable toadopt a separate air conditioning system for the selling area where display cabinets areplaced. Depending on their refrigerating unit, display cabinets can be equivalent to a positiveor negative heat load to the air conditioning system. Self-contained (‘stand-alone’) unitsrepresent a source of heat, because the electric power consumption and the refrigeration loadare discharged to the ambient via the condensing coil. On the contrary, remote condensationunits represent a source of cold, because of cold air dispersion from the air curtains or dueto door openings. In this case, it is usual to feel the so-called ‘cold feet effect’ when walkingclose to the cabinets, because of cold air stratification close to the floor. The air conditioningsystem should attempt to rectify this particular situation and provide comfortable conditionsfor customers, while maintaining low relative humidity and adequate ambient temperature(Tassone, 1997). Innovative air distribution system to counteract the ‘cold feet effect’ havebeen investigated, with return grills on the floor to avoid air stratification.
Radiative load originates from high-temperature sources. Apart from the use of low-emissivity packaging for the products, it can be reduced only by avoiding direct exposureof the load surface, that is placing the cabinet out of direct sunlight, as far as possible fromwindows, and avoiding the use of incandescence or halogen lights directed towards thegoods. Also, radiation shields can be effective (Faramarzi and Woodworth-Szieper, 1999).In the past, some authors suggested the use of canopies with low-emissivity surfaces overhorizontal open-top cabinets, to reduce radiative heat exchange between the load surfaceand the supermarket ceiling. This solution allowed for a reduction of the surface temper-ature of products up to 4 K (Gac and Gautherin, 1978), and can be particularly effec-tive when the supermarket roof is exposed to direct sun radiation. Use of closed cabinetswith low-emissivity glass doors or lids is indeed much more effective, even if visibilityand access are reduced because a physical barrier is created between the customer and theproduct.
BLUK139-Evans January 23, 2008 17:45
314 Frozen Food Science and Technology
Fig. 14.4 Load limit line.
14.4.3 Loading
Loading food in a display cabinet is a crucial phase in the cold chain, and particular careshould be taken to ensure the preservation of food quality.
First of all, as already mentioned, a display cabinet is intended only to maintain thetemperature of goods within the prescribed limits. This means that food shall be loaded at thecorrect storage temperature, and that freezing or cooling of goods from a higher temperature(e.g. on delivery) shall be performed in other refrigerated facilities. When frozen food istransferred from the refrigerated rooms to display cabinets, loading should be performed ina very short time, because the rise in temperature of frozen food left in ambient temperatureis faster than it might apparently seem to be; small-sized products could even thaw. Neverleave frozen foods outdoors under direct sunlight!
Every cabinet should be marked with one or several ‘load limit line(s)’ on the inside faceof the load volume, to indicate the load limit (Fig. 14.4) (ISO, 2005b). Complying with thisrequirement is essential for correct operation of the cabinet. Food stored beyond this limitwill not be maintained at the correct temperature and will probably disrupt the air curtain,affecting the performance of the cabinet and the storage temperature of the whole load.
Food in display cabinets is subject to storage conditions worse than those in a refrigeratedroom, mostly because of temperature fluctuations. Moreover, goods in the front of the cabinetare subject to radiation, and their temperature is a few degrees higher than that of otherpackages. Stock rotation thus becomes important, using the FIFO (First In First Out) principle.
Radiative heat is one of the most important factors which affect food display negatively. Iflow-emissivity packages are used, food packaging could contribute effectively to the reductionof radiative heating. It is more and more familiar to see frozen food wrapped in aluminiumbags, whose emissivity (about 0.2–0.3) is much lower than that of paper (about 0.9–0.95).In open cabinets, radiative heat gain is approximately proportional to the emissivity of foodpackages. The use of low-emissivity material allows a 4–5◦C reduction in food temperatureat the front or top of the cabinet.
14.4.4 Defrosting setting
During normal operation, humid air entrained from the external environment is subject towater vapour condensation on the cold surfaces inside the cabinet, especially on the return airducts and on the cooling coil, which are the first components air encounters. Because thesesurfaces are below 0◦C, condensation results in frost formation, with consequent reductionof the circulation of refrigerated air, instability of the air curtain and a loss of performance ofthe cabinet. For this reason, anti-sweat heaters are to be run continuously, adding a permanentheating load to the display case. Furthermore, regular defrosting cycles are needed, duringwhich the refrigerating equipment is switched off and the cooling coil is heated. Heatingcan be performed by means of electrical heaters placed around the coil and in its vicinity,or by reversing the refrigerating cycle, i.e. circulating warm liquid or condensing refrigerantinside the coil (Baxter and Mei, 2002; Gage and Kazachki, 2002). The second system is more
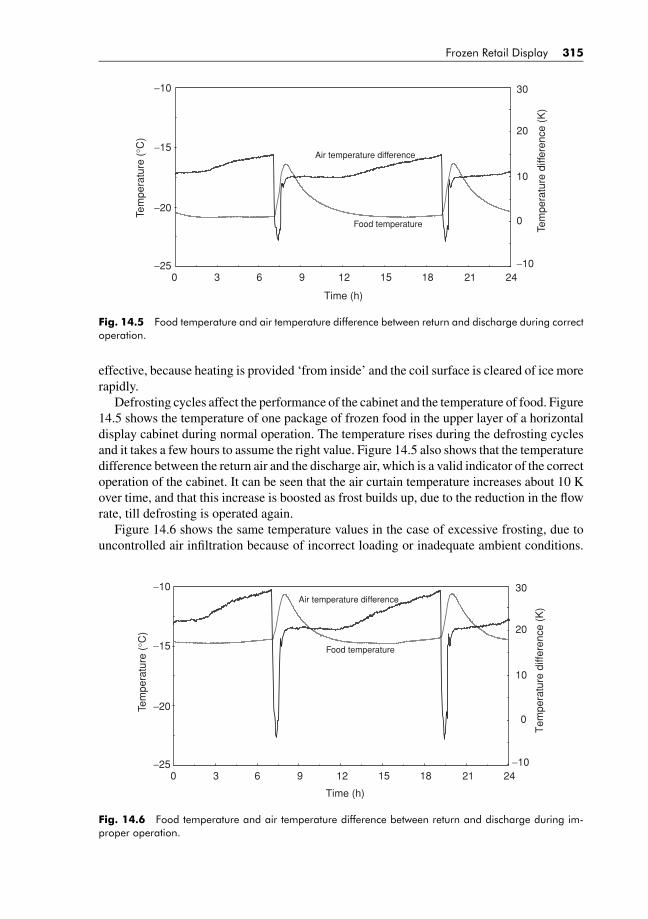
BLUK139-Evans January 23, 2008 17:45
Frozen Retail Display 315
Tem
pera
ture
(°C
)
Tem
pera
ture
diff
eren
ce (
K)
−10
−20
−250 3 6 9 12 15 18 21 24
−10
0
10
20
30
−15
Food temperature
Air temperature difference
Time (h)
Fig. 14.5 Food temperature and air temperature difference between return and discharge during correctoperation.
effective, because heating is provided ‘from inside’ and the coil surface is cleared of ice morerapidly.
Defrosting cycles affect the performance of the cabinet and the temperature of food. Figure14.5 shows the temperature of one package of frozen food in the upper layer of a horizontaldisplay cabinet during normal operation. The temperature rises during the defrosting cyclesand it takes a few hours to assume the right value. Figure 14.5 also shows that the temperaturedifference between the return air and the discharge air, which is a valid indicator of the correctoperation of the cabinet. It can be seen that the air curtain temperature increases about 10 Kover time, and that this increase is boosted as frost builds up, due to the reduction in the flowrate, till defrosting is operated again.
Figure 14.6 shows the same temperature values in the case of excessive frosting, due touncontrolled air infiltration because of incorrect loading or inadequate ambient conditions.
Tem
pera
ture
(°C
)
Tem
pera
ture
diff
eren
ce (
K)
−10
−20
−250 3 6 9 12 15 18 21 24
−10
0
10
20
30
−15 Food temperature
Air temperature difference
Time (h)
Fig. 14.6 Food temperature and air temperature difference between return and discharge during im-proper operation.
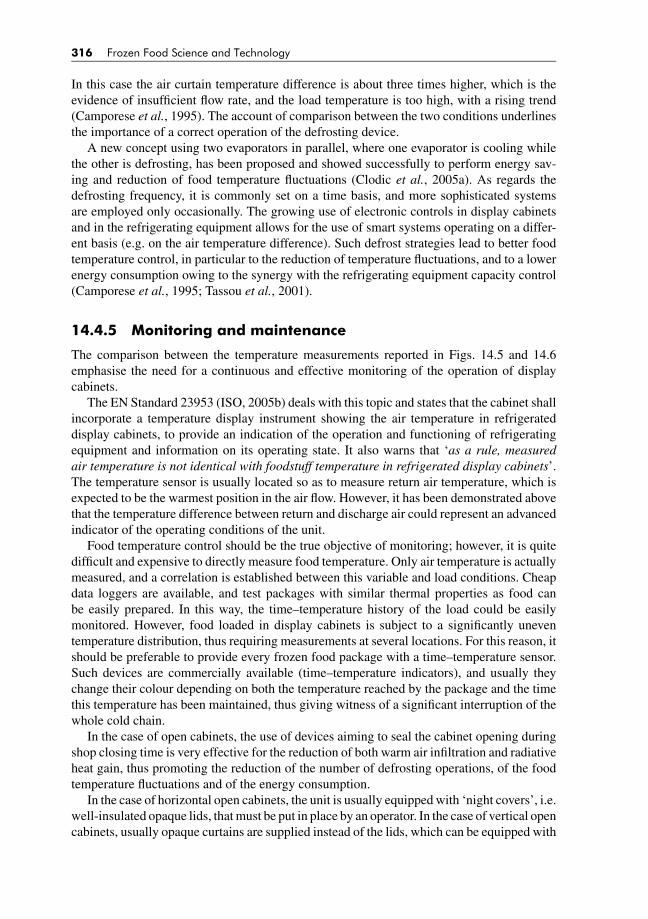
BLUK139-Evans January 23, 2008 17:45
316 Frozen Food Science and Technology
In this case the air curtain temperature difference is about three times higher, which is theevidence of insufficient flow rate, and the load temperature is too high, with a rising trend(Camporese et al., 1995). The account of comparison between the two conditions underlinesthe importance of a correct operation of the defrosting device.
A new concept using two evaporators in parallel, where one evaporator is cooling whilethe other is defrosting, has been proposed and showed successfully to perform energy sav-ing and reduction of food temperature fluctuations (Clodic et al., 2005a). As regards thedefrosting frequency, it is commonly set on a time basis, and more sophisticated systemsare employed only occasionally. The growing use of electronic controls in display cabinetsand in the refrigerating equipment allows for the use of smart systems operating on a differ-ent basis (e.g. on the air temperature difference). Such defrost strategies lead to better foodtemperature control, in particular to the reduction of temperature fluctuations, and to a lowerenergy consumption owing to the synergy with the refrigerating equipment capacity control(Camporese et al., 1995; Tassou et al., 2001).
14.4.5 Monitoring and maintenance
The comparison between the temperature measurements reported in Figs. 14.5 and 14.6emphasise the need for a continuous and effective monitoring of the operation of displaycabinets.
The EN Standard 23953 (ISO, 2005b) deals with this topic and states that the cabinet shallincorporate a temperature display instrument showing the air temperature in refrigerateddisplay cabinets, to provide an indication of the operation and functioning of refrigeratingequipment and information on its operating state. It also warns that ‘as a rule, measuredair temperature is not identical with foodstuff temperature in refrigerated display cabinets’.The temperature sensor is usually located so as to measure return air temperature, which isexpected to be the warmest position in the air flow. However, it has been demonstrated abovethat the temperature difference between return and discharge air could represent an advancedindicator of the operating conditions of the unit.
Food temperature control should be the true objective of monitoring; however, it is quitedifficult and expensive to directly measure food temperature. Only air temperature is actuallymeasured, and a correlation is established between this variable and load conditions. Cheapdata loggers are available, and test packages with similar thermal properties as food canbe easily prepared. In this way, the time–temperature history of the load could be easilymonitored. However, food loaded in display cabinets is subject to a significantly uneventemperature distribution, thus requiring measurements at several locations. For this reason, itshould be preferable to provide every frozen food package with a time–temperature sensor.Such devices are commercially available (time–temperature indicators), and usually theychange their colour depending on both the temperature reached by the package and the timethis temperature has been maintained, thus giving witness of a significant interruption of thewhole cold chain.
In the case of open cabinets, the use of devices aiming to seal the cabinet opening duringshop closing time is very effective for the reduction of both warm air infiltration and radiativeheat gain, thus promoting the reduction of the number of defrosting operations, of the foodtemperature fluctuations and of the energy consumption.
In the case of horizontal open cabinets, the unit is usually equipped with ‘night covers’, i.e.well-insulated opaque lids, that must be put in place by an operator. In the case of vertical opencabinets, usually opaque curtains are supplied instead of the lids, which can be equipped with

BLUK139-Evans January 23, 2008 17:45
Frozen Retail Display 317
electric devices for an automatic movement. Operation with the night covers is very effectivefor the improvement of open cabinets’ performance, provided that they are well fitted. Theiruse is strongly recommended, costs for their purchase and daily positioning are paid back bylower energy consumption and improved food quality.
As regards maintenance, a regular inspection on a daily basis is necessary to check theload temperature and the correct operation of the unit. Less frequently, a thorough cleaning isrequired. The refrigerating unit has to be stopped, the cabinet emptied, and all the accessiblesurfaces washed and sanitised. In the case of incorporated condensing units, the condensermust be cleaned to remove dust.
In the event of a short-term breakdown, removal of food can be avoided provided thatnight covers are immediately applied, customer access prevented and fans switched off. Inthis case, the thermal capacity of the goods will delay the temperature rise.
14.5 ENVIRONMENTAL ISSUES
Refrigerated display cabinets exploit a well-established technology; however, there is stillroom for improvement. Significant upgrading is required with respect to their environmentalimpact, in particular with reference to the use of halogenated hydrocarbons as refrigerants,and to the energy consumption. Nonetheless, the recently raised issue of life cycle impacthas opened a new avenue for further enhancement.
14.5.1 Refrigerants
Commercial refrigeration accounts for about 17% of the worldwide consumption of refrig-erants for refrigeration and air conditioning.
Centralised direct expansion systems have a wide range of refrigerating capacities, therefrigerant charge varying from 100 kg to about 1500 kg. Stand-alone equipment covers manydifferent types including vending machines, ice machines, etc. In this case the refrigerantcharges vary from 200 g up to 1 kg, but 10–12 million such units are in use globally (Kruse,2005).
From another point of view, retail stores can be classified as hypermarkets, supermar-kets and convenience stores. In 2003 in Europe, the distribution of display cabinets in suchstores was 14%, 32% and 54%, respectively. In hypermarkets, the average nominal chargeof refrigerant was 0.27 kg m−2 selling area, and the accidental emission rate was 23–37% ofthe total charge per year. The average refrigerant charge in supermarkets was 0.29 kg m−2,the emission rates having decreased from the year 1994 to 2002, currently between 18 and35% per year. In the case of convenience stores, it is difficult to estimate an average charge ofrefrigerant, because it depends strongly on the type of cabinets used. In the case of stand-aloneunits, a maximum 1% emission rate is estimated, while in the case of remote condensingunits a 15% emission rate can be guessed (Clodic et al., 2005b). It must be recalled that somecountries have put high focus on leakage reduction, also through the introduction of taxationon refrigerants, and that this policy is giving appreciable results.
The environmental issues of ozone depletion, covered for the first time by the MontrealProtocol signed in 1987, and of greenhouse gas emissions, covered by the Kyoto Protocolsigned in 1997, caused the need for substantial changes in all refrigeration systems. Thewidely used halogenated hydrocarbon refrigerants were found to contribute greatly to bothozone depletion and global warming.

BLUK139-Evans January 23, 2008 17:45
318 Frozen Food Science and Technology
Chlorofluorocarbons (CFC) and hydrochlorofluorocarbons (HCFC) have been progres-sively banned in the developed countries, and only hydrofluorocarbons (HFC) are currentlyaccepted as refrigerants because of their zero ozone depletion potential (ODP). However, itis commonly realized that HFCs are not a sustainable technology in the long run, becauseof their not negligible global warming potential (GWP). The attention is now focusing onnatural refrigerants, i.e. carbon dioxide, hydrocarbons and ammonia.
Carbon dioxide is the most promising fluid. Because of its low critical temperature (about32◦C) and high critical pressure (about 7.4 MPa), carbon dioxide requires particular devicesto perform a refrigerating cycle. However, it has been used as a refrigerant since 1850, andits peculiarity of being safe, i.e. non-toxic and non-flammable, made it soon become theideal fluid for marine installations. Low energy efficiency was the main drawback, and theintroduction of the most promising synthetic refrigerants after World War II caused its decline.Nowadays, it has regained favour because of its low environmental impact (Lorentzen, 1994;Pearson, 2005), and particular emphasis is being put on the improvement of energy efficiency.
CO2 can be employed either as a secondary fluid or as refrigerant. This allows for a muchwider choice of possible refrigerating plants for commercial refrigeration.
One of the main limitations of indirect cooling systems is the low energy efficiency, dueto the poor heat exchange of the secondary fluids and to their viscosity, which increasesthe pumping power requirement. CO2 has a much better heat transfer behaviour than theconventional single-phase fluids, because it is possible to take advantage of its phase change.A secondary loop with carbon dioxide can be set up, where the refrigerant evaporates atlow temperature in the cooling coil inside the cabinets, and condenses in heat exchangerssituated in a machine room, where heat is removed by means of a primary refrigerating plant.However, it must be realised that if the plant were to stop operating that a large pressureincrease could occur from evaporation of the liquid contained in the system. In this case,release of carbon dioxide to atmosphere is usually planned.
Carbon dioxide can be used effectively in the primary refrigerating circuit, as well asin direct expansion systems. When rejecting heat directly to the atmosphere, a sub-criticalcycle is possible whenever the outdoor temperature is below 15◦C (Girotto et al., 2004).This condition occurs for a significant number of hours throughout the year both in Europeand in North America. On the contrary, when the condensing temperature approaches thecritical value, a trans-critical refrigeration cycle is established. Condensation is replaced by analmost isobaric heat rejection at high temperature, followed by an isenthalpic expansion due tothrottling, where liquid formation occurs. Special high-pressure components and compressorsmust be used, the maximum pressure in the circuit being around 8–10 MPa. Comparisonbetween the use of CO2 and of the conventional HFC R404A leads to an estimation of about8% higher energy consumption and 10% higher costs. Non-ideal heat transfer takes placeespecially in the gas cooler and in the compressor (Fartaj et al., 2004). Improvement canbe achieved, by modifications to the basic cycle using various devices (Zha et al., 2005) orthrough two-stage systems, with a sub-critical low-temperature stage and trans-critical high-temperature stage. In this configuration, the same refrigerating plant can supply to both thelow-temperature and the high-temperature cabinets, for frozen and chilled food, respectively.An intermediate pressure vessel can be adopted, and liquid CO2 pumped into a secondaryloop serving the chilled food units (Schiesaro and Kruse, 2002).
Use of two-stage cycles involves the need for efforts to optimise the operating conditionsof the refrigerating system, with particular reference to the gas cooler pressure (high pressure)and to the intermediate pressure (Sarkar et al., 2004; Cavallini et al., 2005).
BLUK139-Evans January 23, 2008 17:45
Frozen Retail Display 319
Problems related to high pressure or to the trans-critical cycle can be by-passed by makinguse of cascade cycles, where CO2 is used as a refrigerant in the low-temperature system,and another refrigerant on the high-temperature side. With such a system, the refrigeratingpower can again be supplied to both the low-temperature and the high-temperature cabinets.The CO2 cycle serves the low-temperature cabinets, and rejects heat as a load to the high-temperature refrigerating plant. If natural refrigerants are to be taken into consideration forboth cycles, ammonia or propane can be used on the high-temperature side (Sawalha et al.,2005). However, in this case, a secondary fluid is necessary to feed the display cabinets, dueto safety requirements.
14.5.2 Energy consumption
Storage of frozen and chilled food accounts for approximately 40–50% of the electricityuse in supermarkets. The total electrical energy required by a supermarket varies from 360to 520 kW h−1 m−2 depending on the selling area (from >2000 to <600 m2, respectively)(Axell and Lindberg, 2005). One vertical display cabinet for frozen food with a glass door(on average 2.4 m2 total display area) requires from 54 to 68 kW h−1 per day for operation(European Committee of Air Handling and Refrigeration Equipment Manufacturers). About45% of this value is direct energy consumption, i.e. energy required for lighting, defrostingand demisting devices, fans and so on. This means that most of the refrigerating load in aclosed cabinet is produced by the cabinet itself, and does not originate from air infiltration.There is thus room for great improvement, which can involve:
– the design of the cabinet for the reduction of the refrigeration load;– the design of the refrigerating equipment for the increase of its efficiency;– the synergy among all the energy conversion systems in the supermarket, for the reduction
of the global energy requirement.
The best design of cabinets originates from a thorough knowledge of the flow patterns both inthe air curtains and in the air ducts. Low air velocity, even air distribution, full exploitation ofthe evaporator surface are all factors which affect the total energy consumption significantly.Air curtains are a very complex system, and designing them requires particular skills. Manyadvanced tools are available for the prediction and measurement of air flow. Computationalfluid dynamics (CFD) is a useful tool for the prediction of flow patterns and heat and masstransfer, and many authors have shown CFD modelling to be a valuable means for theimprovement of air curtains (Cortella, 2002; Foster, 2005; D’Agaro et al., 2006b). Particleimage velocimetry is a very accurate method for flow velocity measurements (Field and Loth,2006), and a valuable tool for the adoption of the best CFD boundary conditions, especiallyat the discharge grill.
To push towards a better design of display cabinets in terms of energy consumption,standards have included some definitions which are the basis for energy labelling of displaycabinets (ISO, 2005b). As an example, the EN ISO 23953 Standard (ISO, 2005b) definesthe way to measure the total energy consumption (TEC, kW h−1 per day) of a cabinet,split into direct energy consumption (DEC) and refrigeration electrical energy consumption(REC). The energy consumption can be compared to the total display area (TDA, m2) and thevisibility of products (VPA), thus considering also the display function in the evaluation of theeffectiveness of the cabinet. The ratio TEC/TDA has been adopted by Eurovent as a parameter

BLUK139-Evans January 23, 2008 17:45
320 Frozen Food Science and Technology
for the comparison of different cabinets in the ‘Refrigerated display cabinets’ programme.Various manufacturers agree on a voluntary basis to participate in this programme, and havetheir products rated on the basis of the above-mentioned parameter (European Committee ofAir Handling and Refrigeration Equipment Manufacturers).
The design of the refrigerating equipment has been discussed above. Various systemconfigurations have been consolidated; and many improvements have been made recently toenhance their efficiency. One more option is available when taking into consideration directexpansion systems, where each cabinet is supplied with an expansion device. In this case, it hasbeen demonstrated that the use of electronic expansion valves in place of thermostatic valvesreduces energy consumption significantly and permits a complete control of the refrigeratingplant (Tahir and Bansal, 2005). In this way, different strategies for regulation, pull down anddefrosting can be adopted, and the control system can be adapted to the operating conditions(outdoor and indoor climate, presence of customers, goods loading. . . ) obtaining even betterglobal performance and further savings.
It has been mentioned above that the refrigerating plants for storage and display of food ina supermarket account for 40–50% of its total electrical energy consumption. The remainingfraction of electrical energy consumption is apportioned between space air conditioning andheating (5–10%), lighting (30–35%) and services. A noticeable reduction in the global energyconsumption can be achieved, and a lot of efforts are being made to identify effective andreliable solutions. Many studies have been carried out on this topic (Baxter, 2003), and oneof the most promising solutions is the recovery of heat rejected at high temperature by therefrigerating system, which offers an attractive resource for use in store space heating. Heatpumps can be installed, which use the rejected heat to supply the heating system with waterat high temperature. Energy savings in the refrigeration system can also be achieved with thisconfiguration, because of low condensing pressures, along with the energy benefits alreadyseen through heat recovery.
Another point of practical, economic viability of an integrated combined heating andcooling system in a supermarket is to drive the compressor of the refrigerating system bya gas engine whose waste heat is used to satisfy the hot water and heating requirements(Maidment et al., 2001). A payback period of around 4 years has been estimated for thissystem, which could be reduced with further optimisation.
Combined heat and power (CHP) systems can be set up in a similar way, when a gasengine drives a generator and cogeneration of heat and electric power is achieved. In thisway electricity becomes available also for lighting and services, but a great amount of heatis produced, which will be rejected to the environment when the heating system is notoperating. Integration with an absorption chiller gives place to a combined cooling heat andpower (CCHP) system (Maidment and Tozer, 2002; Maidment et al., 1999). This systemallows for heat recovery during the warm season when the heating system is not operating,by means of an absorption chiller, which serves the chilled food cabinets. Such systems giveprimary energy savings of over 15%, while also achieving attractive payback times.
In the medium to longer term, emerging technologies such as mini gas turbines and fuelcells will further benefit the application of CCHP to commercial refrigeration.
14.5.3 Life cycle issues
The use of environmentally compatible refrigerants and the reduction of their emission,together with the reduction of energy consumption, are the two most important factors inthe requirement for low environmental impact of the operation of display cabinets. However,
BLUK139-Evans January 23, 2008 17:45
Frozen Retail Display 321
in the framework of a sustainable development, a comprehensive evaluation of the impactcaused by a display cabinet should take into account the whole life of the unit. A controlstrategy of pollution and use of raw materials must be integrated at the design stage, to achievecleaner technologies and control the use of resources. Life cycle assessment (LCA) allowsthe evaluation of the environmental impact of equipment comprising the manufacturingand emissions of refrigerants, and the construction, installation, operation, dismantling anddisposal of the equipment (Frischknecht, 2000). An inventory has to be made of all thematerials and the energy sources which are used during the whole life cycle of the unit.Further on, the evaluation of the environmental impact is performed considering some impactcategories, i.e. the use of energy resources, the damages to the ecosystem (global warmingpotential, ozone depletion potential, toxicity, photochemical smog production, acidification,eutrophication) and the impacts on human health. This impact can be summarised in asingle index, calculated by weighing the various above-mentioned impacts. Different weightcompositions are used, depending on the relative importance given to the various impactcategories.
LCA has already been applied to the evaluation of the environmental impact both ofsupermarket refrigerating systems (Frischknecht, 2000; Diehlmann et al., 2005) and of displaycabinets (Watkins et al., 2005; Watkins et al., 2004; Paternico, 2005). When display cabinetsare considered, both of the open and closed type, with internal or remote condensing unit, ithas been assessed that most (>97%) of the total environmental impact derives from the energyrequired for operation. For this reason, the most effective intervention for the reduction of theenvironmental impact is the reduction of the electric energy consumption. The boundaries ofthe system can be restricted neglecting the operation phase, in order to magnify the impactof use of raw materials, from assembly to disposal. For display cabinets, the most importantimpact derives from the use of copper, which is a basic material in piping and coils. Othermaterials could be considered; of course the influence of this possible modification on theenergy consumption should be first evaluated.
LCA is used also as a tool for obtaining other certifications. As an example, the Environ-mental Product Declaration (EPD) is defined as ‘quantified environmental data for a productwith pre-set categories of parameters based on the ISO 14040 series of standards, but notexcluding additional environmental information’ (The Swedish Environmental ManagementCouncil). It is a declaration that the manufacturer prepares following harmonised calculationrules (Product Category Rules, PCR) and which is certified by a third party review. Usually,product category rules require the use of LCA for the assessment of the environmental im-pact. Currently, EPDs for domestic refrigerators have been certified, while the PCR rules forcommercial refrigeration are still not available.
14.6 CONCLUSIONS
Retail cabinets are required to perform effective product display, while maintaining the correctstorage temperature. This is not an easy task, because the two functions are in a certain waycontrasting. The most effective display is achievable using open cabinets, with large displayarea, great visibility and easily reachable products. On the other hand, such features leadto high food temperature fluctuations, uneven temperature distribution, excessive sensitivity toambient conditions and high energy consumption. The difficult task for the designer is to reacha compromise solution for each type of cabinet. Display cabinets are designed so that theamount of refrigerating power they exploit is exactly that required for the correct operation

BLUK139-Evans January 23, 2008 17:45
322 Frozen Food Science and Technology
at standard conditions. This is especially due to the need for reduction both in costs and inenergy consumption. For this reason, the responsibility for the best performance rests alsowith the persons in charge of installation, operation and maintenance.
The choice of the refrigerating equipment depends strongly on the dimensions of the shopand on its layout, and can have significant repercussion on the energy consumption of thesystem. Installation requires following some easy guidelines to reduce heat infiltration dueto air movement and radiation.
A correct operation needs awareness of the effects of incorrect loading, of insufficientdefrosting, and of the missed application of night covers.
Proper maintenance means continuous monitoring of the cabinet operation, periodicalcleaning and ability to adjust the setting of the unit.
Therefore the correct food storage conditions during display depend on many actionsperformed by various people, and do not rely only on the refrigerator.
A lot of work has been carried out to develop sophisticated tools to assist the designer inthe evaluation of the efficacy of the unit and in the assessment of its environmental impact,towards a sustainable development of this technology. However, there is still potential forimprovement, and the necessity to use new refrigerants and control the environmental impactis a motivation for important advances.
REFERENCES
ASHRAE. (2005). ASHRAE Standard 72. – Method of Testing Commercial Refrigerators and Freezers.ASHRAE. (2006). American Society of Heating, Refrigerating and Air Conditioning Engineers, Handbook
2006 Refrigeration, Ch. 46, Retail Food Store Refrigeration and Equipment, ASHRAE, Atlanta.Axell, M. and Fahlen, P. (2002). Climatic influence on display cabinet performance. In: Proceedings of the
IIF-IIR Meeting ‘New Technologies in Commercial Refrigeration’, IIR Paris, pp. 181–190.Axell, M. and Lindberg, U. (2005). Field measurements in supermarkets. In: Proceedings of the IIF-IIR
Meeting ‘Commercial Refrigeration’, IIR Paris, Paper p. 48.Baxter, V.D. (2003). IEA Annex 26: advanced supermarket refrigeration/heat recovery systems – Final report
volume 1 – executive summary, IEA Annex 26.Baxter, V.D. and Mei, V.C. (2002). Warm liquid defrosting technology for supermarket display cases. In:
Proceedings of the IIF-IIR Meeting ‘New Technologies in Commercial Refrigeration’, IIR Paris, pp. 147–151.
Billiard, F. and Gautherin, W. (1993). Heat balance of an open type frozen food display cabinet. In: Proceedingsof the IIF-IIR Meeting ‘Cold chain refrigeration equipment by design’, IIR Paris, pp. 322–332.
Camporese, R., Cortella, G., Bigolaro, G. and Scattolini, M. (1995). Controllo del regolare funzionamento dibanchi frigoriferi. Il Freddo, Linea, 4, 341–348.
Cavallini, A., Cecchinato, L., Corradi, M., Fornasieri, E. and Zilio, C. (2005). Two stage transcritical carbondioxide cycle optimisation: a theoretical and experimental analysis. International Journal of Refrigeration28, 1274–1283.
Clodic, D. and Pan, X. (2002). Energy balance, temperature dispersion in an innovative medium tempera-ture open type display case. In: Proceedings of the IIF-IIR Meeting ‘New Technologies in CommercialRefrigeration’, IIR Paris, pp. 191–199.
Clodic, D., Borlein, C. and Zoughaib, A. (2005a). Defrosting of vertical low temperature open display case.What are the needed improvements?. In: Proceedings of the IIF-IIR Meeting ‘Commercial Refrigeration’,IIR Paris, Paper p. 58.
Clodic, D., Barrault, S., Palandre, L. and Kuijpers, L. (2005b). Quantification of refrigerant banks andemissions in the commercial refrigeration sector in Europe – emission predictions for the period from 2005to 2020. In: Proceedings of the IIF-IIR Meeting ‘Commercial Refrigeration’, IIR Paris, Paper p. 76.
Cortella, G. (2002). CFD-aided retail cabinets design. Computers and Electronics in Agriculture 34, 43–66.D’Agaro, P., Cortella, G. and Croce, G. (2006a). Two- and three-dimensional CFD applied to vertical display
cabinets simulation. International Journal of Refrigeration 29(2), 178–190.

BLUK139-Evans January 23, 2008 17:45
Frozen Retail Display 323
D’Agaro, P., Cortella, G. and Croce, G. (2006b). Numerical simulation of glass door fogging and defoggingin refrigerated display cabinets. Applied Thermal Engineering 26, 1927–1934.
Diehlmann, A., Stadtlander, C. and Schwiegel, M. (2005). Eco – efficiency considerations for europeansupermarket refrigeration systems. In: Proceedings of the IIF-IIR Meeting ‘Commercial Refrigeration’,IIR Paris, Paper p. 17.
European Committee of Air Handling and Refrigeration Equipment Manufacturers, www.eurovent-cecomaf.org. Product Certification Programmes, Retail Display Cabinets, www.eurovent-certification.com.
Faramarzi, R.T. and Woodworth-Szieper, M.L. (1999). Effects of low-emissivity shields on the performanceand power use of refrigerated display case. ASHRAE Transactions 105(1), 533–540.
Fartaj, A., Ting, D.S.-K. and Yang, W.W. (2004). Second law analysis of the transcritical CO2 refrigerationcycle. Energy Conversion and Management 45, 2269–2281.
Field, B.S. and Loth, E. (2006). Entrainment of refrigerated air curtains down a wall. Experimental Thermaland Fluid Science 30, 175–184.
Foster, A.M., Madge, M. and Evans, J.A. (2005). The use of CFD to improve the performance of a chilledmulti-deck retail display cabinet. International Journal of Refrigeration 28, 698–705.
Frischknecht, R. (2000). Life Cycle Assessment for commercial refrigeration systems operated in Switzerland.In: Symposium on Industrial Ecology and Material Flows, Helsinki, 30 Aug–3 Sept.
Gac, A. and Gautherin, W. (1978). Amelioration du fonctionnement des meubles ouverts de vente au detaildes produits surgeles. In: Proceedings of the IIF-IIR Meeting Commissions C2, D1, D2, Budapest (H), IIRParis, pp. 237–248.
Gac, A. and Gautherin, W. (1987). Le froid dans les magasins de vente de denrees perissables, Pyc edn. Paris.Gage, C. and Kazachki, G. (2002). Warm liquid defrost for commercial food display cases: experimental
investigation at 32.2◦C. In: Proceedings of the IIF-IIR Meeting ‘New Technologies in Commercial Refrig-eration’, IIR Paris, pp. 169–178.
Gautherin, W. and Srour, S. (1995). Effect of climatic conditions on the operation of refrigerating equipmentin a hypermarket. In: Proceedings of the 19th International Congress of Refrigeration, IIR Paris, Paperpp. 705–712.
Girotto, S., Minetto, S. and Neksa, P. (2004). Commercial refrigeration system using CO2 as the refrigerant.International Journal of Refrigeration 27, 717–723.
Howell, R.H., Rosario, L., Riiska, D. and Bondoc, M. (1999). Potential savings in display case energy withreduced supermarket relative humidity. In: Proceedings of the 20th International Congress of Refrigeration,IIR Paris, Paper p. 113.
IIR-International Institute of Refrigeration. (1986). Recommendations for the Processing and Handling ofFrozen Foods. IIR/IIF Paris.
ISO. (2005a). European Standard EN ISO 23953-1. Refrigerated display cabinets; Part 1: Vocabulary.ISO. (2005b). European Standard EN ISO 23953-2. Refrigerated display cabinets; Part 2: Classification,
requirements and test conditions.Kruse, H. (2005). Commercial refrigeration – on the way to sustainability. In: Proceedings of the IIF-IIR
Meeting ‘Commercial Refrigeration’, IIR Paris, Keynote Lecture.Larson, J.S., Bradlow, E.T. and Fader, P.S. (2005). An exploratory look at supermarket shopping paths.
International Journal of Research in Marketing 22, 395–414.Lorentzen, G. (1994). Revival of carbon dioxide as a refrigerant. International Journal of Refrigeration 7(5),
292–301.Maidment, G.G. and Tozer, R.M. (2002). Combined cooling heat and power in supermarkets. Applied Thermal
Engineering 22, 653–665.Maidment, G.G., Zhao, X., Riffat, S.B. and Prosser, G. (1999). Application of combined heat and power and
absorption cooling in a supermarket. Applied Energy 63, 169–190.Maidment, G.G., Zhao, X. and Riffat, S.B. (2001). Combined cooling and heating using a gas engine in a
supermarket. Applied Energy 68, 321–335.Narendran, N. and Raghavan, R. (2002). Solid state lighting for refrigerated display cases. In: Proceedings
of the IIF-IIR Meeting ‘New Technologies in Commercial Refrigeration’, IIR Paris, pp. 66–71.Navaz, H.K., Henderson, B.S., Faramarzi, R., Pourmovahed, A. and Taugwalder, F. (2005). Jet entrainment
rate in air curtain of open refrigerated display cases. International Journal of Refrigeration 28, 267–275.Nesvadba, P. (1985). Radiation heat transfer to products in refrigerated display cabinets. In: Proceed-
ings of the IIF-IIR Meeting ‘Storage Lives of Chilled and Frozen Fish and Fish Products’, IIR Paris,pp. 323–329.
BLUK139-Evans January 23, 2008 17:45
324 Frozen Food Science and Technology
Nyvad, J. and Lund, S. (1996). Indirect cooling with ammonia in supermarkets. In: Proceedings of the IIF-IIRMeeting ‘Applications for Natural Refrigerants’, IIR Paris, pp. 207–217.
Paternico, P. (2005). Environmental Impact Assessment of Display Cabinets during their Life Cycle: LCAAnalysis, Mechanical Engineering Degree Thesis, Tutor prof. G. Cortella, University of Udine (in Italian).
Pearson, A. (2005). Carbon dioxide—new uses for an old refrigerant. International Journal of Refrigeration28, 1140–1148.
Rigot, G. (1990). Meubles et Vitrines Frigorifiques, Pyc edn. Paris.Sarkar, J., Bhattacharyya, S. and Gopal, M.R. (2004). Optimization of a transcritical CO2 heat pump cycle
for simultaneous cooling and heating applications. International Journal of Refrigeration 27, 830–838.Sawalha, S., Rogstam, J. and Nilsson, P-O. (2005). Laboratory tests of NH3/CO2 cascade system for super-
market refrigeration. In: Proceedings of the IIF-IIR Meeting ‘Commercial Refrigeration’, IIR Paris, Paperp. 20.
Schiesaro, P. and Kruse, H. (2002). Development of a two stage CO2 supermarket system. In: Proceedingsof the IIF-IIR Meeting ‘New Technologies in Commercial Refrigeration’, IIR Paris, pp. 11–21.
Tahir, A. and Bansal, P.K. (2005). MEPR versus EEPR valves in open supermarket refrigerated displaycabinets. Applied Thermal Engineering 25, 191–203.
Tassone, A. (1997). Hypermarches: le casse-tete de la climatisation. Revue Pratique du Froid 845, 35–38.Tassou, S.A., Datta, D. and Marriott, D. (2001). Frost formation and defrost control parameters for open
multideck refrigerated food display cabinets. In: Proceedings of the Institution of Mechanical Engineering,Vol. 215, Part A, pp. 213–222.
The Swedish Environmental Management Council. Environmental Product Declaration. Available fromwww.environdec.com.
Watkins, R., Tassou, S.A. and Datta, D. (2004). Life cycle analysis of a commercial refrigerated displaycabinet. In: HPC 2004 – 3rd International Conference on Heat Powered Cycles, Cyprus, October.
Watkins, R., Tassou, S.A. and Pathak, S. (2005). Environmental impacts and life cycle assessment of refriger-ated display cabinets. In: Proceedings of the IIF-IIR Meeting ‘Commercial Refrigeration’, IIR Paris, Paperp. 61.
Zha, S., Harfner, A. and Neksa, P. (2005). Study on transcritical R-744 (CO2) voorhees heat pump cycle. In:Proceedings of the IIF-IIR Meeting ‘Commercial Refrigeration’, IIR Paris, Paper p. 33.
BLUK139-Evans January 23, 2008 17:47
15 Consumer Handling of Frozen Foods
Onrawee Laguerre
15.1 INTRODUCTION
There is a substantial amount of published information on the storage conditions of foodduring its shelf-life. Most of this information concerns the products under the responsibilityof the producer, the processor, the distributor, the wholesaler or the retailer. There is com-paratively little information on what happens following purchase by the consumer from asupermarket until storage in a domestic refrigerator and the effect of the storage conditionson food quality.
Domestic refrigerators are widely used in industrialised countries. There are approximately1 billion domestic refrigerators worldwide (IIR, 2002) and the demand in 2004 was 71.44million units (11.2 million in China, 10.7 million in USA, 4.43 million in Japan, 3.36 millionin India, 3.14 million in Brazil . . . ; JARN, 2005). In developing countries, the production isrising steadily: total production rose 30% in 2000 (Billiard, 2005). In France, there are 1.7refrigerators per household (AFF, 2001). The domestic freezer is a piece of equipment thatfacilitates life and makes it possible to deal with unforeseen situations.
Nowadays, two important phenomena concerning the domestic refrigerator are observed:
– the volume of the appliance has tended to increase. The volume can vary from 230 litres tomore than 400 litres, while the height can be up to 2 m (Lucas, 1996). This can be explainedby a change in consumer lifestyles: consumers tend to shop less often and purchase largerquantities of products. The distance between shops and homes is increasing because of thegrowth of hypermarkets located in suburbs compared with that of supermarkets located inthe centres of cities;
– sales of frozen products are increasing every year. This requires higher storage capacity. Thetop four European countries in terms of consumption of frozen foods par capita, excludingpoultry, are Sweden (46.9 kg), Ireland (46.6 g), the UK (45.5 kg) and Denmark (45.2 kg)(Newsletter of the IIR, No. 25, January, 2006). The leading segments were pizza followedby frozen potatoes.
Epidemiological data from Europe, North America, Australia and New Zealand indicate thata substantial proportion of food born disease is attributable to improper food preparationpractices in consumers’ homes (Redmond and Griffith, 2003). Data also illustrate that a largeproportion of consumers lack knowledge of adequate refrigeration temperatures. Surveyscarried out in various countries on the temperature and the microbial contamination in therefrigerating compartment under real use conditions show an alarming situation (Flynn et al.,
Frozen Food Science and Technology. Edited by Judith A. Evans
© 2008 Blackwell Publishing Ltd, ISBN: 978-1-4051-5478-9

BLUK139-Evans January 23, 2008 17:47
326 Frozen Food Science and Technology
1992; James and Evans, 1992; Lezenne Coulander, 1994; O’Brien, 1997; Sergelidis et al.,1997; Laguerre et al., 2002; Jackson et al., 2007; Azevedo et al., 2005).
Compared to surveys on the refrigerating compartment, few surveys have been carriedout on temperatures in domestic freezers (Olsson and Bengstsson, 1972). The microbialrisk during food preservation in the domestic freezer is negligible since the growth is in-hibited when the temperature is lower than −10◦C (Geiges and Schuler, 1988). However,food quality deterioration is found to happen often during storage: such deterioration in-cludes frost formation, rancidity, colour modification etc. It is therefore necessary to un-derstand the physical and biological phenomena that take place during storage in domesticfreezers.
The objective of this chapter is to present the state of the art of knowledge on frozenfood preservation at home. Several subjects are dealt with: consumer behaviour, the coldproduction system, temperatures in domestic freezers, frost formation in frozen food duringstorage in domestic freezers, the influence of storage conditions on food quality, and homefreezing and thawing.
15.2 CONSUMER BEHAVIOUR
A consumer survey published in the Grand Froid magazine (Anonymous, 1989) showed thatthe freezer has several uses within the family: to preserve purchased frozen products (74.5%of surveyed people), to produce frozen food from purchased fresh food (51.8%), to producefrozen food from personal production (18%) and to preserve left-overs (14.7%). The productswhich the consumer freezes at home are primarily meats, chicken (72% of surveyed people)and vegetables (60.5%).
The INCA national survey (Volatier, 2000) was carried out on the food consumptionof people living in France. Concerning the frozen food handling by the consumer duringtransport to home, this survey showed that:
– certain consumers left frozen food products at ambient temperature for too long a time.35% of the surveyed people left food products for <15 minutes, 55% between 15 and 45minutes and 5% >45 minutes. The distance between the store and home governed the timeinterval between the time of purchase and preservation in a freezer:
– consumers totally trusted their refrigerator, without ensuring adequate maintenance;– consumers did not take any particular precautions when freezing products.
This survey also showed that young people (<45-yr old), workers and people in rural areaswere less conscious of the importance of product temperature. The opposite is true of peopleliving alone and older consumers (>45 yr) who placed their frozen food in a freezer as soon aspossible (about 50% of them leave the frozen food less than 15 min at ambient temperature).81% of the people surveyed bought frozen products and the ice cream at the last momentbefore leaving the supermarket. 67% of the people in the survey used an insulated bag fortransportation of frozen foods. Only 12% of those surveyed checked the temperature in theirfreezers. Women were found to pay more attention to compliance with product temperaturethan men (Brousseau and Volatier, 1999).

BLUK139-Evans January 23, 2008 17:47
Consumer Handling of Frozen Foods 327
15.3 COLD PRODUCTION SYSTEM IN DOMESTICREFRIGERATORS/FREEZERS
There are several types of refrigerator/freezer available in the market: single-door chillerwith an ice box freezer, single-door freezer, double-door fridge-freezers and chest freezers(Fig. 15.1). In addition, there is a growing trend for ‘American style’ larger side-by-sidechillers and freezers. The most common refrigerators and freezers have four major parts to
Single-door fridge with icebox
Single-door freezer
Fig. 15.1 Different types of refrigerator/freezer available in market.
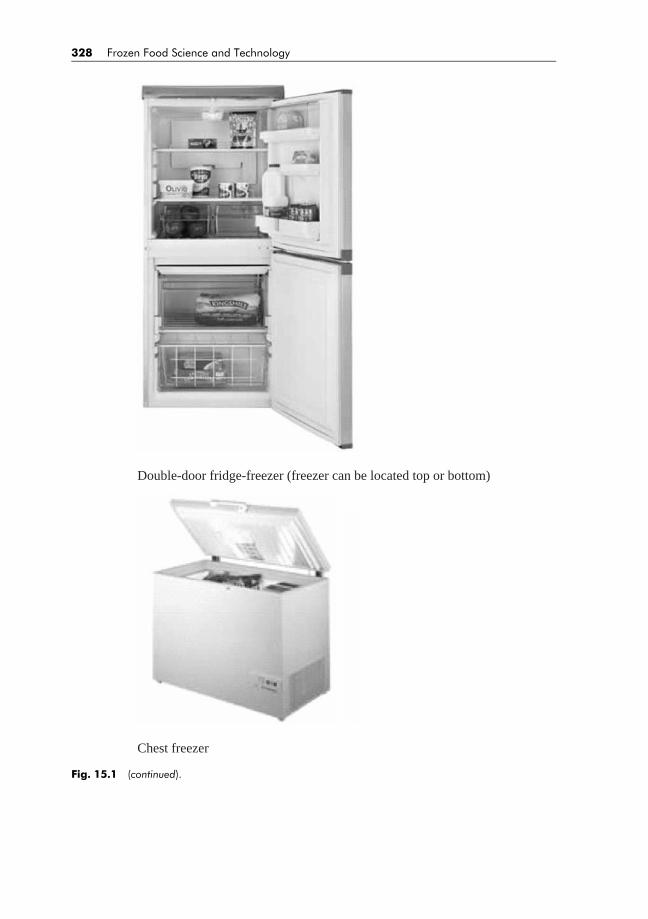
BLUK139-Evans January 23, 2008 17:47
328 Frozen Food Science and Technology
Chest freezer
Double-door fridge-freezer (freezer can be located top or bottom)
Fig. 15.1 (continued).
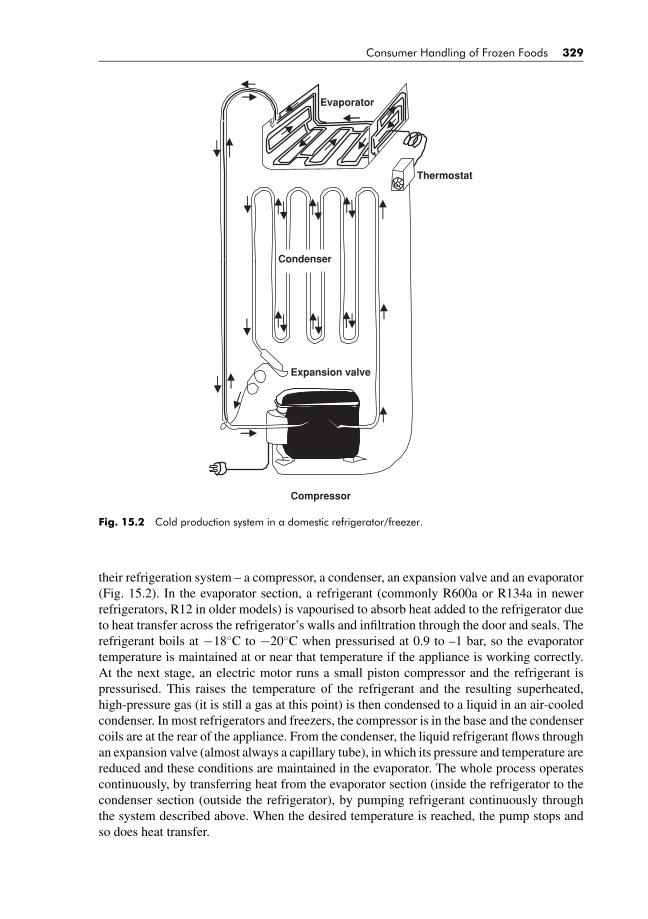
BLUK139-Evans January 23, 2008 17:47
Consumer Handling of Frozen Foods 329
Condenser
Expansion valve
Compressor
Evaporator
Thermostat
Fig. 15.2 Cold production system in a domestic refrigerator/freezer.
their refrigeration system – a compressor, a condenser, an expansion valve and an evaporator(Fig. 15.2). In the evaporator section, a refrigerant (commonly R600a or R134a in newerrefrigerators, R12 in older models) is vapourised to absorb heat added to the refrigerator dueto heat transfer across the refrigerator’s walls and infiltration through the door and seals. Therefrigerant boils at −18◦C to −20◦C when pressurised at 0.9 to –1 bar, so the evaporatortemperature is maintained at or near that temperature if the appliance is working correctly.At the next stage, an electric motor runs a small piston compressor and the refrigerant ispressurised. This raises the temperature of the refrigerant and the resulting superheated,high-pressure gas (it is still a gas at this point) is then condensed to a liquid in an air-cooledcondenser. In most refrigerators and freezers, the compressor is in the base and the condensercoils are at the rear of the appliance. From the condenser, the liquid refrigerant flows throughan expansion valve (almost always a capillary tube), in which its pressure and temperature arereduced and these conditions are maintained in the evaporator. The whole process operatescontinuously, by transferring heat from the evaporator section (inside the refrigerator to thecondenser section (outside the refrigerator), by pumping refrigerant continuously throughthe system described above. When the desired temperature is reached, the pump stops andso does heat transfer.
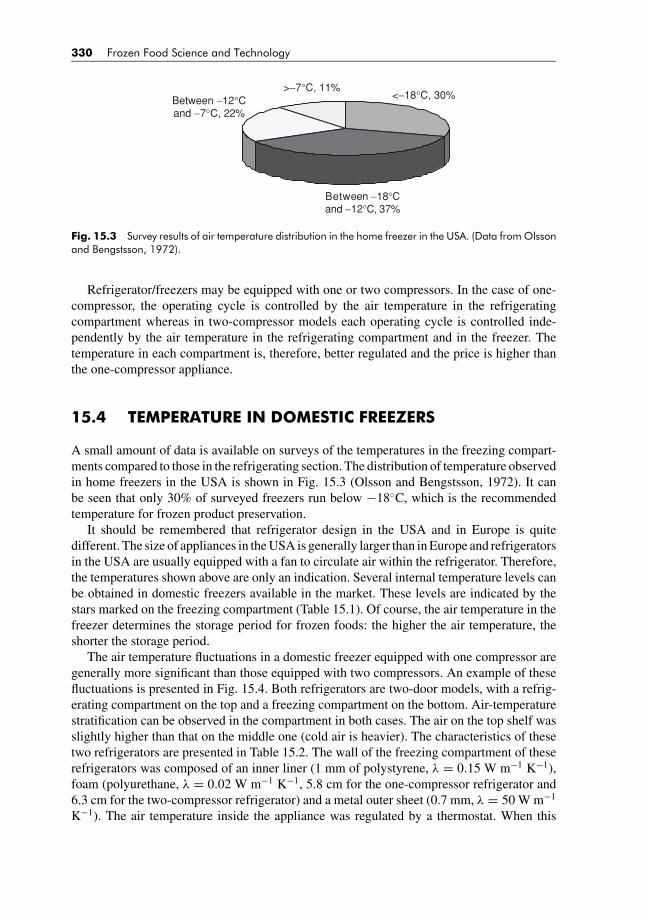
BLUK139-Evans January 23, 2008 17:47
330 Frozen Food Science and Technology
<−18°C, 30%Between −12°Cand −7°C, 22%
>−7°C, 11%
Between −18°Cand −12°C, 37%
Fig. 15.3 Survey results of air temperature distribution in the home freezer in the USA. (Data from Olssonand Bengstsson, 1972).
Refrigerator/freezers may be equipped with one or two compressors. In the case of one-compressor, the operating cycle is controlled by the air temperature in the refrigeratingcompartment whereas in two-compressor models each operating cycle is controlled inde-pendently by the air temperature in the refrigerating compartment and in the freezer. Thetemperature in each compartment is, therefore, better regulated and the price is higher thanthe one-compressor appliance.
15.4 TEMPERATURE IN DOMESTIC FREEZERS
A small amount of data is available on surveys of the temperatures in the freezing compart-ments compared to those in the refrigerating section. The distribution of temperature observedin home freezers in the USA is shown in Fig. 15.3 (Olsson and Bengstsson, 1972). It canbe seen that only 30% of surveyed freezers run below −18◦C, which is the recommendedtemperature for frozen product preservation.
It should be remembered that refrigerator design in the USA and in Europe is quitedifferent. The size of appliances in the USA is generally larger than in Europe and refrigeratorsin the USA are usually equipped with a fan to circulate air within the refrigerator. Therefore,the temperatures shown above are only an indication. Several internal temperature levels canbe obtained in domestic freezers available in the market. These levels are indicated by thestars marked on the freezing compartment (Table 15.1). Of course, the air temperature in thefreezer determines the storage period for frozen foods: the higher the air temperature, theshorter the storage period.
The air temperature fluctuations in a domestic freezer equipped with one compressor aregenerally more significant than those equipped with two compressors. An example of thesefluctuations is presented in Fig. 15.4. Both refrigerators are two-door models, with a refrig-erating compartment on the top and a freezing compartment on the bottom. Air-temperaturestratification can be observed in the compartment in both cases. The air on the top shelf wasslightly higher than that on the middle one (cold air is heavier). The characteristics of thesetwo refrigerators are presented in Table 15.2. The wall of the freezing compartment of theserefrigerators was composed of an inner liner (1 mm of polystyrene, λ = 0.15 W m−1 K−1),foam (polyurethane, λ = 0.02 W m−1 K−1, 5.8 cm for the one-compressor refrigerator and6.3 cm for the two-compressor refrigerator) and a metal outer sheet (0.7 mm, λ = 50 W m−1
K−1). The air temperature inside the appliance was regulated by a thermostat. When this
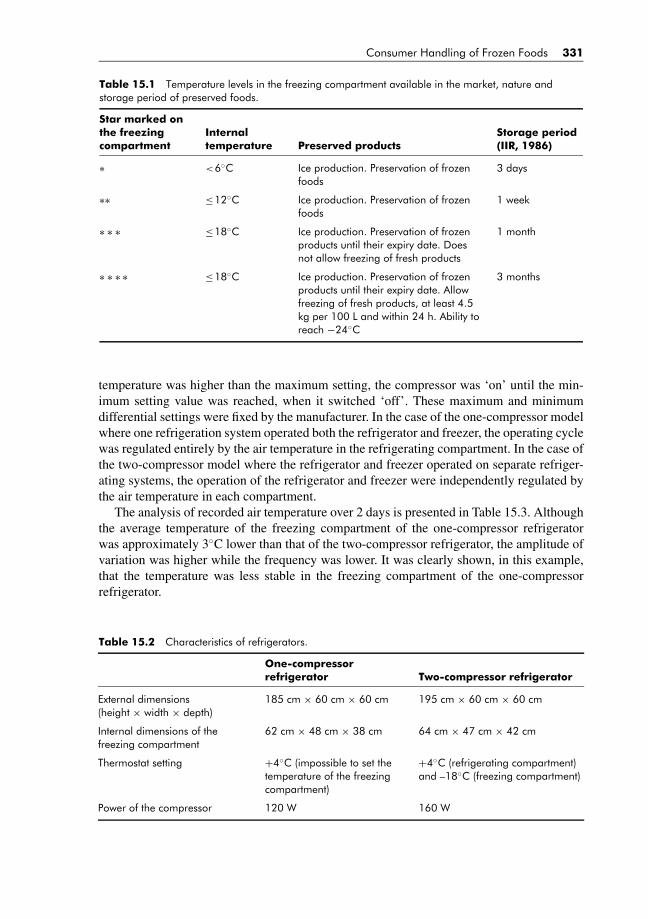
BLUK139-Evans January 23, 2008 17:47
Consumer Handling of Frozen Foods 331
Table 15.1 Temperature levels in the freezing compartment available in the market, nature andstorage period of preserved foods.
Star marked onthe freezingcompartment
Internaltemperature Preserved products
Storage period(IIR, 1986)
∗ <6◦C Ice production. Preservation of frozenfoods
3 days
∗∗ ≤12◦C Ice production. Preservation of frozenfoods
1 week
∗ ∗ ∗ ≤18◦C Ice production. Preservation of frozenproducts until their expiry date. Doesnot allow freezing of fresh products
1 month
∗ ∗ ∗ ∗ ≤18◦C Ice production. Preservation of frozenproducts until their expiry date. Allowfreezing of fresh products, at least 4.5kg per 100 L and within 24 h. Ability toreach −24◦C
3 months
temperature was higher than the maximum setting, the compressor was ‘on’ until the min-imum setting value was reached, when it switched ‘off’. These maximum and minimumdifferential settings were fixed by the manufacturer. In the case of the one-compressor modelwhere one refrigeration system operated both the refrigerator and freezer, the operating cyclewas regulated entirely by the air temperature in the refrigerating compartment. In the case ofthe two-compressor model where the refrigerator and freezer operated on separate refriger-ating systems, the operation of the refrigerator and freezer were independently regulated bythe air temperature in each compartment.
The analysis of recorded air temperature over 2 days is presented in Table 15.3. Althoughthe average temperature of the freezing compartment of the one-compressor refrigeratorwas approximately 3◦C lower than that of the two-compressor refrigerator, the amplitude ofvariation was higher while the frequency was lower. It was clearly shown, in this example,that the temperature was less stable in the freezing compartment of the one-compressorrefrigerator.
Table 15.2 Characteristics of refrigerators.
One-compressorrefrigerator Two-compressor refrigerator
External dimensions(height × width × depth)
185 cm × 60 cm × 60 cm 195 cm × 60 cm × 60 cm
Internal dimensions of thefreezing compartment
62 cm × 48 cm × 38 cm 64 cm × 47 cm × 42 cm
Thermostat setting +4◦C (impossible to set thetemperature of the freezingcompartment)
+4◦C (refrigerating compartment)and –18◦C (freezing compartment)
Power of the compressor 120 W 160 W
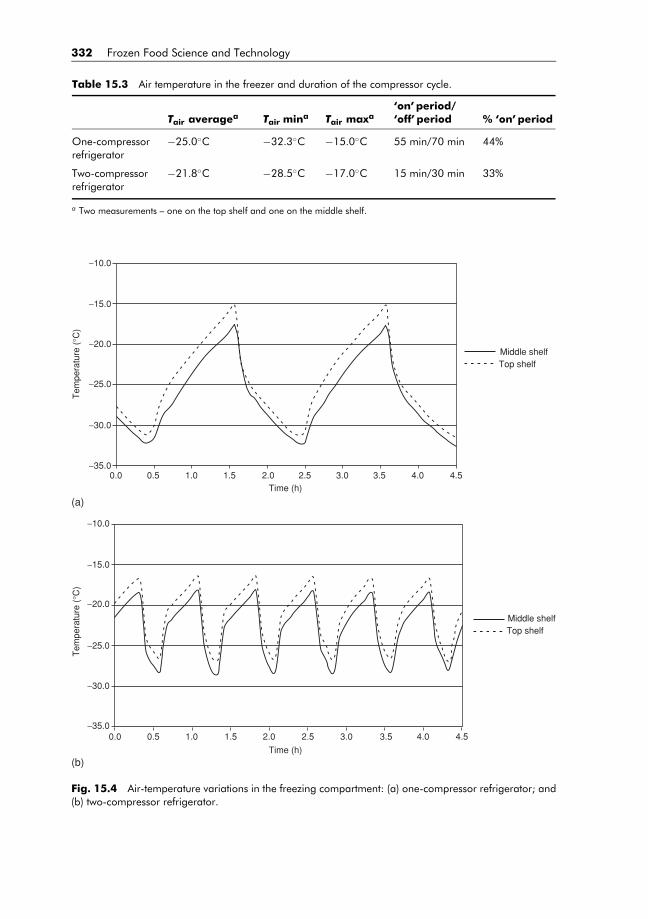
BLUK139-Evans January 23, 2008 17:47
332 Frozen Food Science and Technology
Table 15.3 Air temperature in the freezer and duration of the compressor cycle.
Tair averagea Tair mina Tair maxa‘on’ period/‘off’ period % ‘on’ period
One-compressorrefrigerator
−25.0◦C −32.3◦C −15.0◦C 55 min/70 min 44%
Two-compressorrefrigerator
−21.8◦C −28.5◦C −17.0◦C 15 min/30 min 33%
a Two measurements – one on the top shelf and one on the middle shelf.
−10.0
−10.0
−15.0
−20.0
−25.0
−30.0
−35.00.0 0.5 1.0 1.5 2.0 2.5 3.0 3.5 4.0 4.5
−15.0
−20.0
−25.0
−30.0
−35.00.0 0.5 1.0 1.5 2.0 2.5 3.0 3.5 4.0 4.5
Middle shelfTop shelf
Middle shelfTop shelf
Tem
pera
ture
(°C
)T
empe
ratu
re (
°C)
Time (h)
Time (h)
(a)
(b)
Fig. 15.4 Air-temperature variations in the freezing compartment: (a) one-compressor refrigerator; and(b) two-compressor refrigerator.
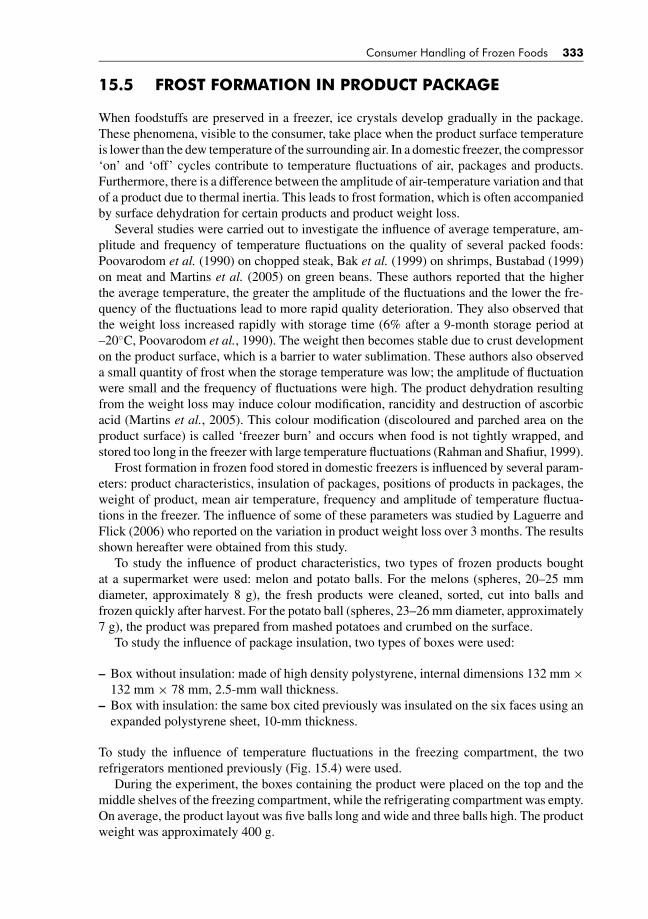
BLUK139-Evans January 23, 2008 17:47
Consumer Handling of Frozen Foods 333
15.5 FROST FORMATION IN PRODUCT PACKAGE
When foodstuffs are preserved in a freezer, ice crystals develop gradually in the package.These phenomena, visible to the consumer, take place when the product surface temperatureis lower than the dew temperature of the surrounding air. In a domestic freezer, the compressor‘on’ and ‘off’ cycles contribute to temperature fluctuations of air, packages and products.Furthermore, there is a difference between the amplitude of air-temperature variation and thatof a product due to thermal inertia. This leads to frost formation, which is often accompaniedby surface dehydration for certain products and product weight loss.
Several studies were carried out to investigate the influence of average temperature, am-plitude and frequency of temperature fluctuations on the quality of several packed foods:Poovarodom et al. (1990) on chopped steak, Bak et al. (1999) on shrimps, Bustabad (1999)on meat and Martins et al. (2005) on green beans. These authors reported that the higherthe average temperature, the greater the amplitude of the fluctuations and the lower the fre-quency of the fluctuations lead to more rapid quality deterioration. They also observed thatthe weight loss increased rapidly with storage time (6% after a 9-month storage period at–20◦C, Poovarodom et al., 1990). The weight then becomes stable due to crust developmenton the product surface, which is a barrier to water sublimation. These authors also observeda small quantity of frost when the storage temperature was low; the amplitude of fluctuationwere small and the frequency of fluctuations were high. The product dehydration resultingfrom the weight loss may induce colour modification, rancidity and destruction of ascorbicacid (Martins et al., 2005). This colour modification (discoloured and parched area on theproduct surface) is called ‘freezer burn’ and occurs when food is not tightly wrapped, andstored too long in the freezer with large temperature fluctuations (Rahman and Shafiur, 1999).
Frost formation in frozen food stored in domestic freezers is influenced by several param-eters: product characteristics, insulation of packages, positions of products in packages, theweight of product, mean air temperature, frequency and amplitude of temperature fluctua-tions in the freezer. The influence of some of these parameters was studied by Laguerre andFlick (2006) who reported on the variation in product weight loss over 3 months. The resultsshown hereafter were obtained from this study.
To study the influence of product characteristics, two types of frozen products boughtat a supermarket were used: melon and potato balls. For the melons (spheres, 20–25 mmdiameter, approximately 8 g), the fresh products were cleaned, sorted, cut into balls andfrozen quickly after harvest. For the potato ball (spheres, 23–26 mm diameter, approximately7 g), the product was prepared from mashed potatoes and crumbed on the surface.
To study the influence of package insulation, two types of boxes were used:
– Box without insulation: made of high density polystyrene, internal dimensions 132 mm ×132 mm × 78 mm, 2.5-mm wall thickness.
– Box with insulation: the same box cited previously was insulated on the six faces using anexpanded polystyrene sheet, 10-mm thickness.
To study the influence of temperature fluctuations in the freezing compartment, the tworefrigerators mentioned previously (Fig. 15.4) were used.
During the experiment, the boxes containing the product were placed on the top and themiddle shelves of the freezing compartment, while the refrigerating compartment was empty.On average, the product layout was five balls long and wide and three balls high. The productweight was approximately 400 g.
BLUK139-Evans January 23, 2008 17:47
334 Frozen Food Science and Technology
0
6.0
5.0
4.0
3.0
2.0
1.0
Wei
ght l
oss
(%)
0.020 40
Time (days)
60 80 100
box without insulationbox with 10 mminsulation
Fig. 15.5 Influence of package insulation on product (melon balls) weight loss during storage in afreezing compartment (two-compressor refrigerator).
The product weight, after frost elimination, was measured once every week or 2 weeksduring the 3-month storage period. The results of this study are described in the followingsection.
15.5.1 Influence of package insulation
Figure 15.5 presents the weight loss of melon balls in the box with and without insulation.For the box with insulation, the weight loss was negligible even after a 3-month storageperiod (<0.5% after a 3-month storage period). There was a noticeable increase in the weightloss of the box without insulation, which reached 5% after a 3-month storage period. In thisbox, it was observed that the frost deposited primarily on the bottom horizontal wall. Muchless frost formed on the top horizontal wall and no frost was observed on the vertical walls.Moreover, more frost deposits occurred on the product located at the centre of the box thanthat on the sides.
15.5.2 Influence of the product characteristics
The weight loss of frozen melon and potato balls in the box without insulation is presentedin Fig. 15.6. It can be seen that the weight loss of potato balls is lower than that of melon.This can be explained by the fact that the crumbed surface of the frozen potato balls was abarrier to water flux, which slowed down water sublimation.
Only a small quantity of frost was observed in the product with low surface water activity(potato balls) since the partial vapour pressure (driving force of water migration) was low inthis case.
15.5.3 Influence of refrigerator characteristics
The weight loss of melon in boxes without insulation stored in the freezing compartmentof the one- and two-compressor refrigerators is presented in Fig. 15.7. It can be seen thatthe weight loss was slightly higher when the product was stored in the one-compressorrefrigerator. This was because there were more temperature variations in the one-compressorrefrigerator (greater amplitude of air temperature outside the box and lower frequency).

BLUK139-Evans January 23, 2008 17:47
Consumer Handling of Frozen Foods 335
0.0
1.0
2.0
3.0
4.0
5.0
6.0
0 20 40 60 80 100Time (days)
Wei
ght l
oss
(%)
melon ball (box withoutinsulation)
potato ball (box withoutinsulation)
Fig. 15.6 Influence of product characteristics on weight loss during storage in the freezing compartmentof a two-compressor refrigerator.
15.5.4 Air and product temperature variations
The variations in the air and product core temperatures (melon balls) inside the box withoutinsulation are presented in Fig. 15.8. It can be seen that the air temperature (Ta) fluctuationsare more significant than those of the product (Tp). Figure 15.8(a) shows that the fluctuationwas more noticeable near the side walls (Tp1 and Ta1) compared to that in the middle of thebox (Tp2 and Ta2). This was primarily due to thermal inertia. Figure 15.8(b) shows that theproduct and air temperatures were lower at the bottom of the box. Moreover, the temperaturefluctuations at the bottom (Tp3, Ta3) were more significant than those at the top (Tp4, Ta4).This appeared to be due to the air layer (approximately 10-mm thickness) at the top of thebox, which played an insulating role.
0.0
1.0
2.0
3.0
4.0
5.0
6.0
0 20 40 60 80 100Time (days)
Wei
ght l
oss
(%)
One compressor(boxwithout insulation)
Two compressors (boxwithout insulation)
Fig. 15.7 Influence of refrigerator characteristics (one- and two-compressor models) on product weightloss (melon balls) during storage in a freezing compartment.

BLUK139-Evans January 23, 2008 17:47
336 Frozen Food Science and Technology
(a)
(b)
−22.4
− 22.2
−22.0
−21.8
−21.6
−21.4
−21.2
−21.0
−20.4
−20.8
−20.6
0.0 0.5 1.0 1.5 2.0 2.5 3.0 3.5 4.0 4.5
Time (h)
Tem
pera
ture
(°C
)
Ta1
Tp1
Ta2
Tp2
−22.4
−22.2
−22.0
−21.8
−21.6
−21.4
−21.2
−21.0
−20.8
−20.6
−20.4
0.0 0.5 1.0 1.5 2.0 2.5 3.0 3.5 4.0 4.5
Time (h)
Tem
pera
ture
(°C
)
Ta3
Tp3
Ta4
Tp4
Ta3
Tp2 Tp1
Tp3
Tp4
Ta4
Ta1 Ta2
Fig. 15.8 Variations in air and product (melon balls) core temperature at different positions in a boxwithout insulation.

BLUK139-Evans January 23, 2008 17:47
Consumer Handling of Frozen Foods 337
Ta T1
T3
T2 T1
T4
T2
T3
T4
t
Ta T1 T2
Ta
t
T1 T2
Ta
(a) (b)
>
<
Fig. 15.9 Airflow by natural convection inside a product box preserved in a freezer (a) at the end ofa period during which the compressor was turned off; and (b) at the end of a period during which thecompressor was turned on.
15.5.5 Interpretation of results
It can be observed in Fig. 15.8 that the air and product temperature changes were ratherperiodic. The fluctuation frequency was the same for all the points and corresponded to thefrequency of the on/off cycle of the compressor. The minimum temperature was not obtainedat the same time for all positions. However, there was a delay corresponding to the effects ofinertia: when the compressor was turned on, after the air near the regulating sensor reachedthe maximum differential value resulting in the air in the freezing compartment being firstcooled down. In turn, the air cools down the outer part of the product in the box, and finally thecore region of the product was cooled down. Thus, the temperature of the core region reachedits minimum value when the compressor had already turned off and the air temperature wasalready increasing. Figure 15.9 shows the supposed airflow in a package of particle products.
At least four regions can be distinguished in the product box:� core region, where the temperature variation was low;� base region, where the mean temperature was lower than the middle area. In this position,the temperature variation can be significant if the box is not well insulated;� top region, where the mean temperature was higher than at the base. In this position, thetemperature variation was relatively low because of the air layer (between the product andthe top package wall), which provided additional insulation;� side region, where the mean temperature was close to that in the middle and the temperaturevariation can be significant.
For the box without insulation, frost deposited particularly on the product located in thecentral zone of the box and on the bottom horizontal surface of the box. Frost developed inthe zone where the temperature was low in the box and/or where the temperature variationwas low. This was the case at the bottom of the box (thermal stratification) and at the centre(thermal inertia). For the insulated box, only a small quantity of frost was observed, since theair and product temperature were relatively homogeneous and constant.
A use condition such as door opening contributes not only to the air temperature fluctua-tions in the freezer; it also contributes to the frost formation on the evaporator which reducesthe efficiency of the exchange between evaporator and air. The frost formation leads to in-creased energy consumption of the appliance equipped with electrical defrost. However, this
BLUK139-Evans January 23, 2008 17:47
338 Frozen Food Science and Technology
may not be the case for manual defrost appliances such as chest freezers or models with anice box. The influence of the door opening on the temperature variations and on the energyconsumption was studied by Liu et al. (2004) and Saidur et al. (2002). They recommendedthat the door be kept closed for as long as possible to minimise the frost formation and theenergy consumption.
15.6 INFLUENCE OF STORAGE OF FROZEN FOODSIN DOMESTIC FREEZERS ON QUALITY
At home, we deal with combinations of an almost infinite number of variables. A wide range offoods of varying quality at the purchase point come into the home. These foods are then storedfor different periods of time in various ways, according to the habits, beliefs and knowledgeof the consumer. Collecting and sorting the scientific and sociological information, to assessthe effect of domestic storage on food quality is a daunting prospect (Cook, 1978).
During frozen storage, there is a gradual and irreversible loss of quality with time. Theloss of quality arises from the individual or combined effects of physical, physico-chemical,chemical or biochemical changes. However, there is usually one limiting factor that influencesthe storage life of frozen food (e.g. desiccation, enzyme-induced changes). Proper applicationof temperatures and proper packaging can retard the quality degradation.
The mechanisms of quality degradation are already presented in another chapter. Onlystudies concerning the influence of storage in a domestic freezer on the quality of frozenfoods are presented here.
The freezing rate, storage temperature and duration of storage in domestic freezing wereshown to affect certain quality aspects of the final product such as colour, texture, tenderness,juiciness and flavour. For meat, some authors (Verbeke et al., 1984) observed that the freezingand thawing rates used in their study had no demonstrable effect on sensory quality (driploss, colour and tenderness). This indicates that domestic freezing and thawing procedureswere of minor importance for the eating quality of the meat. Some studies reported differentobservations, for example, Kandeepan and Biswas (2005) found that the odour and flavourdecreased with storage period (negative effect) while the texture, tenderness and juicinessincreased with storage period (positive effect). These authors also found that microbial con-tamination decreased during storage in a freezing compartment while it increased in therefrigerating compartment. These authors recommended a storage period of up to 30 days ina freezer in order to satisfactorily maintain the quality of meat. The effect of fluctuating andconstant temperature during storage in chest freezer (−30◦C and −10◦C) and in ultra-lowtemperature freezer (−60◦C) on food quality was also investigated by Gormley et al. (2002).Several products were studied: frozen raw salmon, smoked mackerel, stewed pork pieces, icecream, pizza, hollandaise sauce, strawberries and blanched broccoli. These authors reportedthat the temperature regimes had a significant effect on peroxide and free fatty acid values.However, they had a minimal effect on texture, colour, water-holding capacity and drip losson thawing on most of the products.
The microbiological risk associated with storage of frozen food is negligible. Severalstudies showed that at −8◦C, the reproduction of bacteria in food is limited. The investigationof Geiges and Schuler (1988), Schmidt-Lorenz (1963) and Schmidt-Lorenz and Gutschmidt(1968, 1969) showed that at −5◦C, bacterial reproduction of the order of 3–5 log unitsper gram is possible. It can therefore be presumed that the lowest temperature at whichbacteria can reproduce is around −8◦C. Yeast can better tolerate cold than bacteria. The
BLUK139-Evans January 23, 2008 17:47
Consumer Handling of Frozen Foods 339
same authors (Schmidt-Lorenz, 1963; Schmidt-Lorenz and Gutschmidt, 1968, 1969) foundthat the reproduction of yeast was limited at approximately −10◦C.
The storage temperature of −18◦C that is specified for deep-frozen food in most countriesimplies that micro-organisms will not reproduce under these conditions. The allowance inmany legal specifications for basic temperatures of up to −15◦C during short periods whenthe frozen products are being moved shows that constant temperatures cannot be achievedin practice. Temperature fluctuations can occur during transport by the consumer from thestore to the domestic freezer and also during freezer defrosting operations.
Experience of earlier phases of deep freezing technology has shown that it is not possibleto store food for long periods at a temperature that is only slightly below the growth limit ofmicro-organisms. Food thus stored shows noticeable signs of deterioration that is independentof the growth of micro-organisms and can be traced to the activity of enzymes. Hall and Alcock(1987), who investigated the influence of microbial enzymes on the sensory quality of foodafter 6 months’ storage at −15◦C, noticed that deterioration occurred at a slightly reducedrate even during storage at −29◦C.
Temperature abuse does have a negative influence and will contribute to quality deteriora-tion. If temperature abuse is not severe or the duration is short, the quality degradation maynot be significantly noticeable. To confirm this, a study (Sorensen, 2002) involving 14 prod-ucts was carried out (orange and melon juices, prepared dish, tuna steaks, breaded whiting,cheesecake, peas, wrinkled, scampi, ice cream, cod, broccoli, gateaux, broad beans). Theseproducts were exposed to the same temperature abuse model, simulating a poor freezer chain,including simulation of home transport (2 h at room temperature). In most cases, the tastepanel found no difference between samples subjected to temperature abuse and control sam-ples (kept at a constant temperature around −20◦C). However, differences in the appearancesof the frozen samples were often recorded.
15.7 HOME FREEZING
The number of consumers using home freezers is increasing. Home freezing of food productsis becoming widespread nowadays since it concerns 83% of families (Volatier, 2000). Manyconsumers purchase fresh retail cuts of meat, place them in a freezer and later thaw thembefore cooking. This survey also showed that home freezing is in relation to the numberof people in a family (more people, more home freezing), age (young people, <25-yr old,less freezing), the professional status of the person (workers practice less freezing). 11% ofsurveyed people said that they do not use any particular precautions when freezing.
An example of temperature monitoring during the shelf-life of a package of chilled meatproduct from factory to consumer is shown in Fig. 15.10 (Derens et al., 2003). In this study,a data logger was discreetly inserted inside the product at a factory, then, it followed the coldchain until the consumption point. In fact, the consumer discovered the presence of the datalogger only when he or she opened the package. An explanation displayed inside the packageallowed him or her to send the data logger back to the authors for analysis of the producttemperature. The expertise of these authors enabled the following time–temperature historyof the product to be developed:
– 0–10 hours, factory.– 10–20 hours, transport. The product temperature was stable at 2◦C.
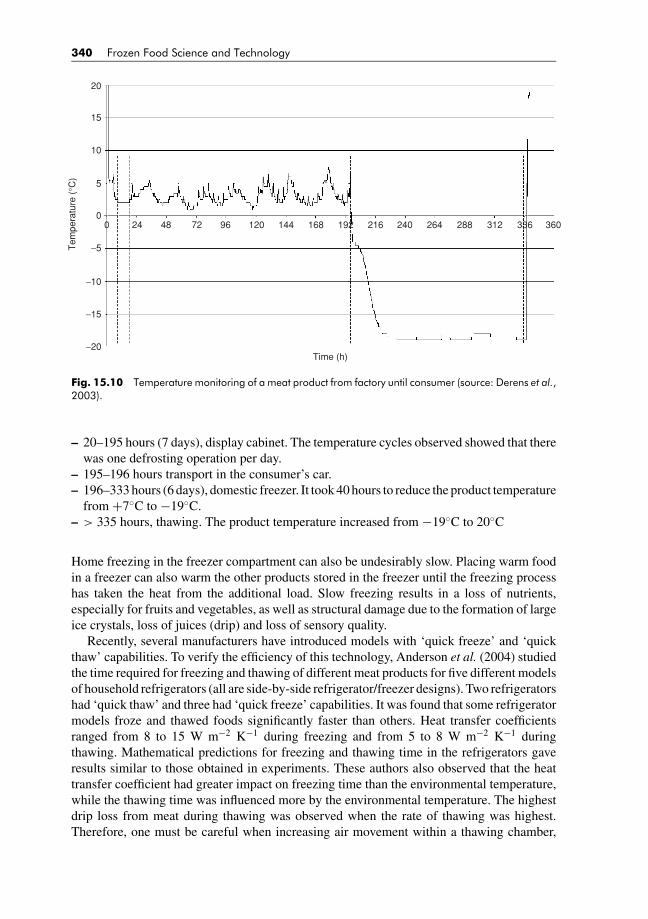
BLUK139-Evans January 23, 2008 17:47
340 Frozen Food Science and Technology
20
15
10
5
Tem
pera
ture
(°C
)
00 24 48 72 96 120 144 168 192 216 240 264 288 312 336 360
−5
−10
−15
−20Time (h)
Fig. 15.10 Temperature monitoring of a meat product from factory until consumer (source: Derens et al.,2003).
– 20–195 hours (7 days), display cabinet. The temperature cycles observed showed that therewas one defrosting operation per day.
– 195–196 hours transport in the consumer’s car.– 196–333 hours (6 days), domestic freezer. It took 40 hours to reduce the product temperature
from +7◦C to −19◦C.– > 335 hours, thawing. The product temperature increased from −19◦C to 20◦C
Home freezing in the freezer compartment can also be undesirably slow. Placing warm foodin a freezer can also warm the other products stored in the freezer until the freezing processhas taken the heat from the additional load. Slow freezing results in a loss of nutrients,especially for fruits and vegetables, as well as structural damage due to the formation of largeice crystals, loss of juices (drip) and loss of sensory quality.
Recently, several manufacturers have introduced models with ‘quick freeze’ and ‘quickthaw’ capabilities. To verify the efficiency of this technology, Anderson et al. (2004) studiedthe time required for freezing and thawing of different meat products for five different modelsof household refrigerators (all are side-by-side refrigerator/freezer designs). Two refrigeratorshad ‘quick thaw’ and three had ‘quick freeze’ capabilities. It was found that some refrigeratormodels froze and thawed foods significantly faster than others. Heat transfer coefficientsranged from 8 to 15 W m−2 K−1 during freezing and from 5 to 8 W m−2 K−1 duringthawing. Mathematical predictions for freezing and thawing time in the refrigerators gaveresults similar to those obtained in experiments. These authors also observed that the heattransfer coefficient had greater impact on freezing time than the environmental temperature,while the thawing time was influenced more by the environmental temperature. The highestdrip loss from meat during thawing was observed when the rate of thawing was highest.Therefore, one must be careful when increasing air movement within a thawing chamber,
BLUK139-Evans January 23, 2008 17:47
Consumer Handling of Frozen Foods 341
because this may result in increased drip loss and evaporation, especially if the product isnot fully sealed. However, the temperature should be sufficiently low to prevent microbialgrowth.
Power failures can occur, and in this case the temperature of products and potential formicrobial growth in domestic freezers rises. In order to acquire information on whetheror not the frozen products can still be consumed after a power failure over certain period,Bedinghaus and Ockerman (1991) carried out a study on frozen meat products stored inhome freezers. They investigated this concern by using an upright home freezer. Fourteentrials were conducted with packages of either beef or pork with varying trial load weights(43–128 kg). Meat samples were frozen, the power was turned off and the door remainedclosed. The door was then opened (daily for 9 days) only when packages within each lotwere removed for analysis of temperature, microbial count and pH. These authors concludedthat, after about 36 hours without electricity, bacterial populations reached log 6 and the meatproduct’s wholesomeness for consumption or possible refreeze became questionable.
15.8 HOME THAWING
During thawing, the exudation from all food is a result of physical phenomena which takeplace during freezing and thawing. The quantity of exudation is influenced by several factors(Durosset, 1997):� freezing process (slow freezing rate, more exudation);� temperature fluctuations during storage period (more fluctuations, more exudation);� freezing storage period (longer storage period, more exudation);� thawing process (quick thawing rate, more exudation);� dimensions of the product (smaller size, more exudation);� nature of the product (more water content, more exudation);� storage period used for the thawed product (longer period, more exudation).
As mentioned previously, the microbial risk is negligible during frozen storage since mi-crobial growth is inhibited when the temperature is lower than −10◦C. However, this riskis considerable during thawing. Two factors are favourable for microbial growth in thawedproducts:� cellular membrane damage, particularly where a slow freezing rate is applied. This dam-
age allows the penetration of micro-organisms inside the tissue. Then, microbial growthaccelerates with higher temperatures;� exudates of some products are rich in nutritive substances promoting bacterial multipli-cation.
To limit microbial growth during thawing, particularly growth of psychrotrophic bacteria,thawing should be performed under the following conditions:� short time period;� product temperature (surface and centre) less than 2◦C.

BLUK139-Evans January 23, 2008 17:47
342 Frozen Food Science and Technology
Exudation causes not only product weight loss and microbial risk; it also leads to sensorialand nutritional deterioration. One implication of EU legislation is that the surface temperatureof meat should not rise above 7◦C and offal above 3◦C during thawing. As some consumersmay use inappropriate thawing methods, store the thawed foods too long at a temperaturethat is too high, and have no access to fast freezing, a message specifying ‘do not refreezefoods after defrosting’ on the package must be clear (EU Directive 89/108). The CanadianFood Inspection Agency advises consumers to discard any thawed food that has remained atroom temperature for more than 2 hours. Refrigerators typically operate at 0–5◦C; however,thawing in a refrigerator can be undesirably slow. In addition, these foods occupy refrigeratorspace and may cross-contaminate foods stored in the refrigerator.
When thawing is recommended, it is preferable to thaw products in the refrigeratingcompartment to avoid a product temperature that is too high, particularly at the surface. Ifthawing at ambient temperatures must be done, the duration should not exceed 3–4 hours(Sorensen, 2002). This may be good advice for consumers, as it ensures that the temperatureof the food does not become so high as to result in excessive microbial growth, especially ofpathogenic bacteria. After thawing, the product should be cooked or consumed directly.
15.9 CONSUMER RECOMMENDATIONS
Poor temperature control of foods in the home is a major cause of food poisoning. A consumerguide for food handling was proposed by Brady (1995). Some recommendations for shopping,storage temperature, preparation, thawing, cooking, serving, reheating were presented by theauthor. After purchase of a frozen product from a supermarket, the recommended producttemperature must be maintained by the consumer until storage in the domestic freezer. Itis necessary to protect the food during the carry-home period by keeping this period short(i.e. by buying frozen foods at the end of a shopping trip). It is also necessary to protect theproduct by using insulated cool bags or boxes during transport to the home. Frozen foodsshould be transferred into a suitable cold storage appliance immediately on arriving home.If no precautions are taken when the consumer transports the product to the home, producttemperatures may rise rapidly. For example, the temperature of spinach (a 500-g package)can increase from −18◦C to −15◦C within 10 minutes (Gac, 1994).
There are a few surveys on home freezer management in relation to the quality of foodcoming from the freezer. An analysis of numerous surveys and comments from a considerablenumber of consumers indicate that there are consumer practices that lead to poorer qualityfood from the freezer. The causes are listed in Table 15.4.
Table 15.4 Causes of poor quality food from the home freezer (Source: Cook, 1978).
(1) Purchase of lower quality frozen foods:• low-quality raw material;• poor cold chain, e.g. retail display at temperatures that are too high.
(2) Home freezing of poor quality raw materials:• over-mature garden produce;• poor-quality meat.
(3) Freezing at temperatures that are too high.(4) Keeping food too long in the freezer.(5) Freezing too much food too often.
BLUK139-Evans January 23, 2008 17:47
Consumer Handling of Frozen Foods 343
As for industrial products, food to be frozen should be in perfect hygienic condition andof prime quality. The temperature of many home freezers can be regulated. According tothe weight of product to be frozen, the freezer should be set at its lowest temperature up to1 day before adding a new batch of food for freezing and returned to the usual setting, about−18◦C, the following day.
Joints of meat and thick fish fillets, or whole fish cook more satisfactorily in the thawedstate. It is especially important to thaw all poultry completely; otherwise cooking is unlikelyto be complete at the centre. This may lead to a health hazard. Small chops, steaks or fishmay be cooked from frozen, or partially thawed, provided lower cooking temperatures andlonger times are allowed.
The door or lid of the freezer must be kept closed. It should only be opened when requiredto load or remove something and closed immediately afterwards. The door should not beleft open for longer than necessary. During door openings temperature fluctuations in chestfreezers are less significant than those of upright models due to the cold air contained withinthe well of the chest freezer whereas the cold air is not so well contained in upright freezers.Also unfrozen food should not be placed adjacent to frozen food in the freezer as the frozenfood will warm up and its quality will deteriorate. Food for freezing should be placed in thefast freeze compartment until frozen.
In the case of breakdown or power failure, the freezer should not be opened. A fully loadedunopened freezer will maintain an adequate temperature for many hours.
Consumers should defrost their freezer from time to time (unless it is a frost-free type).Defrosting should be done when more than 5 mm of ice has accumulated on the walls. Thetiming of this operation should be chosen to coincide with low stocks. Any remaining stocksshould be placed in the refrigerator or in insulated ‘cool bags’ while defrosting is carried out.Ice should be scraped off the side walls with a wooden or plastic spatula before washing outwith warm water or a solution of 30 g bicarbonate of soda for 2 litres of water and then drywith a soft cloth. A knife should not be used to scrape the frost as it may result in damage tothe refrigeration system.
When buying a freezer, consumers should make sure it will work in the position desired,possibly in a hot kitchen, in a built-in unit, under a work surface or in an outbuilding thatis cold in winter. There are a range of optimal ambient temperatures for refrigerator/freezeroperation. This is indicated by the manufacturers using the following symbol: N (16–32◦C),NS (10–32◦C), ST (18–38◦C) and R (18–43◦C). The last one (R) is suitable for the hotand humid conditions (up to 80% relative humidity). The storage temperature of the frozenfood is more important than the size, shape, convenience, ‘add-on gimmick’ or price ofthe freezer (Gigiel, 1998). The temperature in the freezer and the energy consumption ofthe appliance are greatly influenced by the environmental conditions. The consumer mustchoose a dry, well-ventilated and temperate site, allowing at least 5 cm space for free aircirculation around the condenser. This then allows a high rate of heat extraction from theappliance.
Increased consumer education will result in demand for refrigerators that maintain foodat correct low temperatures. It is technically possible for manufacturers to supply these typesof domestic refrigerators, but they are more expensive. For the purchase decision-makingby the consumer, the degree of food temperature control is less important than the price. Itwould be preferable to address this issue in the future. Finally, consumer good practice in theoperation of freezers can contribute to reducing microbiological risk and quality loss fromfoods stored in the home.
BLUK139-Evans January 23, 2008 17:47
344 Frozen Food Science and Technology
15.10 ENERGY LABELLING
Energy consumption of domestic refrigerators and freezers has attracted considerable atten-tion worldwide due to environmental awareness. Consumers are encouraged to use moreenergy-efficient appliances which also ensure overall product quality. The manufacturersperform energy-consumption tests on a random sample of their appliances, which they reporton the energy-consumption labels attached to every unit on sale. This is a common practice inmany countries nowadays. It is difficult to compare the energy efficiency of different modelsof refrigerators/freezers precisely because each of them varies in its features and utility. The‘star rating’ is an indicator derived from an algorithm that relates the energy consumptionwith the internal volume. This indication is used to complement information on the energyconsumption per year (kW h per year). Some studies (Meier and Heinemeier, 1988; Meier andJansky, 1993) showed that the energy consumption in field use correspond to that measuredin the laboratory (for some models, the energy consumption is lower in field use).
The test procedure to prepare the energy-consumption labels depends on the test standardrelevant to the country where the refrigerators/freezers are being used. There are a numberof energy-consumption test standards around the world. This leads to different energy con-sumption determined from one standard to the other when the same cabinet is used. This isdue to different factors included in the test conditions such as compartment internal temper-atures, number and locations of thermocouples and door openings. It is therefore interestingto establish correlation between the energy consumption obtained from various standards.
REFERENCES
AFF (Association Francaise du Froid). (2001). Conseil National du Froid. Livre blanc sur les fluides frig-origenes. Paris, p. 51.
Anderson, B.A. et al. (2004). Thawing and freezing of selected meat products in household refrigerators.International Journal of Refrigeration 27(1), 63–72.
Azevedo, I. Regalo, M., Mena, C., Almeida, G., Carneiro, L., Teixeira, P., Hogg, T. and Gibbs, P.A. (2005).Incidence of Listeria spp. in domestic refrigerators in Portugal. Food Control 16, 121–124.
Bak, L.S., Anderson, A.B., Anderson, E.M. and Bertelsen G. (1999). Effect of modified atmosphere packagingon oxidative changes in frozen stored cold water shrimp (Pandalus borealis). Food Chemistry 64, 169–175.
Bedinghaus, A.J. and Ockerman, H.W. (1991). Temperature, pH and bacterial populations of meat as influ-enced by home freezer failure. Journal of Food Science 56(6), 1508–1510.
Billiard, F. (2005). Refrigerating equipment, energy efficiency and refrigerants. Bulletin International Instituteof Refrigeration 85(1), 12–25.
Brady, P.L. (1995). A quick consumer guide to safe food handing, USDA Home and Garden Bulletin, No. 248,October.
Bustabad, O.M. (1999). Weight loss during freezing and storage of frozen meat. Journal of Food Engineering41, 1–11.
Brousseau, A.D. and Volatier, J.L. (1999). Le consommateur francais en 1998- une typologie de preference.Cahier de recherche CREDOC, No. 130, June.
Cook, D.J. (1978). The effect of domestic storage on the nutritional value, palatability and acceptability offood. Journal of Consumer Studies and Home Economics 2, 287–296.
Derens, E. Guilpart, J., Proson, E. and Palagos, B. (2003). La chaine du froid, du fabricant au consommateur:les resultats de l’audit ANIA-Cemagref. Final Report.
Durosset, P. (1997). La decongelation, Journee technique du 15 October – Nantes.Flynn, O.M., Blair, I. and McDowell, D. (1992). The efficiency and consumer operation of domestic refrig-
erators. International Journal of Refrigeration 15(5), 307–312.Gac, A. (1994). Emballage des produits congeles ou surgeles. Revue Generale du Froid Juin, 20–22.
BLUK139-Evans January 23, 2008 17:47
Consumer Handling of Frozen Foods 345
Geiges, O. and Schuler, U. (1988). Behaviour of microorganisms during long-term storage of food productsat subzero temperatures. Microbiologie, Aliments, Nutrition 6, 249–257.
Gigiel, A. (1998). A practical guide to the cold chain from factory to consumer, chapter Guidance for thehome freezer. In: R.L. Fuller, ed. Concerted Action CT96. p. 1180.
Gormley, R., Walshe, T., Hussey, K. and Butler, F. (2002). The effect of fluctuating and constant frozen storagetemperature regimes on some quality parameters of selected food products. Lebensmittel Wissenschaft undTechnologie 35, 190–200.
Anonymous. (1989). The consumer and their appliances. Grand Froid 5(41), 57–59, in French.Hall, L.P. and Alcock, S.J. (1987). The effect of microbial enzymes on the quality of frozen foods. Food
Microbiology 4, 209.IIR (International Institute of Refrigeration). (2002). Report on Refrigeration Sector Achievements and
Challenges. p. 77.IIR (International Institute of Refrigeration). (2006). Markets: frozen foods. Newsletter of the IIR (Interna-
tional Institute of Refrigeration) No. 25, January, 2006.IIR, International Institute of Refrigeration. (1986). Recommendations for the Processing and Handling of
Frozen Foods, 3rd ed.JARN (Japan Air Conditioning, Heating & Refrigeration) (2005), no 157, p. 41.Jackson, V., Blair, I.S., McDowell, D.A., Kennedy, J. and Bolton, D.J. (2007). The incidence of significant
food borne pathogens in domestic refrigerators. Food Control 18(4), 346–351.James, S.J. and Evans, J. (1992). Consumer handling of chilled foods: temperature performances. International
Journal of Refrigeration 15, 299–306.Kandeepan, G. and Biswas, S. (2005). Effect of low temperature preservation on microbial and sensory quality
of buffalo meat, Livestock Research for Rural Development 17(11), 7.Laguerre, O., Derens, E. and Palagos, B. (2002). Study of domestic refrigerator temperature and analysis of
factors affecting temperature: a French survey. International Journal of Refrigeration 25, 653–659.Laguerre, O. and Flick, D. (2006). Frost formation on frozen products preserved in domestic freezers. J Food
Engineering, in press.Lezenne Coulander de, P.A. (1994). Koelkast Temperature Thuis, Report of the Regional Inspectorate for
Health Protection. Leeuwarden, The Netherlands.Liu, D.Y., Chang, W.R. and Lin, J.Y. (2004). Performance comparison with the effect of door opening on
variable and fixed frequency refrigerators/freezers. Applied Thermal Engineering 24, 2281–2292.Lucas, J. (1996). Evolution des appareils de froid menager. Revue Generale du Froid, May, 25–28.Martins, R.C., Almeida, M.G. and Silva, C.L.M. (2005). The effect of home storage conditions and packaging
materials on the quality of frozen green beans. International Journal of Refrigeration 27(8), 850–861.Meier, A. and Heinemeier, K. (1988). Energy use of residential refrigerators: a comparison of laboratory and
field use. ASHRAE Trans. 94(2). Also in LBL-25613 from the Lawrence Berkeley Laboratory.Meier, A. and Jansky, R. (1993). Field performance of residential refrigerator: a comparison with the laboratory
test. ASHRAE Trans. 99(1). Paper no. CH-93-20-1.O’Brien, G.D. (1997). Domestic refrigerator air temperatures and the public’s awareness of refrigerator use.
International Journal of Environmental Health Research 7, 141–148.Olsson, P. and Bengstsson, N. (1972). Time Temperature Conditions in the Freezer Chain. Report No. 309.
SIK-The Swedish Food Institute, Gothenberg.Poovarodom, N., Letang, G., Bouvier, J. and Billiard, F. (1990). Influence de l’emballage et des fluctuations
de temperature de conservation sur la qualite des denrees alimentaires surgelees, IIF, Paris, Coll. Science ettechnique du froid, In: Progres dans la science et la technique du froid en industrie alimentaire, 559–567.
Rahman, M.S. (1999). Food preservation by freezing. In: M. Shafiur Rahman, ed. Handbook of Food Preser-vation. New York: Marcel Dekker, pp. 259–284.
Redmond, E.C. and Griffith, C. (2003). Consumer food handling in the home: a review of food safety studies.Journal of Food Protection, 66(1), 130–161.
Saidur, R., Masjuki, H.H. and Choudhry, I.A. (2002). Role of ambient temperature, door opening, thermostatsetting position and their combined effect on refrigerator-freezer energy consumption. Energy Conversionand Management 43, 845–854.
Schmidt-Lorenz, W. (1963). Microbieller Verderb gefrorener Libensmittel wahrend der Gefrielagerung.Kaltetecnik 15, 39.
Schmidt-Lorenz, W. and Gutschmidt, J. (1968). Microbieller und sensorische Veranderungen gefrorenerLebensmittel bei Lagerung im Temperaturbereich von −2.5◦C bis −10◦C. Lebensmittel Wissenschaft undTechnologie 1, 26.

BLUK139-Evans January 23, 2008 17:47
346 Frozen Food Science and Technology
Schmidt-Lorenz, W. and Gutschmidt, J. (1969). Microbieller und sensorische Veranderungen gefrorenerBrathahnchen une Poularden bei Lagerung im Temperaturbereich von−2.5◦C bis−10◦C. Fleischwirtschaft49, 1033.
Sergelidis, D., Abrahim, A., Sarimvei, A., Panoulis, C., Karaioannoglou, P and Genigeorgis, C. (1997).Temperature distribution and prevalence of Listeria spp. in domestic, retail and industrial refrigerators inGreece. International Journal of Food Microbiology 34, 171–177.
Sorensen, L.B. (2002). Frozen food legislation. Review article, Bulletin IIR 4, 4–17.Verbeke, R., Van Hoop, J. and Lauwers, H. (1984). Influence of different freezing and storage conditions on
quality and characteristics of beef cuts. Thermal Process Quality Foods, Elsevier GB 522–527.Volatier, J.L. (2000). Enquete Individulle et National sur les Consommations Alimentaires. INCA
Survey, Jean-Luc Volatier, coordinateur. Lavoisier, Paris.
BLUK139-Evans March 1, 2008 12:38
Index
absorption refrigeration 84–86, 320
Acinetobacter-Moraxella 30
aerogels 298
ageing (vehicles) 279, 283–284, 286–288, 293,
297–299
air conditioning 116, 312–313, 317, 320
air curtain 304, 308–310, 313–316, 319
air cycle 115–119, 280
air entrainment 304, 307–310, 313
air temperature monitoring 99, 173, 236, 289,
316
air-blast freezing 105, 119, 127, 129, 133, 140,
154, 175, 216, 218, 255
Alcaligenes spp. 39
algal toxins 32
amylase 186, 188
amylopectin 189, 233, 235
anaesthetization (fish) 151
analytical modelling solutions 51–53
anti-freeze proteins 7, 28
antioxidants 111, 143, 161, 231
Arrhenius equation/law 9, 240–241
ascorbic acid 9, 35, 171, 186, 188, 231, 233, 239,
243, 333
atmospheric freeze drying (freeze drying)
272
ATP (agreement on international carriage of
perishable foodstuff)276, 278–279, 286,
288–289, 294, 296–297
Avrami’s model 69
Bacillus spp. 30–31, 37, 41, 173
bacon slicing 137–141
bacteria
sub-lethal damage 33
bacterial ice nucleation 179
bake off technology (bread) 184–194
bakery products 38, 41, 81, 91, 184–194
batch freeze dryer 256–262
batch freezing
fish 154, 156
ice cream 197–199
meat 128–130, 147
beef 28, 31, 44, 66, 91–92, 124–127,
129–130–132, 135, 141–145, 151, 216, 213,
217–220, 236, 238, 241, 341
biot number 53–56, 60, 75
Birdseye, Clarence 102–103, 128, 130
black body 308
blanching 27, 35–37, 43, 167–168, 171,
173–177, 219, 229–231, 233, 269, 338
blast freezer 40, 87, 92, 94, 105, 119, 126–127,
129–130, 132–134, 140, 154, 156–157, 163,
175, 208, 211, 213, 216, 218, 244, 255
blowing agents (insulation) 298–299
BOT (bake off technology) 184–194
bound water 3, 6, 186
bread
crust flaking 189–190
detachment 67, 189
fermentation prior to freezing 186, 191–194
formulation 191–192
freezing rate 186–187, 192–193
freezing temperature 186, 194
frozen part-baked 191
storage 186–189, 191–194
thawing rate 186
bread 1–2, 11, 65, 67, 184–194, 238, 245, 252
brine freezing (fish) 160
broccoli 166, 174, 217–220, 236, 238,
338–339
Brochothrix thermosphacta 30
Brucella spp. 39
bulk storage rooms 146–147
Campylobacter spp. 28, 30–31, 33, 39, 44–45,
141
capillary diffusion 67
capillary tube 329
carbon dioxide as a refrigerant 3, 83, 90, 115,
117, 125, 140, 160, 162–163, 175, 256, 310,
318
carboxymethyl cellulose 9, 196
Carnobacterium piscicola 32
Carnot efficiency 87
carotene 43–44, 217, 231
Frozen Food Science and Technology. Edited by Judith A. Evans
© 2008 Blackwell Publishing Ltd, ISBN: 978-1-4051-5478-9
BLUK139-Evans March 1, 2008 12:38
348 Index
carrageenan 196, 228
carrot 36, 166, 174, 206–208, 212–220, 238
cell contraction 170
cell membrane 3, 8, 70, 74, 103, 169, 171
CFD software 20, 66, 73–74, 319
cheese 31, 38–39, 206, 232, 238, 286, 349
chemical changes 26–28, 163, 171, 224, 228,
231, 269, 338
chlorofluorocarbons (CFCs) 105, 108, 115, 121,
318
chlorophyll 172, 230–231, 239
chopping 136–137, 168, 174
Chromobacterium spp. 39
Clapeyron’s equation 71
climate classes (retail display) 311–312
closed display cabinets 305–307, 310
Clostridium spp. 30–31, 173, 217, 220
CO2 (transcritical cycle) 116, 280, 318–319
coconut oil 195
coefficient of performance (CoP) 86–87, 110,
119, 121, 286, 288, 300–301
coefficient of system performance (CoSP) 86
cold store 1, 40, 69, 81, 93, 95, 99, 129, 147,
236, 276, 294
cold stores
jacketed 147
cold-shock proteins 32
collapse temperature 249, 256, 264, 267–268,
273
combined cabinet 304, 306
combined cooling heat and power (CCHP) 320
combined heat and power (CHP) 320
compressor
isentropic efficiency 87–88
pressure ratio 87–88
reciprocating 82, 87–88, 100, 116
screw 82, 85, 87–88, 100, 153–154
volumetric efficiency 88
compressor efficiency 87
condenser
air cooled 82, 84, 94, 99, 329
evaporative 82, 85–86, 100
condenser 82–87, 93–96, 98–100, 104, 110, 120,
248, 251, 256–259, 261, 264, 268–269, 272,
281, 292, 310, 317, 329, 343
conduction 4, 11, 20, 52, 58–59, 61, 65, 68, 70,
197, 200, 259, 262, 265, 307–308
consumer behaviour 172, 326
contact freezers 128–130
continuous freeze dryer 257, 259
continuous freezers 92, 156, 198
controlled atmosphere storage 147
corn syrup solids 195–196
corynebacteria 30
coupled heat and mass transfer 65
Coxiella burnetii 39
Crank–Nicolson 58–59, 71
crumb texture (bread) 188
crust freezing 136–141, 147
cryofixation 112
cryogenic freezing 2, 4, 72, 92–93, 104–105,
109, 119, 124, 126, 130–131, 133, 136–137,
139, 147, 153, 160, 175, 179, 186, 191, 207,
210, 255, 272
cryoprotectants 3, 7–9, 112, 232
Cryptosporidium spp. 30–31
crystallisation kinetics 254
cultivar 17, 34–35, 167, 208–211
Darcy flow 67
dark, firm and dry (DFD) meat 125, 142
defogging 310
defrosting 8, 86, 91, 100, 202, 236, 276,
308–311, 313–314–316, 319–320, 322,
337–340, 342–343
dehumidification 93, 311
dehydration 8, 11, 51, 113, 115–116, 161, 164,
170–172, 186, 192, 194, 212, 229, 232,
243–244, 269, 271, 304, 333
dehydrofreezing 119, 165, 179
Demersal fish 151
demisting (retail display) 308, 319
diacetyl tartrate ester of monoglycerides
(DATEM) 188
differential scanning calorimetry 9–10, 18–19,
189, 233, 235–236
diffusivity 16, 65–67, 74–75, 270
dipping 161, 174, 225, 307
direct expansion 83–84, 158, 281, 317–318,
320
discretisation 58–60, 62
domestic refrigerator
types 327–328
dough 2, 41, 65, 184–189, 191–194, 229, 238
drip loss 2–3, 28–29, 70, 125–126, 163, 169,
171, 210–216, 224, 231, 244, 338, 340–341
egg 9, 31, 39, 41, 143, 229, 232, 238, 272
electro-conductive blanching 177
emissivity 308, 313–314
emulsifier 188, 195–198, 201
energy consumption 87–88, 93, 95, 98, 146,
153–154, 156, 176, 282, 297–298, 303, 307,
311–313, 316–322, 337–338, 343–344

BLUK139-Evans March 1, 2008 12:38
Index 349
energy efficiency 86–89, 98–99, 101, 116–117,
120, 153–154, 318, 344
energy labelling (domestic refrigerators) 344
energy labelling (retail cabinets) 319
energy labelling (vehicles) 297
enthalpy method (modelling) 14, 61–64, 69, 71,
74
enzymatic browning 229, 231, 243
enzymatic oxidation 27, 229
enzyme denaturation 36
enzymes 26–27, 32, 35–37, 45, 68, 112, 152,
163, 168–169, 174, 177–178, 191, 195,
228–231, 269, 238–239
equalisation 139–140
Escherichia coli 30–31, 173, 217
eutectic 5, 7, 160, 254, 280–282, 290
evaporator 83–87, 93–95, 98–100, 104, 111, 120,
127, 148, 176, 200, 225, 279–280, 282, 304,
308, 310, 316, 319, 329, 337
expansion valve 83–86, 104, 110, 320, 329
fan 86, 91–92, 94, 99, 106, 110, 127–128, 131,
154, 156, 176, 279–281, 309, 317, 319,
330
fast freezing 7, 106, 117, 124, 126, 153, 156,
160, 162–163, 171, 200, 207, 220, 225, 227,
232, 249, 342
fat content 2, 42, 90, 143, 151–152, 195
fermentation 185–188, 190–194
fermented milk 40
f-gas directive 100
Fick’s law 65
finite difference method (FDM) 58, 60, 62–65,
71
finite element method (FEM) 58–60, 62–65, 74
finite volume method (FVM) 58–59, 62–65, 66,
74
first order reaction 240
fish
freezing 90, 103, 108–109, 151–164, 232
post-freezing 160–161, 229–230, 232,
236–239, 241, 244
pre-freezing 28, 30–32, 108, 151–153,
162
fish farming 151
flammable refrigerants 89, 280, 310
Flavobacterium spp. 39
flavour deterioration 228, 230, 232
fluidisation freezing 17, 91–92, 104–111, 119,
121, 157–158, 175–176, 272–273
folic acid 41
Fourier equation 52, 64, 262
freeze concentration 1, 73, 178, 194, 228, 234,
254–255, 269
freeze drying
alternative methods 271–273
quality 269–271
freeze drying 1, 8, 119, 248–274
freeze drying equipment 255–262
freeze drying modelling 262–268
freeze tolerant yeast 188
freeze-chill technology 208–217
freezer burn 146, 161, 172, 212, 225, 244, 333
freezer product stacking 154, 158, 200, 216
freezers
batch 86, 91–92, 94, 128–130, 138, 147, 154,
156, 197–199, 257–262
blast 40, 87, 91–92, 94, 104–105, 115, 119,
126–130, 132–134, 136, 140, 154, 156–157,
163, 175, 190–192, 197, 206, 208, 211, 213,
215–220, 244, 255
continuous 91–92, 94, 111, 128, 147,
156–158, 162, 197–200, 257, 259
fluidised bed 17, 91–92, 104–107, 111,
157–158, 175, 272–273
plate 17, 91–93, 103–104, 130, 123, 125, 129,
147–148, 156, 158–160, 162, 175, 197,
200
spiral 91–92, 94–95, 105, 126, 128, 156–157,
206–207
tunnel 43, 91, 94, 105, 127–129, 131, 154,
162, 192
freezing
added water 3
air cycle 115–119, 280
cross-linking of proteins 2, 112
cryogenic 2, 4, 72, 92–93, 104–105, 109, 119,
124, 126, 130–131, 133, 136–137, 139, 147,
153, 160, 175, 179, 186, 191, 207, 210, 255,
272
fruits 2, 34–39, 41–43, 45–46, 67, 73,
109–110, 112, 165–183, 194, 198, 231, 340
immersion 4, 11, 17, 65, 67–68, 105–111, 119,
128–130, 132–133, 135, 139, 143, 158, 174,
176, 220
impingement 17, 119, 126–127, 131, 179
magnetic resonance 113–115, 119, 121
mechanical damage to the food structure 2, 35,
161, 171, 174
re-absorption of water on thawing 2
temperature–time relationship 4, 169–170
vegetables 165–183
freezing front 7, 51–53, 57, 60, 68, 75–76, 187,
190

BLUK139-Evans March 1, 2008 12:38
350 Index
freezing of beef 91–92, 125–127, 129–132, 135,
213, 217–220
freezing of dense foods 65–66
freezing of fish 90, 103, 108–109, 151–164, 232
freezing of meat 2, 8, 20, 26, 28, 32–34, 65, 70,
91–92, 103, 109, 124–150, 215, 225, 326,
338–3410
freezing of multi-dimensional shapes 55–57
freezing of mutton 124, 126, 132
freezing of non-porous foods 65–66
freezing of offal 133, 135, 142, 147, 342
freezing of poultry 28–32, 34, 45, 129–130,
132–136, 141–143, 146, 148, 229–230, 232,
241, 244
freezing of slabs 52–55, 262–266, 273
freezing of small products 91, 104, 131,
135–136, 160, 163, 175–176
freezing plateau 4, 52, 69–70
freezing point depression 5, 112, 170, 195,
196–197, 252–253
freezing processes
emerging/novel 10, 101–123, 165, 179, 320
freezing rate 2, 7–8, 27, 29, 53, 68, 70, 71, 93,
103–104, 106, 108, 112–113, 124–127, 133,
135–136, 147, 153, 163, 162–164, 171,
175–176, 178, 186–187, 191–193, 199, 207,
210–212, 220, 227–229, 231, 233, 235–236,
269, 338, 341
freezing time
modelling 54–57, 61, 69, 74
freezing velocity (see also freezing rate) 186
French baguette 187–190, 192
frost formation on food (domestic refrigerators)
333–338
frozen desserts 194–204
frozen food quality assessment 2–3, 26–30, 74,
133, 135, 144, 147, 151–153, 163–164,
166–173, 188–189, 194–195, 197,
200–201, 206, 208–210, 212–213,
215–218, 220–221, 224–226, 231–233,
237–243, 251, 269–271, 326, 338–340, 342
frozen ready-meals 205–223
frozen storage
cheese 39, 232, 238
eggs 9, 39, 41, 232, 238
fish 160–161, 229–230, 232, 236–239, 241,
244
fruit 34–39, 41–43, 45–46, 166–179, 229–231,
233, 237–239, 244
ice cream 7, 33, 40, 42–46, 81, 200–202, 228,
232, 236, 238, 245, 307, 339
meat 141–146, 228–232, 237–239, 244
ready prepared meals 205–223
sous-vide 217–218
temperature 9, 27, 45, 143–146, 148, 163, 170,
172, 186–187, 194, 201, 207, 215,
231–238–242, 276, 303, 307, 311–312, 314,
333, 338–339, 342–343
temperature fluctuation 8, 28, 36, 144–147,
187, 196, 202, 225–226, 232, 234, 237, 243,
307, 311, 313–314, 316, 321, 330, 333, 335,
337, 339, 341, 343
vegetables 36–38, 171–172, 229–233,
237–239, 244–245
frozen storage (domestic refrigerators) 330–339
frozen storage 1–3, 8–9, 27–29, 32–34, 36–45,
51, 66, 125, 132, 136, 141–147, 163–164,
167, 168–169, 172, 179, 188–189, 191–194,
202, 206–208, 210, 213–216, 220–221,
224–247
fruit
pre-freezing treatment 167–169
fruits
freezing 169–171
Galerkin formulation 59–60, 62–63
gelatin 194, 196
Geotrichum spp. 30
Giardia spp. 30–31
glass door cabinets 305–308, 310, 313, 319
glassy state 7–9, 153, 179, 196, 234–235,
251–254, 262, 271
glazing 107, 161, 162, 225, 244
global heat transfer coefficient (K value) 279,
282–284, 286, 288, 293, 296–298
global warming potential (GWP) 105, 298, 318,
321
gluten 184, 188, 192
Gordon–Taylor equation 252–253, 273
grading 168, 174
Gram-negative bacteria 27, 30, 32
Gram-positive bacteria 27, 30, 32
green beans 108, 171, 174, 208, 212–215, 333
guar gum 188, 196, 204, 228
guillotining 136–137
gums 9, 188, 196, 228, 233, 235, 345
H5N1 virus 34
HACCP 44, 173, 217
heat load 53, 57, 61, 63, 69, 74, 87–88, 94,
98–99, 117, 147, 283, 297, 303, 313
high-pressure processing 45, 71, 74, 112, 119,
126, 179, 220, 318
high-quality life (HQL) 237
BLUK139-Evans March 1, 2008 12:38
Index 351
high-speed bacon slicing 137–139
high-speed ham slicing 137
home freezing 216, 326, 339–342
home thawing 341–342
horizontal cabinet 307–308
humidity 7, 95, 98, 131, 190, 192, 225, 251, 272,
293, 312–313, 343
hydrochlorofluorocarbons (HCFC) 89, 105, 108,
111, 115, 121, 318
hydrocolloids 187–188, 192, 196, 228, 233.
235
hydrofluidisation method (HFM) 17, 106–111,
119, 121
hydrolytic enzymes 229–231
IATA containers 294
ice
dendritic 7, 70, 226
extracellular 2, 5, 7–8, 27–28, 35, 51, 70,
169–170, 210, 229, 231,
intracellular 5, 7–8, 26–27, 29, 35, 70, 125,
169–171, 177
Ostwald ripening 8, 226
recrystallisation 7–8, 51, 165, 191, 194, 201,
224–229, 232–235
spherulitic 7
ice cream
aging 197–198
homogenisation 42–44, 197–198
ingredients 195–197
mixing 197–198
pasteurisation 40, 42–43, 197–198
processing 197–200
special formulations/health foods 42–44
stability of nutrients 42–44
ice cream 1–2, 7, 9, 26, 31, 33, 40, 42–45, 69, 73,
81, 101, 120, 194–202, 228, 232, 236, 238,
245, 304, 307, 326, 338–339
ice crystal size
sensory detection (ice cream) 200
ice crystal structure 7–8, 110, 133
ice fraction 5–7
ice nucleation 4–5, 18, 51, 119, 178–179
ice slurry 67–68, 106–111, 119, 130
immersion freezing 4, 11, 17, 65, 67–68,
105–109, 119, 128–130, 132–133, 135, 139,
143, 158, 174, 176, 220
impingement freezing 17, 119, 126–127, 131,
179
improvers for baking 186, 188
indirect refrigeration system 84, 310, 318
industrial-scale freeze drier 257–262
infiltration 129, 283, 307–311, 315–316, 319,
322, 329
initial freezing point 4, 11–12, 14–16, 18–19, 69,
105, 137–138, 187, 228
insulation 17, 99, 264, 278–279, 283, 286, 294,
297–300, 333–337
intermodal transport 289, 293
IQF (individual quick freezing) 104, 106, 108,
121, 136, 175–176. 206–207
ISO thermal containers 276, 286, 294
jacketed cold stores 147. 198–199
Kirchhoff transformation 64, 75
K value 279, 282–284, 286, 288, 293, 296–298
Kyoto Protocol 101, 317
laboratory-scale freeze drier 256–257
lactose 40, 195–196, 200
lamb 31, 55, 66, 124, 136, 142, 144–145,
217–220, 238
lasagne 206, 208, 212–213, 215–217
latent heat 4, 8, 11–12, 18, 52, 59–61, 63–64, 67,
69–71, 75, 90, 109, 112, 130, 169, 273
legislation
freezing of fish 162–163
fruit and vegetables 172–174
meat 147, 342
legislation (frozen storage) 246–247
life cycle assessment (LCA) (retail display) 321
lighting 146, 303, 308–310, 319–320
lipid oxidation 163, 228, 230–232,
liquid nitrogen 4, 17, 82–83, 105, 125–126,
130–132, 136, 175, 210, 220, 233, 255, 272
Listeria monocytogenes 30–31, 40, 173
loading (retail display) 314
locust bean (carob) gum 196, 228
long-distance transport 289–296
low-emissivity surfaces 313
magnetic refrigeration 119–120
magnetic resonance freezing (MRF) 113–115,
119, 121
magnetic resonance imaging (MRI) 187, 191
Maillard browning 249
maintenance (equipment) 82, 88–90, 94–95,
99–100, 117, 131, 286–287, 290, 303, 311,
316–317, 322, 326
marine containers 280, 301
mashed potato 207–211, 213–217,
mass transfer 19, 51, 65–68, 70, 74–75, 113, 115,
176, 262, 264–366, 270, 272–273
BLUK139-Evans March 1, 2008 12:38
352 Index
mass transfer model 51, 65–68, 70, 74–75
Maxwell–Eucken models 15
meat freezing 141–146, 228–232, 237–239, 244
medium-distance transport 289–293
metmyoglobin 232
microbial deterioration 26–28, 30–34, 37–38,
39–41, 234
micrococci 30
micro-organisms bakery products 41
micro-organisms dairy 39–41
micro-organisms fish 30–34
micro-organisms meat 30–34
micro-organisms poultry 30–34
micro-organisms vegetables and fruits 37–38
microwave blanching 177
microwave heating (freeze drying) 271–272
milk 19, 31, 38–41, 195–196, 198, 201, 238,
251
milk protein 195–196
milk solids-not-fat (SNF) 195
mini containers 292, 294,
modelling
air freezing of porous foods 67–68
elliptical cylinders 56
freezing of liquid foods 73–74
high-pressure freezing and thawing 71–72, 74
immersion freezing of porous foods 67–68
infinite rectangular rods, bricks, finite
cylinders 65–66
irregular shapes 56–57
three-dimensional ellipsoids 56
modelling 26–50
modelling (quality loss) 239–242
modified atmosphere packaging (MAP) 208,
213, 215–216,
modified starches 194, 212
moisture migration 51, 196, 220, 224–225
monitoring (retail display) 316–317
Montreal Protocol 279, 298–299, 317
moulds 27, 30, 32, 37–38, 41, 43, 234
multi-compartment vehicle 282
multi-deck cabinet 304–305, 307,
mutton freezing 124, 126, 132
mycobacteria 39
myofibrillar protein 239
natural refrigerants
ammonia 84, 88–90, 94, 115, 198, 301, 310,
318–319
carbon dioxide (inc. as cryogen) 3, 81, 82, 90,
115, 117, 125, 130, 160, 162–163, 175, 256,
310, 318
hydrocarbons 115, 298, 310, 317–318
nematodes 33
Neumann boundary 58, 70
Newton’s cooling law 60, 62
night covers (retail display) 308, 311, 316–317,
322
night curtains (retail display) 308
nitrates 173
nitrogen freezer 82–83, 160–161
non-condensable gases 248, 256
Norovirus 178
Nusselt (Nu) number 16
nutritional aspects of freezing
bakery products 41
dairy 38–39
fish 28–29
meat 28–29
poultry 28–29
vegetables and fruits 34–37
offal freezing 133, 135, 142, 147, 342
open display cabinets 309–310
osmosis 170
oxidation 1, 3, 27, 29, 35–36, 146, 163, 172, 177,
210, 228–233, 242–243
ozonation 173
ozone depletion potential (ODP) 318, 321
packaging 17, 27, 30, 91–93, 103, 111, 128, 135,
142–143, 146, 148, 161, 163, 166, 171–173,
185, 196–198, 200, 207–208, 215–216, 220,
225, 231, 237, 239, 243–244, 294, 313–314,
338,
palm oil 195
partial pressure 66, 75, 85, 248, 256, 259, 262,
264, 267, 268–269, 272
partially baked frozen bread (PBF) 184
particle image velocimetry (PIV) 319
pasta 8, 205–206, 215, 217–220
pasteurisation 36, 39–40, 42, 112, 197, 217,
219
pathogens 27–28, 33, 37–40, 45, 215, 217,
221
peanut oil 195
pectin methyl esterase 229
peeling 31, 35, 157, 167, 174, 189
pelagic fish 151–152, 154–156, 160
phospholipases 229
Photobacterium spp. 31–32
physical changes during frozen storage 224–228
phytonutrients 45
pigments 142, 171, 228–229, 230–231
BLUK139-Evans March 1, 2008 12:38
Index 353
Plank’s equation 160, 186–187, 262
plant design
flexibility 95, 99, 117, 141, 162
sustainability 99, 101, 161,
plate freezing 104, 129, 133, 135
polysaccharide stabilisers 194
post-harvest treatment 35–36
potato 114, 171, 206–211, 213–217, 219, 236,
333–335
poultry freezing 28–32, 34, 45, 129, 132–134,
136, 141–143, 146, 148, 229–230, 232, 241,
244, 325, 343
power failure (domestic refrigerators) 341, 343
practical storage life (PSL) 142–144, 237–239,
241–242
pre-freezing
fish 151–153
pre-freezing treatment
fruit 166–169
meat 141–143
vegetables 166–169
pre-rigor filleting 152
Pressure Equipment Regulations (PER) 96
pressure shift freezing 71–72, 112–113, 119,
126, 220
Pressure Systems Safety Regulations (PSSR) 96,
100
product throughput 92–93, 95
product–process–package (PPP) 166, 205, 207,
239
protein denaturation 163, 228–231, 269
protozoan parasites 27, 33
proving (bread) 192–193
PSE (pale soft and exudative) meat 142
pseudomonads 30, 39
PSL (practical storage life) 142–144, 237–238
pumpable ice slurries 106–111
pumped recirculation 84, 94
radiative heat transfer (retail display) 308
rail transport 290, 293
rancidity 29, 143–144, 146, 160, 229–232, 326,
333
Raoult’s equation 5
rate of freezing 2, 7–8, 27, 29, 53, 68, 70, 71, 93,
103–104, 106, 108, 112–113, 124–127, 133,
135–136, 147, 153, 163, 162–164, 171,
175–176, 178, 186–187, 191–193, 199, 207,
210–212, 220, 227–229, 231, 233, 235–236,
269, 338, 341
ready prepared meals 205–223
ready to bake bread 184–185, 191
receiver (refrigeration system) 84–86, 96,
recrystallisation 7–8, 51, 165, 191, 194, 201,
224–229, 232–235
re-freezing (freeze-chilled products) 208, 216
refrigerant choice 88
refrigerant emissions (retail) 317–319, 321
refrigerants
ammonia 84, 88–90, 94, 115, 198, 301, 310,
318–319
halocarbon 88–90
toxicity 89–90, 321
refrigerants (transport vehicles) 299–301
refrigeration cycles 82–88
refrigeration safety standards 88–90, 96,
100–101, 115, 297–298, 319
refrigeration system 81–83, 87, 89, 94, 96,
140–141, 282, 299–301, 320, 329, 331,
343
refrigeration system maintenance 82, 88–90,
94–95, 99–100, 117, 131, 286–287, 290,
303, 311, 316–317, 322, 326
rehydration ability (after freeze drying) 271
remote condensation units (retail display)
313
retail cabinet design 307–311
retail display 303–324
Reynolds (Re) number 16
rheology 185–186, 188, 212
Rhodotorula spp. 30
rice 31, 206, 217–220, 252
road transport 289–290,
roll containers 291, 294,
safety coefficient 297–298
salmon 29, 32, 151–152, 217–221, 236, 238
Salmonella 30–31, 40, 173, 207, 217, 221, 232,
salt 5, 30, 41, 67, 84, 93, 129, 137–140,
143–144, 163, 192, 206–207, 219, 229
sauces 198, 205–208, 212, 216, 228, 232
scalding 30
scraped surface heat exchanger/swept-surface
heat exchanger (SSHE) 42–43, 198–200
secondary fluid 310, 318–319
selecting refrigeration plant 81–100
self-contained (‘stand-alone’) units (retail
display) 313, 317
self-refrigerated containers 292
semi-trailer 290
sensors (temperature) 17, 243
sensory score 214
shape factor 53–54, 57, 75
shelf-life testing 237, 246

BLUK139-Evans March 1, 2008 12:38
354 Index
shelf-life 8, 27, 33, 39–40, 45, 102, 111–112,
151–153, 156, 160, 175, 177, 196, 200–201,
205, 208, 215–216, 220, 228, 230, 232,
236–237, 239–242,
Shewanella putrefaciens 32
Shigella 30, 173
short-distance delivery transport 289
shortening 188–189,
single-door chiller with ice box freezer 327
single-door freezer 327
single-stage tempering 136, 139
slicing 1, 137–139, 147, 168, 174
slicing temperature 137–139
slow freezing 7, 27, 33, 92, 103, 124–125, 127,
163, 175, 185, 187, 225, 228, 231, 233, 235,
340–341
small product freezing 91, 104, 131, 135–136,
160, 163, 175–176
sodium alginate 296
solar radiation (vehicles) 278, 283, 298
Soret effect 65
sous vide-freezing 205–207, 217–221
specifying refrigeration plant 81–100
spoilage organisms 27
spray-freeze-drying (freeze drying) 272–273
spraying 105, 131, 161, 25
stabilisers 194–198, 202, 233
Staphylococcus aureus 30–31, 207
Star marking (domestic refrigerators) 331
state diagram 5, 7, 252–254
static freezing
ice cream 200
steam ejector 262
storage 1–3, 8–9, 27–29, 32–34, 36–45, 51, 66,
125, 132, 136, 141–147, 163–164, 167,
168–169, 172, 179, 188–189, 191–194, 202,
206–208, 210, 213–216, 220–221, 224–247
stress cracking 51, 72, 74, 135, 153, 160,
163
sub-atmospheric fluidised bed freeze drying
272–273
sublimation 8, 66, 160, 225–226, 248–249, 254,
254, 259, 262–263, 265, 267–268, 270–273,
333–334
sucrose 36, 109, 188, 195–196, 231–232, 235,
252–253–254
sunflower oil 195
supercooling 4–5, 19, 51, 68–70, 115,
254–255
surface free energy 225
surface heat transfer coefficient 16–17, 19–20,
109, 283
surfactants (emulsifiers) 188, 195–198, 201
sweeteners
ice cream 196
temperature abuse 32, 208, 215–216, 217, 339,
temperature during frozen storage 9, 27, 45,
143–146, 148, 163, 170, 172, 186–187, 194,
201, 207, 215, 231–238–242, 276, 303, 307,
311–312, 314, 333, 338–339, 342–343
temperature fluctuation 8, 28, 36, 144–147, 187,
196, 202, 225–226, 232, 234, 237, 243, 307,
311, 313–314, 316, 321, 330, 333, 335, 337,
339, 341, 343
temperature in domestic freezers 330–332
tempering 1, 136–140, 147, 208, 216–217
tendering 82, 95–98
test standards (retail display) 311–312
test standards (vehicles) 286–289
texture 1–3, 29, 37, 42, 68, 74, 103, 110, 112,
126, 133, 136, 143, 164–169, 188–189, 191,
197, 199–201, 208, 210, 213, 215, 217–220,
222–225, 228–229, 231–232, 235, 248, 252,
338,
thawing
microwaves 11
pressure shift thawing 10
ultrasound 11
thawing 2–3, 8, 10–12, 16–17, 19–20, 26–29,
32–33, 37–39, 45, 68, 71, 74, 109, 112–113,
125, 132, 160–163, 165, 169, 171–173, 179,
184–186, 191–194, 206, 208–209,
212–213, 215–217, 224, 228–229,
231–233, 236, 244, 248, 326, 338, 340–342
thermal load (vehicles) 283, 298
thermal stress 51, 72, 74, 135, 153, 160, 163
thermo physical properties
density 16
enthalpy 14
predictive software 17–19
specific heat capacity 11–14
thermal conductivity 14–15
thermal diffusivity 16
thermoacoustic Stirling heat engine 119-120
time–temperature integrator (TTI) 243
time–temperature–tolerance (TTT) 205,
207–208, 239
total viable count (TVC) 212, 214
Toxoplasma gondii 30–31
transport vehicles
air circulation 279–280
refrigeration system 279–280
transport vehicles 276–302
BLUK139-Evans March 1, 2008 12:38
Index 355
Trichinella spp. 30–31, 33
trimming 168, 174, 244
tunnel freezers 43, 91, 94, 105, 127–129, 131,
154, 162, 192
two-stage refrigeration plant 87–88, 105
ultra-high-temperature (UHT) treatment 39
ultra-rapid freezing 175
ultrasonication 173, 178
ultrasound 11, 178
unfermented frozen dough (UFD) 184–185
UV-C radiation 173, 177–178
vacuum insulation 298
vegetable fats 195
vegetables
freezing 165–183
pre-freezing treatment 166–169
vertical cabinets (retail) 307–308, 310
Vibrio spp. 30–32
virus 27, 34, 39
viscosity 9, 73–74, 106, 110, 176, 195–196, 198,
212, 229, 234, 318
vitamins 28–29, 34–35, 38, 165, 168, 195, 228,
233, 243
volatiles 239, 269–271
washing 30, 35, 37, 82–83, 152, 154, 168, 174,
343
water activity (aw) 1, 5, 75, 172, 197, 334
water binding capacity 3, 125–126
water content 2, 6, 12, 19–20, 90–91, 103, 138,
170–171, 179, 186, 195, 255, 270, 341
water diffusion 187
water vapour pressure 224–225, 263,
268–269
weight losses during freezing 225
weight losses during thawing 125
whey proteins 195–196
whipping
ice cream 195–201
William–Landel–Ferry (WLF) equation
9
xanthan 196, 228, 233, 235
yeast 28, 185–189, 192, 338–339
Yersinia enterocolitica 30–31, 39
yoghurt 40
zero order reaction 240, 242
α-amylase 186