blueknight investor presentation august 2020 downstream
TRANSCRIPT

Private & Confidential
Blueknight Investor Presentation August 2020
Downstream Terminalling Solutions for Tomorrow’s Infrastructure and Transportation End Markets
2Private & Confidential
Legal Disclaimer
Forward-Looking Statements
This presentation includes forward-looking statements. Statements included in this presentation that are not historical facts (including, without limitation, anystatements about future financial and operating results, guidance, projected or forecasted financial results, objectives, project timing, expectations and intentionsand other statements that are not historical facts) are forward-looking statements. Such forward-looking statements are subject to various risks and uncertainties.These risks and uncertainties include, among other things, the Partnership’s ability to pay future distributions, uncertainties relating to the Partnership’s debt levelsand restrictions in its credit facility, its exposure to the credit risk of our third-party customers, the Partnership’s future cash flows and operations, future marketconditions, current and future governmental regulation, future taxation and other factors discussed in the Partnership’s filings with the Securities and ExchangeCommission. If any of these risks or uncertainties materializes, or should underlying assumptions prove incorrect, actual results or outcomes may vary materiallyfrom those expected. The Partnership undertakes no obligation to publicly update or revise any forward-looking statement, whether as a result of new information,future events or otherwise.
This presentation contains the non-GAAP financial measures of Adjusted EBITDA and total operating margin, excluding depreciation and amortization. AdjustedEBITDA is defined as earnings before interest, income taxes, depreciation and amortization, non-cash equity-based compensation, asset impairment charges, gainsand losses on asset sales and other select items which management feels decreases the comparability of results among periods. Operating margin, excludingdepreciation and amortization is defined as revenues from related parties and external customers less operating expenses, excluding depreciation and amortization.The use of Adjusted EBITDA and operating margin, excluding depreciation and amortization should not be considered as alternatives to GAAP measures such asoperating income, net income or cash flows from operating activities. Adjusted EBITDA and operating margin, excluding depreciation and amortization arepresented because the Partnership believes they provide additional information with respect to its business activities and are used as supplemental financialmeasures by management and external users of the Partnership’s financial statements, such as investors, commercial banks and others to assess, among otherthings, the Partnership’s operating performance and return on capital as compared to those of other companies in the midstream energy sector, without regard tofinancing or capital structure.
Blueknight does not provide GAAP financial measures, including reconciliations, on a forward-looking basis because the partnership is unable to predict withreasonable certainty impairments, depreciation and amortization, non-cash equity based compensation, the ultimate outcome of legal proceedings and acquisitionrelated expenses.

3Private & Confidential
Blueknight’s Robust and Unique Platform
Asphalt Terminalling
• 8.8 million barrels of asphaltand residual fuel oil storage
• 53 terminals across 26 states• Largest independently
owned asphalt network
Pipeline and Trucking
• OK pipeline system withcombined capacity of50,000 bpd
• 63 trucks• XTO crude oil dedication
and minimum volumecommitment
Downstream Terminalling Solutions for Tomorrow’s Infrastructure and Transportation End Markets
Asphalt TerminallingCrude Oil Terminalling
Pipeline Trucking
• Master limited partnership established in 2007 andheadquartered in Tulsa, Oklahoma
• Geographically-diversified, high-quality assets in26 states
• Stable cash flows underpinned by long-term, take-or-pay contracts and over 50% of revenue frominvestment grade customers
• Common and preferred units on NASDAQ under“BKEP” and “BKEPP”, respectively
2019 Operating Margin Contribution
2019 TerminallingRevenue %
Take-Or-Pay
AsphaltTerminalling 80%
16%Crude Oil
Terminalling
93%
Crude Oil Terminalling
• 6.6 million barrels ofCushing, OK storage
• Operate additional 1.0million barrels forTransMontaigne
• Strong connectivity andblending capability
Take-Or-Pay
Source: Company reports; note operating margin excludes depreciation and amortization

4Private & Confidential
Ergon, Inc., a Leading Asphalt Marketer and Blueknight Sponsor
A Leading Energy Company With Over Six
Decades of Market Experience
Diversified Portfolio
• Private, family-owned, diversified company in petroleum, road construction materials and real estate
• Formed in 1954 and based in Jackson, Mississippi
• Largest customer of Blueknight with commercial services in 28 of the 53 asphalt facilities
• General partner of Blueknight since 2016
High Quality, Supportive Sponsor
Midstream and Logistics Oil and GasAsphalt and EmulsionsRefining and Marketing
• Presence in over 12 countries worldwide; over 2,500 employees globally
• One of the largest asphalt emulsion marketers in the U.S.
• Refining & Marketing: refinery operations and marketing of crude oil and various refined products includingspecialty naphthenic and paraffinic products
• Asphalt & Emulsions: production, marketing and distribution of paving and specialty asphalt products
• Midstream & Logistics: logistics support including a fleet of river, road and rail transportation equipment alongwith numerous terminal locations and pipelines
• Oil & Gas: retail distribution network for propane, mid-river fleeting, refueling & supply, and oil & gasexploration and development

5Private & Confidential
MLP Organizational Structure with Two Public Securities
• Blueknight General Partnerownership: Ergon, Inc.
• Two classes of publicly tradedequity (NASDAQ):
─ Series A Preferred Units: BKEPP
─ Common Units: BKEP
Blueknight Energy Partners G.P., L.L.C. (DE)
BKEP Operating Subsidiaries
Blueknight Energy Partners, L.P. (DE)
Blueknight GP Holding, LLC (DE)
1.6% General Partner Interest
100.0% Ownership Interest
100.0% Ownership Interest
71.2% Limited Partner Interest
Ergon Asphalt & Emulsions, Inc.
100.0% Ownership Interest
Ergon, Inc.
27.2% Limited Partner Interest
Ergon Asphalt Holding, LLC
Public Unitholders
$400 million Senior Secured Credit Facility
(1) Market capitalization includes BKEP and BKEPP(2) Market data as of 8/11/20(3) Unit count and balance sheet data as of Q2 2020 filings
NASDAQ Tickers BKEP & BKEPP
Market Capitalization ($ millions) (1,2,3) $270
Enterprise Value ($ millions) (2,3) $538
Annual BKEP Distribution ($/unit) $0.16
Annual BKEPP Distribution ($/unit) $0.72
Source: Company reports
Highlights and Strategy
7Private & Confidential
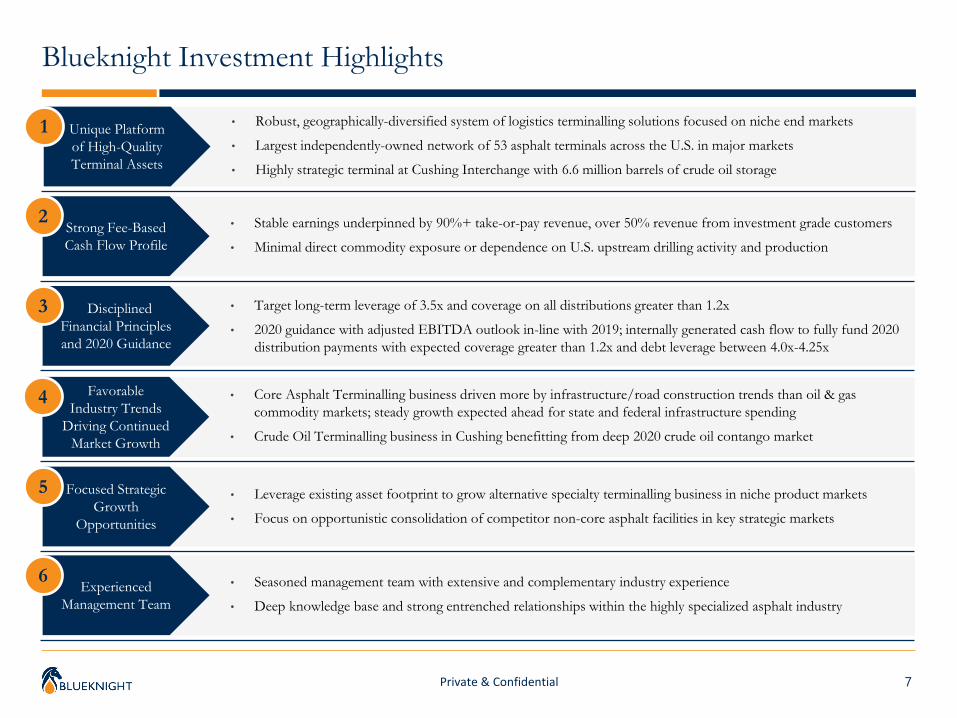
Blueknight Investment Highlights
• Robust, geographically-diversified system of logistics terminalling solutions focused on niche end markets
• Largest independently-owned network of 53 asphalt terminals across the U.S. in major markets
• Highly strategic terminal at Cushing Interchange with 6.6 million barrels of crude oil storage
Unique Platformof High-Quality Terminal Assets
1
• Target long-term leverage of 3.5x and coverage on all distributions greater than 1.2x
• 2020 guidance with adjusted EBITDA outlook in-line with 2019; internally generated cash flow to fully fund 2020distribution payments with expected coverage greater than 1.2x and debt leverage between 4.0x-4.25x
Disciplined Financial Principles and 2020 Guidance
3
• Stable earnings underpinned by 90%+ take-or-pay revenue, over 50% revenue from investment grade customers
• Minimal direct commodity exposure or dependence on U.S. upstream drilling activity and productionStrong Fee-BasedCash Flow Profile
2
• Core Asphalt Terminalling business driven more by infrastructure/road construction trends than oil & gascommodity markets; steady growth expected ahead for state and federal infrastructure spending
• Crude Oil Terminalling business in Cushing benefitting from deep 2020 crude oil contango market
FavorableIndustry Trends
Driving Continued Market Growth
4
• Leverage existing asset footprint to grow alternative specialty terminalling business in niche product markets
• Focus on opportunistic consolidation of competitor non-core asphalt facilities in key strategic markets
Focused Strategic Growth
Opportunities
5
• Seasoned management team with extensive and complementary industry experience
• Deep knowledge base and strong entrenched relationships within the highly specialized asphalt industryExperienced
Management Team
6

8Private & Confidential
($20.0)
$0.0
$20.0
$40.0
$60.0
$80.0
$100.0
2014 2015 2016 2017 2018 2019
Asphalt Terminalling Services Crude Oil Terminalling Services Crude Oil Pipeline Services Crude Oil Trucking Services
48% 63%
25%
68%
24%
5%
80%
22%
93%
12%
80%
16%
2015 Crude Oil Contango Environment
53%
24%
Unique and Stable Platform of High-Quality Terminal Assets1
• Diversified provider of downstream terminalling solutions for infrastructure and niche transportation end markets─ Robust platform of geographically diversified, high-quality terminal assets, representing 96% of total operating margin in 2019─ Over 90% of terminalling revenues supported by take-or-pay contractual agreements─ Minimal direct commodity exposure or dependence on U.S. upstream drilling activity and production─ Reviewing strategic options for crude oil pipeline and trucking businesses, including potential joint venture or sale
Blueknight Operating Margin Contribution ($ in Millions)
Source: Company reports; note operating margin excludes depreciation and amortization
9Private & Confidential
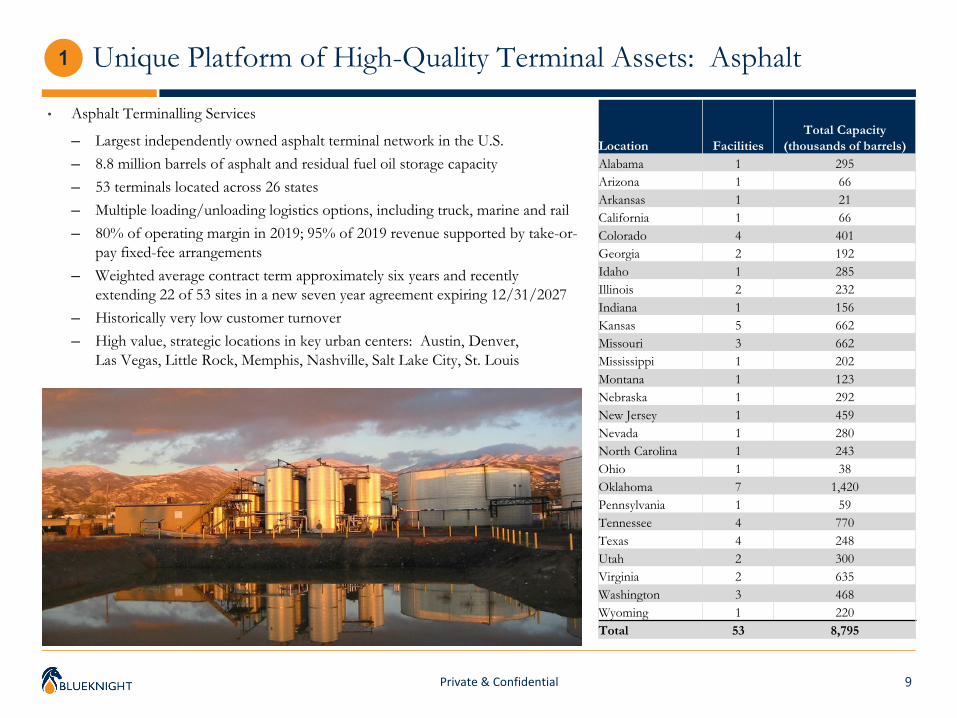
Unique Platform of High-Quality Terminal Assets: Asphalt 1
• Asphalt Terminalling Services
─ Largest independently owned asphalt terminal network in the U.S.─ 8.8 million barrels of asphalt and residual fuel oil storage capacity─ 53 terminals located across 26 states─ Multiple loading/unloading logistics options, including truck, marine and rail─ 80% of operating margin in 2019; 95% of 2019 revenue supported by take-or-
pay fixed-fee arrangements─ Weighted average contract term approximately six years and recently
extending 22 of 53 sites in a new seven year agreement expiring 12/31/2027─ Historically very low customer turnover─ High value, strategic locations in key urban centers: Austin, Denver,
Las Vegas, Little Rock, Memphis, Nashville, Salt Lake City, St. Louis
Location FacilitiesTotal Capacity
(thousands of barrels)Alabama 1 295 Arizona 1 66 Arkansas 1 21 California 1 66 Colorado 4 401 Georgia 2 192 Idaho 1 285 Illinois 2 232 Indiana 1 156 Kansas 5 662 Missouri 3 662 Mississippi 1 202 Montana 1 123 Nebraska 1 292 New Jersey 1 459 Nevada 1 280 North Carolina 1 243 Ohio 1 38 Oklahoma 7 1,420 Pennsylvania 1 59 Tennessee 4 770 Texas 4 248 Utah 2 300 Virginia 2 635 Washington 3 468 Wyoming 1 220 Total 53 8,795
10Private & Confidential
Unique Platform of High-Quality Terminal Assets: Crude Oil 1
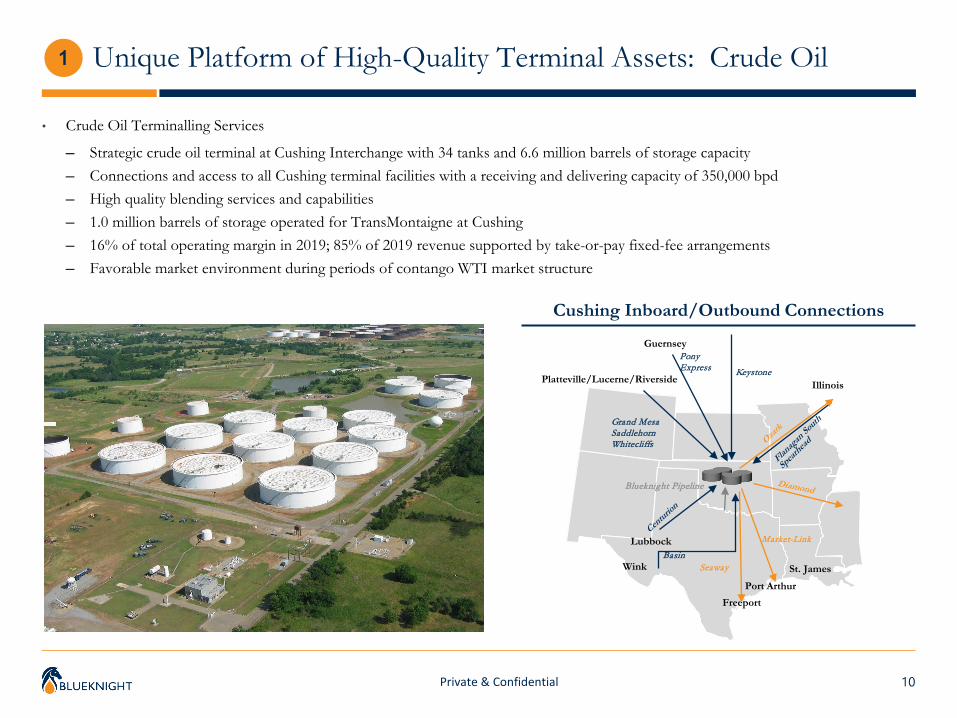
• Crude Oil Terminalling Services
─ Strategic crude oil terminal at Cushing Interchange with 34 tanks and 6.6 million barrels of storage capacity─ Connections and access to all Cushing terminal facilities with a receiving and delivering capacity of 350,000 bpd─ High quality blending services and capabilities─ 1.0 million barrels of storage operated for TransMontaigne at Cushing─ 16% of total operating margin in 2019; 85% of 2019 revenue supported by take-or-pay fixed-fee arrangements ─ Favorable market environment during periods of contango WTI market structure
Cushing Inboard/Outbound Connections
Illinois
Wink
Lubbock
Platteville/Lucerne/Riverside
Guernsey
St. James
Port ArthurFreeport
Keystone
PonyExpress
Grand MesaSaddlehornWhitecliffs
Basin
Blueknight Pipeline
Seaway
Market-Link

11Private & Confidential
$0
$20
$40
$60
$80
$100
$120
$140
$0.0
$10.0
$20.0
$30.0
$40.0
$50.0
$60.0
$70.0
$80.0
2014 2015 2016 2017 2018* 2019
WT
I ($
/bbl
)
BK
EP
Free
Cas
h Fl
ow ($
mill
ion)
Adjusted EBITDA WTI Price
Strong Fee-Based Cash Flow Profile 2
• Blueknight’s high-quality terminal assets generate stable, steady free cashflow generation despite oil price volatility
• Asset base positioned for minimal direct commodity exposure ordependence on upstream drilling activity and production
• Asphalt and Crude Oil Terminalling services underpinned by 95% and 85%contracted take-or-pay fixed-fees, respectively
Source: Company reports, FactSet
Adjusted EBITDA vs. WTI
* 2018: BKEP divested three asphalt terminals and its producer field services business
2019 Terminalling Segments Revenue Mix
Take-or-Pay 95%
Variable5%
Asphalt Terminalling
Take-or-Pay85%
Variable15%
Crude Oil Terminalling

12Private & Confidential
Strong Fee-Based Cash Flow Profile: High-Quality Customer Base 2
Select Crude Oil Terminalling CustomersSelect Asphalt Terminalling Customers Select Transportation Customers
• Strong support from high-quality, stable customer base across all businesses
• Over 50% of revenue from terminalling customers are investment grade entities
• Asphalt Terminalling customers typically significant players in the industry
─ Weighted average contract term of approximately 6 years─ Contract terms range from 5 to 10 years
• Crude Oil Terminalling customers typically trading and marketing firms and midstream entities
─ No upstream producers among customer base, minimal upstream counterparty risks
• XTO Energy primary customer of pipeline business, supported by minimum volume commitments and dedications
13Private & Confidential
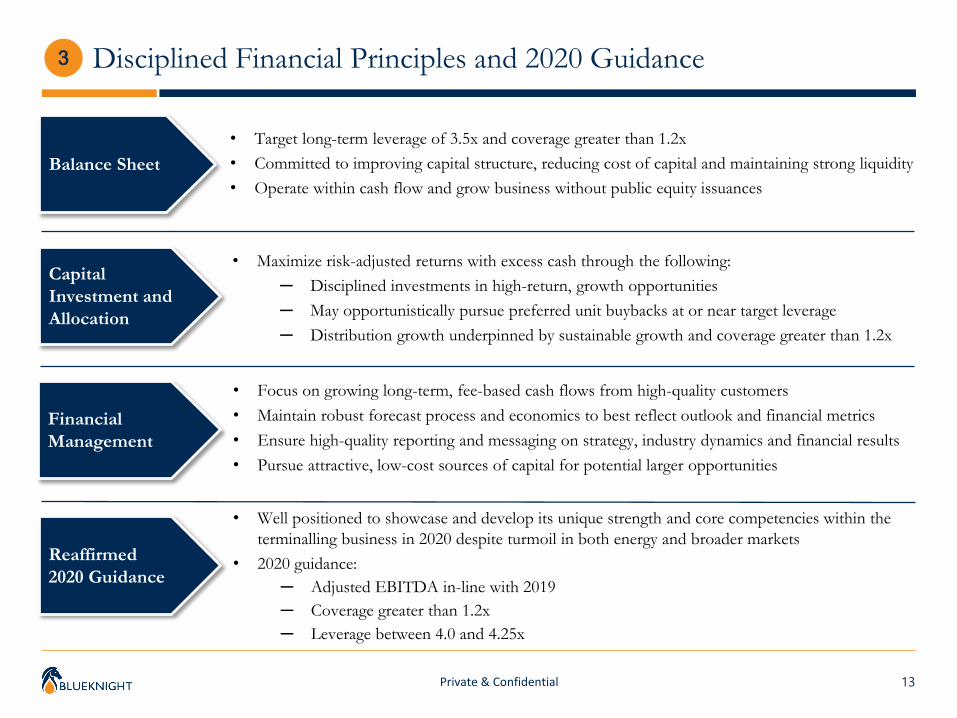
• Target long-term leverage of 3.5x and coverage greater than 1.2x• Committed to improving capital structure, reducing cost of capital and maintaining strong liquidity• Operate within cash flow and grow business without public equity issuances
• Maximize risk-adjusted returns with excess cash through the following:─ Disciplined investments in high-return, growth opportunities─ May opportunistically pursue preferred unit buybacks at or near target leverage─ Distribution growth underpinned by sustainable growth and coverage greater than 1.2x
Balance Sheet
Capital Investment and Allocation
Financial Management
• Focus on growing long-term, fee-based cash flows from high-quality customers• Maintain robust forecast process and economics to best reflect outlook and financial metrics• Ensure high-quality reporting and messaging on strategy, industry dynamics and financial results• Pursue attractive, low-cost sources of capital for potential larger opportunities
3 Disciplined Financial Principles and 2020 Guidance
Reaffirmed2020 Guidance
• Well positioned to showcase and develop its unique strength and core competencies within theterminalling business in 2020 despite turmoil in both energy and broader markets
• 2020 guidance:─ Adjusted EBITDA in-line with 2019─ Coverage greater than 1.2x─ Leverage between 4.0 and 4.25x

14Private & Confidential
Favorable Industry Trends Driving Continued Market Growth4
• Blueknight’s asphalt terminal business drivenlargely by transportation construction trends atfederal, state and local levels
• Terminal usage not dependent on E&P drillingor oil production activity
• ARTBA forecasting steady 3.9% CAGR of U.S.asphalt-related transportation construction from2018-24 to $164.6 billion for:─ Public highway and street work─ Private highway work─ Private driveway and parking lot work
• New federal infrastructure spending legislationproposed─ U.S. Senate: July 2019 vote to authorize
$287 billion for surface transportation needs─ Congressional Democrats: proposed $329
billion surface transportation spending plan─ Trump Administration: considering $2
trillion infrastructure stimulus plan in response to coronavirus pandemic market impacts
Source: American Road & Transportation Builders Association
$0
$20
$40
$60
$80
$100
$120
$140
$160
$180
2009
2010
2011
2012
2013
2014
2015
2016
2017
2018
2019
E
2020
E
2021
E
2022
E
2023
E
2024
E
Public Highway, Street & Related Work Private Driveway & Parking LotPrivate Highway & Bridge Work
2020 Asphalt Transportation Construction Activity ($ in Billions)

15Private & Confidential
Focused Strategic Growth Opportunities5
• Strategic focus to transition towards a pure-playterminalling entity─ 2019 operating margin contribution
• Asphalt Terminalling: 80%• Crude Oil Terminalling: 16%
• Asphalt Terminalling system well optimizedoperationally─ Consistent, stable annual operating margin
contribution per site─ 3Q strongest seasonal period from peak paving
demand in summer months• Future growth prospects
─ Leverage existing assets to further develop advanced, customized terminalling solutions
─ Focus on growing terminalling business in new, specialty niche product markets
─ Heated storage tank infrastructure in place to leverage into renewable diesel and heavy oil markets
─ Evaluate opportunistic terminal acquisitions
Asphalt Segment Operating Margin Per Terminal($ thousand/terminal)
$0
$200
$400
$600
$800
$1,000
$1,200
$1,400
$1,600
2016 2017 2018 2019** 2019: Asphalt Terminalling results negatively impacted by severe weather events in 2Q19
Quarterly Seasonality2016-19
(% of annual total)1Q 22%2Q 23%3Q 30%4Q 25%
Source: Company reports; note operating margin excludes depreciation and amortization
16Private & Confidential
Focused Strategic Growth Opportunities: Acquisition Targets5
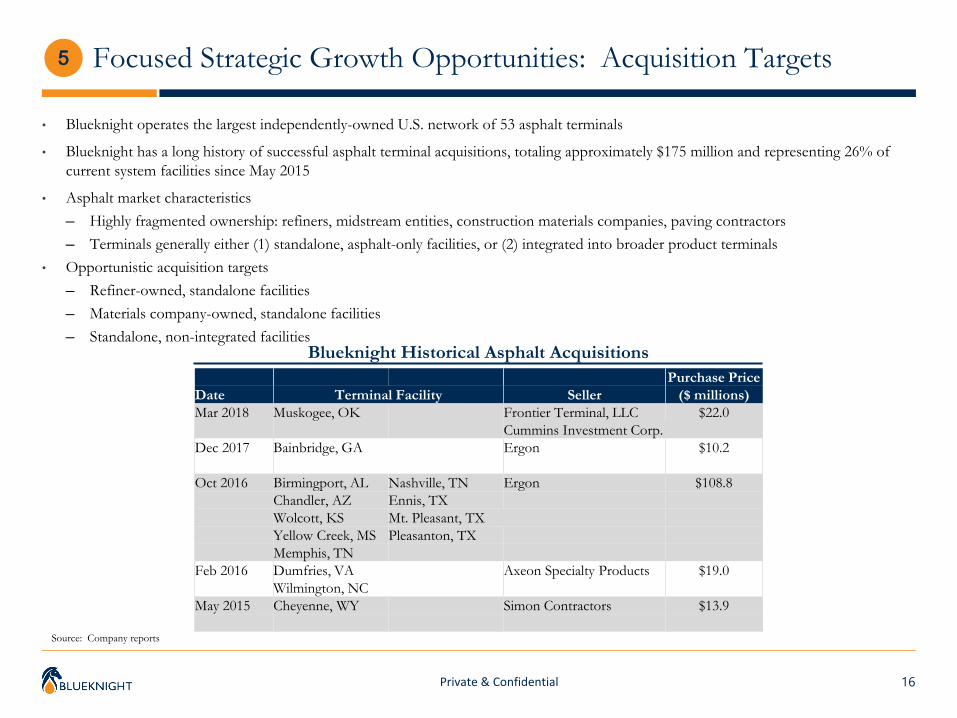
• Blueknight operates the largest independently-owned U.S. network of 53 asphalt terminals
• Blueknight has a long history of successful asphalt terminal acquisitions, totaling approximately $175 million and representing 26% ofcurrent system facilities since May 2015
• Asphalt market characteristics─ Highly fragmented ownership: refiners, midstream entities, construction materials companies, paving contractors─ Terminals generally either (1) standalone, asphalt-only facilities, or (2) integrated into broader product terminals
• Opportunistic acquisition targets─ Refiner-owned, standalone facilities─ Materials company-owned, standalone facilities─ Standalone, non-integrated facilities
Blueknight Historical Asphalt AcquisitionsPurchase Price
Date Terminal Facility Seller ($ millions)Mar 2018 Muskogee, OK Frontier Terminal, LLC $22.0
Cummins Investment Corp.Dec 2017 Bainbridge, GA Ergon $10.2
Oct 2016 Birmingport, AL Nashville, TN Ergon $108.8 Chandler, AZ Ennis, TXWolcott, KS Mt. Pleasant, TXYellow Creek, MS Pleasanton, TXMemphis, TN
Feb 2016 Dumfries, VA Axeon Specialty Products $19.0 Wilmington, NC
May 2015 Cheyenne, WY Simon Contractors $13.9
Source: Company reports
17Private & Confidential
Experienced Management Team6
• Andrew Woodward, Chief Executive Officer─ Appointed Chief Executive Officer of Blueknight in June 2020─ Joined Blueknight as Chief Financial Officer in 2019─ Previously served in multiple roles Andeavor Logistics (NYSE: ANDX) including Vice President-Finance and Treasurer, Principal Financial
Officer, and Head of Investor Relations ─ Prior to ANDX, served in corporate development at Andeavor (NYSE: ANDV), and as a Vice President at RBC Capital Markets within the
energy investment banking group─ Master of Business Administration from the University of Texas at Austin, Bachelor of Arts from Colorado College
• Jeffrey Speer, Chief Operating Officer─ Joined Blueknight as Vice President of Operations of the asphalt and emulsion subsidiary in 2009, appointed Senior Vice President-Operations in
2010, and appointed Chief Operating officer in 2013─ Vice President of Operations for Koch Industries, Inc. with operational responsibility for Koch’s crude oil, pipeline and trucking divisions in
Oklahoma, Texas and Canada and Koch’s agricultural and asphalt businesses─ Bachelor of Science in mechanical engineering from Kansas State University
• Matthew Lewis, Chief Financial Officer─ Appointed to Blueknight Chief Financial Officer effective, September 8, 2020 (announced August 10, 2020)─ Chief Financial Officer for Streamline Innovations, Inc.─ Director of Business Planning & Analytics at Andeaver Logistics (NYSE: ANDX)─ Previously served in multiple roles at Mid-Con Energy Partners, LP (NASDAQ: MCEP) and was appointed to Vice President & Chief Financial
Officer in 2016 where he was responsible for corporate finance, treasury, risk management, investor relations, and other finance related functions─ Master of Business Administration from the Cox School of Business as Southern Methodist University, Bachelor of Business Administration
from Texas Tech University
Appendix
19Private & Confidential
Financial Reconciliations to Non-GAAP Financial Measures
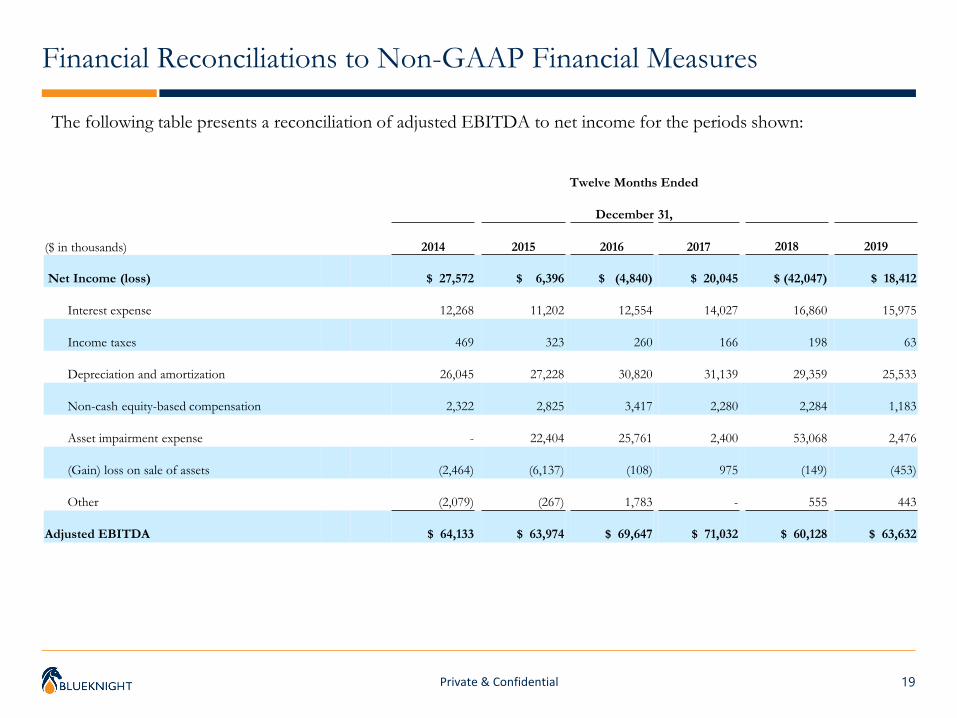
The following table presents a reconciliation of adjusted EBITDA to net income for the periods shown:
Twelve Months Ended
December 31,
($ in thousands) 2014 2015 2016 2017 2018 2019
Net Income (loss) $ 27,572 $ 6,396 $ (4,840) $ 20,045 $ (42,047) $ 18,412
Interest expense 12,268 11,202 12,554 14,027 16,860 15,975
Income taxes 469 323 260 166 198 63
Depreciation and amortization 26,045 27,228 30,820 31,139 29,359 25,533
Non-cash equity-based compensation 2,322 2,825 3,417 2,280 2,284 1,183
Asset impairment expense - 22,404 25,761 2,400 53,068 2,476
(Gain) loss on sale of assets (2,464) (6,137) (108) 975 (149) (453)
Other (2,079) (267) 1,783 - 555 443
Adjusted EBITDA $ 64,133 $ 63,974 $ 69,647 $ 71,032 $ 60,128 $ 63,632
20Private & Confidential
Financial Reconciliations to Non-GAAP Financial Measures
Twelve Months Ended
December 31,
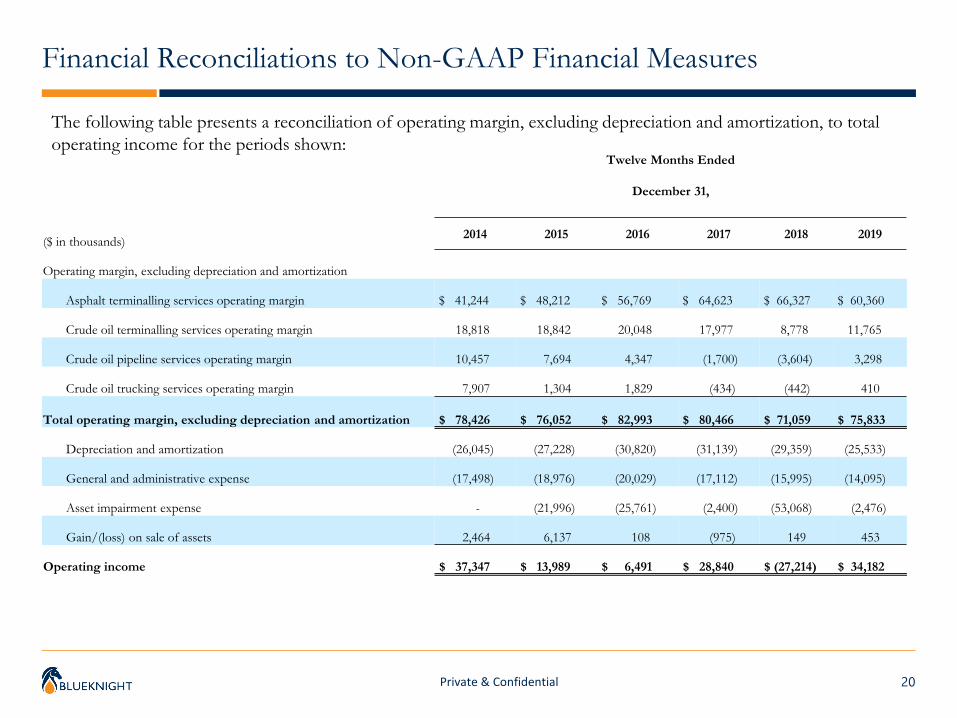
($ in thousands) 2014 2015 2016 2017 2018 2019
Operating margin, excluding depreciation and amortization
Asphalt terminalling services operating margin $ 41,244 $ 48,212 $ 56,769 $ 64,623 $ 66,327 $ 60,360
Crude oil terminalling services operating margin 18,818 18,842 20,048 17,977 8,778 11,765
Crude oil pipeline services operating margin 10,457 7,694 4,347 (1,700) (3,604) 3,298
Crude oil trucking services operating margin 7,907 1,304 1,829 (434) (442) 410
Total operating margin, excluding depreciation and amortization $ 78,426 $ 76,052 $ 82,993 $ 80,466 $ 71,059 $ 75,833
Depreciation and amortization (26,045) (27,228) (30,820) (31,139) (29,359) (25,533)
General and administrative expense (17,498) (18,976) (20,029) (17,112) (15,995) (14,095)
Asset impairment expense - (21,996) (25,761) (2,400) (53,068) (2,476)
Gain/(loss) on sale of assets 2,464 6,137 108 (975) 149 453
Operating income $ 37,347 $ 13,989 $ 6,491 $ 28,840 $ (27,214) $ 34,182
The following table presents a reconciliation of operating margin, excluding depreciation and amortization, to total operating income for the periods shown: