blood density monitoring during dialysis
TRANSCRIPT

Arrficirri Orgctns 20(9):9X1-9XS. Blackwell Science. Inc.. Boston 0 1996 International Society for Artificial Organs
Blood Density Monitoring During Dialysis
*tTatsuyuki Yamauchi, tMitsuru Yanai, t+Susumu Takahashi, and "Nguyen-Khoa Man
*INSERM U90, DepLirtment of Nephrology, Necker Hospital, Paris, France; +The Second Department o j ln te rna l Medicine, Nihon University School of' Medicine, Tokyo; and fDepurtment of'lntemal Medicine, Nishi-Kojir National
Hospital, Kofiir, Japcin
Abstract: Continuous monitoring of blood density (BD) was preformed in 4 stable dialysis patients in 20 sessions using a density meter based on a mechanical oscillator technique. Mean predialysis and postdialysis BDs were 1.0427 t 0.0031 g/cm3 and 1.0502 & 0.0055 g/cm3, respec- tively. For similar predialysis to postdialysis total body water reduction, significant difference in the mean BD increase was found between hypotensive and nonhy- potensive groups (I .29 ? 0.075%. 0.47 t 0.12%, respec- tively; p < 0.001). Eight hypotensive episodes occurred during 6 sessions. The mean value of the blood density changes slope (dBDidt) during the 5 min preceding a hy-
potensive episode increased about 2.5 times more than did the mean of the predialysis to postdialysis blood den- sity slope (27.6 ? 2.2 gicm' . min . 10.5 ? 0.4 g/cm3 * min . respectively; p < 0.001) under the condition of a constant ultrafiltration rate of 18.9 t 0.6 ml/min. Continuous monitoring of blood density allows abrupt change in plasma volume to be identified and seems to have a potential utility to the prevention of symptomatic hypotension episodes in patients receiving hernodialysis. Key Words: Blood density monitoring- Hemodialysis-Symptomatic hypotension-Blood vol- ume.
Symptomatic hypotension episodes represent one of the most serious problems observed fre- quently in hernodialysis therapy. An imbalance be- tween ultrafiltration and the refilling rate, which re- sults in an excessive decrease in the blood volume, can induce hypotension ( I ) . Only continuous intra- dialytic monitoring can depict the actual blood vol- ume trends and prevent severe hypotensive epi- sodes.
Various techniques for measuring blood volume indirectly, such as the measurement of blood pro- tein concentration, hematocrit, and optical density, are noteworthy ( 2 4 ) .
The aim of our study was to monitor the actual blood volume changes in hemodialysis patients con- tinuously and noninvasively by measurement of their blood density (BD).
BD depends on the total mass of dissolved and
Received August 1995; revised December 199s. Presented in part at the Joint Meeting of the 9th World Con-
gress o f the lnternational Society for Artificial Organs and the 20th Congress of European Societies for Artificial Organs, held July 4-4, 1993, Amsterdam. The Netherlands.
Address correspondence and reprint requests to Dr. T. Yamauchi, The Second Department of Internal Medicine, Nihon University School of Medicine, 30-1, Oyaguchi, Itabashi-ku. To- kyo, Japan.
suspended material per unit volume. Although there are several factors involved, including hematocrit, crystalloid solute concentration, and gas content, blood density has a positive correlation with the total protein concentration of blood (or hematocrit) and has a negative correlation with blood volume ( 5 ) .
Continuous monitoring of BD allows excessive plasma volume reduction to be identified and could lead to the prevention of symptomatic hypotension episodes in patients receiving dialysis.
PATIENTS AND METHODS
Patients Continuous monitoring of BD was performed in
20 dialysis sessions in 4 patients (3 males and 1 female). Bicarbonate dialysis was used with dialy- sate sodium and bicarbonate concentrations of 140 and 35 mmol/L, respectively; except in Patient 3, who was dialyzed with acetate-free biofiltration (6). Clinical characteristics of the patients are shown in Table 1. None of these patients received cardiovas- cular medication. The ultrafiltration rate was kept constant, and hypotensive episodes, if any, were treated with intravenous administration of isotonic
981

982 T . YAMAVCHI ET A L .
Patient
L
TABLE 1. Charticteristics of the pct t imts -
I
Body weight (Kg) Blood pressure (mm Hg) Patient no. Age HD duration tl) UFV -
(hex) (years) Diagnosis (years) (min) Initial Final (L) lntial Final
I (Female) 19 Glomerulonephritis 5 136 i I 34.5 2 0.3 31.8 2 0.2 2.71 t 0.10 126 f 6 101 s 4
4 (Male) 67 Unknown 2 180 2 I 57.1 ? 0.1 57.0 t 0.2 0.34 t- 0.10 157 5 9 153 i 7
2 (Male) 80 Interstitial nephritis 6 1x0 t I 69.9 -t 0.2 67.0 L 0.1 2.86 ? 0.12 117 ? 7 127 2 7 3 (Male) 20 Clomerulosclerosis 6 280 i 6 51.3 ? 0.3 47.7 5 0.1 3.58 L 0.24 132 t 5 112 t 5
tD, dialysis time: UFV, ultrafiltration volume
(0.9%) or hypertonic (20%) sodium chloride solu- tion. Results are presented in 2 groups according to the presence or the absence of symptomatic hy- potension episodes during the dialysis session.
BD measurement BD measurement was performed using a density
meter (DMA 45; A. Parr KC, Graz, Austria). The technique is based on the mass-spring principle. The oscillator is made of a U-shape glass tube fixed at its turning fork and oscillated by an electromag- netic system with optoelectronic feedback and fre- quency recording. The actual resonant frequency (f) is determined according to the following equation:
,f = I/2&/(M(, + D . V ) ( 1 )
where c is the constant of elasticity for the glass tube, M, is the internal ma5s of the empty tube, D is the density, and V is the volume of the sample con- tained in the tube.
system was kept at 37.0"C. Blood is drawn from the arterial line and flows through the density meter and back to the blood line at a rate of 8 ml/min (Fig. I ) . The apparatus has an accuracy of 2 1 x g/cm3 within the range from 0 to 3 g/cm3.
Calculation Predialysis total body water (TBWi) was calcu-
lated according to TBWi equals (0.6 X BWt) + ABW, where ABW is the intradialytic body weight loss and BWf is the postdialysis body weight, as- suming that total body water is 60% of body weight without tissue overhydration.
The blood density change slope (dBD/dt) during hemodialysis was expressed as blood density differ- ence over time (g/cm3 . min . 10 ').
Mean and standard error of the mean was re- ported for each set of measurements. Differences between groups were investigated by means of Stu- dent's 2-test, and p values < 0.05 were considered
The total volume of the circuit was 12.5 ml. The to be significant
QB : 8 mllmin Density
DIALYSIS: BLOOD DENSITY MONITORING 983
RESULTS
Changes of BD during dialysis sessions Mean predialysis and postdialysis BDs were
1.0427 -I 0.0031 g/cm3 and 1.0502 ? 0.0055 g/cm3, respectively. Compared with the reference value of healthy subjects, which ranges from 1.0428 to 1 .OW2 g/cm3 (7), the predialysis BD was below the lower range of healthy subjects, indicating a fluid overload; and postdialysis BD returned to the nor- mal range for a mean ultrafiltrate volume of 2.6 L.
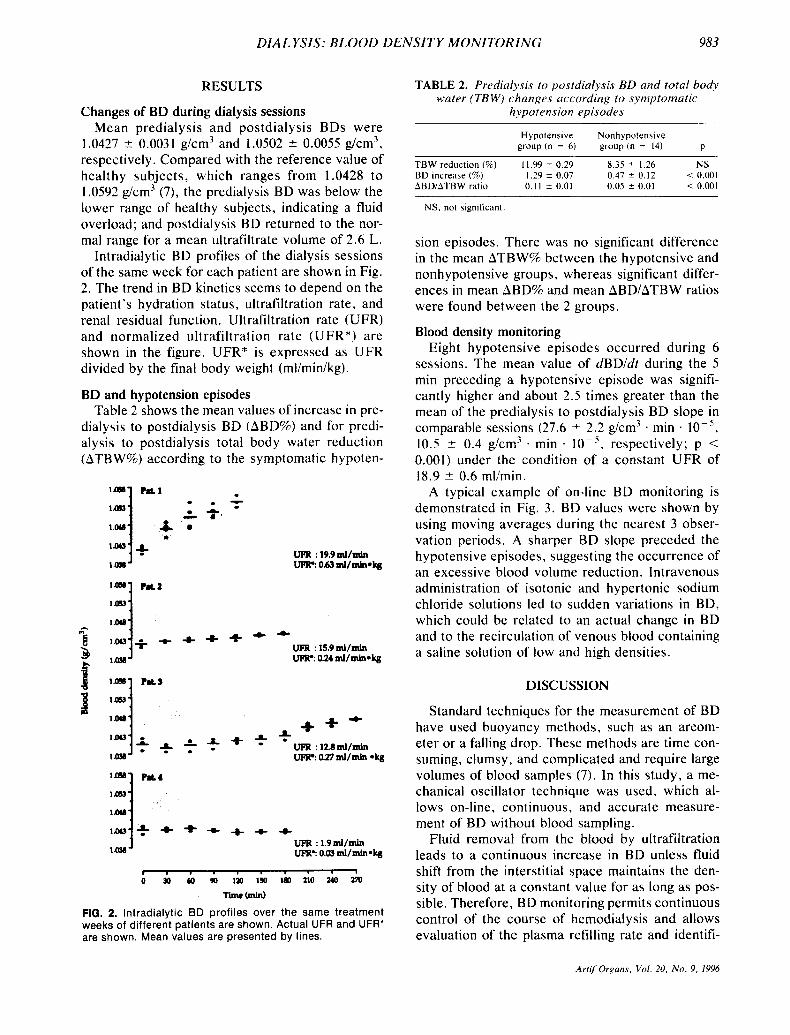
Intradialytic BD profiles of the dialysis sessions of the same week for each patient are shown in Fig. 2. The trend in BD kinetics seems to depend on the patient's hydration status, ultrafiltration rate, and renal residual function. Ultrafiltration rate (UFR) and normalized ultrafiltration rate (UFR*) are shown in the figure. UFR* is expressed as UFR divided by the final body weight (ml/min/kg).
BD and hypotension episodes Table 2 shows the mean values of increase in pre-
dialysis to postdialysis BD (ABD%) and for predi- alysis to postdialysis total body water reduction (ATBW%) according to the symptomatic hypoten-
UPR : 19.9 ml/mln UPR? 0.63 ml/mln*k#
r . . . , . . . . .
0 30 60 90 la, 130 la, 210 uo 170
Timc (min)
FIG. 2. lntradialytic BD profiles over the same treatment weeks of different patients are shown. Actual UFR and UFR' are shown. Mean values are presented by lines.
TABLE 2. Predialysis to postdialysis BD and total body water (TB W ) changes Lrccording t o symptornutic
hypotension episodes
Hypotensive Nonhypotensive group ( n = 6) group (n = 14) P
TBW reduction (96) 11.99 ? 0.29 8.35 ? 1.26 NS 0.47 ? 0.12 < 0.001 BD increase (96)
ABDlATBW ratio 0.11 2 0.01 0.05 f 0.01 < 0.001 1.29 2 0.07
NS. not significant
sion episodes. There was no significant difference in the mean ATBW% between the hypotensive and nonhypotensive groups, whereas significant differ- ences in mean ABD% and mean ABD/ATBW ratios were found between the 2 groups.
Blood density monitoring Eight hypotensive episodes occurred during 6
sessions. The mean value of dBD/dt during the 5 min preceding a hypotensive episode was signifi- cantly higher and about 2.5 times greater than the mean of the predialysis to postdialysis BD slope in comparable sessions (27.6 -t 2.2 glcm3 . min . 10.5 ? 0.4 g/cm' . min . lop5 , respectively; p < 0.001) under the condition of a constant UFR of 18.9 2 0.6 mllmin.
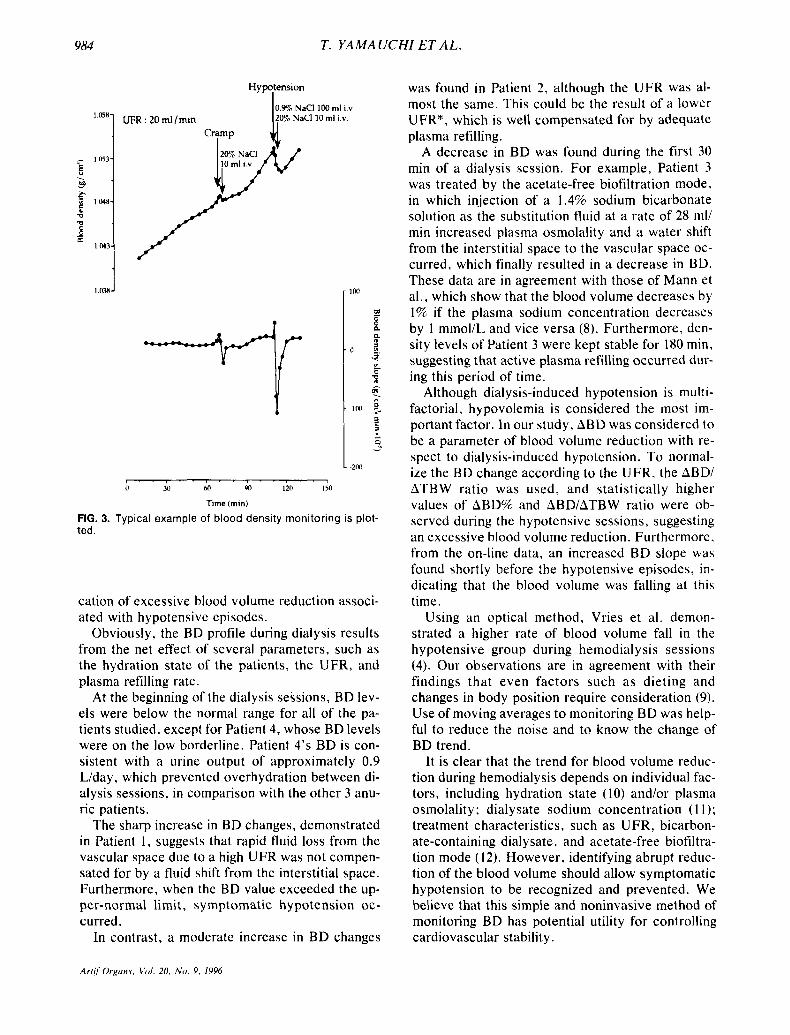
A typical example of on-line BD monitoring is demonstrated in Fig. 3 . BD values were shown by using moving averages during the nearest 3 obser- vation periods. A sharper BD slope preceded the hypotensive episodes, suggesting the occurrence of an excessive blood volume reduction. Intravenous administration of isotonic and hypertonic sodium chloride solutions led to sudden variations in BD, which could be related to an actual change in BD and to the recirculation of venous blood containing a saline solution of low and high densities.
DISCUSSION
Standard techniques for the measurement of BD have used buoyancy methods, such as an areom- eter or a falling drop. These methods are time con- suming, clumsy, and complicated and require large volumes of blood samples (7). In this study, a me- chanical oscillator technique was used, which al- lows on-line, continuous, and accurate measure- ment of BD without blood sampling.
Fluid removal from the blood by ultrafiltration leads to a continuous increase in BD unless fluid shift from the interstitial space maintains the den- sity of blood at a constant value for as long as pos- sible. Therefore, BD monitoring permits continuous control of the course of hemodialysis and allows evaluation of the plasma refilling rate and identifi-
Art i fOrgam. Val. 20, N o . 9 , 1996
984 T. YAMAUCHI ET A L .
. b
6
- 8 m
P 1w-
Q rn
1 MJ-
1 n3n-
Hypotension I 0.9S NaCl 100 ml i.v TO% NaCl10 ml i.v. 1,05”1 UFR : 20 ml/min I
b Y) MI 90 iio I;O
Time (min)
FIG. 3. Typical example of blood density monitoring is plot- ted.
cation of excessive blood volume reduction associ- ated with hypotensive episodes.
Obviously, the BD profile during dialysis results from the net effect of several parameters, such as the hydration state of the patients, the UFR, and plasma refilling rate.
At the beginning of the dialysis sessions, BD lev- els were below the normal range for all of the pa- tients studied, except for Patient 4, whose BD levels were on the low borderline. Patient 4’s BD is con- sistent with a urine output of approximately 0.9 L/day, which prevented overhydration between di- alysis sessions, in comparison with the other 3 anu- ric patients.
The sharp increase in BD changes, demonstrated in Patient 1, suggests that rapid fluid loss from the vascular space due to a high UFR was not compen- sated for by a fluid shift from the interstitial space. Furthermore, when the BD value exceeded the up- per-normal limit, symptomatic hypotension oc- curred.
In contrast, a moderate increase in BD changes
was found in Patient 2 , although the UFR was al- most the same. This could be the result of a lower UFR*, which is well compensated for by adequate plasma refilling.
A decrease in BD was found during the first 30 min of a dialysis session. For example, Patient 3 was treated by the acetate-free biofiltration mode, in which injection of a 1.4% sodium bicarbonate solution as the substitution fluid at a rate of 28 ml/ min increased plasma osmolality and a water shift from the interstitial space to the vascular space oc- curred, which finally resulted in a decrease in BD. These data are in agreement with those of Mann et al.. which show that the blood volume decreases by 1% if the plasma sodium concentration decreases by 1 mmol/L and vice versa (8). Furthermore, den- sity levels of Patient 3 were kept stable for 180 min, suggesting that active plasma refilling occurred dur- ing this period of time.
Although dialysis-induced hypotension is multi- factorial, hypovolemia is considered the most im- portant factor. In our study, ABD was considered to be a parameter of blood volume reduction with re- spect to dialysis-induced hypotension. To normal- ize the BD change according to the UFR, the ABDI ATBW ratio was used, and statistically higher values of ABD% and ABDIATBW ratio were ob- served during the hypotensive sessions, suggesting an excessive blood volume reduction. Furthermore, from the on-line data, an increased BD slope was found shortly before the hypotensive episodes, in- dicating that the blood volume was falling at this time.
Using an optical method, Vries et a!. demon- strated a higher rate of blood volume fall in the hypotensive group during hemodialysis sessions (4). Our observations are in agreement with their findings that even factors such as dieting and changes in body position require consideration (9). Use of moving averages to monitoring BD was help- ful to reduce the noise and to know the change of BD trend.
It is clear that the trend for blood volume reduc- tion during hemodialysis depends on individual fac- tors, including hydration state (10) and/or plasma osmolality; dialysate sodium concentration ( 1 1); treatment characteristics, such as UFR, bicarbon- ate-containing dialysate, and acetate-free biofiltra- tion mode (12). However, identifying abrupt reduc- tion of the blood volume should allow symptomatic hypotension to be recognized and prevented. We believe that this simple and noninvasive method of monitoring BD has potential utility for controlling cardiovascular stability.
Artif Orguns. V d . 20. N o . 9, IY96

DIAL YSIS: BLOOD DENSITY MONITORING 985
CONCLUSION
Continuous monitoring of BD allows abrupt change in plasma volume to be identified and seems to have a potential utility to the prevention of symp- tomatic hypotension episodes in patients receiving hemodialysis.
Acknowledgments: The authors express their deepest thanks to Drs. Catherine Naret and Yukihiro Itakura for their continuous support of this study.
REFERENCES 1. Daugirdas JT. Dialysis hypotension: A hemodynamic anal-
ysis. Kidney Int 1991;39:233-46. 2. Schneditz D, Pogglitsch H, Horina J , Binswanger U . A
blood protein monitor for the continuous measurement of blood volume changes during hemodialysis. Kidney Int 1990; 38: 342-6.
3. Ishihara T, Igarashi I, Kitano T, Shinzato T, Maeda K. Con- tinuous hematocrit monitoring method in an extracorporeal circulation system and its application for automatic control of blood volume during artificial kidney treatment. Artif Or- gans 1993 ; 17:708-16.
4. Vries JPPM, Olthof CG, Visser V, Kouw PM, Es A, Donker AJM, Vries PMJM. Continuous measurements of blood vol-
ume during hemodialysis by an optical method. ASAIO J
5 . Hinghofer-Szalkay H. Continuous blood densitometry: Fluid shifts after graded hemorrhage in animals. J Appl Physiol 1986;59:H342-.50.
6. Man NK, Ciancioni C, Perrone B, Chauveau P, Jehenne G. Renal biofiltration. Trans Am Soc Artiflntern Organs 1989;
7. Kenner T. Review: The measurement of blood density and its meaning. Basic Res Cardiol 1989;84: 11 1-24.
8. Mann H, Stiller S, Gladziwa U , Konigs F. Kinetic modelling and continuous on-line blood volume measurement during dialysis therapy. Nephrol Dial Transplant 199O;(Suppl I) : 144-6.
9. Schneditz D, Moser M, Smolle-Jiittner FM, Dorp E, Pog- glitsch H , Kenner T. Methods in clinical hemorheology: The continuous measurement of arterial blood density and blood sound speed in man. Biorhedogy 1990;27:895-902.
10. Koomans HA, Geers AB, Mees EJD. Plasma volume recov- ery after ultrafiltration in patients with chronic renal failure. Kidney Ini 1984;26:848-54.
11. Man NK, Digiulio S, Zingraff J , Sausse A, Funck-Brentano JL. The role of sodium in the prevention of vascular insta- bility during hemodialysis. Proc Eur Dial Transplant Assoc 1981 ;18:25.5-61.
12. Perrone B. Evidence of fluid shifts during dialysis sessions with sodium and ultrafiltration profiles: A blood density study. Conirib Nephrol 1989;74: 191-9.
1992 ;38: M 18 1-5.
3.5 18-1 3.
Artif Organs, Vol. 20, No . 9, 1996