blood conservation at the point -of-care: … · patient flow improvement uc davis medical center...
TRANSCRIPT

Radiometer WebinarDisclosures: Honoraria Provided for this Presentation
Nam K. Tran, PhD, MS, FACBAssistant Professor
NIH/NHLBI Award#5K12HL108964
BLOOD CONSERVATION AT THE POINT-OF-CARE: USING THE RIGHT TOOLS CAN MAKE A DIFFERENCE

UC Davis Medical CenterPatient Flow Improvement
Disclosures• Speaker honoraria provided for this presentation.• Studies presented here were supported in part by the National Heart Lung and
Blood Institute (Emergency Medicine K12 Career Award).

UC Davis Medical CenterPatient Flow Improvement
Learning Objectives

UC Davis Medical CenterPatient Flow Improvement
• Review the importance of blood conservation and transfusion management with respect to patient care and financial impact.
Learning Objectives

UC Davis Medical CenterPatient Flow Improvement
• Review the importance of blood conservation and transfusion management with respect to patient care and financial impact.
• Understand the analytical performance advantages and disadvantages of cyano-hemoglobin-, conductance-, and optical-based methods for the measurement of total hemoglobin.
• Understand the clinical application of oximetry and how calculated results like oxygen saturation compare.
• Learn to apply strategies at the point of care to control the pre-analytical phase and improve the quality of total hemoglobin results.
Learning Objectives

UC Davis Medical CenterPatient Flow Improvement
Clinical Importance and Indications for Transfusions
1Sharma S. et al. Am Fam Physician 2011;15:719-724. 2Herbert PC, et al. N Engl J Med1999;340:409-417. 3Lacroix J, et al. N Engl Med 2007;356;1609-1619. 4King KE, et al. AABB 2008:236. 5Murphy GJ, et al. N Engl J Med 2015;372:997-1008. 6Palmieri TL, et al. Crit Care Med 2006;34:1602-1607.

UC Davis Medical CenterPatient Flow Improvement
• Goal of blood transfusion is to improve tissueoxygen delivery.1
• Blood transfusions are clinically indicated whentotal hemoglobin (tHb) levels fall below aspecified threshold.
• Several acute care studies suggest a tHb cutoffof <7 g/dL is safe for transfusion in mostpopulations.2,3,4
• Special surgical populations may or may notbenefit from higher cutoffs (e.g., cardiovascularand burn patients).5,6
Clinical Importance and Indications for Transfusions
1Sharma S. et al. Am Fam Physician 2011;15:719-724. 2Herbert PC, et al. N Engl J Med1999;340:409-417. 3Lacroix J, et al. N Engl Med 2007;356;1609-1619. 4King KE, et al. AABB 2008:236. 5Murphy GJ, et al. N Engl J Med 2015;372:997-1008. 6Palmieri TL, et al. Crit Care Med 2006;34:1602-1607.

UC Davis Medical CenterPatient Flow Improvement
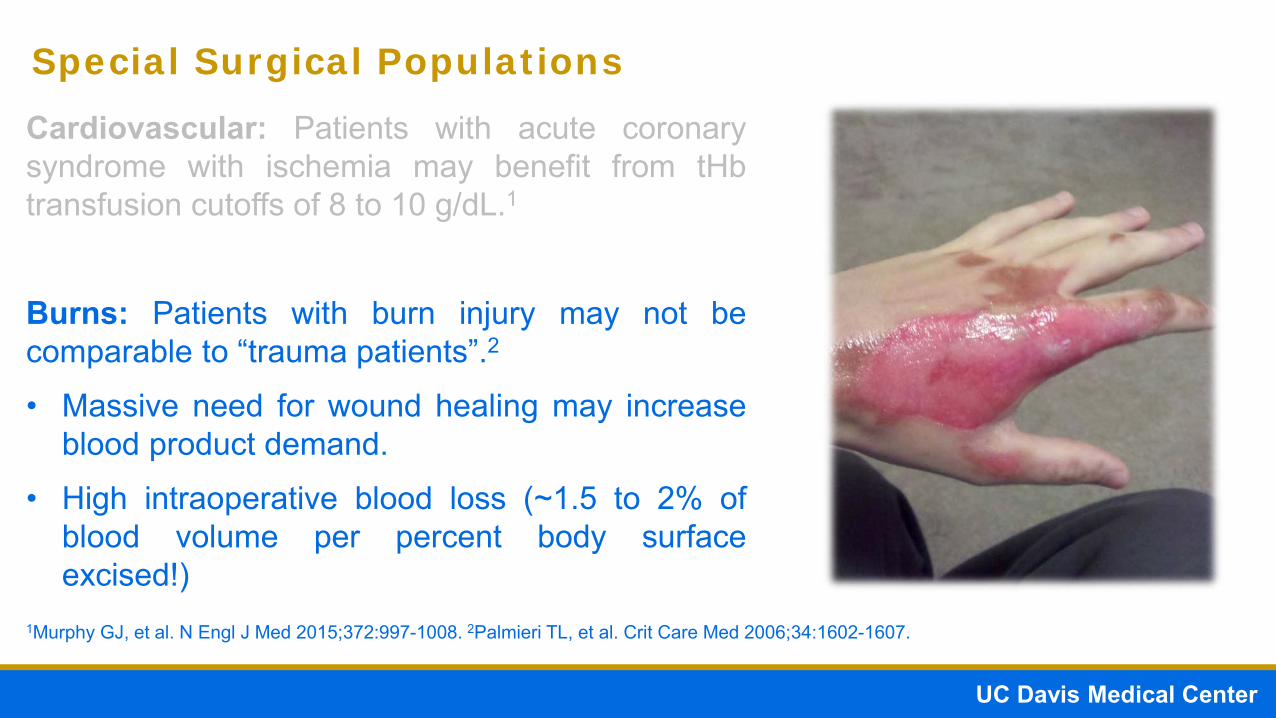
Cardiovascular: Patients with acute coronarysyndrome with ischemia may benefit from tHbtransfusion cutoffs of 8 to 10 g/dL.1
.
Special Surgical Populations
1Murphy GJ, et al. N Engl J Med 2015;372:997-1008. 2Palmieri TL, et al. Crit Care Med 2006;34:1602-1607.

UC Davis Medical CenterPatient Flow Improvement
Cardiovascular: Patients with acute coronarysyndrome with ischemia may benefit from tHbtransfusion cutoffs of 8 to 10 g/dL.1
Burns: Patients with burn injury may not becomparable to “trauma patients”.2
• Massive need for wound healing may increaseblood product demand.
Special Surgical Populations
1Murphy GJ, et al. N Engl J Med 2015;372:997-1008. 2Palmieri TL, et al. Crit Care Med 2006;34:1602-1607.
UC Davis Medical CenterPatient Flow Improvement
Cardiovascular: Patients with acute coronarysyndrome with ischemia may benefit from tHbtransfusion cutoffs of 8 to 10 g/dL.1
Burns: Patients with burn injury may not becomparable to “trauma patients”.2
• Massive need for wound healing may increaseblood product demand.
• High intraoperative blood loss (~1.5 to 2% ofblood volume per percent body surfaceexcised!)
Special Surgical Populations
1Murphy GJ, et al. N Engl J Med 2015;372:997-1008. 2Palmieri TL, et al. Crit Care Med 2006;34:1602-1607.

UC Davis Medical CenterPatient Flow Improvement
OVERVIEW OF HEMOGLOBINOMETRIC METHODS

UC Davis Medical CenterPatient Flow Improvement
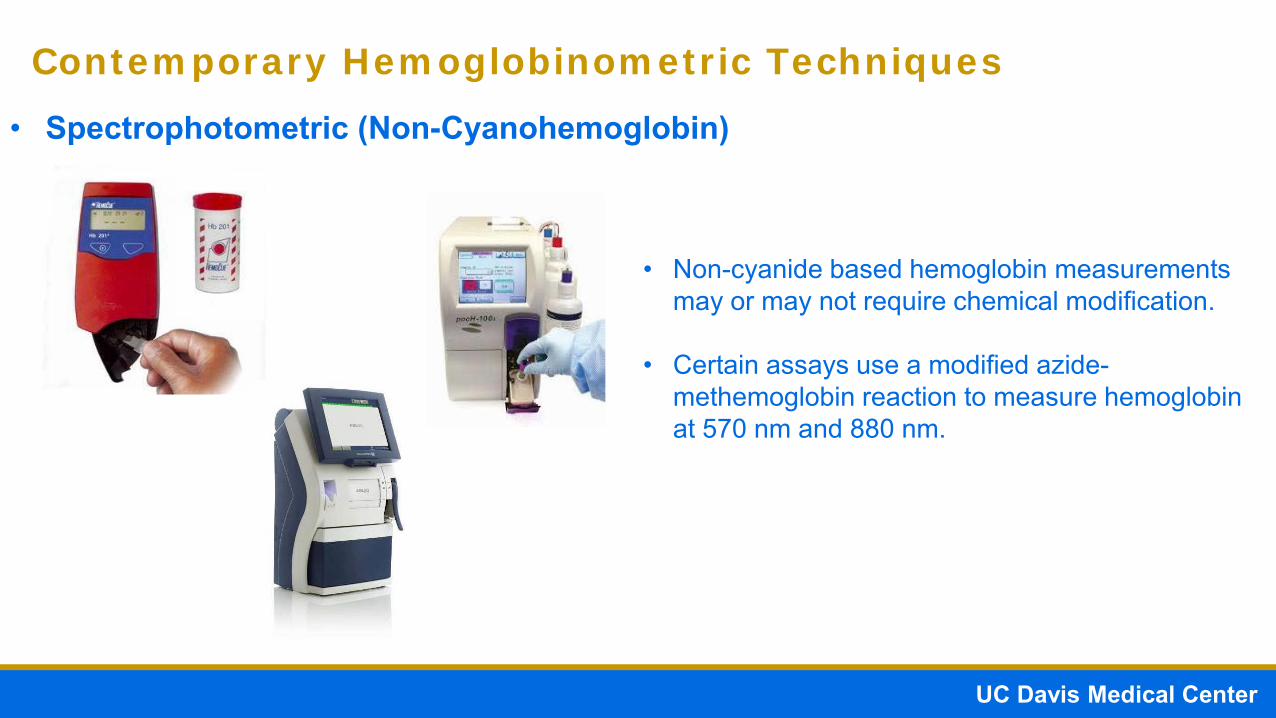
• Spectrophotometric (Non-Cyanohemoglobin)
Contemporary Hemoglobinometric Techniques
• Measurement of hemoglobin is based on the absorption spectra
• Oxy- and deoxyhemoglobin exhibit different absorption in the red to IR wavelengths.
• Measurement based on Beer’s Law (A = elc).
• Some methods require lysis and reacting with non-cyanide-based reagents.
Abs
orba
nce
HHbO2HbCOHbMetHb
Prism
White light
500 550 600 650 700 nm
UC Davis Medical CenterPatient Flow Improvement
• Spectrophotometric (Non-Cyanohemoglobin)
Contemporary Hemoglobinometric Techniques
• Non-cyanide based hemoglobin measurements may or may not require chemical modification.
• Certain assays use a modified azide-methemoglobin reaction to measure hemoglobin at 570 nm and 880 nm.

UC Davis Medical CenterPatient Flow Improvement
Spectrophotometric (Cyanohemoglobin)• Hemoglobin is converted into cyanohemoglobin using a dilute solution of
potassium cyanide and potassium ferricyanide.
Hb and HbCO methemoglobin cyanohemoglobin
• Measurement of cyanohemoglobin product is similar to non-cyanohemoglobinmethods based on Beer’s Law.
• Hemoglobin S variants may be incorrectly measured using this method.
Contemporary Hemoglobinometric Techniques
UC Davis Medical CenterPatient Flow Improvement
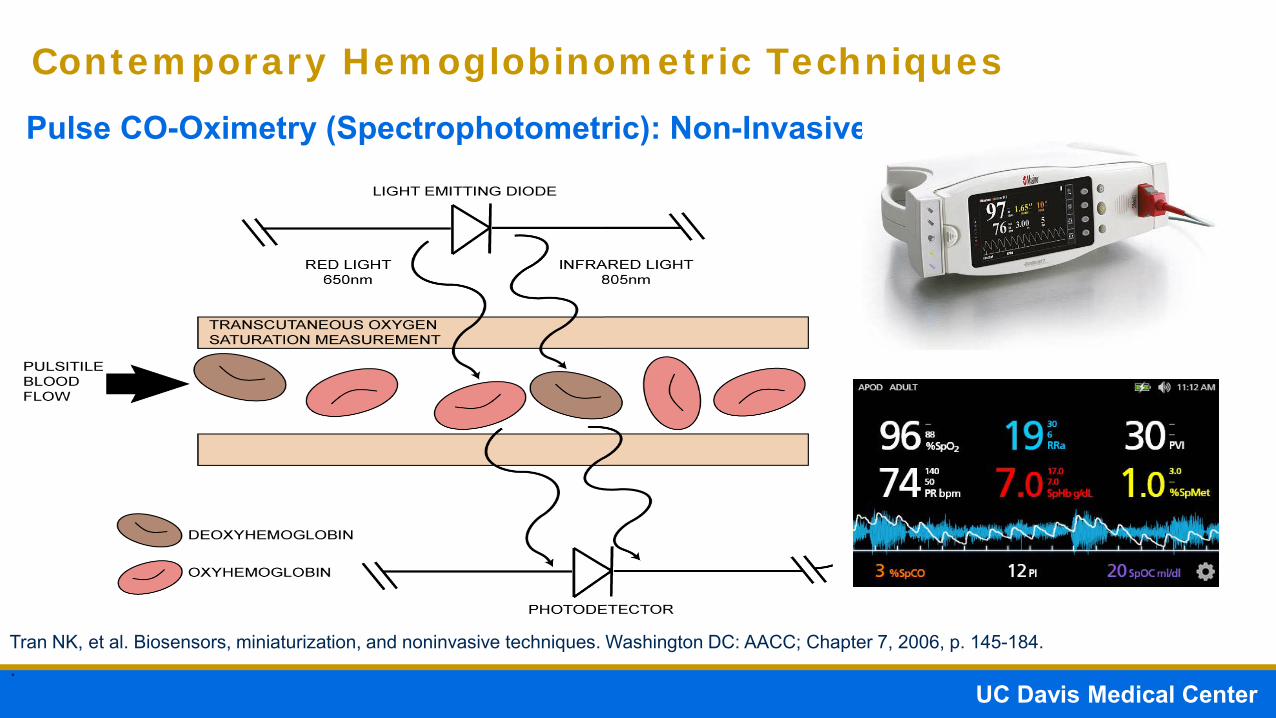
Pulse CO-Oximetry (Spectrophotometric): Non-Invasive
Contemporary Hemoglobinometric Techniques
Invasive
Tran NK, et al. Biosensors, miniaturization, and noninvasive techniques. Washington DC: AACC; Chapter 7, 2006, p. 145-184..

Absorption Function
Tran NK, Kost GJ. Point-of-care biosensors, miniaturization, and noninvasive monitoring. In: Cook KW, Lehman C, Schoeff L, et al., Eds., Clinical Diagnostic Technology: The Total Testing Process-Pre-Analytical, Analytical, and Post-Analytical Phases. Washington, DC: AACC Press; volume 3, 2006. PP 16.
A is absorption
ε is the absorptivity constant
L is the path length
C is the concentration of absorbing species
A = εLC

UC Davis Medical CenterPatient Flow Improvement
Pulse CO-Oximetry (Spectrophotometric): Non-Invasive
Contemporary Hemoglobinometric Techniques
Tran NK, et al. Biosensors, miniaturization, and noninvasive techniques. Washington DC: AACC; Chapter 7, 2006, p. 145-184..
• Suggested to potentially provided real-time trending of hemoglobin values.
• Identify the “vector” or trajectory of hemoglobin levels to anticipate need for transfusions.

UC Davis Medical CenterPatient Flow Improvement
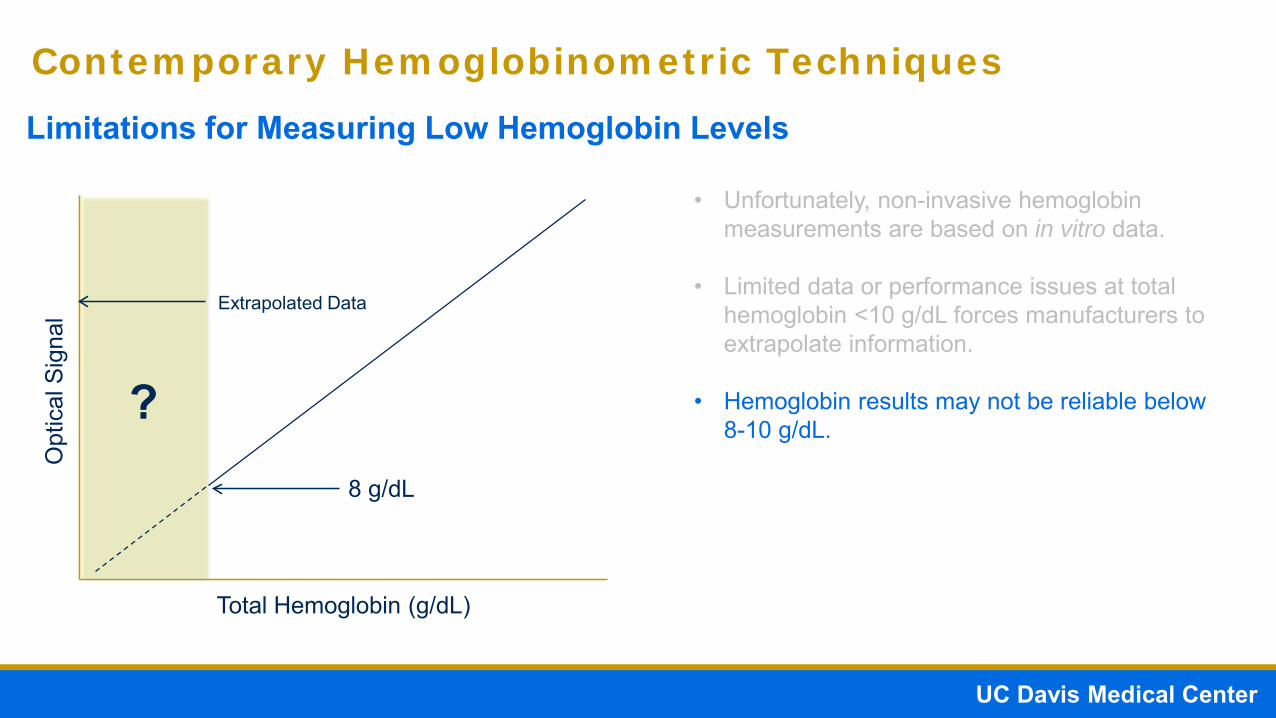
Limitations for Measuring Low Hemoglobin Levels
Contemporary Hemoglobinometric Techniques
• Unfortunately, non-invasive hemoglobin measurements are based on in vitro data.
Total Hemoglobin (g/dL)
Opt
ical
Sig
nal

UC Davis Medical CenterPatient Flow Improvement
Limitations for Measuring Low Hemoglobin Levels
Contemporary Hemoglobinometric Techniques
• Unfortunately, non-invasive hemoglobin measurements are based on in vitro data.
• Limited data or performance issues at total hemoglobin <10 g/dL forces manufacturers to extrapolate information.
Total Hemoglobin (g/dL)
Opt
ical
Sig
nal Extrapolated Data
8 g/dL
UC Davis Medical CenterPatient Flow Improvement
Limitations for Measuring Low Hemoglobin Levels
Contemporary Hemoglobinometric Techniques
• Unfortunately, non-invasive hemoglobin measurements are based on in vitro data.
• Limited data or performance issues at total hemoglobin <10 g/dL forces manufacturers to extrapolate information.
• Hemoglobin results may not be reliable below 8-10 g/dL.
Total Hemoglobin (g/dL)
Opt
ical
Sig
nal Extrapolated Data
8 g/dL
?

UC Davis Medical CenterPatient Flow Improvement
Limitations for Measuring Low Hemoglobin Levels
Contemporary Hemoglobinometric Techniques
• Unfortunately, non-invasive hemoglobin measurements are based on in vitro data.
• Limited data or performance issues at total hemoglobin <10 g/dL forces manufacturers to extrapolate information.
• Hemoglobin results may not be reliable below 8-10 g/dL.
• Results reliability may also decrease due to hypotension/hypoperfusion similar to pulse oximetry.
Total Hemoglobin (g/dL)
Opt
ical
Sig
nal Extrapolated Data
8 g/dL
?
Kost GJ, Tran NK. Crit Care Med 2011;39:2369-71

UC Davis Medical CenterPatient Flow Improvement
Pulse Co-Oximetry (Spectrophotometric) – Smart Devices
Contemporary Hemoglobinometric Techniques
Image recognition by iPad enables quantification of hemoglobin from the blood soaked sponge. Results are transmitted to the cloud for near instantaneous estimation of hemoglobin loss.
Exhibits similar or perhaps greater variability due to methodology. Clinical efficacy currently not proven.

UC Davis Medical CenterPatient Flow Improvement
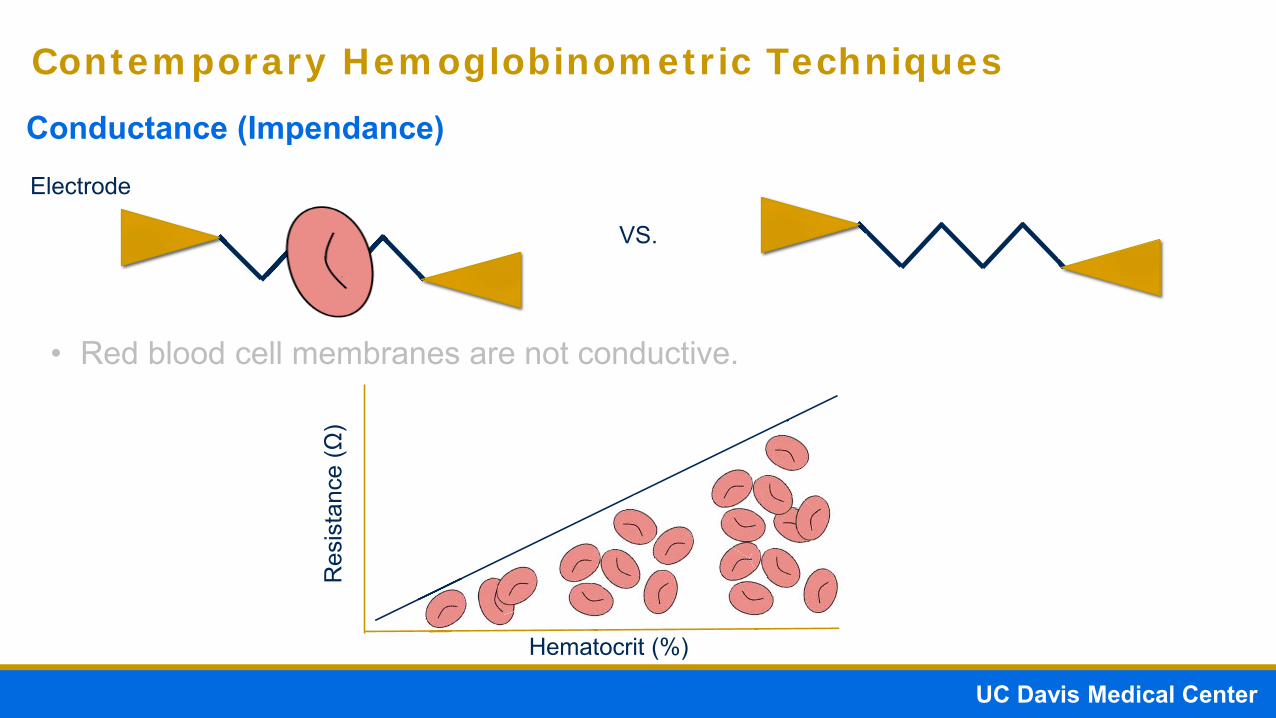
Conductance (Impendance)
Contemporary Hemoglobinometric Techniques
Electrode
VS.
• Red blood cell membranes are not conductive.
High Resistance Low Resistance
UC Davis Medical CenterPatient Flow Improvement
Conductance (Impendance)
Contemporary Hemoglobinometric Techniques
Electrode
VS.
• Red blood cell membranes are not conductive.
Hematocrit (%)
Res
ista
nce
(Ω)

UC Davis Medical CenterPatient Flow Improvement
Conductance (Impendance)
Contemporary Hemoglobinometric Techniques
Electrode
VS.
• Red blood cell membranes are not conductive.
• The number of red blood cells is proportional to the change in conductance and conforms to Ohm’s Law (V = IR)

UC Davis Medical CenterPatient Flow Improvement
Conductance (Impendance)
Contemporary Hemoglobinometric Techniques
Electrode
VS.
• Red blood cell membranes are not conductive.
• The number of red blood cells is proportional to the change in conductance and conforms to Ohm’s Law (V = IR)
• Conductance-based methods measure hematocrit. The hematocrit can then be used to calculate hemoglobin based on a conversion factor (estimated hemoglobin = hematocrit / 3.4)*

UC Davis Medical CenterPatient Flow Improvement
Conductance (Impendance)
Contemporary Hemoglobinometric Techniques
Electrode
VS.

UC Davis Medical CenterPatient Flow Improvement
CONFOUNDING FACTORS IN HEMOGLOBINOMETRY

UC Davis Medical CenterPatient Flow Improvement
Pre-Analytical• Labeling
• Specimen collection/processing errors
• Specimen quality
Confounding Factors Affecting Hemoglobin Measurement

UC Davis Medical CenterPatient Flow Improvement
Pre-Analytical• Labeling
• Specimen collection/processing errors
• Specimen quality
Analytical• Operator error
• Instrument error
Confounding Factors Affecting Hemoglobin Measurement
UC Davis Medical CenterPatient Flow Improvement
Pre-Analytical• Labeling
• Specimen collection/processing errors
• Specimen quality
Analytical• Operator error
• Instrument error
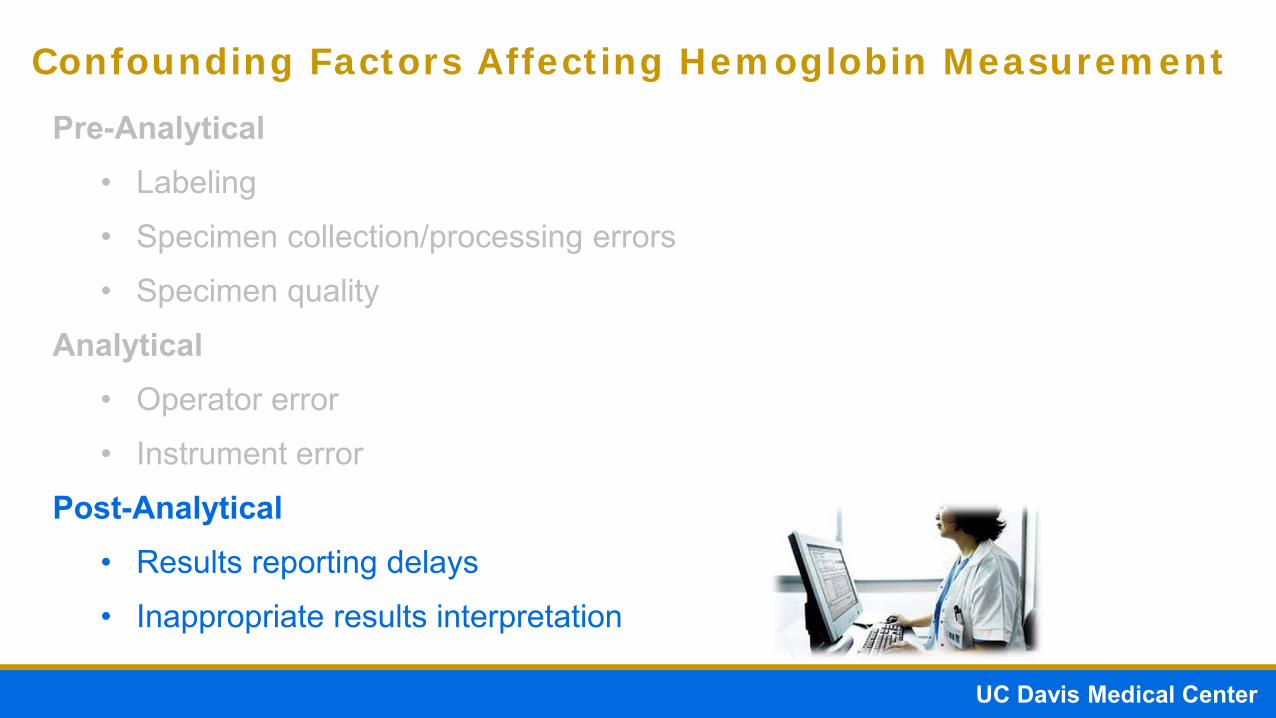
Post-Analytical• Results reporting delays
• Inappropriate results interpretation
Confounding Factors Affecting Hemoglobin Measurement
UC Davis Medical CenterPatient Flow Improvement
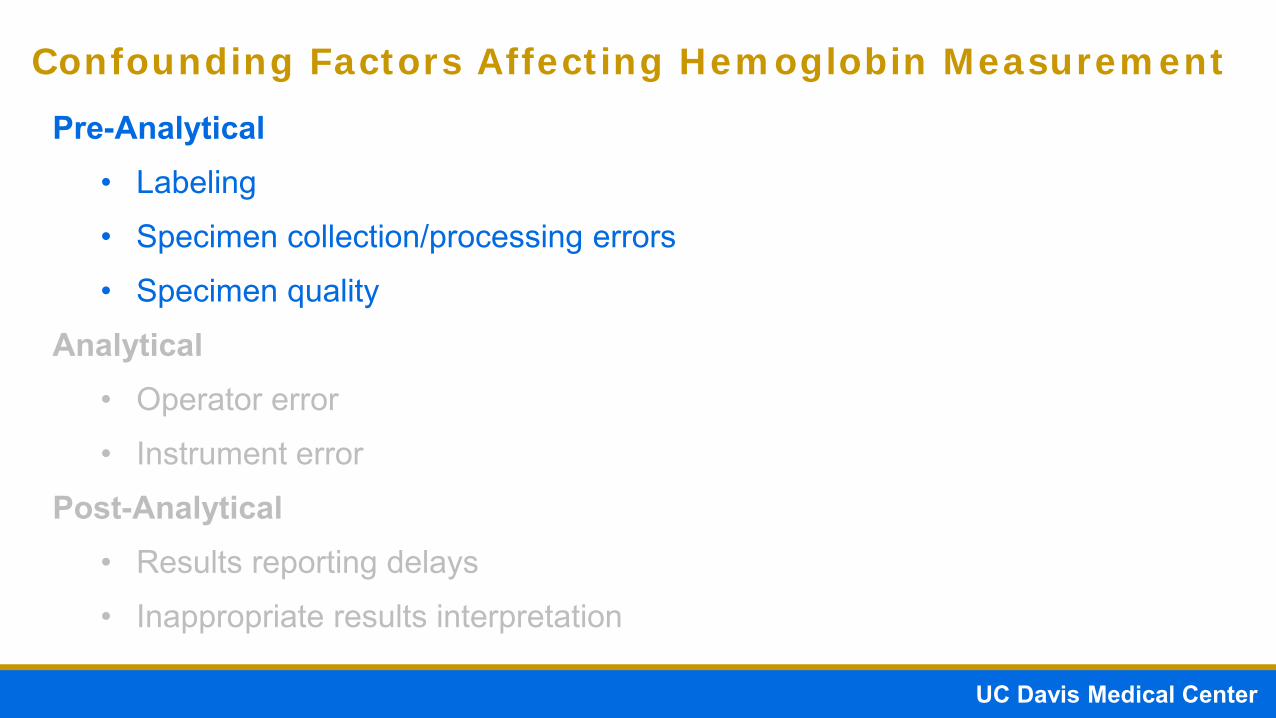
Pre-Analytical• Labeling
• Specimen collection/processing errors
• Specimen quality
Analytical• Operator error
• Instrument error
Post-Analytical• Results reporting delays
• Inappropriate results interpretation
Confounding Factors Affecting Hemoglobin Measurement

UC Davis Medical CenterPatient Flow Improvement
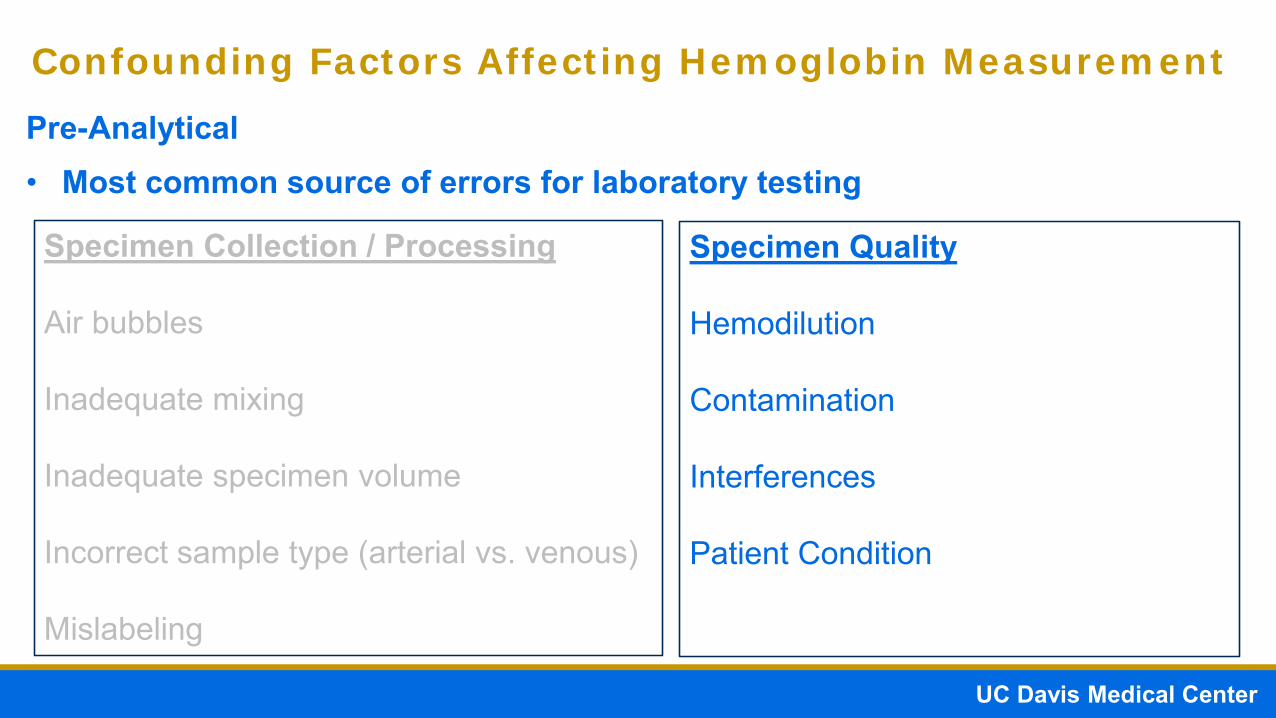
Pre-Analytical• Most common source of errors for laboratory testing
Confounding Factors Affecting Hemoglobin Measurement
Specimen Collection / Processing
Air bubbles
Inadequate mixing
Inadequate specimen volume
Incorrect sample type (arterial vs. venous)
Mislabeling
Specimen Quality
Hemodilution
Contamination
Interferences

UC Davis Medical CenterPatient Flow Improvement
Does it really matter?

UC Davis Medical CenterPatient Flow Improvement
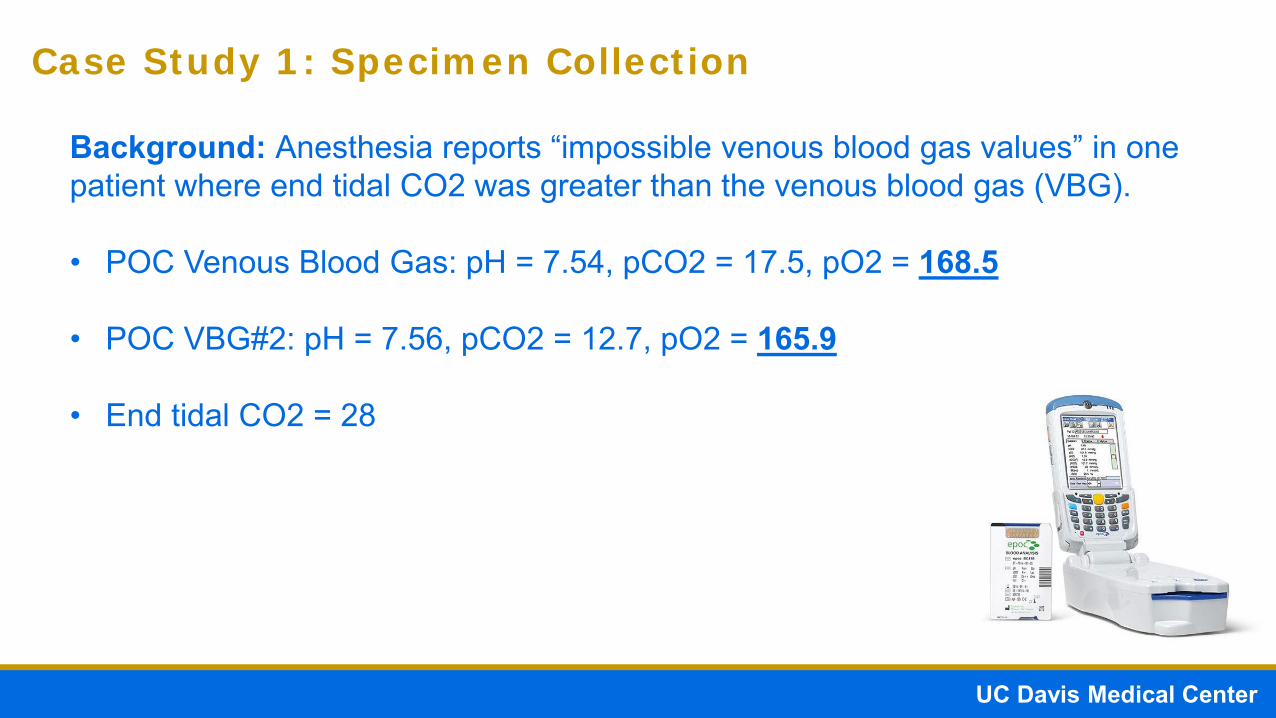
Case Study 1: Specimen Collection
Background: Anesthesia reports “impossible venous blood gas values” in one patient where end tidal CO2 was greater than the venous blood gas (VBG).
UC Davis Medical CenterPatient Flow Improvement
Case Study 1: Specimen Collection
Background: Anesthesia reports “impossible venous blood gas values” in one patient where end tidal CO2 was greater than the venous blood gas (VBG).
• POC Venous Blood Gas: pH = 7.54, pCO2 = 17.5, pO2 = 168.5
• POC VBG#2: pH = 7.56, pCO2 = 12.7, pO2 = 165.9
• End tidal CO2 = 28
• Lab Venous Blood Gas: pH 7.54, pCO2 = 19.2, pO2 = 161.5

UC Davis Medical CenterPatient Flow Improvement
Case Study 1: Specimen Collection
Blood Gas Laboratory identified “air bubbles” in syringe
Background: Anesthesia reports “impossible venous blood gas values” in one patient where end tidal CO2 was greater than the venous blood gas (VBG).
• POC Venous Blood Gas: pH = 7.54, pCO2 = 17.5, pO2 = 168.5
• POC VBG#2: pH = 7.56, pCO2 = 12.7, pO2 = 165.9
• End tidal CO2 = 28
• Lab Venous Blood Gas: pH 7.54, pCO2 = 19.2, pO2 = 161.5

UC Davis Medical CenterPatient Flow Improvement
Case Study 1: Specimen Collection
Background: Anesthesia reports “impossible venous blood gas values” in one patient where end tidal CO2 was greater than the venous blood gas (VBG).
• POC Venous Blood Gas: pH = 7.54, pCO2 = 17.5, pO2 = 168.5
• POC VBG#2: pH = 7.56, pCO2 = 12.7, pO2 = 165.9
• End tidal CO2 = 28
• Lab Venous Blood Gas: pH 7.54, pCO2 = 19.2, pO2 = 161.5
• Air bubbles can quickly (<5 mins) cause the specimen to equilibrate atmospheric air (1 atm = 760 mmHg = 0.21 x 760 = 150 mmHg for pO2!!!)

UC Davis Medical CenterPatient Flow Improvement
Case Study 2: Specimen Collection
Background: Patient with suspected Ebola Virus symptoms admitted forevaluation. Isolation protocols were in effect.

UC Davis Medical CenterPatient Flow Improvement
Case Study 2: Specimen Collection
Background: Patient with suspected Ebola Virus symptoms admitted forevaluation. Isolation protocols were in effect.

UC Davis Medical CenterPatient Flow Improvement
Case Study 2: Specimen Collection
Background: Patient with suspected Ebola Virus symptoms admitted forevaluation. Isolation protocols were in effect. A handheld blood gas chemistryanalyzer served as the primary chemistry analyzer.
0853 hrs – Specimens collected for chemistry and CBC testing.
Handheld ResultsHct = 68%Hb = 21.9 g/dL
CBC ResultsHct = 41%Hb = 13.2 g/dL

UC Davis Medical CenterPatient Flow Improvement
Case Study 2: Specimen Collection
Background: Patient with suspected Ebola Virus symptoms admitted forevaluation. Isolation protocols were in effect. A handheld blood gas chemistryanalyzer served as the primary chemistry analyzer.
0853 hrs – Specimens collected for chemistry and CBC testing.
Hct = 43%Hb = 13.8 g/dL
Handheld ResultsHct = 68%Hb = 21.9 g/dL
RE-MIXING!
CBC ResultsHct = 41%Hb = 13.2 g/dL

UC Davis Medical CenterPatient Flow Improvement
Case Study 2: Specimen Collection
Background: Patient with suspected Ebola Virus symptoms admitted forevaluation. Isolation protocols were in effect. A handheld blood gas chemistryanalyzer served as the primary chemistry analyzer.
0853 hrs – Specimens collected for chemistry and CBC testing.
Hct = 43%Hb = 13.8 g/dL
Inadequate mixing may result in artificial changes in total hemoglobin measurements.
Handheld ResultsHct = 68%Hb = 21.9 g/dL
RE-MIXING!
CBC ResultsHct = 41%Hb = 13.2 g/dL
UC Davis Medical CenterPatient Flow Improvement
Pre-Analytical• Most common source of errors for laboratory testing
Confounding Factors Affecting Hemoglobin Measurement
Specimen Collection / Processing
Air bubbles
Inadequate mixing
Inadequate specimen volume
Incorrect sample type (arterial vs. venous)
Mislabeling
Specimen Quality
Hemodilution
Contamination
Interferences
Patient Condition

UC Davis Medical CenterPatient Flow Improvement
Electrode
Conductance (Impendence)
Contemporary Hemoglobinometric Techniques
• Conversion factor for hematocrit to hemoglobin of 3 may be inappropriate for some special populations.
= Hemoglobin
High Resistance

UC Davis Medical CenterPatient Flow Improvement
Electrode
Conductance (Impendence)
Contemporary Hemoglobinometric Techniques
= Hemoglobin
High Resistance
• Conversion factor for hematocrit to hemoglobin of 3 may be inappropriate for some special populations.
• The equation, hemoglobin = hematocrit / 3.4 assumes a consistent fraction in grams per deciliter of hemoglobin per percent hematocrit.
Rodrigez-Morales A, et al. Malaria Journal 2007;6:166

UC Davis Medical CenterPatient Flow Improvement
Electrode
Conductance (Impendence)
Contemporary Hemoglobinometric Techniques
= Hemoglobin
• Conversion factor for hematocrit to hemoglobin of 3 may be inappropriate for some special populations.
• The equation, hemoglobin = hematocrit / 3.4 assumes a consistent fraction in grams per deciliter of hemoglobin per percent hematocrit.
• Studies in special populations such as patients with malaria indicate the 3.4 conversion factor underestimates anemia in these populations.
No Change in Resistance
Rodrigez-Morales A, et al. Malaria Journal 2007;6:166

UC Davis Medical CenterPatient Flow Improvement
Electrode
Conductance (Impendence)
Contemporary Hemoglobinometric Techniques
= HemoglobinNo Change in Resistance
• Conversion factor for hematocrit to hemoglobin of 3 may be inappropriate for some special populations.
• The equation, hemoglobin = hematocrit / 3.4 assumes a consistent fraction in grams per deciliter of hemoglobin per percent hematocrit.
• Studies in special populations such as patients with malaria indicate the 3.4 conversion factor underestimates anemia in these populations.
• These studies suggest an alternative conversion factor corrected to be used for these populations.
Rodrigez-Morales A, et al. Malaria Journal 2007;6:166

UC Davis Medical CenterPatient Flow Improvement
Pre-Analytical• Most common source of errors for laboratory testing
Confounding Factors Affecting Hemoglobin Measurement
Specimen Collection / Processing
Air bubbles
Inadequate mixing
Inadequate specimen volume
Incorrect sample type (arterial vs. venous)
Mislabeling
Specimen Quality
Hemodilution
Contamination
Interferences
Patient Condition

UC Davis Medical CenterPatient Flow Improvement
Electrode
Conductance (Impendence)
Contemporary Hemoglobinometric Techniques
• Plasma protein content contributes to hematocrit measurements for conductance-based systems.
= Plasma Protein
High Resistance

UC Davis Medical CenterPatient Flow Improvement
Electrode
Conductance (Impendence)
Contemporary Hemoglobinometric Techniques
= Plasma Protein
• Plasma protein content contributes to hematocrit measurements for conductance-based systems.
• Conductance-based systems assumes a relatively fixed protein concentration. Therefore, duringhemodilution, hematocrit may be falsely lower and causing an underestimation of totalhemoglobin.
Low Resistance from low plasma protein concentration!

UC Davis Medical CenterPatient Flow Improvement
Electrode
Conductance (Impendence)
Contemporary Hemoglobinometric Techniques
= Plasma Protein
• Plasma protein content contributes to hematocrit measurements for conductance-based systems.
• Conductance-based systems assumes a relatively fixed protein concentration. Therefore, duringhemodilution, hematocrit may be falsely lower and causing an underestimation of totalhemoglobin.
• UCDMC Study: Comparison of a handheld blood gas analyzer using conductance-basedmeasurement of hemoglobin versus a benchtop blood gas analyzer using a spectrophotometric-based method for hemoglobinometry.

UC Davis Medical CenterPatient Flow Improvement
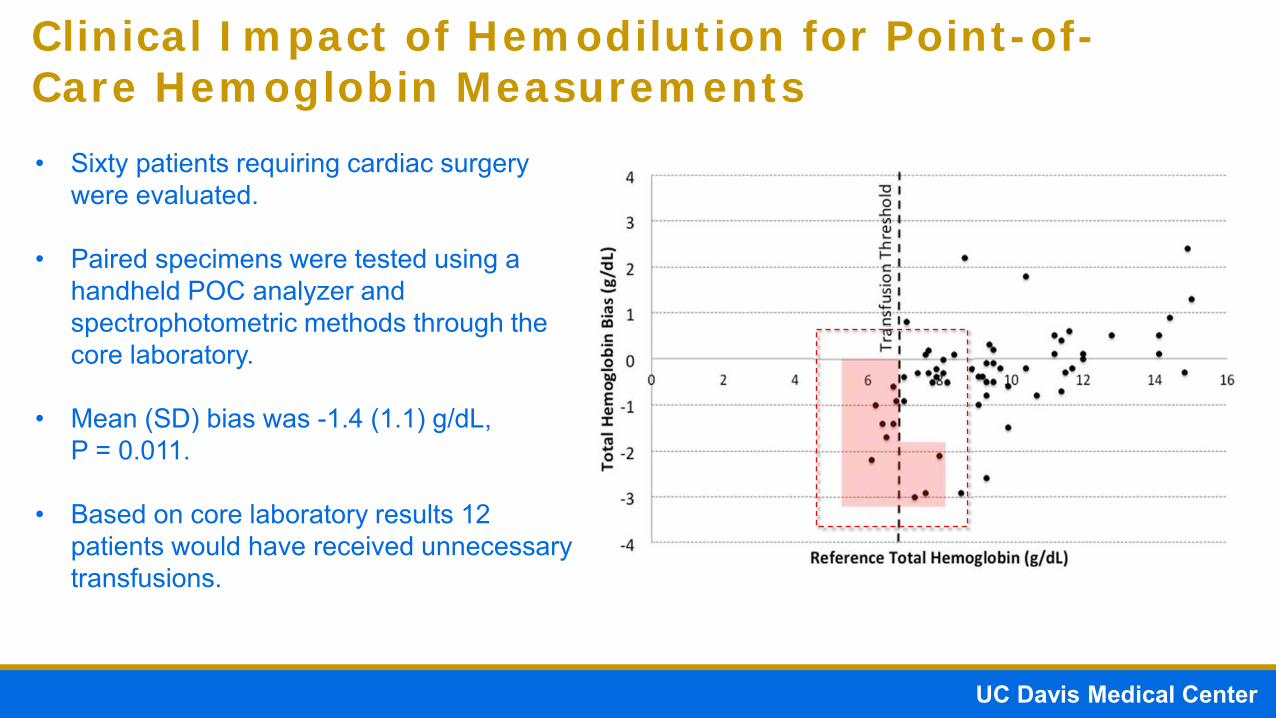
• Sixty patients requiring cardiac surgery were evaluated.
• Paired specimens were tested using a handheld POC analyzer and spectrophotometric methods through the core laboratory.
• Mean (SD) bias was -1.4 (1.1) g/dL, P = 0.011.
• Based on core laboratory results 12 patients would have received unnecessary transfusions.
Clinical Impact of Hemodilution for Point-of-Care Hemoglobin Measurements
UC Davis Medical CenterPatient Flow Improvement
• Sixty patients requiring cardiac surgery were evaluated.
• Paired specimens were tested using a handheld POC analyzer and spectrophotometric methods through the core laboratory.
• Mean (SD) bias was -1.4 (1.1) g/dL, P = 0.011.
• Based on core laboratory results 12 patients would have received unnecessary transfusions.
Clinical Impact of Hemodilution for Point-of-Care Hemoglobin Measurements
= $219
$219 x 12 = $2,628 POTENTIALLY WASTED
Toner RW, et al. Appl Health Econ Health Policy 2011;9:29-37
UC Davis Medical CenterPatient Flow Improvement
Case Study 3: Analytical Performance

UC Davis Medical CenterPatient Flow Improvement
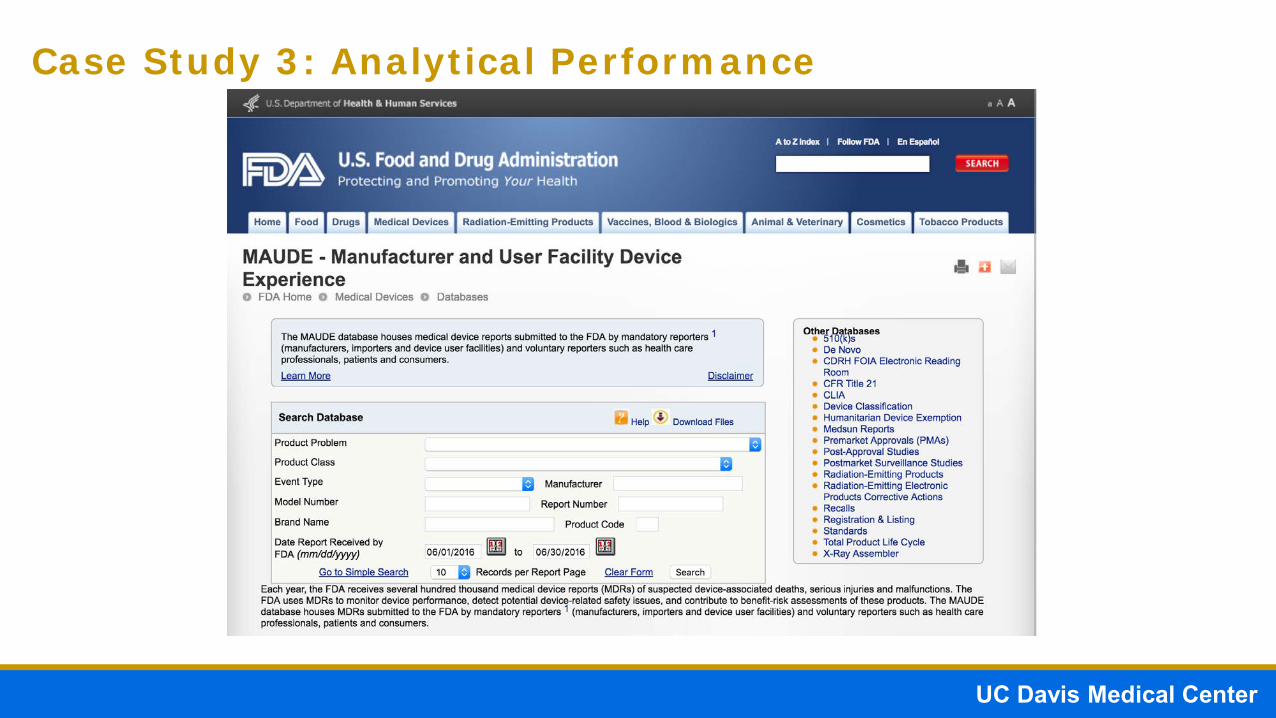
Case Study 3: Analytical Performance
Background: FDA MAUDE database reports a case (03P76-25) of a neonatalpatient with discrepant point-of-care (POC) hemoglobin values compared to thelaboratory. The POC device used a conductance-based method of hemoglobinmeasurement, while the laboratory used a spectrophotometric method.

UC Davis Medical CenterPatient Flow Improvement
Case Study 3: Analytical Performance
Background: FDA MAUDE database reports a case (03P76-25) of a neonatalpatient with discrepant point-of-care (POC) hemoglobin values compared to thelaboratory. The POC device used a conductance-based method of hemoglobinmeasurement, while the laboratory used a spectrophotometric method.
• POC device reported a hematocrit of 22%. Physician administered 7 mL ofblood based on the POC result.
• Transfusion was stopped halfway after the laboratory reported a hematocrit of40% and hemoglobin of 11.7 g/dL.
• Post-transfusion POC and lab hematocrit values were 45 and 50%respectively.

UC Davis Medical CenterPatient Flow Improvement
ANALYTICAL PERFORMANCE OF OPTICAL VERSUS CONDUCTIVE BASED HEMOGLOBIN MEASUREMENTS

UC Davis Medical CenterPatient Flow Improvement
Analytical Performance of Optical vs. Conductance-Based Hemoglobinometry

UC Davis Medical CenterPatient Flow Improvement
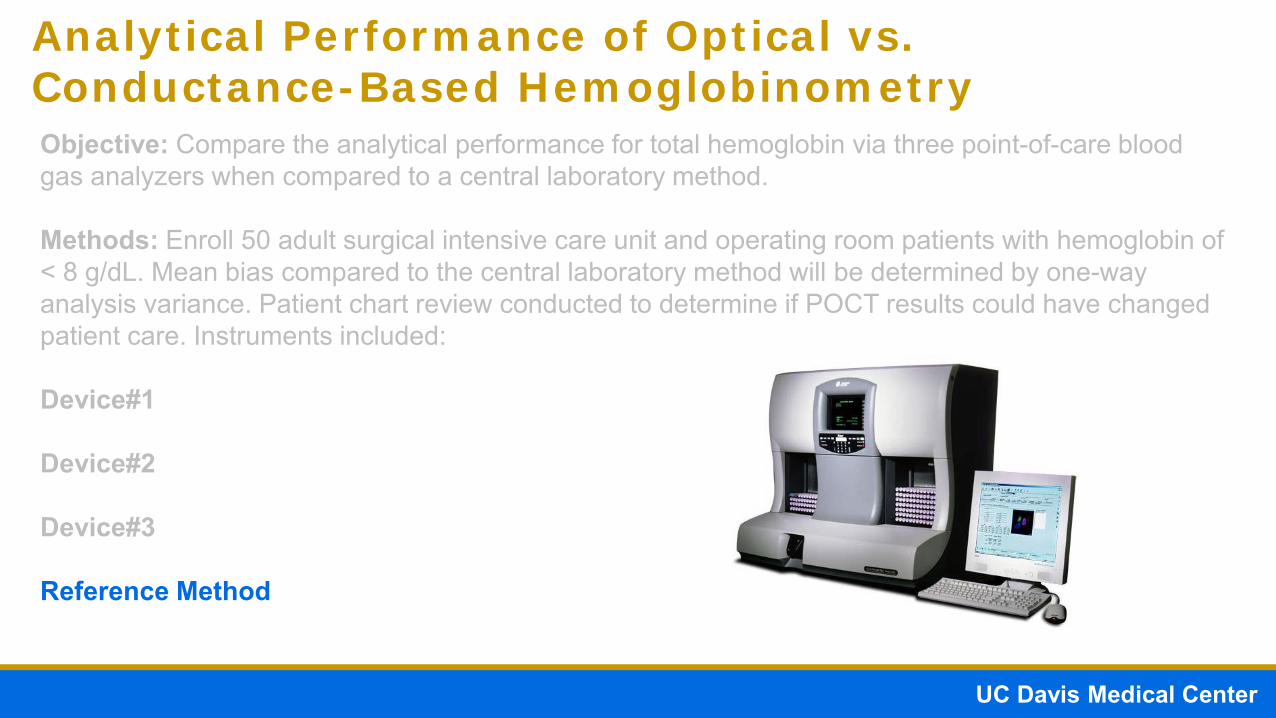
Analytical Performance of Optical vs. Conductance-Based HemoglobinometryObjective: Compare the analytical performance for total hemoglobin via three point-of-care blood gas analyzers when compared to a central laboratory method.

UC Davis Medical CenterPatient Flow Improvement
Analytical Performance of Optical vs. Conductance-Based HemoglobinometryObjective: Compare the analytical performance for total hemoglobin via three point-of-care blood gas analyzers when compared to a central laboratory method.
Methods: Enroll 50 adult surgical intensive care unit and operating room patients with hemoglobin of < 8 g/dL. Mean bias compared to the central laboratory method will be determined by one-way analysis variance. Patient chart review conducted to determine if POCT results could have changed patient care. Instruments included:
Device#1 Format: Handheld
Hb Method: Conductance
Analysis Time: 30 secs
Sample Volume: 95 microliters

UC Davis Medical CenterPatient Flow Improvement
Analytical Performance of Optical vs. Conductance-Based HemoglobinometryObjective: Compare the analytical performance for total hemoglobin via three point-of-care blood gas analyzers when compared to a central laboratory method.
Methods: Enroll 50 adult surgical intensive care unit and operating room patients with hemoglobin of < 8 g/dL. Mean bias compared to the central laboratory method will be determined by one-way analysis variance. Patient chart review conducted to determine if POCT results could have changed patient care. Instruments included:
Device#1
Device#2
Format: Handheld
Hb Method: Conductance
Analysis Time: 30 secs
Sample Volume: 92 microliters

UC Davis Medical CenterPatient Flow Improvement
Analytical Performance of Optical vs. Conductance-Based HemoglobinometryObjective: Compare the analytical performance for total hemoglobin via three point-of-care blood gas analyzers when compared to a central laboratory method.
Methods: Enroll 50 adult surgical intensive care unit and operating room patients with hemoglobin of < 8 g/dL. Mean bias compared to the central laboratory method will be determined by one-way analysis variance. Patient chart review conducted to determine if POCT results could have changed patient care. Instruments included:
Device#1
Device#2
Device#3
Format: Portable
Hb Method: Spectrophotometric
Analysis Time: 35 secs
Sample Volume: 65 microliters

UC Davis Medical CenterPatient Flow Improvement
Analytical Performance of Optical vs. Conductance-Based HemoglobinometryObjective: Compare the analytical performance for total hemoglobin via three point-of-care blood gas analyzers when compared to a central laboratory method.
Methods: Enroll 50 adult surgical intensive care unit and operating room patients with hemoglobin of < 8 g/dL. Mean bias compared to the central laboratory method will be determined by one-way analysis variance. Patient chart review conducted to determine if POCT results could have changed patient care. Instruments included:
Device#1
Device#2
Device#3
Reference Method

UC Davis Medical CenterPatient Flow Improvement
Analytical Performance of Optical vs. Conductance-Based Hemoglobinometry
Dev
ice
#1 H
b(g
/dL)
Central Laboratory Hb (g/dL)
y = 0.5092x + 4.0176R² = 0.5253
4
5
6
7
8
9
10
11
4 5 6 7 8 9 10 11 12
UC Davis Medical CenterPatient Flow Improvement
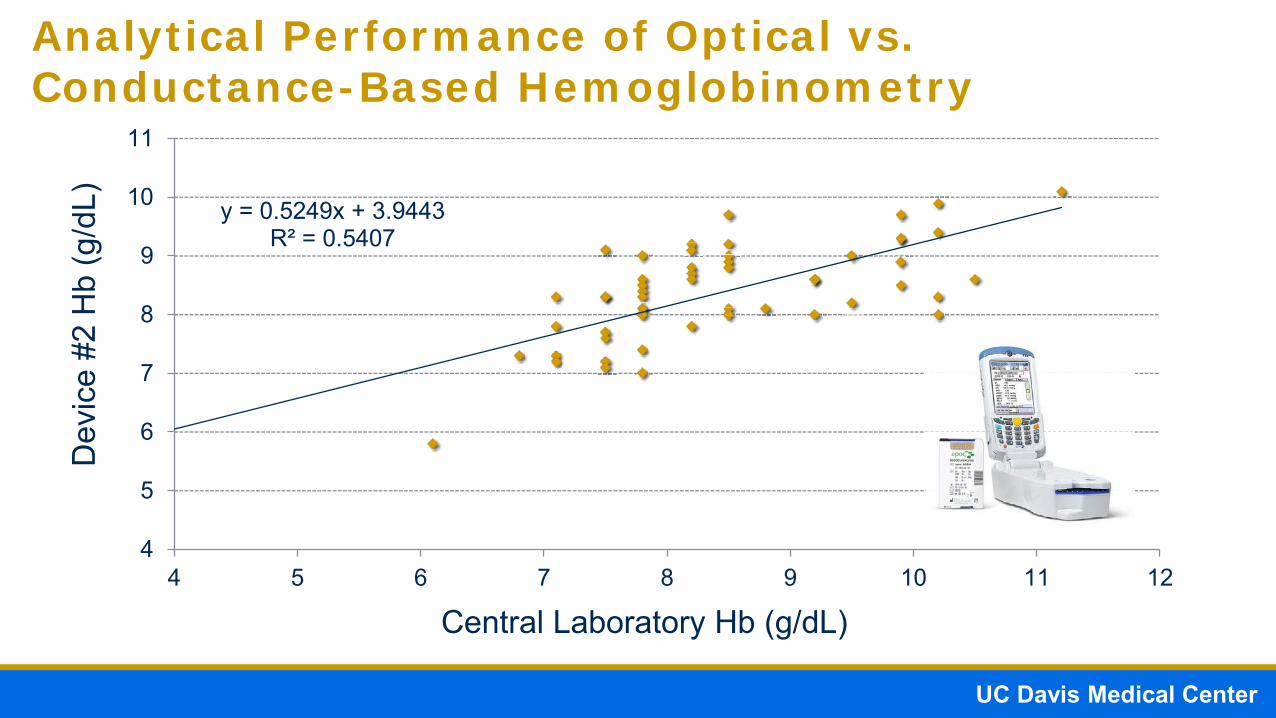
Analytical Performance of Optical vs. Conductance-Based Hemoglobinometry
Dev
ice
#2 H
b(g
/dL)
Central Laboratory Hb (g/dL)
y = 0.5249x + 3.9443R² = 0.5407
4
5
6
7
8
9
10
11
4 5 6 7 8 9 10 11 12

UC Davis Medical CenterPatient Flow Improvement
Analytical Performance of Optical vs. Conductance-Based Hemoglobinometry
Dev
ice
#3 H
b(g
/dL)
y = 0.9345x + 0.4057R² = 0.9205
4
5
6
7
8
9
10
11
4 5 6 7 8 9 10 11
Central Laboratory Hb (g/dL)

UC Davis Medical CenterPatient Flow Improvement
Analytical Performance of Optical vs. Conductance-Based Hemoglobinometry
00.20.40.60.8
11.21.4
iSTAT-Lab epoc-Lab ABL90-Lab
Mea
n Bi
as (g
/dL) *** ***
Notes: *** P<0.001, Lab = Beckman LH hematology analyzer
Device 1 Device 2 Device 3

UC Davis Medical CenterPatient Flow Improvement
Analytical Performance of Optical vs. Conductance-Based Hemoglobinometry
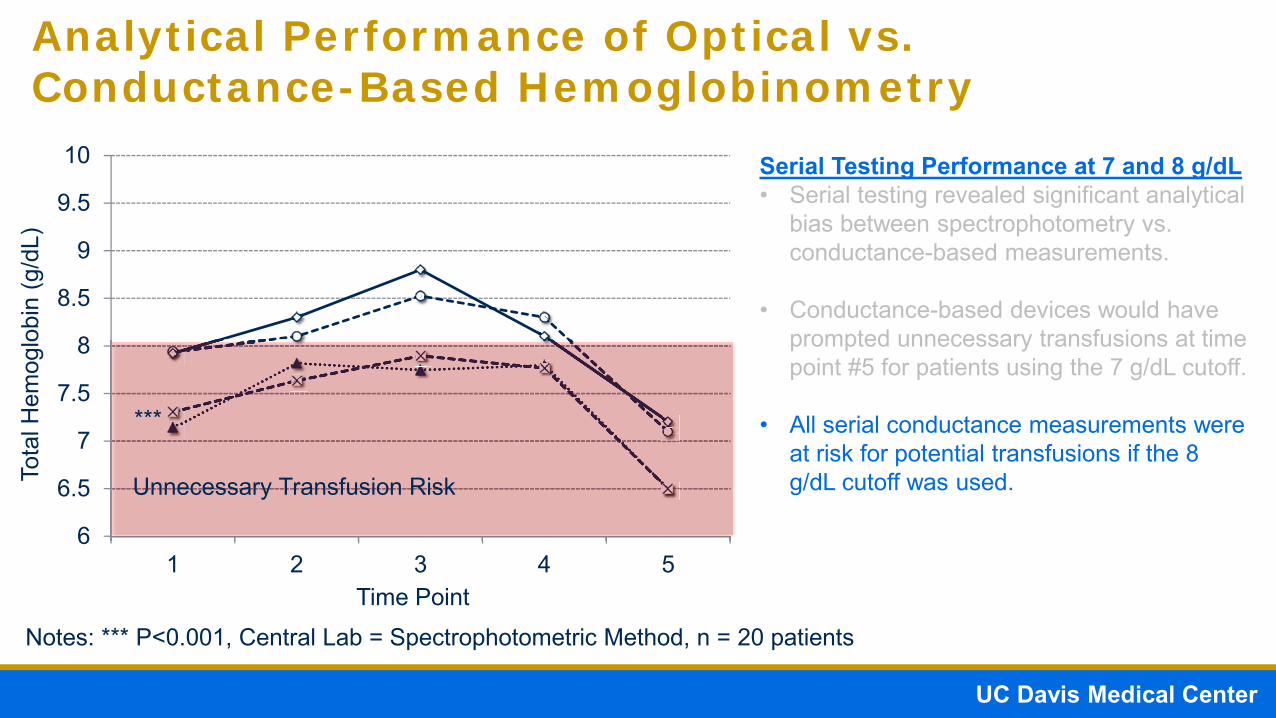
Notes: *** P<0.001, Central Lab = Spectrophotometric Method, n = 20 patients
6
6.5
7
7.5
8
8.5
9
9.5
10
1 2 3 4 5
Tota
l Hem
oglo
bin
(g/d
L)
Time Point
Serial Testing Performance at 7 and 8 g/dL• Serial testing revealed significant analytical
bias between spectrophotometry vs. conductance-based measurements.
*** Spectrophotometric-based Methods

UC Davis Medical CenterPatient Flow Improvement
Analytical Performance of Optical vs. Conductance-Based Hemoglobinometry
Notes: *** P<0.001, Central Lab = Spectrophotometric Method, n = 20 patients
6
6.5
7
7.5
8
8.5
9
9.5
10
1 2 3 4 5
Tota
l Hem
oglo
bin
(g/d
L)
Time Point
Serial Testing Performance at 7 and 8 g/dL• Serial testing revealed significant analytical
bias between spectrophotometry vs. conductance-based measurements.
*** Spectrophotometric-based Methods
Conductance-based Methods

UC Davis Medical CenterPatient Flow Improvement
Analytical Performance of Optical vs. Conductance-Based Hemoglobinometry
6
6.5
7
7.5
8
8.5
9
9.5
10
1 2 3 4 5
Tota
l Hem
oglo
bin
(g/d
L)
Time Point
Serial Testing Performance at 7 and 8 g/dL• Serial testing revealed significant analytical
bias between spectrophotometry vs. conductance-based measurements.
• Conductance-based devices would have prompted unnecessary transfusions at time point #5 for patients using the 7 g/dL cutoff.
Unnecessary Transfusion Risk
***
Notes: *** P<0.001, Central Lab = Spectrophotometric Method, n = 20 patients
UC Davis Medical CenterPatient Flow Improvement
Analytical Performance of Optical vs. Conductance-Based Hemoglobinometry
6
6.5
7
7.5
8
8.5
9
9.5
10
1 2 3 4 5
Tota
l Hem
oglo
bin
(g/d
L)
Time Point
Serial Testing Performance at 7 and 8 g/dL• Serial testing revealed significant analytical
bias between spectrophotometry vs. conductance-based measurements.
• Conductance-based devices would have prompted unnecessary transfusions at time point #5 for patients using the 7 g/dL cutoff.
• All serial conductance measurements were at risk for potential transfusions if the 8 g/dL cutoff was used. Unnecessary Transfusion Risk
***
Notes: *** P<0.001, Central Lab = Spectrophotometric Method, n = 20 patients

UC Davis Medical CenterPatient Flow Improvement
Analytical Performance of Optical vs. Conductance-Based Hemoglobinometry
6
6.5
7
7.5
8
8.5
9
9.5
10
1 2 3 4 5
Central Laboratory Method
Tota
l Hem
oglo
bin
(g/d
L)
Time Point
Serial Testing Performance at 7 and 8 g/dL• Serial testing revealed significant analytical
bias between spectrophotometry vs. conductance-based measurements.
• Conductance-based devices would have prompted unnecessary transfusions at time point #5 for patients using the 7 g/dL cutoff.
• All serial conductance measurements were at risk for potential transfusions if the 8 g/dL cutoff was used. Unnecessary Transfusion Risk
***
Notes: *** P<0.001, Central Lab = Spectrophotometric Method, n = 20 patients

UC Davis Medical CenterPatient Flow Improvement
Manufacturer and User Facility Device Experience (MAUDE) Database Summary
Device 1 Device 2 Device 3Timeframe 2011-2016 2011-2016 2014-2016*Erroneous Results 8 0 0Improper Transfusions
5 0 0
https://www.accessdata.fda.gov/scripts/cdrh/cfdocs/cfmaude/results.cfm, Accessed on July 19, 2016

UC Davis Medical CenterPatient Flow Improvement
Conclusions

UC Davis Medical CenterPatient Flow Improvement
Conclusions
• Unnecessary blood transfusions is attributed to adverse outcomes including mortality, morbidity and expense.

UC Davis Medical CenterPatient Flow Improvement
Conclusions
• Unnecessary blood transfusions is attributed to adverse outcomes including mortality, morbidity and expense.
• Transfusion thresholds may be different between various study populations such as cardiac surgery and burn patients.

UC Davis Medical CenterPatient Flow Improvement
Conclusions
• Unnecessary blood transfusions is attributed to adverse outcomes including mortality, morbidity and expense.
• Transfusion thresholds may be different between various study populations such as cardiac surgery and burn patients.
• Total hemoglobin measurement technologies are not created equal and may be susceptible to various confounding factors that occur during the pre-analytical and analytical phases of testing.
• Conductance based analyzers may be affected by hemodilution, while spectrophotometric techniques provide more accurate total hemoglobin measurements.
• Conductance-base measurement of total hemoglobin in a critical care and surgical setting may cause unnecessary blood transfusions due to hemodilution effects. Clinicians should use caution when using conductance based devices in hemodilution settings.
• Pre-analytical processing is critical for accurate results. “Junk-in, junk-out”. Institutions should use proper techniques and procedures to ensure good sample quality for accurate hemoglobinometry.

UC Davis Medical CenterPatient Flow Improvement
AcknowledgementsThe project described was supported by the: National Heart Lung andBlood Institute (NHLBI) Emergency Medicine K12 Career Award(5K12HL108964), and National Center for Advancing TranslationalSciences, National Institutes of Health (NIH), through grant number UL1TR00002. The opinions expressed in this presentation do not reflect theview of the National Institutes of Health, the Department of Health andHuman Services, or the United States government. Radiometer Americaprovided ABL90 and reagents for testing.

UC Davis Medical CenterPatient Flow Improvement
Questions?