block based enhancement of satellite images using ... based enhancement of satellite images using...
TRANSCRIPT
IOSR Journal of Electronics and Communication Engineering (IOSR-JECE)
e-ISSN: 2278-2834,p- ISSN: 2278-8735.Volume 8, Issue 6 (Nov. - Dec. 2013), PP 20-24 www.iosrjournals.org
www.iosrjournals.org 20 | Page
n
n
n
n
n
n
LH 10i , j
HL 10i , j
HH 10i , j
1LE =log LH (i,j)
Cn
1LE =log HL (i,j)
Cn
1LE =log HH (i,j)
Cn
(
(
(
)
)
)
Block Based Enhancement of Satellite Images using Sharpness
Indexed Filtering
Sandeep Mishra1, Radhanath Patra
2, Abanikanta Pattanayak
3,
Subhrajit Pradhan4
14TH Sem, M.Tech, ECE, GIET, Gunupur, Odisha, India; Student Member, IEEE 2Head, M.Tech, ECE, Gandhi Institute of Engineering and Technology, Gunupur, Odisha, India
34TH Sem, M.Tech, ECE, Gandhi Institute of Engineering and Technology, Gunupur, Odisha, India 4Head, Department of ECE, Gandhi Institute of Engineering and Technology, Gunupur, Odisha, India
Abstract: In this paper, a simple and dynamic wavelet-based algorithm is presented for enhancement of the
image sharpness or blurriness of an Image. Four set of methods are followed here (Denoising, Decomposition,
Sharpness Estimation, and Filtering). First Denoising is done on the input images and then it operates by
initially decomposing the input image through a multi-level separable DWT. After this, the log-energies of the
DWT sub bands are computed. A Scalar Index corresponding to the input image’s sharpness is computed
through the weighted average of the computed log-energies. Several Satellite images are taken into
consideration and the Scalar Sharpness Index representing the image’s overall sharpness denoted as SSI. This
is used as a filtering component and the image is filtered out to give the Sharpened Image. Here along with the
Scalar Sharpness Index, a Block based algorithm is presented to determine the local perceived sharpness. The
Block Based Scalar Sharpness Index is calculated by taking the RMS of 0.01 of largest value of the filtering parameter which takes the no. of Block Size. This proposed method is the simplest, fastest and accurate
comparing to the currently best-performing techniques for the sharpness estimation.
Keywords: Blurring, Decomposition, Denoising, DWT, Image Sharpness, Wavelet Decomposition
I. INTRODUCTION Some Sharpness Estimating Algorithms which can automatically predict sharpness or blurriness are
known as sharpness estimators. Such algorithms have been shown to be useful for tasks such as main-subject detection, image quality assessment, and image restoration. Previous methods of sharpness/blurriness estimation
have employed a wide variety of approaches [2], [6], [7]. Blurriness estimation methods operate under the
assumption that edges are affected by blur and accordingly these methods estimate blurriness by using edge-
appearance models [2], [10]. Some other methods used spectral information to estimate sharpness. Hybrid of the
above methods also can be used for measuring sharpness but are complex in computation. In this project, a
simple and dynamic wavelet-based algorithm is presented for estimating the image sharpness or blurriness
globally and locally. First Denoising is done on the input images and then it operates by initially decomposing
the input image through a multi-level separable Discrete Wavelet Transform (DWT) [1], [4]. After this, the log-
energies of the DWT sub bands are computed.
………………………………………..1
………………………………………..2
………………………………………..3
A Scalar Index corresponding to the input image‟s sharpness is computed through the weighted
average of the computed log-energies. Several Satellite images are taken into consideration and the Scalar
Sharpness Index representing the image‟s overall sharpness denoted as SSI. This Image‟s overall sharpness
Index SSI is used as a filtering component and the image is filtered out to give the Sharpened Image. Here along
with the Scalar Sharpness Index representing the image‟s overall sharpness, a Block based algorithm is
presented to determine the local perceived sharpness.
The Block Based Scalar Sharpness Index is calculated by taking the RMS of 0.01 of largest value of SSI which takes the no. of Block Size [9]. It is the most competitive and simple with the currently best-
performing techniques for the sharpness estimation. Along with its simplicity this algorithm is also the fastest
algorithm for almost all the Size of Images. Finally the SSI and Block Based SSI are used as a filter for the
Block Based Enhancement of Satellite Images using Sharpness Indexed Filtering
www.iosrjournals.org 21 | Page
n n n n nHH HL LH LLTLE = W ( LE ) + 0.375 ( 1-W ) ( LE + LE ) + 0.25 ( 1-W ) ( LE )
enhancement of the images. Images in Continuous intervals can be processed through this method and the final
sharpened images are merged together as frames for creating a small video.
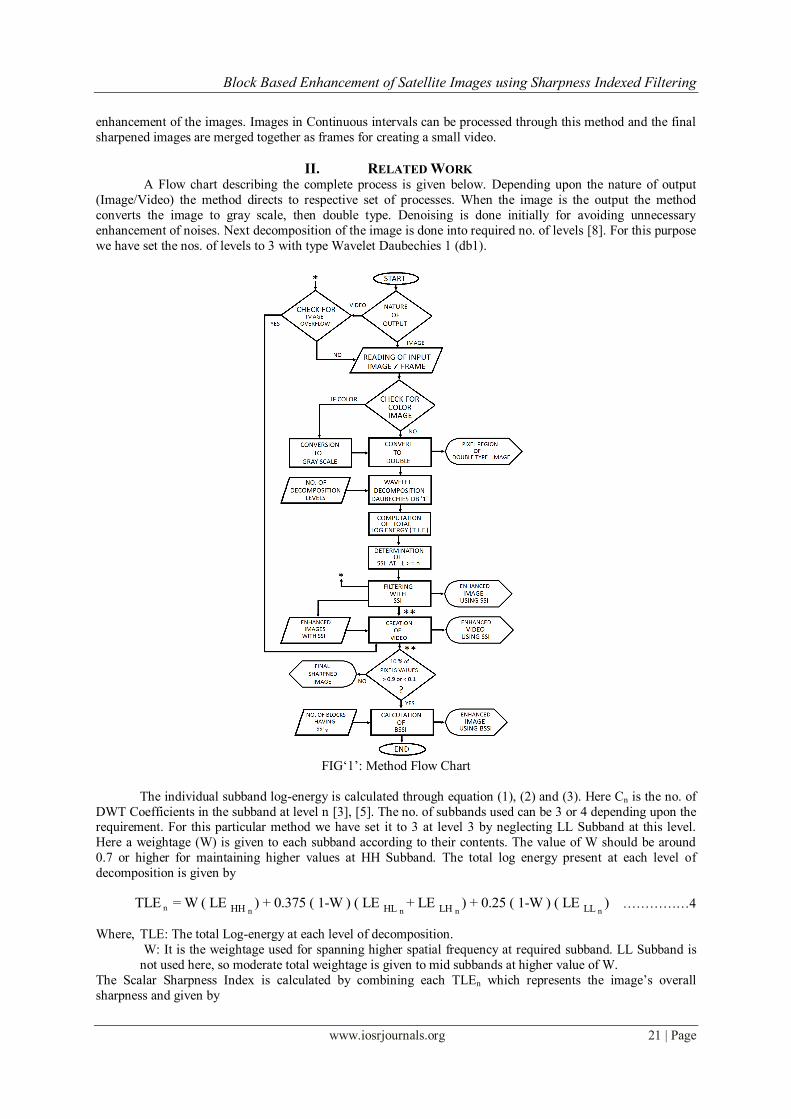
II. RELATED WORK A Flow chart describing the complete process is given below. Depending upon the nature of output
(Image/Video) the method directs to respective set of processes. When the image is the output the method
converts the image to gray scale, then double type. Denoising is done initially for avoiding unnecessary
enhancement of noises. Next decomposition of the image is done into required no. of levels [8]. For this purpose
we have set the nos. of levels to 3 with type Wavelet Daubechies 1 (db1).
FIG„1‟: Method Flow Chart
The individual subband log-energy is calculated through equation (1), (2) and (3). Here Cn is the no. of
DWT Coefficients in the subband at level n [3], [5]. The no. of subbands used can be 3 or 4 depending upon the requirement. For this particular method we have set it to 3 at level 3 by neglecting LL Subband at this level.
Here a weightage (W) is given to each subband according to their contents. The value of W should be around
0.7 or higher for maintaining higher values at HH Subband. The total log energy present at each level of
decomposition is given by
……………4
Where, TLE: The total Log-energy at each level of decomposition.
W: It is the weightage used for spanning higher spatial frequency at required subband. LL Subband is
not used here, so moderate total weightage is given to mid subbands at higher value of W.
The Scalar Sharpness Index is calculated by combining each TLEn which represents the image‟s overall
sharpness and given by

Block Based Enhancement of Satellite Images using Sharpness Indexed Filtering
www.iosrjournals.org 22 | Page
3L-n
nn=1
SSI = 2 TLE ……..………………………………………….5
Where SSI: Scalar Sharpness Index L: A Factor should be equal to or greater than n
n: Nos. of Levels of Decomposition
Now this SSI is used as a Filtering component and is used to enhance the image. The value of SSI is
always greater or equal to 0. The higher values of SSI represent higher sharpness in the image. In case the
output is video, the set of images are continuously enhanced and later are used for creating a video with required
frame rate. 24 f/s is normal standard we can use.
This same technique can be used to enhance each small blocks of the image and the technique is called
block based image enhancement and for this we need to calculate the SSI of each block with a block size of 16 x
16 or 8 x 8. But at the time of the creation of Block map 0.5 of each 1 is overlapped both horizontally and
vertically with neighbor blocks (Fig„2‟). So 16 x 16 will result in 8 x 8 and 8 x 8 will result in 4 x 4 in the input
image. Before applying this technique we should go for the histogram analysis of the entire image for the purpose of tone adjustment. If either less than 0.1 pixels or more than 0.9 pixels strength is not more than 10%,
then the previous image resulted out after the filtering of the image with SSI is the final enhanced image and
block based enhancement is not applied.
FIG„3.1‟: Water Vapour Channel FIG„4.1‟: Cyclone „Helen‟ FIG„5.1‟: Image from Kalpana-1
FIG„2‟: Neighbor Block Overlapping In case of the block based enhancement technique a factor called SSIm is taken into consideration. It is
a factor that defines 0.05 or 5% of the maximum SSI. The total no. of blocks that satisfies the factor SSIm is
denoted as SB and is used in the calculation of the parameter BSSI. Before going to the calculation of BSSI, the
image should be considered as a set of blocks of block size 16 x 16 and then the SSI of each block should be
calculated using the discrete wavelet transformation coefficients of each block.
As the total sharpness of the image/frame is determined by the image/frame‟s sharpest regions, the factor SB is
taken into consideration. The block based scalar sharpness index is determined by
SB2
ii = 1
S = SSI where, 0.5S
BSSI = SB
( ) ………………………………………………6
Like SSI and BSSI can be used for filtering the image to give a enhanced image output.

Block Based Enhancement of Satellite Images using Sharpness Indexed Filtering
www.iosrjournals.org 23 | Page
III. RESULTS Here „3‟ Nos. of images are taken into consideration. First is a random image of a Water Vapour
Channel from IMD. Second one is the satellite image of the Cyclone „Helen‟ from Naval Research Lab. Third is
one of the most recent satellite images from Kalpana-1 satellite. The original images, enhanced images after
filtering with the factor BSSI and one of the small area of each of the enhanced images are presented below.
FIG„3.2‟: Filtered BSSI of Water Vapour Channel FIG„3.3‟: Selected Area of Fig „3.2‟
In the Figure „3.2‟ the block based Scalar Sharpness Index (BSSI) of the original image has been used
as the filtering parameter and the original image is filtered out to give the enhanced image. A small area is
selected from the image near to Vijayawada area and is shown in Figure„3.3‟. It is easy to identify the exact locations from this image where more vapours are present. The only problem is to differenciate the border area
from required area if vapours are present above it, but this happens in very good weather conditions.
FIG„4.2‟: Filtered BSSI of Cyclone „Helen‟ FIG„4.3‟: Selected Area of Fig „4.2‟
In the Figure „4.2‟ the BSSI of a Satellite image from Naval Research Lab (Showing Rain Rate
(inches/hour)) is used for filtering the image. Again a small area is selected from the image near to a random
area and is shown in Figure„4.3‟. It is a bit complex to find the exact locations from this image, but from the
Geographical Coordinates easily the area can be identified.
FIG„5.2‟: Filtered BSSI of image from Kalpana-1 FIG„5.3‟: Selected Area of Fig „5.2‟

Block Based Enhancement of Satellite Images using Sharpness Indexed Filtering
www.iosrjournals.org 24 | Page
In the Figure „5.2‟ the Filtered BSSI of an image on 8-12-2013 from Kalpana-1 is shown and a small
area near not Patna is shown in Figure„5.3‟. It is clear that vapours are present in a bulk amount near to Odisha
and AP Regions and the exact locations can be identified using the Coordinates. All the above three images are converted to gray scale and then type double for faster processing and analysis.
IV. CONCLUSION For the enhancement of Satellite images a Simple, Fast and Dynamic four set algorithm (Denoising,
Decomposition, Sharpness Estimation, and Filtering) is presented. A Scalar Index corresponding to the input
image‟s sharpness is computed through the weighted average of the computed log-energies after decomposition.
Several Satellite images are taken into consideration and the Scalar Sharpness Index (SSI) representing the
image‟s overall sharpness is computed. This is used as a filtering component and the image is filtered out to give
the Sharpened Image. Here along with the Scalar Sharpness Index, a Block based algorithm is presented (BSSI) determine the block based sharpness and after filtering this with the image results are presented. From the
results it is easy to identify the areas with corresponding vapour amounts and if Geographical Coordinates are
available then it is simple for analysis in bulk vapour regions.
REFERENCES [1] Jean-Luc Starck, Jalal Fadili, and Fionn Murtagh, "The Undecimated Wavelet Decomposition and its Reconstruction", IEEE
Transactions on Image Processing, Vol. 16, no. 2, Feb. 2007
[2] C. T. Vu, T. D. Phan, and D. M. Chandler, "A spectral and spatial measure of local perceived sharpness in natural images”, IEEE
Trans. On Image Process., vol. 21, no. 3, Mar. 2012.
[3] N. Zhang, A. E. Vladar, M. T. Postek, and B. Larrabee, “A kurtosisbased statistical measure for two-dimensional processes and its
application to image sharpness”, in Sect. Phys. Eng. Sci. Amer. Statist. Soc., 2003.
[4] R. Ferzli, L. J. Karam, and J. Caviedes, “A robust image sharpness metric based on kurtosis measurement of wavelet coefficients”,
in Int. Workshop on Video Processing and Quality Metrics for Consumer Electronics, Jan. 2005.
[5] H. Tong, M. Li, H. Zhang, and C. Zhang, “Blur detection for digital images using wavelet transform”, in IEEE Int. Conf.
Multimedia and Expo, ICME 2004,Vol. 1, Jun. 2004.
[6] Sandeep Mishra, Abanikanta Pattanayak et. Al, "Adaptive Motion Detection for Image Deblurring in RTS Controller",
International Journal of Innovative Research in Science, Engineering & Technology, Vol. 2, Issue 6 , June 2013.
[7] M. J. Chen and A. C. Bovik, “No-reference image blur assessment using multiscale gradient”, in Int. Workshop on Quality of
Multimedia Experience, QoMEx, Jul. 2009.
[8] A. Cohen, I. Daubechies, and J.-C. Feauveau, “Biorthogonal bases of compactly supported wavelets”, Commun. Pure Appl. Math.,
vol. 45, Jun. 1992.
[9] Phong V. Vu and Damon M. Chandler, "A Fast Wavelet-Based Algorithm for Global and Local Image Sharpness Estimation",
IEEE Signal Processing Letters, Vol. 19, no. 7, July 2012.
[10] H. W. Park and H. S. Kim, “Motion estimation using low-band-shift method for wavelet-based moving-picture coding”, IEEE
Trans. Image Process., vol. 9, no. 4, Apr. 2000.