blind estimation of a feature-domain reverberation … estimation of a feature-domain reverberation...
TRANSCRIPT

BLIND ESTIMATION OF A FEATURE-DOMAIN REVERBERATION MODELIN NON-DIFFUSE ENVIRONMENTS WITH VARIANCE ADJUSTMENT
Jimi Y. C. Wen1, Armin Sehr2, Patrick A. Naylor1 and Walter Kellermann2
1Department of EEEImperial College, London, UK
{yung.wen,p.naylor}@imperial.ac.uk
2Multimedia Communications and Signal ProcessingUniversity of Erlangen-Nuremberg, Germany
{sehr,wk}@LNT.de
ABSTRACT
Blind estimation of a two-slope feature-domain reverbera-tion model is proposed. The reverberation model is suit-able for robust distant-talking automatic speech recognitionapproaches which use a convolution in the feature domainto characterize the reverberant feature vector sequence, e.g.[1, 2, 3]. Since the model describes the reverberation by amatrix-valued IID Gaussian random process, its statisticalproperties are completely captured by its mean and variancematrices. The suggested solution for the estimation of themodel includes two novel features based on the study of sim-ulated rooms: 1) a solution for blindly determining a two-slope decay model from a single-slope estimate; 2) a variancemask to improve the estimation of the variance matrix. Usingthe proposed solution, the reverberation model can be esti-mated during recognition without the need of pre-training orusing calibration utterances with known transcription. Con-nected digit recognition experiments using [3] show that thereverberation models estimated by the proposed approachsignificantly outperform HMM-based recognizers trained onreverberant data in most environments.
1. INTRODUCTIONDistant-talking speech capture can increase the comfortand the acceptance of many Automatic Speech Recognition(ASR) applications, like e.g. automatic meeting transcrip-tion, voice control of consumer electronics, and dictationsystems. However, the reverberation caused by multi-pathpropagation of sound waves from the source to the distant-talking microphone leads to a mismatch between the inpututterances and the acoustic model of the recognizer, usu-ally trained on close-talking speech. Therefore, the perfor-mance of ASR systems is significantly reduced by reverber-ation [4, 5] if no countermeasures are taken.
In the time domain, reverberant speech can be describedby a convolution of clean speech with the Room ImpulseResponse (RIR) characterizing the acoustic path from thespeaker to the microphone. The length of the RIR, typicallyranging from 200 ms to 1000 ms, significantly exceeds thelength of the analysis window used for feature extraction inASR systems, typically ranging from 10 ms to 40 ms. There-fore, the time-domain convolution is not transformed into asimple multiplication in the short-time frequency transform(STFT) domain. Instead, reverberation still has a dispersiveeffect in the STFT domain and also in STFT-based featuredomains. To capture this dispersive effect, a convolution ofthe clean-speech feature vectors with a feature-domain re-verberation representation in the mel-spectral (melspec) do-main has been proposed in several recent publications, e.g.[1, 2, 3].
Blind estimation of a statistical feature-domain ReVer-beration Model (RVM) [3] which can be employed in vir-tually all robust distant-talking ASR concepts based on themelspec convolution described above, is proposed. Sincethe RVM describes the reverberation by a matrix-valued IIDGaussian random process, its statistical properties are com-pletely captured by its mean and variance matrices. While aset of known RIRs in [3], simultaneous recordings of close-talking and distant-talking microphones in [6], and calibra-tion utterances with known transcriptions in [1, 7, 8] are re-quired for estimating the reverberation representation, theproposed approach can estimate the RVM blindly duringrecognition. Thus, the flexibility of the robust distant talkingASR approaches according to [1, 2, 3] can be significantlyimproved.
The suggested solution includes two new features basedon the study of simulated rooms: firstly, a blind solution fordetermining a two-slope decay model from a single-slope es-timate; secondly, a variance mask to improve the estimationof the RVM’s variance matrix. Using the proposed solution,the reverberation model can be estimated during recognitionwithout the need of pre-training or using transcribed cali-bration utterances. The paper is structured as follows: Theunderlying algorithms are concisely reviewed in Sec. 2 fol-lowed by the description of the blind approach and the vari-ance mask in Sec. 3 and Sec. 4, respectively. The perfor-mance of the proposed approach is evaluated by connecteddigit recognition experiments based on the concept of [3] inSec. 5, and conclusions are drawn in Sec. 6.
2. REVIEW OF UNDERLYING ALGORITHMS
2.1 Statistical RVMThe statistical RVM η used in this contribution has been in-troduced in [3]. It can be considered as a feature-domainrepresentation of all possible RIRs for arbitrary speaker andmicrophone positions in a certain room. The RVM exhibitsa matrix structure where each row corresponds to a certainmel channel and each column to a certain frame as shown inFig. 1(a). Each matrix element is modeled by a Gaussian In-dependent Identically Distributed (IID) random process. Forsimplicity, the elements are assumed to be mutually statis-tically independent [3]. Thus, the RVM is completely de-scribed by its mean matrix mH and its variance matrix σ2
H.
2.2 Blind Estimation of ReverberationIn [9], a method for blind estimation of reverberation timebased on the distribution of signal decay rates is presentedand its accurate performance for ‘diffuse RIRs’, that is, forRIRs exhibiting a single exponential decay, is shown. The
17th European Signal Processing Conference (EUSIPCO 2009) Glasgow, Scotland, August 24-28, 2009
© EURASIP, 2009 175

! " #! #" $!!%!
!&!
!$!
!#!
!
'()*+,-.*/0*123+4.56
476
+
+4(6
4((6!e
"
!l
tm
!"# $%&''"# l
!"#"!$"!%&'() *!%+"m
!"#
Figure 1: (a) Reverberation model η for observation frame n. (b)Two-slope decay model (i) and its single-slope estimate (ii).
decay rate is defined as the gradient of the first order linearleast squares fit.
The estimated probability density function (pdf) of thedecay rate of a reverberant speech signal in the STFT log-magnitude domain, λx, becomes increasingly ‘skewed’ as thedecay rate decreases or equivalently as the reverberation timeT60 increases [9]. Thus, the ‘skewness’ of the estimated pdfcan be used to estimate the decay rate of the RIR envelope.As a measure for the ‘skewness’ of the random variable λx,the negative-side variance σ2
X− is proposed in [9] becauseof its superior properties compared to the third-order centralmoment.
A second-order function is used in [9] to map the ob-served σ2
X− , obtained from the reverberant speech decay ratedistribution, to the estimated single-slope room decay rate α .In this contribution, a more generic mapping function for theestimation of the room decay α according to
α =4
∑r=0
γr(σ2X−)
r (1)
is used. The parameters (γr) of the mapping function are ob-tained in [9] by using Polack’s statistical reverberation model[10] and two speech fragments consisting of one male andone female sentence.
2.3 Late Decay AdjustmentRIRs obtained in real-world rooms are not ‘diffuse’ since‘diffuse’ RIRs require an infinite source-microphone dis-tance. Non-perfectly diffuse sound fields exhibit a faster de-cay for the early segment corresponding to the direct soundand early reflections, and a slower decay for the late reverber-ation [11, 12]. Therefore, a two-slope RVM extended fromPollack’s time-domain model [10] is used in [8] to capturethe non-diffuse RIRs as depicted in Fig. 1(b). In the earlysegment of the two-slope model, extending from time indexone to the mixing time tm, the envelope decreases with theearly decay rate λe. In the late segment, starting at tm, theenvelope decreases with the late decay rate λl . Given an esti-mate for the single-slope decay, α , determined according to[9] and an estimate for the early decay λe determined fromthe ML estimate according to [7], an estimate of the late de-cay λl is obtained by linear least squares adjustment in [8].
3. BLIND DECAY ADJUSTMENT
Since the late decay adjustment according to [8] describedabove uses the ML approach of [7] for estimating the early
decay rate, calibration utterances with known transcriptionare necessary for the determination of the RVM. In this sec-tion, a blind approach for the adjustment of the late decay isintroduced which does not require pre-transcribed calibrationutterances.
Let λ ∗e be the early decay rate when the source-mic dis-tance is greater than the critical distance, where the super-script ∗ indicates that the microphone is located in the dif-fuse sound field. In this case, a fixed ratio between λ ∗e andλl is assumed for simplicity. Thus, the single-slope decaycan be estimated by linear least squares optimization from Nobservations as (see [8] for a derivation)
αmax ≈ γλ∗e g1(N, tm)− γλlg2(N, tm), (2)
where γ = (N3−N) and
g1(N, tm) = −tm(tm−1)(2tm−1−3N) (3)g2(N, tm) = −(2tm−1+N)(tm−N)(tm−1−N). (4)
The mixing time tm is assumed to be 50 ms [13] so that thevalues of g1, g2 and γ can be pre-calculated. If we assumea fixed ratio such that λ ∗e = ϖλl , where ϖ is determined inSection 4, we can estimate λl as
λl ≈αmax
ϖγg1(N, tm)− γg2(N, tm). (5)
We first estimate an STFT-domain representation H(1)(m,k)of the RIR (m being the reverberation frame index and k in-dexing the frequency bins) using the single-slope method of[9]. To increase the robustness of the frequency-dependentdecay estimates, a rectangular window is used to smoothacross the frequency bins k of H(1)(m,k). Then the earlyand late decays are estimated using (5) to obtain a two-slopeadjustment H(2)(m,k) in the STFT-domain. Since α is an es-timate, and both tm and ϖ are assumed constant, a particularadjustment may exhibit a significant estimation error. There-fore, smoothing across k is performed according to
H(3)(m,k) = ξ H((2)m,k)+(1−ξ )E[H(2)(m,k)]k (6)
to get a smoothed STFT-domain RIR representation, whereξ is the smoothing parameter and E[]k denotes the expec-tation across frequency bins k. Transforming H(3)(m,k) tothe melspec domain, we obtain the melspec RIR representa-tion Hmel(m, l), where l is the mel channel index. The meanmatrix mH of the RVM is calculated by averaging over theestimates Hmel(m, l) obtained for several utterances.
For the estimation of the variance matrix σ2H, a heuristic
approach is used in [8]. Based on a comparison of the meanmatrix and the variance matrix of the RVMs according to [3],an estimate σ2
H = m2H of the variance matrix is obtained by
calculating the element-wise square of the mean matrix.
4. VARIANCE MASK
An in-depth investigation of the relationship between theheuristic variance estimate σ2
H = m2H according to [8] and
the reference variance estimate σ2H according to [3] shows
some systematic dependencies which can be used to improvethe estimate σ2
H. Therefore, we propose a variance mask,ς2H, to map σ2
H as close as possible to σ2H in the form of
176

r
L
!
!d
d
T60
Figure 2: Simulation setup of different room acoustics parametersusing the image method of [14].
σ2H
.= ς2H⊗ σ
2H = ς
2H⊗m2
H
!≈ σ2H (7)
where ⊗ denotes the Hadamard product. Taking the naturallogarithm of each matrix element, we get
ln σ2H = lnς
2H + lnm2
H. (8)
To determine the parameters of the variance mask, the re-lations between the characteristics of the variance maskand room acoustic properties are studied. The influ-ence of the following acoustic parameters is investigated:i) source-mic distance d = 1 . . .4 m, ii) reverberation timeT60 = 0.2 . . .1.0 s, iii) room size L = 120 . . .320 m3 and iv)source-microphone position r relative to the room. For eachof the parameters ii), iii), and iv), a set of RIRs with fixedparameter i) on a semi-circle as illustrated in Fig. 2 is gen-erated using the image method [14]. Each set consists of 20RIRs determined for different microphone positions (θ ) on asemi-circle. Based on the sets of RIRs, the reference valuesof σ2
H and m2H are calculated according to [3].
Two observations are made regarding the characteris-tics of the variance mask for the individual matrix elements(m, l): Firstly, σ2
H(m, l) overestimates the reference varianceσ2
H(m, l) in the first frame m = 1, i.e., the variance maskshould be negative for m = 1. The overestimation is mainlydue to the nearly constant direct component dominating thefirst frame. Secondly, there is an increasing overestimationof the reference variance σ2
H(m, l) by σ2H(m, l) for increasing
mel-channel index, i.e., the variance mask should be decreas-ing with increasing frequency. A possible explanation forthis observation could be that for increasing frequency, thedensity of the normal modes increases according to statisti-cal room acoustics [13]. Since this means averaging over ahigher number of modes for high frequencies, the varianceof the feature domain RIR representation due to positionchanges decreases with frequency. Therefore, we proposethe following variance mask with ρ and ϕ as parameters:
lnς2H(m, l) =
ρ for m = 1 , l = 1, . . . ,24,
0 for m > 1, l = 1 . . .4,
ϕ(m−4) for m > 1, l = 5 . . .24.
(9)
The proposed variance mask has the shape characteristicsshown in Fig. 3(d). Since the image method is known to berelatively inaccurate for lower frequencies [14], we set thefirst four mel channels of the variance mask lnς2
H to zero.Minimising the error between the reference σ2
H and the es-
! " # $!%
!&
!'
!$
!#
!"
(
)*+,-.!/0-120)345-.
647
1
1
8&9:9;"
8&9:9;$
8&9:9;&
8&9:9;<
8&9:!;9
! " # $!9;"
!9;!'
!9;!
!9;9'
=
)*+,-.!/0-120)345-.
6>7
9 " $ &9
9;9"
9;9$
9;9&
9;9<
9;!
9;!"6-7
?
@--+,45-.
!9
"9
#9
'!9
!'"9
!#
!"
!!
9
A
627
B
C4,045-.1B4)D
ml
! !
!Figure 3: Mean optimised parameters (a) ρ and (b) ϕ for differentsource-mic distances and different reverberation times for the two-parameter variance mask model. (c) Histogram of ϖ averaged overall frequencies. (d) Variance mask lnς2
H for optimal ρ and ϕ .
timate σ2H based on the two-parameter variance mask with
respect to ρ and ϕ according to
minρ,ϕ{‖σ2
H− σ2H‖2}, (10)
where ‖ · ‖2 denotes the spectral norm, we obtain the param-eters ρ and ϕ . In Fig. 3 (a) and (b), optimised parametersρ and ϕ for different source-microphone distances and re-verberation times are shown. For each source-microphonedistance and reverberation time, the mean and the varianceacross five different room sizes and five relative positionsare determined. We see that the source-mic distance dom-inates the term ρ while the reverberation time only slightlyaffects it. The variation of the parameter ϕ with respect to thesource-mic distance increases with increasing reverberationtime.
For the intended applications, like meeting transcriptionor voice control of consumer electronics, we assume an aver-age reverberation time of T60 = 0.6 s and an average source-mic distance of d = 2.5 m to select the optimum values ofthe parameters ρ and ϕ . Connected digit recognition tests in[15] indicate that overestimation of the reverberation by theRVM is less detrimental than underestimation. Since largervalues of ϖ cause the adjusted late decay to be slower, weselect ϖ = 3 corresponding to the 0.9-percentile of the ϖ
values found in the image method rooms shown in Fig. 3(c).A hard decision at the 0.9-percentile ensures most of the de-cays are adjusted with slight overestimation of the late decay,and only a few decays with underestimation.
5. EXPERIMENTS
Experiments with the same connected-digit recognition taskas used in [3, 7, 8] are carried out to analyze the performanceof the reverberation models determined according to Sec. 3and 4. For recognition, the approach of [3] is used.
5.1 Experimental SetupIn real-world applications, the proposed approach can beused as follows. If the recognizer is to be used in a new
177

-IVM 20 50 70
-4.0 dBSRR -4.0 dB4.0 dB
2.0 md 4 m4.1 m
300 ms
Room B
Type Lab
900 ms
Studio
700 ms
Lecture Room
Room CRoom A(a)
T60
-
69.0
61.0
61.7
-
-
56.7
-
53.9
63.4
58.5-
13.4
VII
-
63.0
--
-
71.7
77.5
60.4
25.9
67.7
75.9 75.8
51.5
-
-
56.5
-
49.3
67.7
-
82.0
66.3
62.2
66.8
(b)
- 46.0
VarianceModel
67.4
II
N/A
77.6
57.3
I
75.0
-
71.6
CleanData
-
VI
62.7-
68.178.3
73.576.1
III 71.6 67.6
59.8
V
74.5
44.8
54.6
35.1
78.1
Room
A B C
!2H !2
H!2H!2
H !2H !2
H!2H !2
H !2H
-
- Variance Mask
Blind Approach
76.4 62.9 54.9 31.4 60.6 39.467.2 32.0 45.3
Table 1: (a) Room Characteristics. (b) Word accuracies in % for the conventional HMM-based recognizer trained on (I) clean and (II)reverberant speech. The ASR concept of [3] with the RVMs estimated according to (III) [3],(IV) single-slope approach, (V) [7], (VI) [8]and (VII) Sec. 3. Three variance models are used in connection with the five different mH estimation methods (III)-(VII): σ2
H-variance ofthe RVM is estimated according to [3]; σ2
H-using m2H; σ2
H- according to Sec. 4 (7).
room, the first utterance to be recognized is used to deter-mine a melspec RIR representation according to Sec. 3. Aninitial estimate of the RVM is obtained from this single RIRrepresentation, and the recognition is started. As soon as thenext utterances are available, they are used to estimate mel-spec RIR representations, which are used to update the initialRVM. For the following tests, the first seven utterances areused for averaging the RVM, then it is fixed for the follow-ing 505 test utterances. Alternatively, a recursive smoothingover melspec RIR representations could be used. Thus thealgorithm could even adjust the RVM when the user movesto another room.
Static melspec features with 24 mel channels calculatedfrom speech data sampled at 20 kHz are used. 16-state word-level HMMs with single Gaussian densities serve as clean-speech models. To obtain the reverberant test data, the clean-speech TI digits data are convolved with different RIRs mea-sured at different LS-mic positions in three rooms with thecharacteristics given in Table 1(a). Each test utterance isconvolved with an RIR selected randomly from a numberof measured RIRs in order to simulate changes of the RIRduring recognition. Before convolution, the RIRs are nor-malized to have unit energy in the melspec domain. Thisnormalization corresponds to using automatic gain controlas preprocessing in the ASR system.
To maintain a strict separation of the training data fromthe test data in all experiments, RIRs generated with the im-age method are used for determining the fixed parameterswhile the tests are performed in room A, B and C (see Ta-ble 1(a)). Comparing the closeness of the melspec RIR repre-sentation Hmel(m, l) to the mean matrix of the RVM obtainedby averaging over the image method RIRs (see Sec. 4), thesmoothing parameters ξ were chosen as 0.1 for a trade-offbetween frequency characteristics capture and outlier robust-ness.
5.2 Variance AdjustmentTable 1(b) shows the results of the experiments. The resultsobtained with the variance estimate σ2
H based on the maskaccording to Sec. 4 are highlighted in the table with cyanbackground colour. Regardless of the estimation method for
! " #! #" $! $" %!!&!
!'!
!(!
!"!
!)!
!%!
!$!
!#!
!
*+,-./01,-
2-314
.
.*05-
6+789-!69:;-
*<:!69:;-
Figure 4: Comparison of the true decay for room C, averagedacross all mel channels, with the decay of the corresponding single-slope and two-slope models.
determining the mean matrix mH, using the variance estimateσ2H significantly improves the word accuracy over the heuris-
tic estimate σ2H. Using σ2
H in connection with the meansestimated according to [3] (III) even outperforms the vari-ance estimate σ2
H based on measured RIRs in rooms B and C.In general, the gain of applying the variance mask increaseswith the accuracy of the mH estimate. For example, compar-ing the estimation methods (III) and (VI) in room C, there isa significant difference in the word accuracy for the varianceestimate σ2
H, while the variance estimate σ2H achieves simi-
lar word accuracies for the estimation methods (III) and (VI).The difference in word accuracy for σ2
H can be attributed tothe slightly more inaccurate mean estimate of (VI). The re-sults for the variance estimate σ2
H based on measured RIRsin connection with the RVM estimation approaches (IV) -(VII) are only given for comparison. In real-world applica-tions, they are only available if the RVM estimation method(III) is used. The relatively low accuracy of 35.1% for (V)in connection with σ2
H is due to the mismatch between thevariance matrix σ2
H and the mean matrix mH for this case.
5.3 Blind EstimationFig. 4 compares the true decay for room C averaged acrossall mel channels with the decay of the corresponding single-slope and two-slope models. It is clearly obvious that the
178
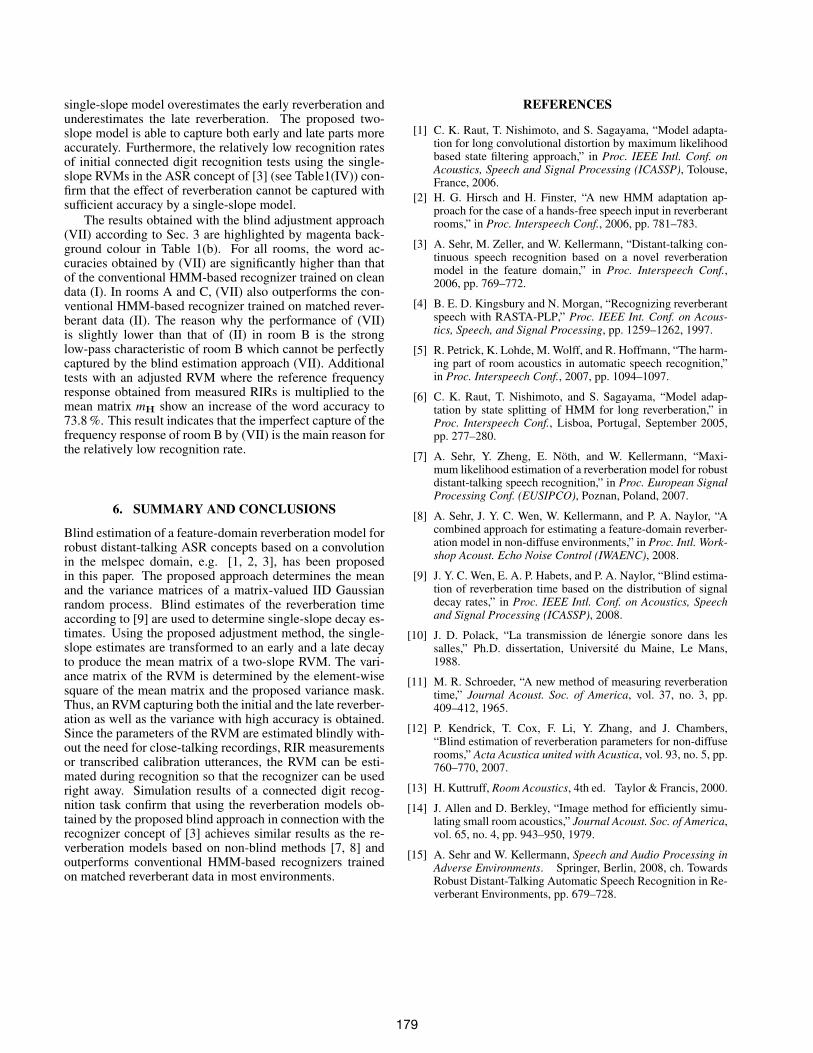
single-slope model overestimates the early reverberation andunderestimates the late reverberation. The proposed two-slope model is able to capture both early and late parts moreaccurately. Furthermore, the relatively low recognition ratesof initial connected digit recognition tests using the single-slope RVMs in the ASR concept of [3] (see Table1(IV)) con-firm that the effect of reverberation cannot be captured withsufficient accuracy by a single-slope model.
The results obtained with the blind adjustment approach(VII) according to Sec. 3 are highlighted by magenta back-ground colour in Table 1(b). For all rooms, the word ac-curacies obtained by (VII) are significantly higher than thatof the conventional HMM-based recognizer trained on cleandata (I). In rooms A and C, (VII) also outperforms the con-ventional HMM-based recognizer trained on matched rever-berant data (II). The reason why the performance of (VII)is slightly lower than that of (II) in room B is the stronglow-pass characteristic of room B which cannot be perfectlycaptured by the blind estimation approach (VII). Additionaltests with an adjusted RVM where the reference frequencyresponse obtained from measured RIRs is multiplied to themean matrix mH show an increase of the word accuracy to73.8 %. This result indicates that the imperfect capture of thefrequency response of room B by (VII) is the main reason forthe relatively low recognition rate.
6. SUMMARY AND CONCLUSIONS
Blind estimation of a feature-domain reverberation model forrobust distant-talking ASR concepts based on a convolutionin the melspec domain, e.g. [1, 2, 3], has been proposedin this paper. The proposed approach determines the meanand the variance matrices of a matrix-valued IID Gaussianrandom process. Blind estimates of the reverberation timeaccording to [9] are used to determine single-slope decay es-timates. Using the proposed adjustment method, the single-slope estimates are transformed to an early and a late decayto produce the mean matrix of a two-slope RVM. The vari-ance matrix of the RVM is determined by the element-wisesquare of the mean matrix and the proposed variance mask.Thus, an RVM capturing both the initial and the late reverber-ation as well as the variance with high accuracy is obtained.Since the parameters of the RVM are estimated blindly with-out the need for close-talking recordings, RIR measurementsor transcribed calibration utterances, the RVM can be esti-mated during recognition so that the recognizer can be usedright away. Simulation results of a connected digit recog-nition task confirm that using the reverberation models ob-tained by the proposed blind approach in connection with therecognizer concept of [3] achieves similar results as the re-verberation models based on non-blind methods [7, 8] andoutperforms conventional HMM-based recognizers trainedon matched reverberant data in most environments.
REFERENCES
[1] C. K. Raut, T. Nishimoto, and S. Sagayama, “Model adapta-tion for long convolutional distortion by maximum likelihoodbased state filtering approach,” in Proc. IEEE Intl. Conf. onAcoustics, Speech and Signal Processing (ICASSP), Tolouse,France, 2006.
[2] H. G. Hirsch and H. Finster, “A new HMM adaptation ap-proach for the case of a hands-free speech input in reverberantrooms,” in Proc. Interspeech Conf., 2006, pp. 781–783.
[3] A. Sehr, M. Zeller, and W. Kellermann, “Distant-talking con-tinuous speech recognition based on a novel reverberationmodel in the feature domain,” in Proc. Interspeech Conf.,2006, pp. 769–772.
[4] B. E. D. Kingsbury and N. Morgan, “Recognizing reverberantspeech with RASTA-PLP,” Proc. IEEE Int. Conf. on Acous-tics, Speech, and Signal Processing, pp. 1259–1262, 1997.
[5] R. Petrick, K. Lohde, M. Wolff, and R. Hoffmann, “The harm-ing part of room acoustics in automatic speech recognition,”in Proc. Interspeech Conf., 2007, pp. 1094–1097.
[6] C. K. Raut, T. Nishimoto, and S. Sagayama, “Model adap-tation by state splitting of HMM for long reverberation,” inProc. Interspeech Conf., Lisboa, Portugal, September 2005,pp. 277–280.
[7] A. Sehr, Y. Zheng, E. Noth, and W. Kellermann, “Maxi-mum likelihood estimation of a reverberation model for robustdistant-talking speech recognition,” in Proc. European SignalProcessing Conf. (EUSIPCO), Poznan, Poland, 2007.
[8] A. Sehr, J. Y. C. Wen, W. Kellermann, and P. A. Naylor, “Acombined approach for estimating a feature-domain reverber-ation model in non-diffuse environments,” in Proc. Intl. Work-shop Acoust. Echo Noise Control (IWAENC), 2008.
[9] J. Y. C. Wen, E. A. P. Habets, and P. A. Naylor, “Blind estima-tion of reverberation time based on the distribution of signaldecay rates,” in Proc. IEEE Intl. Conf. on Acoustics, Speechand Signal Processing (ICASSP), 2008.
[10] J. D. Polack, “La transmission de lenergie sonore dans lessalles,” Ph.D. dissertation, Universite du Maine, Le Mans,1988.
[11] M. R. Schroeder, “A new method of measuring reverberationtime,” Journal Acoust. Soc. of America, vol. 37, no. 3, pp.409–412, 1965.
[12] P. Kendrick, T. Cox, F. Li, Y. Zhang, and J. Chambers,“Blind estimation of reverberation parameters for non-diffuserooms,” Acta Acustica united with Acustica, vol. 93, no. 5, pp.760–770, 2007.
[13] H. Kuttruff, Room Acoustics, 4th ed. Taylor & Francis, 2000.
[14] J. Allen and D. Berkley, “Image method for efficiently simu-lating small room acoustics,” Journal Acoust. Soc. of America,vol. 65, no. 4, pp. 943–950, 1979.
[15] A. Sehr and W. Kellermann, Speech and Audio Processing inAdverse Environments. Springer, Berlin, 2008, ch. TowardsRobust Distant-Talking Automatic Speech Recognition in Re-verberant Environments, pp. 679–728.
179