blazing sunspots activity - national optical · you and your students could study within the ......
TRANSCRIPT

TLRBSE Blazing Sunspot Activity 1
OVERVIEW Blazing Sunspots
An Analog Example of a TLRBSE Research Project Project Description In this activity, you will examine the life cycle of a sunspot group by measuring their size (area) over time. Do sunspot groups grow at a steady rate? Does their size diminish at the same rate as their growth? Is there a mathematical function that describes a sunspots life cycle? Is the “lifetime” of a sunspot group constant, or does it vary according to initial size or position on the disk of the sun? These are a few of the possible questions you and your students could study within the parameters of the Blazing Sunspot research activity. Introduction Understanding solar activity is important because we know the Earth is affected by both solar flares and the behavior of sunspots. Solar flares emit high-speed particles that cause aurorae, known in the Northern Hemisphere as Northern Lights. From the ground, auroras appear as shimmering curtains of red and green light in the sky. Particles from solar flares can also disrupt radio communication, and the radiation from the flares can give passengers in airplanes a dose of radiation equivalent to a medical X-ray. Sunspots may have a long-term connection with the Earth’s climate. For example, scientists are currently debating whether ice ages on Earth are related to the Sun having fewer sunspots than usual. Whether or not today’s global warming is also a result of increased solar activity is uncertain. By comparing the sunspot cycle to observed patterns on Earth (e.g., patterns in the weather), you can test theories that link the Sun’s activity to the Earth.) Description of the Data Observations of the sun are made daily with the Kitt Peak Vacuum Telescope (KPVT), located on Kitt Peak in southern Arizona. An image of the sun is focused on the slit of a spectrograph. A CCD camera located at the focal plane of the spectrograph is positioned to produce images at three specific wavelengths. The telescope scans the entire solar disk in four passes, completing the process in about an hour. In the images, North is up and East is to the left. The data used in this exercise are intensity (int) images. They show the brightness of the photosphere at a wavelength of 8688Å, which corresponds to a spectral line of neutral Iron (FeI). These images approximate the visual intensity of the sun’s surface in the red part of the spectrum. The original 1788 x 1788-pixel images have been subsampled to 984 x 984-pixels (one-quarter resolution). Normally, the disk of the sun appears brightest in the center and darkens near the limb (outer edge). These images have been processed to remove limb darkening and streaks.
TLRBSE Blazing Sunspot Activity 2
Materials Usually, this research activity is done with NIH/Scion Image, a freeware image processing program. In our analog activity, you will need: Blazing Sunspot handouts solar image set graph paper transparency overhead pen
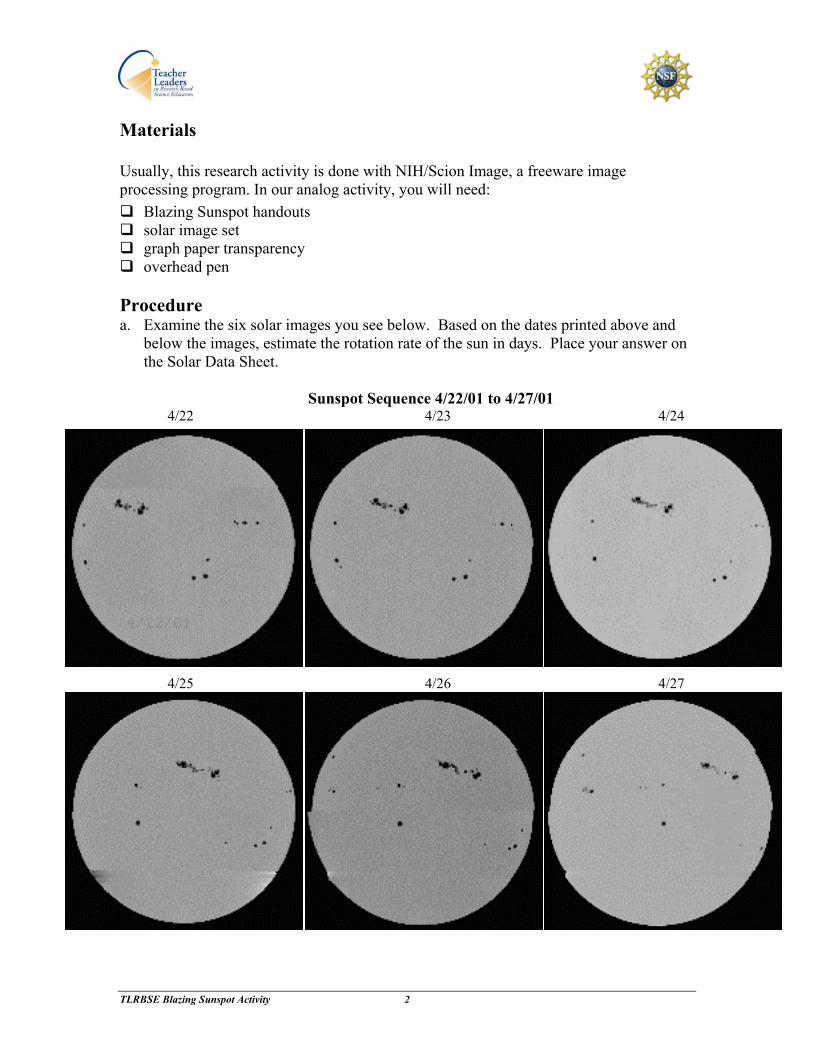
Procedure a. Examine the six solar images you see below. Based on the dates printed above and
below the images, estimate the rotation rate of the sun in days. Place your answer on the Solar Data Sheet.
Sunspot Sequence 4/22/01 to 4/27/01
4/22 4/23 4/24
4/25 4/26 4/27

TLRBSE Blazing Sunspot Activity 3
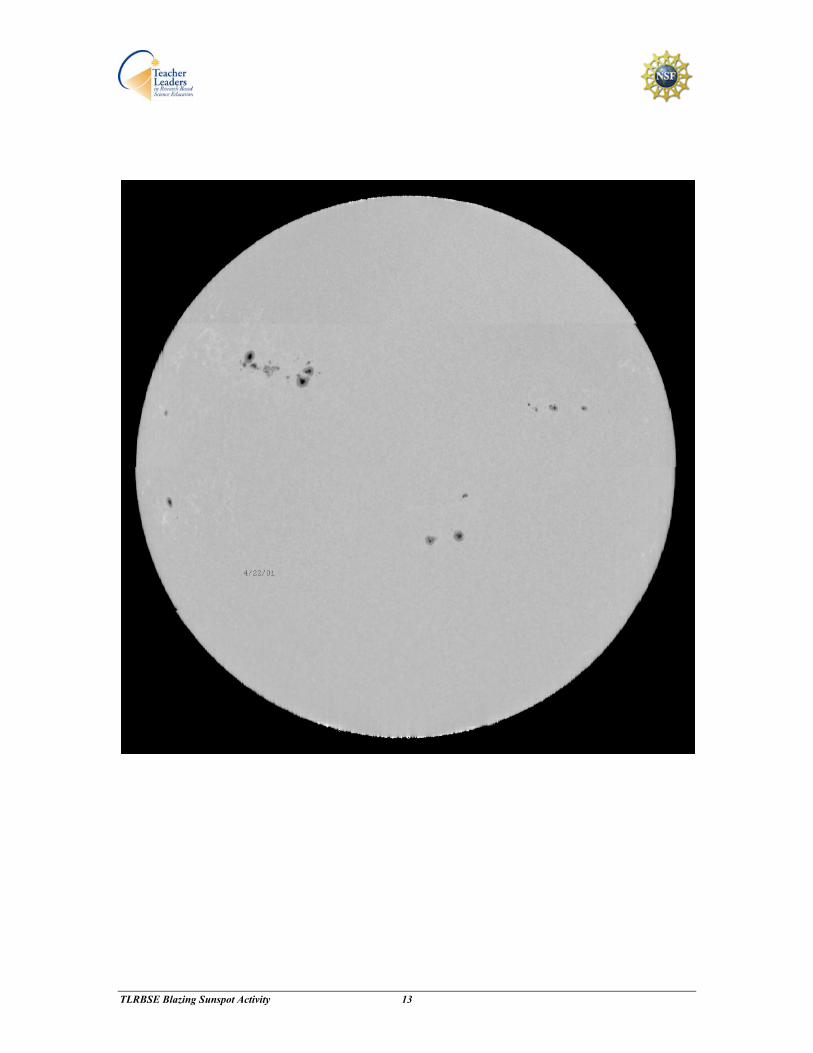
b. An important indicator of solar activity is the total number of sunspots that appear on the solar disk. Solar scientists use the Wolf Equation to calculate the daily sunspot number or index (see teacher notes for a more detailed explanation). It is based on both the number of sunspots and the number of sunspot groups: Calculate the sunspot index on 4/22/01 using the full disk image in your solar image set.
Sunspot Index = 10(# of groups) + (# of spots)
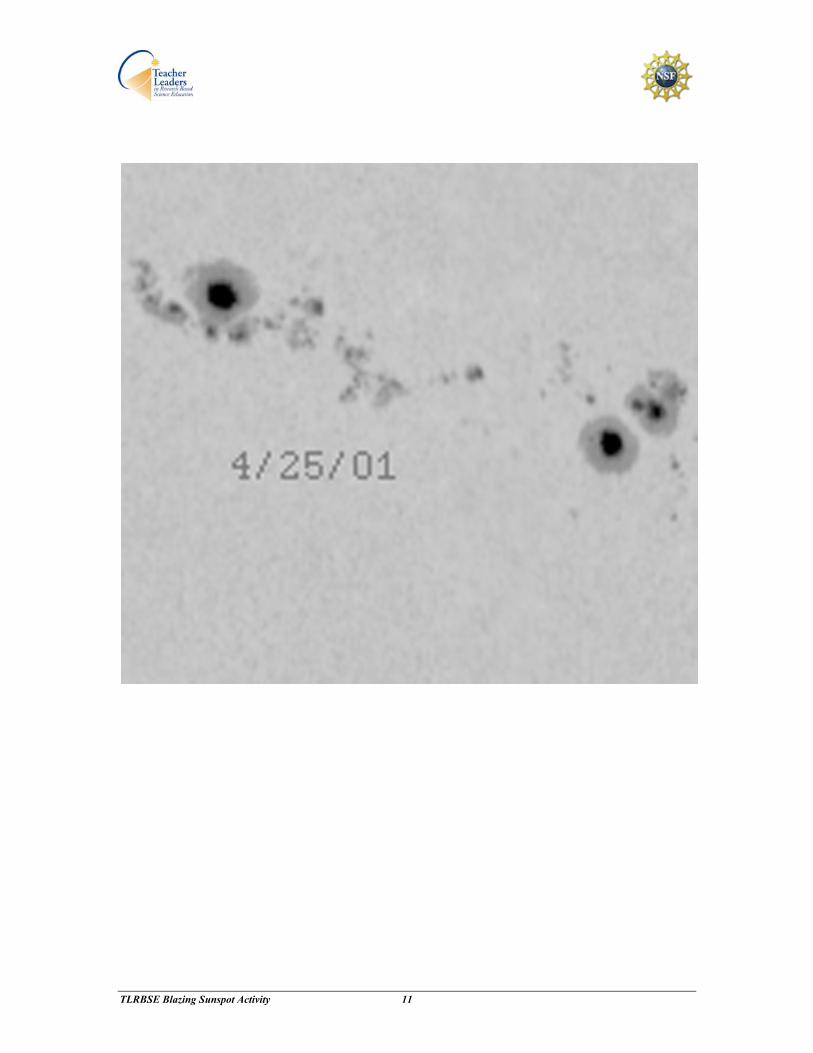
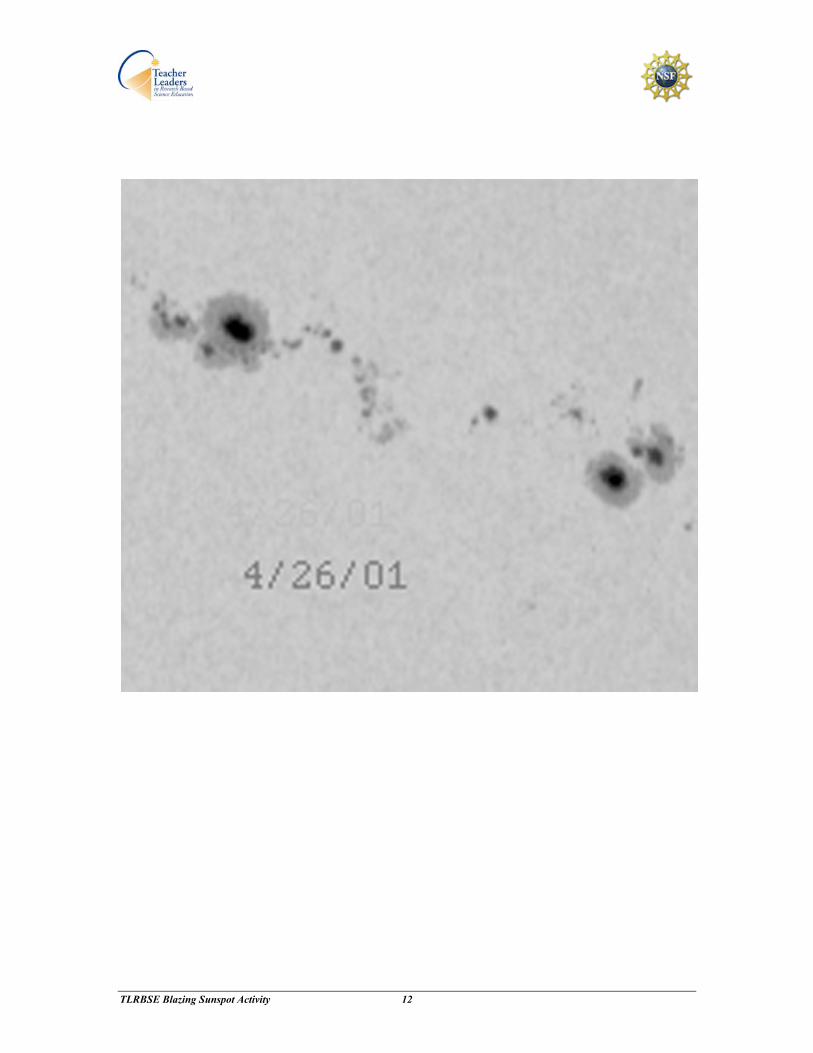
c. How do sunspot groups grow and diminish in size? How long do sunspot groups
“live” on the surface of the sun? What is the cycle of growth and diminishment of a sunspot group? One way to study the answers to these questions is to examine the changing area of a series of sunspot groups as they move across the surface. This can be done in NIH/Scion Image by using the selection tool and density slice technique. Today, you will go through a series of hardcopy steps with a partner.
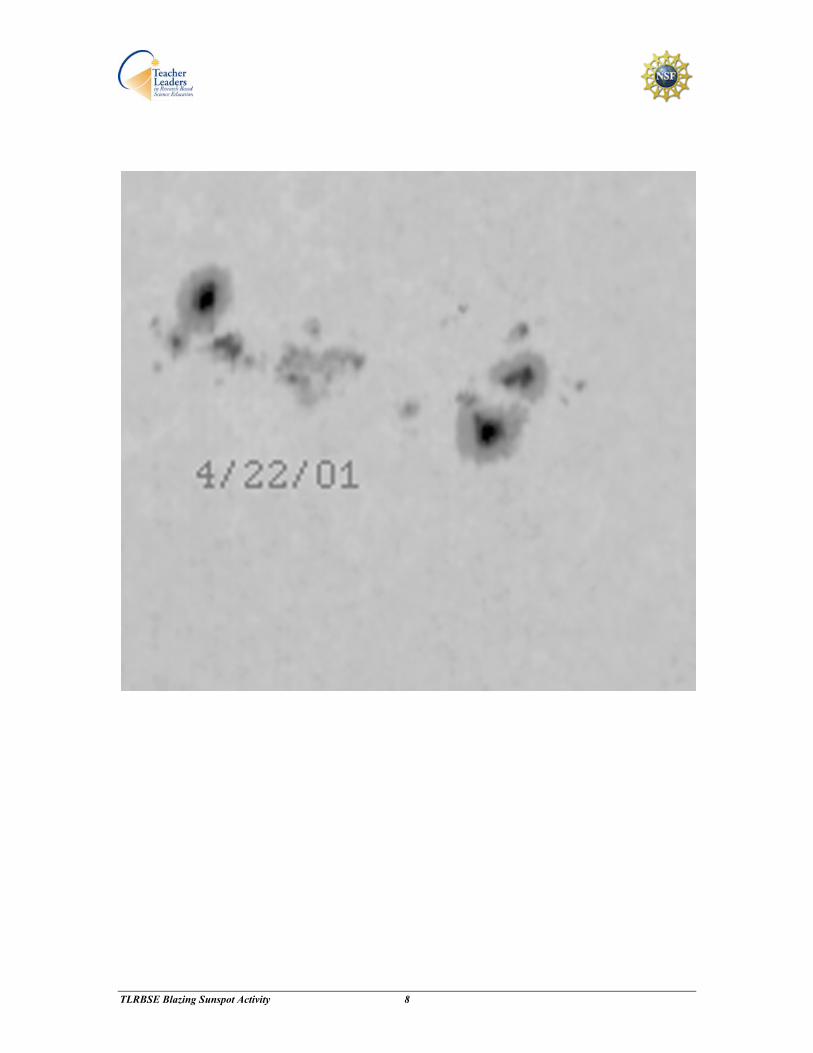
Overlay the graph paper transparency over the 4/22/01 sunspot group image. These
images have been magnified by a factor of 3 from the original image. Using an overhead marker, outline all the sunspot areas you can identify. You might
like to flip the transparency up from time to time to help you see the faint ones more clearly. For very small spots, place a dot on the transparency and count as one square.
Count the number of squares on the transparency you have outlined with your marker. Feel free to write numbers on the transparency as you go along to add up later.
Enter the total number of squares next to the appropriate data on the Table for Sunspot Area on your data sheet.
d. Graph the area data vs. date on the axes provided on your data sheet. Discussion Questions a. Is the sunspot group in a period of growth or decline? b. Based on your results, can you predict when the group might vanish completely? c. What kinds of error are inherent in the analog version of this activity? d. How would you determine the mathematical nature of your curves? e. How large a sample size would you need to better define the life cycle of a sunspot
group? Going Further • Plot the area of a sunspot group in white light and the area associated with the same
group on H-alpha or x-ray images taken the same series of days. Is the rate of growth and decline of a sunspot group the same at all wavelengths? If not, what might cause the observed differences?

TLRBSE Blazing Sunspot Activity 4
Blazing Sunspots Data Sheet 1. The approximate rotation rate of the sun = ______________ days (Show calculation here) 2. Sunspot Index = 10 (# groups) + # of individual spots Sunspot Index = 10 X _____ + _____ = ______ The approximate sunspot index on 4/22/01 is ________________
3. Table for Sunspot Group Areas
Date of Observation
Area (number of squares)
4/22 4/23 4/24 4/25 4/26
TLRBSE Blazing Sunspot Activity 5
4. Graph of Sunspot Area
Date
AR
EA
#
Squa
res
TLRBSE Blazing Sunspot Activity 6
Teaching Notes A Note from the Authors Please note that it is assumed that the instructor and students are familiar with the prerequisites listed below. This activity can be done as is or expanded if you have expertise in an image processing program such as NIH/Scion Image or Image J. Then you can download many images from a variety of sources and study the life and death of sunspots. An interesting project is to examine the life cycle of sunspots in different wavelength such as H-alpha or X ray. You can access images at the NSO, NOAA Web sites. Prerequisites To get the most out of this activity, students should have a basic understanding of the following concepts:
• Solar coordinate systems • Diurnal motions of the Sun and Earth • Spectral lines • Structure of the Sun - photosphere, chromosphere, corona, etc. • Sunspots and the sunspot cycle
Content Background for the Blazing Sunspot Research Activity Introduction Every 11 years the sun experiences a period of activity called the solar maximum, followed by a period of quiet called the solar minimum. During the solar maximum the Sun is very active; it has many sunspots, solar flares, and coronal mass ejections, which can affect life here on Earth. For centuries it has been known that the solar cycle has an impact on the weather, and in the modern era, solar activity can seriously impact electrical devices and communication systems. Solar storms can send huge waves of electrical energy surging along power lines, shorting circuits and burning out equipment. A solar storm in 1989 caused a blackout in Quebec, and coils in a transformer station in Salem, New Jersey, melted and caught fire, causing a regional power outage. There is concern about what effect the next solar maximum in the year 2000 will have on the many vulnerable satellites now in space. Seeing Spots When viewed through a solar telescope, dark spots can be observed on the surface of the Sun. These continuously changing dark regions are called sunspots. One way that solar activity can be determined is by monitoring the size, number and location of sunspots. Sunspots appear as dark blemishes of irregular shape on the Suns’s surface or photosphere. The spots are darker because they are cooler (as low as 3000 K) than the surrounding surface (5800 K). Sunspots can be quite small (1500 km diameter), or reach sizes up to 50,000 km. The inner part of a sunspot is very dark and is called the umbra, the Greek word for shadow. The lighter region surrounding the umbra is known as the penumbra. Sunspots are caused by very strong magnetic fields, about 2000 to 4000 Gauss, whereas in the photosphere the magnetic field is only a few Gauss. Sunspots are formed when magnetic field lines just below the Sun’s surface become twisted and poke though the solar photosphere. At the beginning of a new solar cycle, sunspots appear mainly at high solar latitudes (i.e., close to the Sun’s north and south poles). As the sunspot cycle progresses, sunspots form closer to the Sun’s equator. Sunspots are usually seen in groups although they can also appear alone. They can last for days or weeks before disappearing, with some large spots lasting for months.

TLRBSE Blazing Sunspot Activity 7
Sunspots were probably first seen by ancient people looking at the sun through clouds, dust, or smoke. With the invention of the telescope in 1610, Galileo Galilei and David Fabricus observed sunspots and followed their paths to discover the rotation rate of the sun. Galileo was the first to use scientific reasoning to show that sunspots were actually features on the Sun, and not bodies (such as planets) between the Sun and Earth. This was quite disturbing to the many people that wanted to believe that the Sun was perfect. Galileo’s scientific results were contrary to the teachings of the Catholic Church. After publishing his studies of sunspots and the solar system, he was put under house arrest. Counting Sunspots In 1848, Rudolf Wolf devised a method of estimating solar activity by counting the number of individual sunspots and sunspot groups. Wolf chose to compute his sunspot number by adding ten times the number of groups to the total count of individual sunspots, since neither quantity alone captured the true level of activity. Sunspot Index = 10(# of groups) + (# of spots) (Note: Usually there is a constant inserted in the first term. It is equal to the sunspot index you calculate at your school divided by the accepted sunspot index from the NOAA Web site. The constant occurs because everyone’s methods, and particularly equipment differs in accuracy and resolution.) Astronomers still use Wolf’s method, since no other index has been measured for so long or on a continual basis. Wolf was an avid astronomical historian and an unrivaled expert in sunspot lore. He confirmed the existence of a cycle in sunspot numbers and derived the exact number, 11.1 years, using historical records. After Wolf became director of the Zurich Observatory, he discovered that the variations of the sunspot cycle were related to the frequency of disturbances in the Earth’s magnetic field. The sunspot cycle averages 11.1 years, but this number has varied and even disappeared in historical times. The cycle is not symmetrical—the sunspot number takes 4.8 years to rise from a minimum to a maximum and another 6.2 years to fall to a minimum again. Sunspot numbers are averaged per month—they are best plotted this way—and also by year. The largest annual mean (190.2) occurred in 1957. The next maximum is due to occur in 2000. Occasionally the sunspot cycle will deviate from its normal 11-year cycle. A period of particularly low numbers of sunspots from A.D. 1645 to 1715 is known as the Maunder Minimum. During this period, fewer aurorae were observed and general global cooling occurred. The Maunder minimum coincides with a time known as the “little ice age.” It has been proposed that the cooling was due to lowered solar radiation.
TLRBSE Blazing Sunspot Activity 8

TLRBSE Blazing Sunspot Activity 9

TLRBSE Blazing Sunspot Activity 10
TLRBSE Blazing Sunspot Activity 11
TLRBSE Blazing Sunspot Activity 12
TLRBSE Blazing Sunspot Activity 13