blast management & consulting - cabanga … study team comprises j d zeeman (as the member of...
TRANSCRIPT

Cabanga Concepts~Schurvekop Colliery~EIAReport~170615V01
Blast Management & Consulting Page 1 of 75
Blast Management & Consulting
Quality Service on Time
Report: Blast Impact Assessment
Mmakau Coal (Pty) Ltd.
Schurvekop Colliery Date: 15 June 2017
BM&C Ref No: Cabanga Concepts~Schurvekop Colliery~EIAReport~170615V01
Client Ref No: n/a
Signed:
Name: JD Zeeman
Note: This document is the property of Blast Management & Consulting and should be treated as
confidential. No information in this document may be redistributed nor used at any other site than
the project it is intended for without prior consent from the author. The information presented is
given with the intention of assisting the receiver with optimized blast results and to ensure that a
safe and healthy blasting practice is conducted. Due to unforeseen rock formations that may occur,
neither the author nor his employees will assume liability for any alleged or actual damages arising
directly or indirectly out of the recommendations and information given in this document.

Cabanga Concepts~Schurvekop Colliery~EIAReport~170615V01
Blast Management & Consulting Page 2 of 75
i. Document Prepared and Authorised by:
JD Zeeman
Blast Management & Consulting (CK97 31139 / 23)
61 Sovereign Drive
Route 21 Corporate Park
Irene
South Africa
PO Box 61538
Pierre van Ryneveld
Centurion
0045
Cell: +27 82 854 2725 Tel: +27 (0)12 345 1445 Fax: +27 (0)12 345 1443
ii. Study Team Qualifications and Background
The study team comprises J D Zeeman (as the member of Blast Management & Consulting) and Blast
Management & Consulting employees. Blast Management & Consulting’s main areas of concern are
pre-blast consultation and monitoring, insitu monitoring, post-blast monitoring and consulting as
well as specialised projects. Blast Management & Consulting has been active in the mining industry
since 1997 and work has been done at various levels for mining companies in South Africa,
Botswana, Namibia, Mozambique, Democratic Republic of Congo, Sierra Leone and Côte d'Ivoire.
J D Zeeman holds the following qualifications:
1985 - 1987 Diploma: Explosives Technology, Technikon Pretoria
1990 - 1992 BA Degree, University of Pretoria
1994 National Higher Diploma: Explosives Technology, Technikon Pretoria
1997 Project Management Certificate, Damelin College
2000 Advanced Certificate in Blasting, Technikon SA
Member: International Society of Explosive Engineers
iii. Independence Declaration
Blast Management & Consulting is an independent company. The work done for the report was
performed in an objective manner and according to national and international standards, which
means that the results and findings may not all be positive for the client. Blast Management &
Consulting has the required expertise to conduct such an investigation and draft the specialist report
relevant to the study. Blast Management & Consulting did not engage in any behaviour that could
be result in a conflict of interest in undertaking this study.
iv. Legal Requirements

Cabanga Concepts~Schurvekop Colliery~EIAReport~170615V01
Blast Management & Consulting Page 3 of 75
In terms of the NEMA 2014 EIA Regulations contained in GN R982 of 04 December 2014 all specialist
studies must comply with Appendix 6 of the NEMA 2014 EIA Regulations (GN R982 of 04 December
2014). Table 1 show the requirements as indicated above.
Table 1: Legal Requirements for All Specialist Studies Conducted
Legal Requirement Relevant Section in Specialist study
(1) A specialist report prepared in terms of these Regulations must
contain-
(a) details of-
(i) the specialist who prepared the report; and i
(ii) the expertise of that specialist to compile a specialist report
including a curriculum vitae
Section ii and 23
(b) a declaration that the specialist is independent in a form as may
be specified by the competent authority;
Section iii
(c) an indication of the scope of, and the purpose for which, the
report was prepared;
Section 4
(d) the date and season of the site investigation and the relevance
of the season to the outcome of the assessment;
Section 8
(e) a description of the methodology adopted in preparing the
report or carrying out the specialised process
Section 6
(f) the specific identified sensitivity of the site related to the
activity and its associated structures and infrastructure;
Section 11
(g) an identification of any areas to be avoided, including buffers; Section 11
(h) a map superimposing the activity including the associated
structures and infrastructure on the environmental sensitivities
of the site including areas to be avoided, including buffers;
Section 11
(i) a description of any assumptions made and any uncertainties or
gaps in knowledge;
Section 9
(j) a description of the findings and potential implications of such
findings on the impact of the proposed activity, including
identified alternatives on the environment;
Section 15
(k) any mitigation measures for inclusion in the EMPr; Section 15.12
(l) any conditions/aspects for inclusion in the environmental
authorisation;
Section 20
(m) any monitoring requirements for inclusion in the EMPr or
environmental authorisation;
Section 19
(n) a reasoned opinion (Environmental Impact Statement)- Section 22

Cabanga Concepts~Schurvekop Colliery~EIAReport~170615V01
Blast Management & Consulting Page 4 of 75
Legal Requirement Relevant Section in Specialist study
as to whether the proposed activity or portions thereof should
be authorised; and
Section 22
if the opinion is that the proposed activity or portions thereof
should be authorised, any avoidance, management and
mitigation measures that should be included in the EMPr, and
where applicable, the closure plan;
Section 22
(o) a description of any consultation process that was undertaken
during the course of preparing the specialist report;
Section 12
(p) a summary and copies of any comments received during any
consultation process and where applicable all responses
thereto; and
Section 12
(q) any other information requested by the competent authority. None
v. Document Control:
Name Responsibility Work Done Signature Date
C Zeeman
Blast Management
& Consulting
Document
Preparation
Document
Preparation
01/07/2017
JD Zeeman
Blast Management
& Consulting
Consultant Document
Finalised
01/07/2017
JD Zeeman
Blast Management
& Consulting
Consultant Typing errors fix
20/07/2017

Cabanga Concepts~Schurvekop Colliery~EIAReport~170615V01
Blast Management & Consulting Page 5 of 75
Table of Contents
1 Executive Summary ........................................................................................................ 10
2 Introduction ................................................................................................................... 12
3 Objectives ...................................................................................................................... 12
4 Scope of blast impact study ............................................................................................ 13
5 Study area ..................................................................................................................... 14
6 Methodology ................................................................................................................. 16
7 Site Investigation ........................................................................................................... 17
8 Season applicable to the investigation ........................................................................... 17
9 Assumptions and Limitations ......................................................................................... 17
10 Legal Requirements ....................................................................................................... 17
11 Sensitivity of Project ...................................................................................................... 19
12 Consultation process ...................................................................................................... 21
13 Influence from blasting operations ................................................................................. 21
13.1 Ground vibration limitations on structures ........................................................................... 21
13.2 Ground vibration limitations and human perceptions .......................................................... 23
13.3 Air blast limitations on structures .......................................................................................... 24
13.4 Air blast limitations and human perceptions ......................................................................... 25
13.5 Fly rock ................................................................................................................................... 25
13.6 Noxious Fumes ....................................................................................................................... 26
14 Baseline Results ............................................................................................................. 27
14.1 Ground vibration and air blast predictions ............................................................................ 27
14.2 Structure profile ..................................................................................................................... 31
15 Construction Phase: Impact Assessment and Mitigation Measures ................................. 43
15.1 Review of expected ground vibration .................................................................................... 43
15.2 Summary of ground vibration levels ...................................................................................... 49
15.3 Ground Vibration and human perception .............................................................................. 49
15.4 Vibration impact on roads ...................................................................................................... 50
15.5 Potential that vibration will upset adjacent communities ..................................................... 50
15.6 Review of expected air blast .................................................................................................. 51
15.7 Summary of findings for air blast ........................................................................................... 56
15.8 Fly-rock unsafe zone ............................................................................................................... 56
15.9 Noxious fumes ........................................................................................................................ 59
15.10 Water borehole influence ...................................................................................................... 59
15.11 Potential Environmental Impact Assessment: Operational Phase ........................................ 60
15.12 Mitigations ............................................................................................................................. 68
16 Operational Phase: Impact Assessment and Mitigation Measures .................................. 68
17 Closure Phase: Impact Assessment and Mitigation Measures ......................................... 68

Cabanga Concepts~Schurvekop Colliery~EIAReport~170615V01
Blast Management & Consulting Page 6 of 75
18 Alternatives (Comparison and Recommendation) ........................................................... 68
19 Monitoring .................................................................................................................... 68
20 Recommendations ......................................................................................................... 70
20.1 Regulatory requirements ....................................................................................................... 70
20.2 Blast Designs........................................................................................................................... 70
20.3 Safe blasting distance and evacuation ................................................................................... 70
20.4 Road Closure .......................................................................................................................... 70
20.5 Recommended ground vibration and air blast levels ............................................................ 70
20.6 Blasting times ......................................................................................................................... 71
20.7 Third party monitoring ........................................................................................................... 71
21 Knowledge Gaps ............................................................................................................ 71
22 Conclusion ..................................................................................................................... 72
23 Curriculum Vitae of Author ............................................................................................ 73
24 References ..................................................................................................................... 75

Cabanga Concepts~Schurvekop Colliery~EIAReport~170615V01
Blast Management & Consulting Page 7 of 75
List of Acronyms used in this Report
a and b Site Constant
ANFO Ammonium nitrate fuel oil
APP Air Pressure Pulse
B Burden (m)
BM&C Blast Management & Consulting
Bs Scaled Burden (m3/2kg-1/2)
D Distance (m)
D Duration (s)
E East
E Explosive Mass (kg)
EIA Environmental Impact Assessment
Freq. Frequency
GRP Gas Release Pulse
I&AP Interested and Affected Parties
k Factor value
L Maximum Throw (m)
Lat/Lon
hddd°mm'ss.s"
Latitude/Longitude
Hours/degrees/minutes/seconds
M Charge Height
m (SH) Stemming height
M/S Magnitude/Severity
Mc Charge mass per metre column
N North
NE North East
NO Nitrogen Monoxide
NO2 Nitrogen Dioxide
NOx Nitrogen Oxide
NOx’s Noxious Fumes
NW North West
p𝑠 Air blast level (dB)
𝑃 Air blast level (Pa (mB x 100))
𝑃𝑜 Reference Pressure (2 x 10⁻⁵ Pa)
P Probability
POI Points of Interest
PPD Peak particle displacement
PPV Peak Particle Velocity
PVS Peak vector sum
RPP Rock Pressure Pulse

Cabanga Concepts~Schurvekop Colliery~EIAReport~170615V01
Blast Management & Consulting Page 8 of 75
S Scale
S South
SE South East
SH Stemming height (m)
SW South West
T Blasted Tonnage
TNT Explosives (Trinitrotoluene)
USBM United States Bureau of Mine
W West
WGS 84 Coordinates (South African)
WM With Mitigation Measures
WOM Without Mitigation Measures
List of Units used in this Report
% percentage
cm centimetre
dB decibel
dBL linear decibel
g acceleration
g/cm3 gram per cubic centimetre
Hz frequency
kg kilogram
kg/m3 kilogram per cubic metre
kg/t kilogram per tonne
km kilometre
kPa kilopascal
m metre
mᵌ metre squared
MJ Mega Joules
MJ/m³ Mega Joules per cubic meter
MJ/t Mega Joules per tonne
mB millibar
mm/s millimetres per second
mm/s2 millimetres per second square
ms milliseconds
Pa Pascal
ppm parts per million
psi pounds per square inch
θ theta or angle

Cabanga Concepts~Schurvekop Colliery~EIAReport~170615V01
Blast Management & Consulting Page 9 of 75
List of Figures
Figure 1: Local Setting Map ................................................................................................................ 14
Figure 2: Infrastructure Layout Plan .................................................................................................. 15
Figure 3: Close up of surface infrastructure area .............................................................................. 16
Figure 4: Identified sensitive areas .................................................................................................... 20
Figure 5: USBM Analysis Graph .......................................................................................................... 22
Figure 6: USBM Analysis with Human Perception ............................................................................. 24
Figure 7: Schematic of fly rock terminology ...................................................................................... 26
Figure 8: Simulation with maximum charge mass per delay for the top bench to be blasted ........... 29
Figure 9: Proposed prediction equations ........................................................................................... 31
Figure 10: Aerial view and surface plan of the proposed mining area with points of interest identified
............................................................................................................................................................ 33
Figure 11: Ground vibration influence from maximum charge for Box-cut Area ............................. 45
Figure 12: The effect of ground vibration with human perception and vibration limits .................. 50
Figure 13: Air blast influence from maximum charge for Box-cut Area ............................................ 52
Figure 14: Fly rock prediction calculation .......................................................................................... 57
Figure 15: Predicted fly rock Exclusion Zone ..................................................................................... 58
Figure 16: Location of the Boreholes ................................................................................................. 60
Figure 17: Monitoring Positions suggested for the Box-cut. ............................................................. 69
List of Tables
Table 1: Legal Requirements for All Specialist Studies Conducted ...................................................... 3
Table 2: Damage Limits for Air Blast .................................................................................................. 25
Table 3: Design statistics Zone 3&4 ................................................................................................... 28
Table 4: POI Classification used ......................................................................................................... 32
Table 5: List of points of interest identified (Cape – LO 29ᵒ) ............................................................. 34
Table 6: Structure Profile ................................................................................................................... 37
Table 7: Ground vibration evaluation for maximum charge for Box-cut .......................................... 46
Table 8: Air blast evaluation for maximum charge ............................................................................ 53
Table 9: Identified Boreholes ............................................................................................................. 59
Table 10: Evaluation matrix criteria ................................................................................................... 61
Table 11: Risk assessment outcome before mitigation ..................................................................... 63
Table 12: List of possible monitoring positions ................................................................................. 69
Table 13: Recommended ground vibration air blast limits ............................................................... 71

Cabanga Concepts~Schurvekop Colliery~EIAReport~170615V01
Blast Management & Consulting Page 10 of 75
1 Executive Summary
Blast Management & Consulting (BM&C) was contracted as part of the Environmental Impact
Assessment (EIA) to perform an initial review of possible impacts with regards to blasting operations
in the proposed Schurvekop Colliery located in the Mpumalanga Province of South Africa. Ground
vibration, air blast, fly rock and fumes are some of the aspects resulting from blasting operations.
The report concentrates on the possible influences of ground vibration, air blast and fly rock. It
intends to provide information, calculations, predictions, possible influences and mitigation of
blasting operations for this project.
The evaluation of effects yielded by blasting operations was evaluated over an area as wide as 3500
m. The range of structures observed and considered in this evaluation ranged between industrial
structures, farm buildings, Graves, Heritage structures and the Usuthu Pipeline. The proposed
surface infrastructure includes a box-cut adit, stockpile area, plant area, integrated mine residue
dump, workshops, change house, administration facilities and associated infrastructure. This project
is a greenfields project with no existing blasting operations.
The project area does not have people or houses at very close distance to the project area. The
nearest house or buildings is found 598 m away. The expected levels of ground vibration and air
blast for the proposed blasting operations yielded levels within the required limits. No specific
mitigation will be required other than applying best practice blast preparations.
The nearest public houses are located 598 m from the box-cut boundary. The levels predicted do
show low levels of ground vibration that could be experienced as unpleasant at the maximum
charge on the human perception scale. The ground vibration levels predicted for all installations
evaluated surrounding the box-cut area ranged between 0.6 mm/s and 18.7 mm/s. Ground vibration
levels at the nearest buildings where people may be present is 11.5 mm/s. None of the structures
considered in the evaluation showed any concern for possible damages.
Air blast predicted for the maximum charge ranges between 116.7 and 131.8 dB for all the POI’s
considered. No specific damages are expected from the levels calculated. Damages are only
expected to occur at levels greater than 134dB and 134 dB is only expected at distances closer than
447 m to the box-cut area. There are no private structures in this area that are of concern. All private
structures are further away. The nearest buildings are 598 m from the box-cut boundary. The levels
at private houses or settlements are expected to be within limits and not damaging. Levels at
nearest houses may cause effects such as rattling of roofs or doors and cause complaints.
Infrastructure such as the Pan and Graveyard are close to the box-cut boundary but air blast does
not have any influence on these installations.

Cabanga Concepts~Schurvekop Colliery~EIAReport~170615V01
Blast Management & Consulting Page 11 of 75
An exclusion zone for safe blasting was also calculated. The exclusion zone was established to be at
least 172 m. Normal practice observed in mines is a 500 m exclusion zone. The use of minimum 172
m exclusion zone is rather recommended in this instance. This may be reduced once blasting has
started and distances are confirmed.
Ten Hydrocensus boreholes were identified that could possibly be influenced due to excessive
ground vibration at maximum charge. The expected levels of ground vibration for the ten boreholes
inside the area evaluated are well within the limit applied for water boreholes.
Recommendations were made that should be considered, specifically for re-conformation of the
blast design, monitoring of ground vibration and air blast, maintain safe blasting zones, adhere to
the safe ground vibration and air blast limits and blast at recommended times.
This concludes this investigation for the Schurvekop Colliery Project. There is no reason to believe
that this operation cannot continue if attention is given to the recommendations made.

Cabanga Concepts~Schurvekop Colliery~EIAReport~170615V01
Blast Management & Consulting Page 12 of 75
2 Introduction
The proposed project site is located on the farm Schurvekop 227 IS: Portions 6, 8, 15, 16, 17, 18, 19
and 20 in the Govan Mbeki Local Municipality, Mpumalanga, South Africa at coordinates 26°
17.183'S 29° 28.988'E (Lat/Lon).
Mmakau Coal (Pty) Ltd intends to develop the Schurvekop Mine and as such has submitted an
application for a Mining Right (MR) in terms of the Minerals and Petroleum Resources Development
Act, Act No. 28 of 2002 (MPRDA).
The proposed mining right area comprises some 697 Ha, the properties are currently zoned for
agricultural use and consist of maize fields, natural grasslands and wetlands. A small community
resides on Portions 17 and 20 of Schurvekop 227 IS. Farmsteads are associated with Portions 6 and
8.
The Viskuile River enters the Mining Right area from the East and confluences with the
Joubertsvleispruit entering from the South, after which they flow northwest converging with the
Olifants River approximately 3.5km northwest of the property.
Surrounding land uses include agriculture and mining (coal). The proposed Mining Right Area is
contiguous to Exxaro’s Forzando South operations, and Anglo’s Elder’s Colliery.
The Schurvekop Resource will be mined using a mechanized board and pillar mining method using
continuous miners. The underground will be accessed via a box-cut adit.
As part of Environmental Impact Assessment (EIA), Blast Management & Consulting (BM&C) was
contracted to perform a review of possible impacts from blasting operations for the proposed box-
cut adit. Ground vibration, air blast and fly rock are some of the aspects that result from blasting
operations and this study considers the possible influences that blasting may have on the
surrounding area in this respect. The report concentrates on ground vibration and air blast and
intends to provide information, calculations, predictions, possible influences and mitigating aspects
of blasting operations for the project.
3 Objectives
The objectives of this document are: outlining the expected environmental effects that blasting
operations at the Schurvekop Colliery may have on the surrounding environment; proposing the
specific mitigation measures that will be required. This study investigates the related influences of
expected ground vibration, air blast and fly rock. These effects are investigated in relation to the

Cabanga Concepts~Schurvekop Colliery~EIAReport~170615V01
Blast Management & Consulting Page 13 of 75
blast site area and surrounds and the possible influence on nearby private installations, houses and
the owners or occupants.
The objectives were dealt with whilst taking specific protocols into consideration. The protocols
applied in this document are based on the author’s experience, guidelines taken from literature
research, client requirements and general indicators in the various appropriate pieces of South
African legislation. There is no direct reference in the following acts to requirements and limits on
the effect of ground vibration and air blast and some of the aspects addressed in this report:
• National Environmental Management Act No. 107 of 1998
• Mine Health and Safety Act No. 29 of 1996
• Mineral and Petroleum Resources Development Act No. 28 of 2002
• Explosives Act No. 15 of 2003.
The guidelines and safe blasting criteria are based on internationally accepted standards and
specifically criteria for safe blasting for ground vibration and recommendations on air blast
published by the United States Bureau of Mines (USBM). There are no specific South African
standards and the USBM is well accepted as standard for South Africa.
4 Scope of blast impact study
The scope of the study is determined by the terms of reference to achieve the objectives. The terms
of reference can be summarised according to the following steps taken as part of the EIA study with
regards to ground vibration, air blast and fly rock due to blasting operations.
• Background information of the proposed site
• Blasting Operation Requirements
• Site specific evaluation of blasting operations according to the following:
o Evaluation of expected ground vibration levels from blasting operations at specific
distances and on structures in surrounding areas
o Evaluation of expected ground vibration influence on neighbouring communities
o Evaluation of expected blasting influence on national and provincial roads surrounding
the blasting operations if present
o Evaluation of expected ground vibration levels on water boreholes if present within 500
m from blasting operations
o Evaluation of expected air blast levels at specific distances from the operations and
possible influence on structures
o Evaluation of fly rock unsafe zone
o Discussion on the occurrence of noxious fumes and dangers of fumes

Cabanga Concepts~Schurvekop Colliery~EIAReport~170615V01
Blast Management & Consulting Page 14 of 75
o Evaluation of the location of blasting operations in relation to surrounding areas
according to the regulations from the applicable Acts
• Impact Assessment
• Mitigations
• Recommendations
• Conclusion
5 Study area
The proposed project site is located on the farm Schurvekop 227 IS: Portions 6, 8, 15, 16, 17, 18, 19
and 20 in the Govan Mbeki Local Municipality, Mpumalanga, South Africa at coordinates 26°
17.183'S 29° 28.988'E (Lat/Lon).
Figure 1 shows a local setting map of the Schurvekop Colliery project area. Figure 2 shows a view of
the Infrastructure Layout Plan and Figure 3 shows a close up of surface infrastructure area with
indication of the Box-cut adit specifically.
Figure 1: Local Setting Map

Cabanga Concepts~Schurvekop Colliery~EIAReport~170615V01
Blast Management & Consulting Page 15 of 75
Figure 2: Infrastructure Layout Plan

Cabanga Concepts~Schurvekop Colliery~EIAReport~170615V01
Blast Management & Consulting Page 16 of 75
Figure 3: Close up of surface infrastructure area
6 Methodology
The detailed plan of study consists of the following sections.
• Base line influence: Determine if the project evaluated is part of existing operations with
blasting activities currently being done or no operations yet. If operational then baseline
monitoring is done. If not the baseline is zero with no specific influence from blasting.
• Identifying surface structures / installations that are found within reason from project
site. A list of Point of Interests (POI’s) are created that will be used for evaluation.
• Site evaluation: This consists of evaluation of the planned mining drilling and blasting
operations and the possible influences from the blasting operations. The methodology
includes modelling the expected impact based on the expected drilling and blasting
information provided for the project. Various accepted mathematical equations are
applied to determine the attenuation of ground vibration, air blast and fly rock. These
values are then calculated over the distance investigated from site and shown as
amplitude level contours. Overlaying these contours on the location of the various
receptors then gives an indication of the possible impacts and the expected results of
potential impacts. Evaluation of each receptor according to the predicted levels then
gives an indication of the possible mitigation measures to be applied. The possible

Cabanga Concepts~Schurvekop Colliery~EIAReport~170615V01
Blast Management & Consulting Page 17 of 75
environmental or social impacts are then addressed in the detailed EIA phase
investigation.
• Reporting: All data is prepared in a single report and provided for review.
7 Site Investigation
The site was visited and specific structure identification was done on 1 July 2017. This site visit was
done specifically to get understanding of the location of the new box-cut adit area for the project
and identifying the structures and installations surrounding the proposed new box-cut adit.
8 Season applicable to the investigation
The drilling and blasting operations are not season dependable. The investigation into the possible
effects from blasting operations is not season bounded.
9 Assumptions and Limitations
The proposed surface infrastructure includes a box-cut adit, stockpile area, plant area, integrated
mine residue dump, workshops, change house, administration facilities and associated
infrastructure. The project is a greenfields project with no drilling and blasting operations currently
active. The anticipated levels of influence estimated in this report are calculated using standard
accepted methodology according to international and local regulations. Assumption is made that
the predictions are a good estimate with significant safety factors to ensure that expected levels are
based on worst case scenarios. These will have to be confirmed with actual measurements once the
operation is active. The limitation is that no data is available from this operation for a confirmation
of the predicted values as it is a greenfield site with no current blasting activities.
The planned box-cut layout was used and blast designs proposed. These blast designs are used and
applied in the evaluation done in this report.
10 Legal Requirements
The protocols applied in this document are based on the author’s experience, guidelines elicited by
the literature research, client requirements and general indicators provided in the various
applicable South African acts. There is no direct reference in the consulted acts specifically with
regard to limiting levels for ground vibration and air blast. There is however specific requirements
and regulations with regards to blasting operations and the effect of ground vibration and air blast.
Requirements applicable to blasting is addressed in this report. The acts consulted are: National
Environmental Management Act No. 107 of 1998; Mine Health and Safety Act No. 29 of 1996;
Cabanga Concepts~Schurvekop Colliery~EIAReport~170615V01
Blast Management & Consulting Page 18 of 75
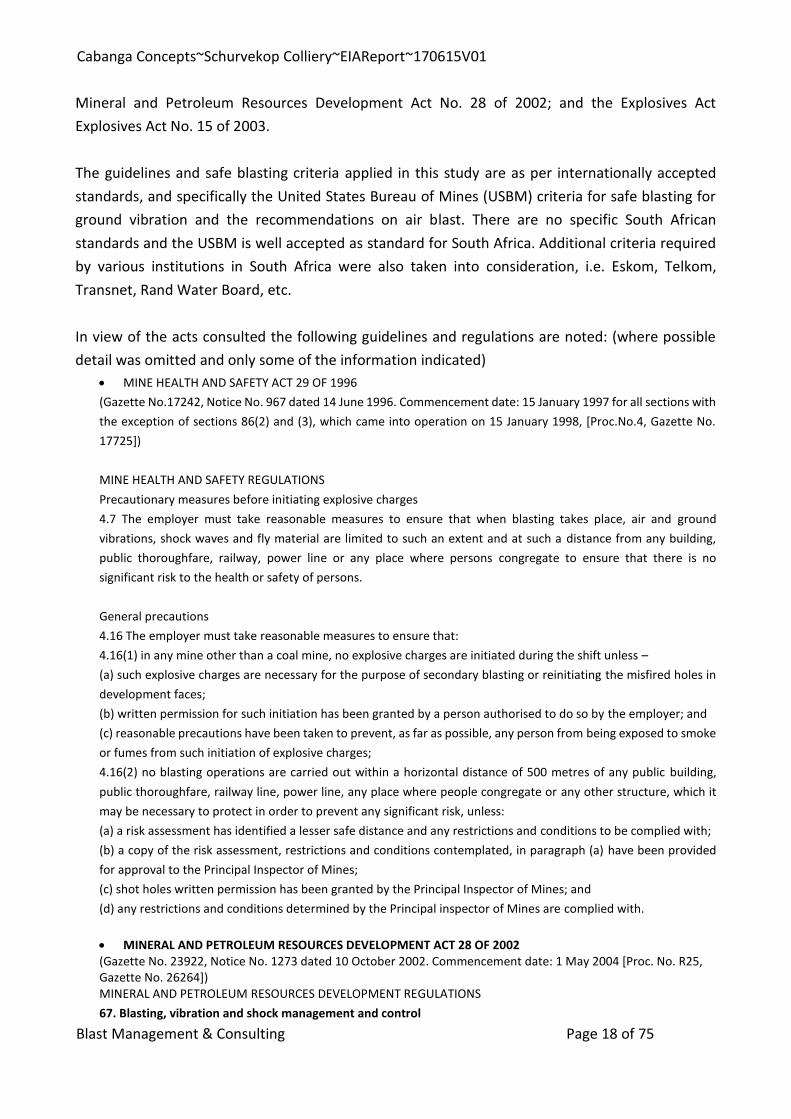
Mineral and Petroleum Resources Development Act No. 28 of 2002; and the Explosives Act
Explosives Act No. 15 of 2003.
The guidelines and safe blasting criteria applied in this study are as per internationally accepted
standards, and specifically the United States Bureau of Mines (USBM) criteria for safe blasting for
ground vibration and the recommendations on air blast. There are no specific South African
standards and the USBM is well accepted as standard for South Africa. Additional criteria required
by various institutions in South Africa were also taken into consideration, i.e. Eskom, Telkom,
Transnet, Rand Water Board, etc.
In view of the acts consulted the following guidelines and regulations are noted: (where possible
detail was omitted and only some of the information indicated)
• MINE HEALTH AND SAFETY ACT 29 OF 1996
(Gazette No.17242, Notice No. 967 dated 14 June 1996. Commencement date: 15 January 1997 for all sections with
the exception of sections 86(2) and (3), which came into operation on 15 January 1998, [Proc.No.4, Gazette No.
17725])
MINE HEALTH AND SAFETY REGULATIONS
Precautionary measures before initiating explosive charges
4.7 The employer must take reasonable measures to ensure that when blasting takes place, air and ground
vibrations, shock waves and fly material are limited to such an extent and at such a distance from any building,
public thoroughfare, railway, power line or any place where persons congregate to ensure that there is no
significant risk to the health or safety of persons.
General precautions
4.16 The employer must take reasonable measures to ensure that:
4.16(1) in any mine other than a coal mine, no explosive charges are initiated during the shift unless –
(a) such explosive charges are necessary for the purpose of secondary blasting or reinitiating the misfired holes in
development faces;
(b) written permission for such initiation has been granted by a person authorised to do so by the employer; and
(c) reasonable precautions have been taken to prevent, as far as possible, any person from being exposed to smoke
or fumes from such initiation of explosive charges;
4.16(2) no blasting operations are carried out within a horizontal distance of 500 metres of any public building,
public thoroughfare, railway line, power line, any place where people congregate or any other structure, which it
may be necessary to protect in order to prevent any significant risk, unless:
(a) a risk assessment has identified a lesser safe distance and any restrictions and conditions to be complied with;
(b) a copy of the risk assessment, restrictions and conditions contemplated, in paragraph (a) have been provided
for approval to the Principal Inspector of Mines;
(c) shot holes written permission has been granted by the Principal Inspector of Mines; and
(d) any restrictions and conditions determined by the Principal inspector of Mines are complied with.
• MINERAL AND PETROLEUM RESOURCES DEVELOPMENT ACT 28 OF 2002 (Gazette No. 23922, Notice No. 1273 dated 10 October 2002. Commencement date: 1 May 2004 [Proc. No. R25, Gazette No. 26264]) MINERAL AND PETROLEUM RESOURCES DEVELOPMENT REGULATIONS
67. Blasting, vibration and shock management and control

Cabanga Concepts~Schurvekop Colliery~EIAReport~170615V01
Blast Management & Consulting Page 19 of 75
(1) A holder of a right or permit in terms of the Act must comply with the provisions of the Mine Health and Safety Act, 1996, (Act No. 29 of 1996), as well as other applicable law regarding blasting, vibration and shock management and control. (2) An assessment of impacts relating to blasting, vibration and shock management and control, where applicable,
must form part of the environmental impact assessment report and environmental management programme or
the environmental management plan, as the case may be.
11 Sensitivity of Project
A review of the project and the surrounding areas is done before any specific analysis is undertaken
and sensitivity mapping is done, based on typical areas and distance from the proposed box-cut adit
area. This sensitivity map uses distances normally associated where possible influences may occur
and where influence is expected to be very low or none. Three different areas were identified in this
regard:
• A highly sensitive area of 500 m around the mining area. Normally, this 500 m area is
considered an area that should be cleared of all people and animals prior to blasting.
Levels of ground vibration and air blast are also expected to be higher closer to the box-
cut area.
• An area 500 m to 1500 m around the box-cut area can be considered as being a medium
sensitive area. In this area, the possibility of impact is still expected, but it is lower. The
expected level of influence may be low, but there may still be reason for concern, as
levels could be low enough not to cause structural damage but still upset people.
• An area greater than 1500 m is considered low sensitivity area. In this area it is relatively
certain that influences will be low with low possibility of damages and limited possibility
to upset people. Low sensitivity is indicated as area up to 3500 m.
Figure 4 shows the sensitivity mapping with the identified points of interest (POI) in the surrounding
areas for the proposed Schurvekop Colliery project. The specific influences will be determined
through the work done for this project in this report.

Cabanga Concepts~Schurvekop Colliery~EIAReport~170615V01
Blast Management & Consulting Page 20 of 75
Figure 4: Identified sensitive areas

Cabanga Concepts~Schurvekop Colliery~EIAReport~170615V01
Blast Management & Consulting Page 21 of 75
12 Consultation process
No specific consultation with external parties was utilised. The work done is based on the author’s
knowledge, baseline work at client’s operations and information provided by the client.
13 Influence from blasting operations
Blasting operations are required to break rock for excavation to access the targeted ore material.
Explosives in blast holes provide the required energy to conduct the work. Ground vibration, air
blast and fly rock are a result from the blasting process. Based on the regulations of the different
acts consulted and international accepted standards these effects are required to be within certain
limits. The following sections provide guidelines on these limits. As indicated there are no specific
South African ground vibration and air blast limit standards.
13.1 Ground vibration limitations on structures
Ground vibration is measured in velocity with units of millimetres per second (mm/s). Ground
vibration can also be reported in units of acceleration or displacement if required. Different types
of structures have different tolerances to ground vibration. A steel structure or a concrete structure
will have a higher resistance to vibrations than a well-built brick and mortar house. A brick and
mortar house will be more resistant to vibrations than a poorly constructed or a traditional built
mud house. Different limits are then applicable to the different types of structures. Limitations on
ground vibration take the form of maximum allowable levels or intensity for different installations
or structures. Ground vibration limits are also dependent on the frequency of the ground vibration.
Frequency is the rate at which the vibration oscillates. Faster oscillation is synonym with higher
frequency and lower oscillation is synonym with lower frequency. Lower frequencies are less
acceptable than higher frequencies because structures have a low natural frequency. Significant
ground vibration at low frequencies could cause increased structure vibrations due to the natural
low frequency of the structure and this may lead to crack formation or damages to occur.
Currently, the USBM criteria for safe blasting are applied as the industry standard where private
structures are of concern. Ground vibration amplitude and frequency is recorded an analysed. The
data is then evaluated accordingly. The USBM graph is used for plotting of data and evaluating the
data. Figure 5 below provides a graphic representation of the USBM analysis for safe ground
vibration levels. The USBM graph is divided mainly into two parts. The red lines in the figure are the
USBM criteria:
• Analysed data displayed in the bottom half of the graph shows safe ground vibration levels,

Cabanga Concepts~Schurvekop Colliery~EIAReport~170615V01
Blast Management & Consulting Page 22 of 75
• Analysed data displayed in the top half of the graph shows potentially unsafe ground
vibration levels:
Added to the USBM graph is a blue line and green dotted line that represents 6 mm/s and 12.5
mm/s additional criteria that are used by BM&C.
Figure 5: USBM Analysis Graph
Additional limitations that should be considered were determined through research and prescribed
by the various institutions; these are as follows:
• National roads/tar roads: 150 mm/s
• Steel pipelines: 50 mm/s (Rand Water Board)
• Electrical lines: 75 mm/s (Eskom)
• Sasol Pipe Lines: 25 mms/s (Sasol)
• Railways: 150 mm/s
• Concrete less than 3 days old: 5 mm/s
• Concrete after 10 days: 200 mm/s
• Sensitive plant equipment: 12 mm/s or 25 mm/s, depending on type. (Some switches could
trip at levels of less than 25 mm/s.)
• Waterwells: 50 mm/s
Considering the above limitations, BM&C work is based on the following:
6 6
12.5 12.5
0.1
1
10
100
1000
1 10 100
Gro
un
d V
ibra
tio
n (
mm
/s)
Frequency (Hz)
Schurvekop CollieryUSBM Graph and BM&C Ground Vibration Limits
Safe Blasting Zone
Above Limit Zone

Cabanga Concepts~Schurvekop Colliery~EIAReport~170615V01
Blast Management & Consulting Page 23 of 75
• USBM criteria for safe blasting.
• The additional limits provided above.
• Consideration of private structures in the area of influence.
• Should structures be in poor condition the basic limit of 25 mm/s is halved to 12.5 mm/s or
when structures are in very poor condition limits will be restricted to 6 mm/s. It is a standard
accepted method to reduce the limit allowed with poorer condition of structures.
• Traditional built mud houses are limited to 6 mm/s. The 6 mm/s limit is used due to
unknowns on how these structures will react to blasting. There is also no specific scientific
data available that would indicate otherwise.
• Input from other consultants in the field locally and internationally.
13.2 Ground vibration limitations and human perceptions
A further aspect of ground vibration and frequency of vibration that must be considered is human
perceptions. It should be realized that the legal limit set for structures is significantly greater than
the comfort zone of human beings. Humans and animals are sensitive to ground vibration and the
vibration of structures. Research has shown that humans will respond to different levels of ground
vibration at different frequencies.
Ground vibration is experienced at different levels; BM&C considers only the levels that are
experienced as “Perceptible”, “Unpleasant” and “Intolerable”. This is indicative of the human
being’s perceptions of ground vibration and clearly indicates that humans are sensitive to ground
vibration and humans perceive ground vibration levels of 4.5 mm/s as unpleasant (See Figure 6).
This guideline helps with managing ground vibration and the complaints that could be received due
to blast induced ground vibration.
Indicated on Figure 6 is blue solid line that indicates a ground vibration level of 12.5 mm/s and a
green dotted line that indicates a ground vibration level of 6 mm/s. These are levels that are used
in evaluation.
Generally, people also assume that any vibration of a structure - windows or roofs rattling - will
cause damage to the structure. Air blast is one of the causes of vibration of a structure and is the
cause of nine out of ten complaints.

Cabanga Concepts~Schurvekop Colliery~EIAReport~170615V01
Blast Management & Consulting Page 24 of 75
Figure 6: USBM Analysis with Human Perception
13.3 Air blast limitations on structures
Air blast or air-overpressure is a pressure wave generated from the blasting process. Air blast is
measured as a pressure in pascal (Pa) and reported as a decibel value (dBL). Air blast is normally
associated with frequency levels less than 20 Hz, which is at the threshold for hearing. Air blast can
be influenced by meteorological conditions, the final blast layout, timing, stemming, accessories
used, blast covered by a layer of soil or not etc. Air blast should not be confused with sound that is
within the audible range (detected by the human ear). A blast does generate sound as well but for
the purpose of possible damage capability we are only concerned with air blast in this report. The
three main causes of air blasts can be observed as:
• Direct rock displacement at the blast; the air pressure pulse (APP)
• Vibrating ground some distance away from the blast; rock pressure pulse (RPP)
• Venting of blast holes or blowouts; the gas release pulse (GRP)
The general recommended limit for air blast currently applied in South Africa is 134dB. This is based
on work done by the USBM. The USBM also indicates that the level is reduced to 128 dB in proximity
of hospitals, schools and sensitive areas where people congregate. Based on work carried out by
Siskind et al. (1980), monitored air blast amplitudes up to 135dB are safe for structures, provided
the monitoring instrument is sensitive to low frequencies. Persson et al. (1994) have published
estimates of damage thresholds based on empirical data (Table 2). Levels given in Table 2 are at the
point of measurement. The weakest points on a structure are the windows and ceilings.
6 6
12.5 12.5
0.1
1
10
100
1000
1 10 100
Gro
un
d V
ibra
tio
n (
mm
/s)
Frequency (Hz)
Schurvekop CollieryGround Vibration Limits & Human Perception
Perceptible
Unpleasant
Intolerable
Safe Blasting Zone
Above Limit Zone
Cabanga Concepts~Schurvekop Colliery~EIAReport~170615V01
Blast Management & Consulting Page 25 of 75
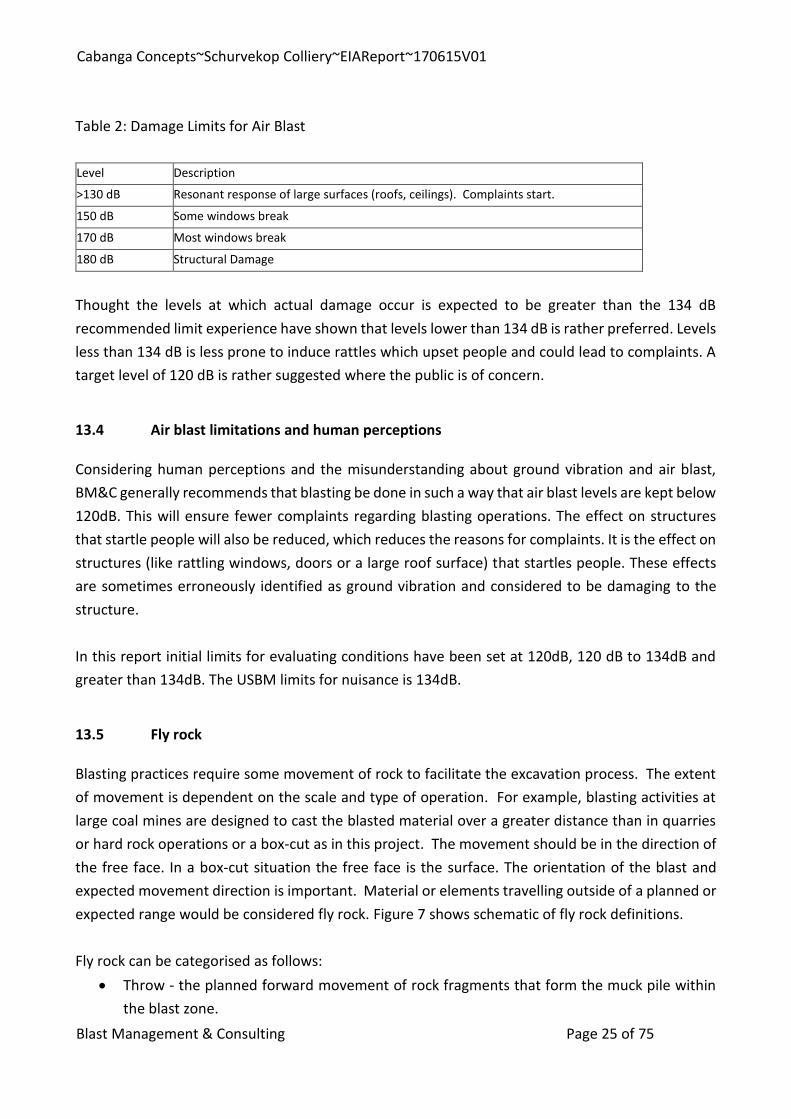
Table 2: Damage Limits for Air Blast
Level Description
>130 dB Resonant response of large surfaces (roofs, ceilings). Complaints start.
150 dB Some windows break
170 dB Most windows break
180 dB Structural Damage
Thought the levels at which actual damage occur is expected to be greater than the 134 dB
recommended limit experience have shown that levels lower than 134 dB is rather preferred. Levels
less than 134 dB is less prone to induce rattles which upset people and could lead to complaints. A
target level of 120 dB is rather suggested where the public is of concern.
13.4 Air blast limitations and human perceptions
Considering human perceptions and the misunderstanding about ground vibration and air blast,
BM&C generally recommends that blasting be done in such a way that air blast levels are kept below
120dB. This will ensure fewer complaints regarding blasting operations. The effect on structures
that startle people will also be reduced, which reduces the reasons for complaints. It is the effect on
structures (like rattling windows, doors or a large roof surface) that startles people. These effects
are sometimes erroneously identified as ground vibration and considered to be damaging to the
structure.
In this report initial limits for evaluating conditions have been set at 120dB, 120 dB to 134dB and
greater than 134dB. The USBM limits for nuisance is 134dB.
13.5 Fly rock
Blasting practices require some movement of rock to facilitate the excavation process. The extent
of movement is dependent on the scale and type of operation. For example, blasting activities at
large coal mines are designed to cast the blasted material over a greater distance than in quarries
or hard rock operations or a box-cut as in this project. The movement should be in the direction of
the free face. In a box-cut situation the free face is the surface. The orientation of the blast and
expected movement direction is important. Material or elements travelling outside of a planned or
expected range would be considered fly rock. Figure 7 shows schematic of fly rock definitions.
Fly rock can be categorised as follows:
• Throw - the planned forward movement of rock fragments that form the muck pile within
the blast zone.

Cabanga Concepts~Schurvekop Colliery~EIAReport~170615V01
Blast Management & Consulting Page 26 of 75
• Fly rock - the undesired propulsion of rock fragments through the air or along the ground
beyond the blast zone by the force of the explosion that is contained within the blast
clearance (exclusion) zone. When using this definition, fly rock, while undesirable, is only a
safety hazard if a breach of the blast clearance (exclusion) zone occurs.
• Wild fly rock - the unexpected propulsion of rock fragments that travels beyond the blast
clearance (exclusion) zone when there is some abnormality in a blast or a rock mass.
Figure 7: Schematic of fly rock terminology
Fly rock from blasting can result under the following conditions:
• When burdens are too small, rock elements can be propelled out of the free face area of the
blast,
• When burdens are too large and movement of blast material is restricted and stemming
length is not correct, rock elements can be forced upwards creating a crater forming fly rock,
• If the stemming material is of poor quality or too little stemming material is applied, the
stemming is ejected out of the blast hole, which can result in fly rock.
Stemming of correct type and length is required to ensure that explosive energy is efficiently used
to its maximum and to control fly rock.
The occurrence of fly rock in any form will have impact if found to travel outside the safe boundary.
If a road or structure or people or animals are within the safe boundary of a blast, irrespective of
the possibility of fly rock or not, precautions should be taken to stop the traffic, remove people or
animals for the period of the blast. The fact is that fly rock will cause damage to the road, vehicles
or even death to people or animals. This safe boundary is determined by the appointed blaster or
as per mine code of practice. BM&C uses a prediction calculation defined by the International
Society of Explosives Engineers (ISEE) to assist with determining minimum distance.
13.6 Noxious Fumes
Cabanga Concepts~Schurvekop Colliery~EIAReport~170615V01
Blast Management & Consulting Page 27 of 75
Explosives used in mining environment are required to be oxygen balanced. Oxygen balance refers
to the stoichiometry of the chemical reaction and the nature of gases produced from the detonation
of the explosives. The creation of poisonous fumes such as nitrous oxides and carbon monoxide are
particularly undesirable. These fumes present themselves as red brown cloud after the blast has
detonated. It has been reported that 10ppm to 20ppm can be mildly irritating. Exposure to 150 ppm
or more (no time period given) has been reported to cause death from pulmonary edema. It has
been predicted that 50% lethality would occur following exposure to 174ppm for 1 hour. Anybody
exposed must be taken to hospital for proper treatment.
Factors contributing to undesirable fumes are typically: poor quality control on explosive
manufacture, damage to explosive, lack of confinement, insufficient charge diameter, excessive
sleep time, water in blast holes incorrect product used or product not loaded properly and specific
types of rock/geology can also contribute to fumes.
14 Baseline Results
The project is a greenfield project with no drilling and blasting currently active. No specific
monitoring was done. The ground vibration and air blast baseline is considered at zero with no
current influence. There is also no mine that conducts surface blasting within 5km radius of the
box-cut area for this project.
A further part of baseline work done is familiarising oneself with the surroundings and the typical
structures that are found in the area of the project. The information for this is presented below.
14.1 Ground vibration and air blast predictions
Explosives are used to break rock through the shock waves and gasses yielded from the explosion.
Ground vibration and air blast is a result from blasting activities. Factors influencing ground vibration
are the charge mass per delay, distance from the blast, the delay period and the geometry of the
blast. These factors are controlled by planned design and proper blast preparation.
An aspect that is not normally considered as pre-operation definable is the effect of air blast. This
is mainly due to the fact that air blast is an aspect that can be controlled to a great degree by
applying basic rules. Air blast is the direct result from the blast process, although influenced by
meteorological conditions, the final blast layout, timing, stemming length, stemming material,
accessories used, covered blast or not covered blast etc. all has an influence on the outcome of the
result.
This project is a new planned operation with no specific blast designs available. Planned box-cut
design was used and blast designs to develop the box-cut was done. The blast design done was used

Cabanga Concepts~Schurvekop Colliery~EIAReport~170615V01
Blast Management & Consulting Page 28 of 75
to evaluate possible influences. The blast design was done using JKSimblast blast simulation
software and simulate the outcomes for specific aspects. The simulation of the blast in the software
was then used to obtain the best prediction possible. Table 3 shows the technical information for
the design done. The design considered the development in stages. The first stage or top bench to
be blasted is considered here. Figure 8 below shows the box-cut layout with blast holes. Blast timing
simulation was also done and the resulting charge mass per delay indicated.
Table 3: Design statistics Zone 3&4
Design Factors / Blast Parameters Blast Name: Box-Cut00~Zone3_4
Polygon Number 1 Polygon Label 1 Polygon Area 16 541.487 m²
Bench Height 12.5 m
Volume 206 768.587 m³
Rock SG 2.39 Tonnage 494 176.922 tonnes
Marked Holes 1786 Charge Mass 96 058.821 kg
Charge Energy 277 609.992 MJ
POWDER FACTOR 0.465 kg/m³
POWDER FACTOR 0.194 kg/t
ENERGY FACTOR 1.343 MJ/m³
ENERGY FACTOR 0.562 MJ/t

Cabanga Concepts~Schurvekop Colliery~EIAReport~170615V01
Blast Management & Consulting Page 29 of 75
Figure 8: Simulation with maximum charge mass per delay for the top bench to be blasted
The simulation work done provided information that is applied for predicting ground vibration and
air blast. The blast simulation takes into the drilling, charging and timing of the blastholes. The
simulation calculated an expected maximum charge of 1360 kg. This value was applied in all
predictions for ground vibration and air blast.
When predicting ground vibration and possible decay, a standard accepted mathematical process
of scaled distance is used. The equation applied (Equation 1) uses the charge mass and distance with
two site constants. In the absence of testing or monitoring standard constants are applied. These
constants are applied in equation 1 below.
Equation 1:
𝑃𝑃𝑉 = 𝑎(𝐷
√𝐸)−𝑏
Where:
PPV = Predicted ground vibration (mm/s)

Cabanga Concepts~Schurvekop Colliery~EIAReport~170615V01
Blast Management & Consulting Page 30 of 75
a = Site constant
b = Site constant
D = Distance (m)
E = Explosive Mass (kg)
General factors applied for the constants a & b are:
a = 1143 and
b = -1.65.
Utilizing the abovementioned equation and the given factors, allowable levels for specific limits and
expected ground vibration levels can then be calculated for various distances.
Predicting the outcome of air blast is considered difficult in most circumstances. There are many
variables that have influence on the outcome of air blast. In most cases mainly an indication of
typical levels can be obtained.
A standard cube root scaling prediction formula is applied for air blast predictions. The following
Equation 2 was used to calculate possible air blast values in millibar. This equation does not take
temperature or any weather conditions into account.
Equation 2:
P = A x (D
E13
)−𝐵
Where:
𝑃 = Air blast level (mB)
D = Distance from source (m)
E = Maximum charge mass per delay (kg)
A = Constant: 37.1
-B = Constant: -0.97
The constants for A and B were then selected according to the information as provided in Figure 9
below. Various types of mining operations are expected to yield different results. The information
provided in Figure 9 is based on detailed research that was conduct for each of the different types
of mining environments. This report uses the data for quarry type blasting for prediction of air blast.
The development of the box-cut will be done in hard rock and blasting is similar to quarry type
blasting operations.

Cabanga Concepts~Schurvekop Colliery~EIAReport~170615V01
Blast Management & Consulting Page 31 of 75
Figure 9: Proposed prediction equations
The air pressure calculated in Equation 2 is converted to decibels in Equation 3. The reporting of air
blast in the decibel scale is more readily accepted in the mining industry.
Equation 3:
p𝑠 = 20 x log 𝑃
𝑃𝑜
Where:
p𝑠 = Air blast level (dB)
𝑃 = Air blast level (Pa (mB x 100))
𝑃𝑜 = Reference Pressure (2 x 10⁻⁵ Pa)
Although the above equation was applied for prediction of air blast levels, additional measures are
also recommended in order to ensure that air blast and associated fly-rock possibilities are
minimized as best possible.
14.2 Structure profile
As part of the baseline, all possible structures in a possible influence area are identified. The site
review is detailed here. The site was reviewed using Google Earth imagery. Information sought
during the review was to identify surface structures present in a 3500 m radius from the proposed
mine boundary (the box-cut adit), which will require consideration during modelling of blasting
operations, e.g. houses, general structures, power lines, pipe lines, reservoirs, mining activity, roads,
shops, schools, gathering places, possible historical sites, etc. A list was prepared of all structures in
the vicinity of the Schurvekop Colliery box-cut area. The list includes structures and points of interest
(POI) within the 3500 m boundary – see Table 4 below. A list of structure locations was required in

Cabanga Concepts~Schurvekop Colliery~EIAReport~170615V01
Blast Management & Consulting Page 32 of 75
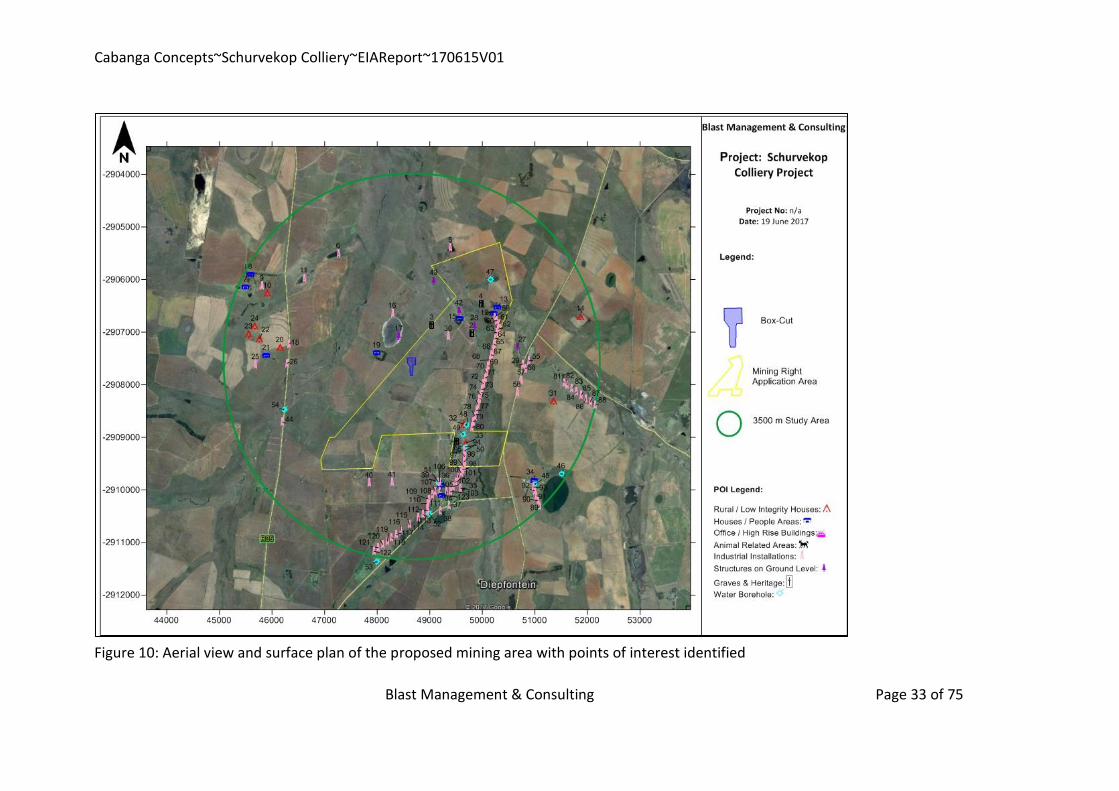
order to determine the allowable ground vibration limits and air blast limits. Figure 10 shows an
aerial view of the box-cut area and surroundings with POIs. The type of POIs identified is grouped
into different classes. These classes are indicated as “Classification” in Table 5. The classification
used is a BM&C classification and does not relate to any standard or national or international code
or practice. Table 4 shows the descriptions for the classifications used.
Table 4: POI Classification used
Class Description
1 Rural Building and structures of poor construction
2 Private Houses and people sensitive areas
3 Office and High-rise buildings
4 Animal related installations and animal sensitive areas
5 Industrial buildings and installations
6 Earth like structures – no surface structure
7 Graves & Heritage
8 Water Borehole
Cabanga Concepts~Schurvekop Colliery~EIAReport~170615V01
Blast Management & Consulting Page 33 of 75
Figure 10: Aerial view and surface plan of the proposed mining area with points of interest identified

Cabanga Concepts~Schurvekop Colliery~EIAReport~170615V01
Blast Management & Consulting Page 34 of 75
Table 5: List of points of interest identified (Cape – LO 29ᵒ)
Tag Description Classification Y X
1 Grave yard (Site 1 - ±78 graves) 7 -49509.35 2909083.18
2 Grave yard (Site 2 - ±3 graves) 7 -49795.25 2907017.92
3 Grave yard (Site 3 - ±9 graves) 7 -49041.69 2906861.78
4 Grave yard (Site 4 - ±26 graves) 7 -49978.86 2906462.79
5 Cement Dam 5 -49395.35 2905389.76
6 Dam 5 -47263.14 2905498.59
7 Farm Buildings/Structures 2 -45498.27 2906142.23
8 Farm Buildings/Structures 2 -45591.01 2905897.89
9 Dam 5 -45811.10 2906121.53
10 Informal Housing 1 -45914.00 2906257.28
11 Dam 5 -46610.15 2905971.57
12 Farm Buildings/Structures 2 -50212.61 2906634.27
13 Buildings/Structures 2 -50291.07 2906521.77
14 Ruins 1 -51868.56 2906696.48
15 Farm Buildings/Structures 2 -49573.56 2906734.57
16 Cement Dam 5 -48292.89 2906640.17
17 Pan 6 -48412.33 2907076.86
18 R35 Road 5 -46322.31 2907227.41
19 Buildings/Structures 2 -47989.25 2907390.67
20 Informal Housing 1 -46151.86 2907288.69
21 Buildings/Structures 2 -45892.17 2907439.07
22 Informal Housing 1 -45764.27 2907117.35
23 Informal Housing 1 -45557.04 2907032.82
24 Informal Housing 1 -45676.64 2906881.80
25 Cement Dam 5 -45686.64 2907616.03
26 R35 Road 5 -46285.84 2907592.73
27 Viskuile River 6 -50672.69 2907264.59
28 Viskuile River 6 -49851.67 2906876.14
29 Road 5 -50774.38 2907607.01
30 Cement Dam 5 -49356.34 2907075.40
31 Ruins 1 -51354.30 2908308.91
32 Informal Housing 1 -49653.31 2908747.56
33 Informal Housing 1 -49684.65 2909108.10
34 Farm Buildings/Structures 2 -50986.20 2909828.37
35 Dam 5 -49585.74 2909968.98
36 Buildings/Structures 2 -49217.81 2909909.73
37 Road 5 -49368.63 2910290.45
38 Dam 5 -49202.23 2910394.91
39 Cement Dam 5 -49165.24 2909850.94
40 Cement Dam 5 -47848.90 2909866.78
41 Cement Dams 5 -48287.48 2909850.97

Cabanga Concepts~Schurvekop Colliery~EIAReport~170615V01
Blast Management & Consulting Page 35 of 75
Tag Description Classification Y X
42 Viskuile River 6 -49560.49 2906589.61
43 Viskuile River 6 -49079.23 2906013.74
44 R35 Road 5 -46199.42 2908708.41
45 Hydrocensus Borehole (Te Water BH 1) 8 -51002.04 2909891.01
46 Hydrocensus Borehole (Te Water BH 2) 8 -51502.15 2909692.94
47 Hydrocensus Borehole (Bosman Bh 1) 8 -50154.32 2906006.74
48 Hydrocensus Borehole (Community BH) 8 -49699.76 2908768.75
49 Hydrocensus Borehole (Community
Windmill) 8 -49632.50 2908943.92
50 Hydrocensus Borehole (Community
Handpump) 8 -49678.76 2909181.08
51 Hydrocensus Borehole (Bosman Handpump) 8 -49168.52 2909856.22
52 Hydrocensus Borehole (ESW 33) 8 -48983.19 2910449.51
53 Hydrocensus Borehole (Vilakasi BH) 8 -47989.48 2911372.18
54 Hydrocensus Borehole (Uitgedagt BH) 8 -46227.43 2908469.68
55 Usuthu Pipeline 5 -50885.55 2907547.02
56 Usuthu Pipeline 5 -50823.12 2907696.05
57 Usuthu Pipeline 5 -50744.81 2907910.12
58 Usuthu Pipeline 5 -50661.67 2908139.92
59 Power lines/Pylons 5 -50232.43 2906713.47
60 Power lines/Pylons 5 -50276.73 2906777.62
61 Power lines/Pylons 5 -50322.86 2906843.17
62 Power lines/Pylons 5 -50298.16 2906941.26
63 Power lines/Pylons 5 -50278.68 2907011.84
64 Power lines/Pylons 5 -50251.09 2907122.25
65 Power lines/Pylons 5 -50221.91 2907229.82
66 Power lines/Pylons 5 -50192.78 2907337.71
67 Power lines/Pylons 5 -50169.11 2907431.61
68 Power lines/Pylons 5 -50143.00 2907526.59
69 Power lines/Pylons 5 -50111.28 2907642.26
70 Power lines/Pylons 5 -50080.54 2907766.85
71 Power lines/Pylons 5 -50051.23 2907872.65
72 Power lines/Pylons 5 -50023.08 2907980.17
73 Power lines/Pylons 5 -49994.34 2908086.10
74 Power lines/Pylons 5 -49966.07 2908195.57
75 Power lines/Pylons 5 -49946.51 2908266.72
76 Power lines/Pylons 5 -49916.34 2908380.33
77 Power lines/Pylons 5 -49888.16 2908487.65
78 Power lines/Pylons 5 -49859.41 2908594.72
79 Power lines/Pylons 5 -49831.39 2908701.87
80 Power lines/Pylons 5 -49803.08 2908808.30
81 Power lines/Pylons 5 -51557.25 2907964.64
82 Power lines/Pylons 5 -51616.81 2908005.60
83 Power lines/Pylons 5 -51703.95 2908068.86
84 Power lines/Pylons 5 -51794.53 2908134.33

Cabanga Concepts~Schurvekop Colliery~EIAReport~170615V01
Blast Management & Consulting Page 36 of 75
Tag Description Classification Y X
85 Power lines/Pylons 5 -51882.20 2908198.98
86 Power lines/Pylons 5 -51970.06 2908263.59
87 Power lines/Pylons 5 -52051.85 2908322.91
88 Power lines/Pylons 5 -52146.64 2908390.28
89 Power lines/Pylons 5 -51086.91 2910302.59
90 Power lines/Pylons 5 -51057.40 2910207.69
91 Power lines/Pylons 5 -51027.75 2910111.76
92 Power lines/Pylons 5 -50999.05 2910017.41
93 Power lines/Pylons 5 -50976.82 2909944.79
94 Power lines/Pylons 5 -49667.09 2909252.18
95 Power lines/Pylons 5 -49662.29 2909360.84
96 Power lines/Pylons 5 -49656.02 2909468.08
97 Power lines/Pylons 5 -49653.20 2909565.90
98 Power lines/Pylons 5 -49622.87 2909619.59
99 Power lines/Pylons 5 -49591.67 2909675.80
100 Power lines/Pylons 5 -49545.52 2909757.48
101 Power lines/Pylons 5 -49491.22 2909855.16
102 Power lines/Pylons 5 -49445.92 2909937.60
103 Power lines/Pylons 5 -49394.16 2910029.24
104 Power lines/Pylons 5 -49315.54 2910030.15
105 Power lines/Pylons 5 -49194.53 2910030.99
106 Power lines/Pylons 5 -49186.31 2909849.96
107 Power lines/Pylons 5 -49102.38 2910028.38
108 Power lines/Pylons 5 -49051.83 2910091.23
109 Power lines/Pylons 5 -48980.55 2910178.27
110 Power lines/Pylons 5 -48957.79 2910253.82
111 Power lines/Pylons 5 -48959.86 2910331.50
112 Power lines/Pylons 5 -48959.93 2910395.77
113 Power lines/Pylons 5 -48875.29 2910459.88
114 Power lines/Pylons 5 -48783.58 2910528.04
115 Power lines/Pylons 5 -48612.92 2910657.68
116 Power lines/Pylons 5 -48449.84 2910781.11
117 Power lines/Pylons 5 -48359.77 2910848.69
118 Power lines/Pylons 5 -48277.33 2910910.45
119 Power lines/Pylons 5 -48192.90 2910975.42
120 Power lines/Pylons 5 -48105.26 2911038.56
121 Power lines/Pylons 5 -48022.79 2911101.43
122 Power lines/Pylons 5 -47934.61 2911167.30
123 Structures 2 -49223.59 2910099.67
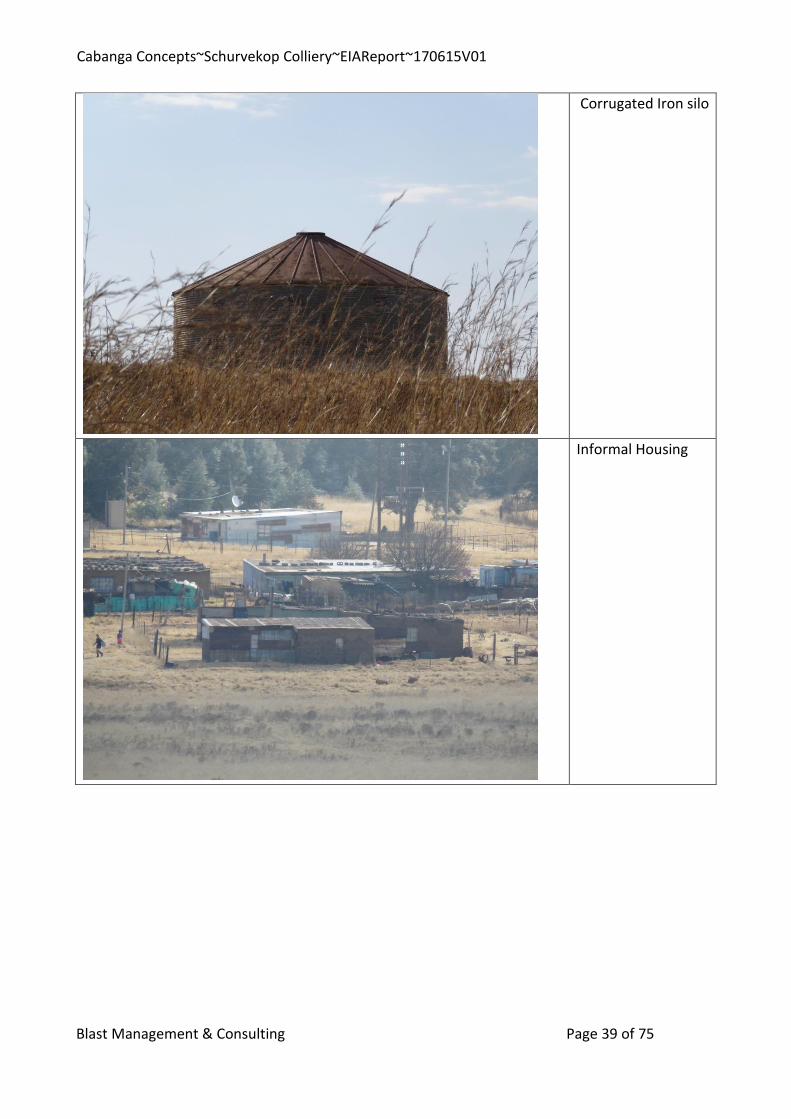
During the site visit the structures were observed and the initial POI list ground-truthed and finalised
as represented in this section. Structures ranged from well-built structures to informal building
styles. Table 6 shows photos of structures found in the area.

Cabanga Concepts~Schurvekop Colliery~EIAReport~170615V01
Blast Management & Consulting Page 37 of 75
Table 6: Structure Profile
Structure Photo Description
Informal Housing
Informal Housing

Cabanga Concepts~Schurvekop Colliery~EIAReport~170615V01
Blast Management & Consulting Page 38 of 75
Farm Animals and
agricultural fields
Structure
Cabanga Concepts~Schurvekop Colliery~EIAReport~170615V01
Blast Management & Consulting Page 39 of 75
Corrugated Iron silo
Informal Housing

Cabanga Concepts~Schurvekop Colliery~EIAReport~170615V01
Blast Management & Consulting Page 40 of 75
Ruins
Building/Structure
partially demolished

Cabanga Concepts~Schurvekop Colliery~EIAReport~170615V01
Blast Management & Consulting Page 41 of 75
View over area of
project
View over area of
project

Cabanga Concepts~Schurvekop Colliery~EIAReport~170615V01
Blast Management & Consulting Page 42 of 75
Mielie fields
Power Lines

Cabanga Concepts~Schurvekop Colliery~EIAReport~170615V01
Blast Management & Consulting Page 43 of 75
Power Lines
15 Construction Phase: Impact Assessment and Mitigation Measures
The Schurvekop Colliery box-cut area is evaluated in detail in the following sections. The planned
underground mine with a box-cut are currently non-operational. Establishment of the box-cut is
considered for this report as part of the construction phase. The main mining operations will be
underground mechanical mining which is considered the operational phase.
The construction phase impact assessment evaluates the expected levels of ground vibration, air
blast and fly rock. The levels and distances are calculated for each influence. The predicted levels
are plotted as amplitude contour maps, evaluated in relation to identified POI and discussed. Where
exceedance of levels is expected mitigation measures are recommended and the impact assessment
is done considering the pre- and post-mitigation measures. As part of the process recommendations
are made that should be considered by the end user.
In all cases ground vibration and air blast was calculated from the edge of the box-cut outline and
modelled accordingly. A worst case is then applicable with calculation from box-cut edge.
15.1 Review of expected ground vibration
Presented herewith are the expected ground vibration level contours and discussion of relevant
influences. Expected ground vibration levels were calculated for each POI identified surrounding the
mining area and evaluated with regards to possible structural concerns and human perception. A
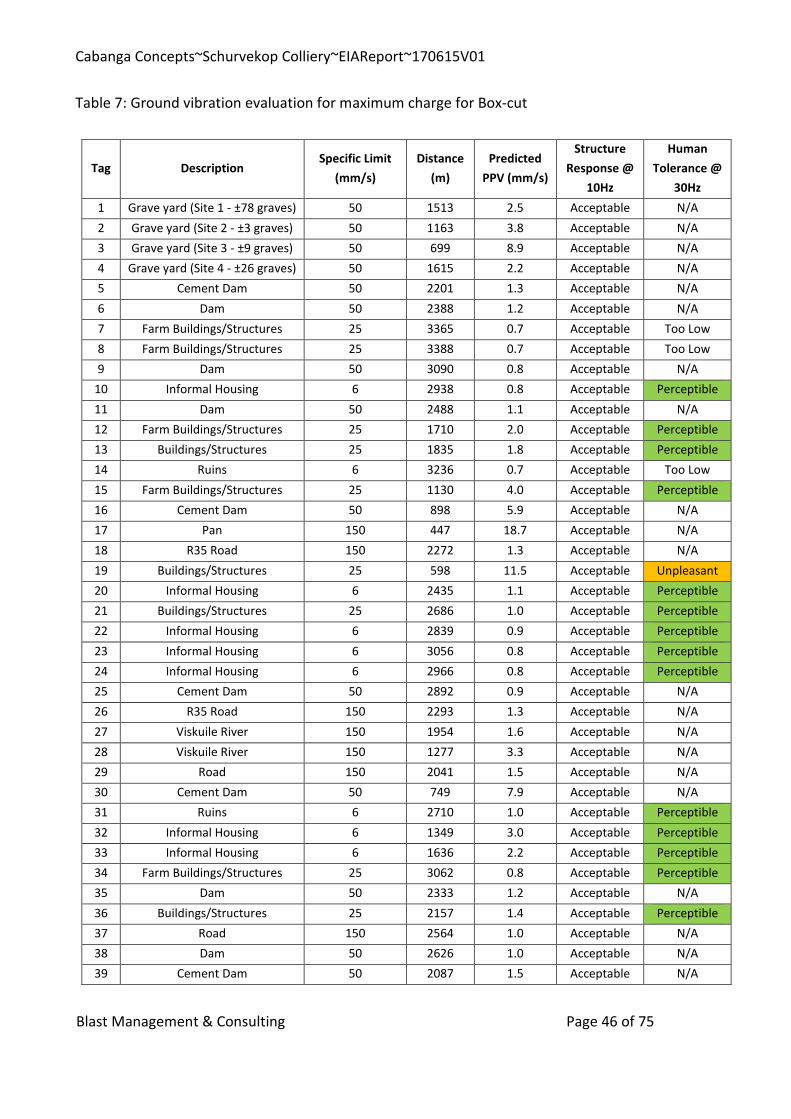
table is provided for the maximum charge model done with regards to:
• “Tag” No. is the number corresponding to the POI figures.

Cabanga Concepts~Schurvekop Colliery~EIAReport~170615V01
Blast Management & Consulting Page 44 of 75
• “Description” indicates the type of the structure.
• “Distance” is the distance between the structure and edge of the box-cut area.
• “Specific Limit” is the maximum limit for ground vibration at the specific structure or
installation.
• “Predicted PPV (mm/s)” is the calculated ground vibration at the structure.
• The “Structure Response @ 10Hz and Human Tolerance @ 30Hz” indicates the possible
concern and if there is any concern for structural damage or potential negative human
perception respectively. Indicators used are “perceptible”,” unpleasant”, “intolerable”
which stems from the human perception information given and indicators such as “high” or
“low” is given for the possibility of damage to a structure. Levels below 0.76 mm/s could be
considered to have low or negligible possibility of influence.
Ground vibration is calculated and modelled for the box-cut area at the minimum and maximum
charge mass at specific distances from the box-cut area. The charge masses applied are according
to blast designs discussed in Section 14. These levels are then plotted and overlaid with current
mining plans to observe possible influences at structures identified. Structures or POI’s for
consideration are also plotted in this model. Ground vibration predictions were done considering
distances ranging from 50 m to 3500 m around the box-cut mining area.
The simulation provided shows ground vibration contours only for a limited number of levels. The
levels used are considered the basic limits that will applicable for the type of structures observed
surrounding the box-cut area. These levels are: 6 mm/s, 12.5 mm/s, 25 mm/s and 50 mm/s. This
enables immediate review of possible concerns that may be applicable to any of the privately owned
structures, social gathering areas or sensitive installations.
Data is provided as follows: Vibration contours; a table with predicted ground vibration values and
evaluation for each POI. Additional colour codes used in the tables are as follows:
Structure Evaluations:
Vibration levels higher than proposed limit applicable to Structures / Installations is coloured
“Red”
People’s Perception Evaluation:
Vibration levels indicated as Intolerable on human perception scale is coloured “Red”
Vibration levels indicated as Unpleasant on human perception scale is coloured “Mustard”
Vibration levels indicated as Perceptible on human perception scale is coloured “Light Green”
POI’s that are found inside the box-cut area is coloured “Olive Green”
Simulations for expected ground vibration levels from minimum and maximum charge mass are
presented below.

Cabanga Concepts~Schurvekop Colliery~EIAReport~170615V01
Blast Management & Consulting Page 45 of 75
• Maximum charge mass per delay 1360 kg – Box-cut
Figure 11: Ground vibration influence from maximum charge for Box-cut Area
Cabanga Concepts~Schurvekop Colliery~EIAReport~170615V01
Blast Management & Consulting Page 46 of 75
Table 7: Ground vibration evaluation for maximum charge for Box-cut
Tag Description Specific Limit
(mm/s)
Distance
(m)
Predicted
PPV (mm/s)
Structure
Response @
10Hz
Human
Tolerance @
30Hz
1 Grave yard (Site 1 - ±78 graves) 50 1513 2.5 Acceptable N/A
2 Grave yard (Site 2 - ±3 graves) 50 1163 3.8 Acceptable N/A
3 Grave yard (Site 3 - ±9 graves) 50 699 8.9 Acceptable N/A
4 Grave yard (Site 4 - ±26 graves) 50 1615 2.2 Acceptable N/A
5 Cement Dam 50 2201 1.3 Acceptable N/A
6 Dam 50 2388 1.2 Acceptable N/A
7 Farm Buildings/Structures 25 3365 0.7 Acceptable Too Low
8 Farm Buildings/Structures 25 3388 0.7 Acceptable Too Low
9 Dam 50 3090 0.8 Acceptable N/A
10 Informal Housing 6 2938 0.8 Acceptable Perceptible
11 Dam 50 2488 1.1 Acceptable N/A
12 Farm Buildings/Structures 25 1710 2.0 Acceptable Perceptible
13 Buildings/Structures 25 1835 1.8 Acceptable Perceptible
14 Ruins 6 3236 0.7 Acceptable Too Low
15 Farm Buildings/Structures 25 1130 4.0 Acceptable Perceptible
16 Cement Dam 50 898 5.9 Acceptable N/A
17 Pan 150 447 18.7 Acceptable N/A
18 R35 Road 150 2272 1.3 Acceptable N/A
19 Buildings/Structures 25 598 11.5 Acceptable Unpleasant
20 Informal Housing 6 2435 1.1 Acceptable Perceptible
21 Buildings/Structures 25 2686 1.0 Acceptable Perceptible
22 Informal Housing 6 2839 0.9 Acceptable Perceptible
23 Informal Housing 6 3056 0.8 Acceptable Perceptible
24 Informal Housing 6 2966 0.8 Acceptable Perceptible
25 Cement Dam 50 2892 0.9 Acceptable N/A
26 R35 Road 150 2293 1.3 Acceptable N/A
27 Viskuile River 150 1954 1.6 Acceptable N/A
28 Viskuile River 150 1277 3.3 Acceptable N/A
29 Road 150 2041 1.5 Acceptable N/A
30 Cement Dam 50 749 7.9 Acceptable N/A
31 Ruins 6 2710 1.0 Acceptable Perceptible
32 Informal Housing 6 1349 3.0 Acceptable Perceptible
33 Informal Housing 6 1636 2.2 Acceptable Perceptible
34 Farm Buildings/Structures 25 3062 0.8 Acceptable Perceptible
35 Dam 50 2333 1.2 Acceptable N/A
36 Buildings/Structures 25 2157 1.4 Acceptable Perceptible
37 Road 150 2564 1.0 Acceptable N/A
38 Dam 50 2626 1.0 Acceptable N/A
39 Cement Dam 50 2087 1.5 Acceptable N/A
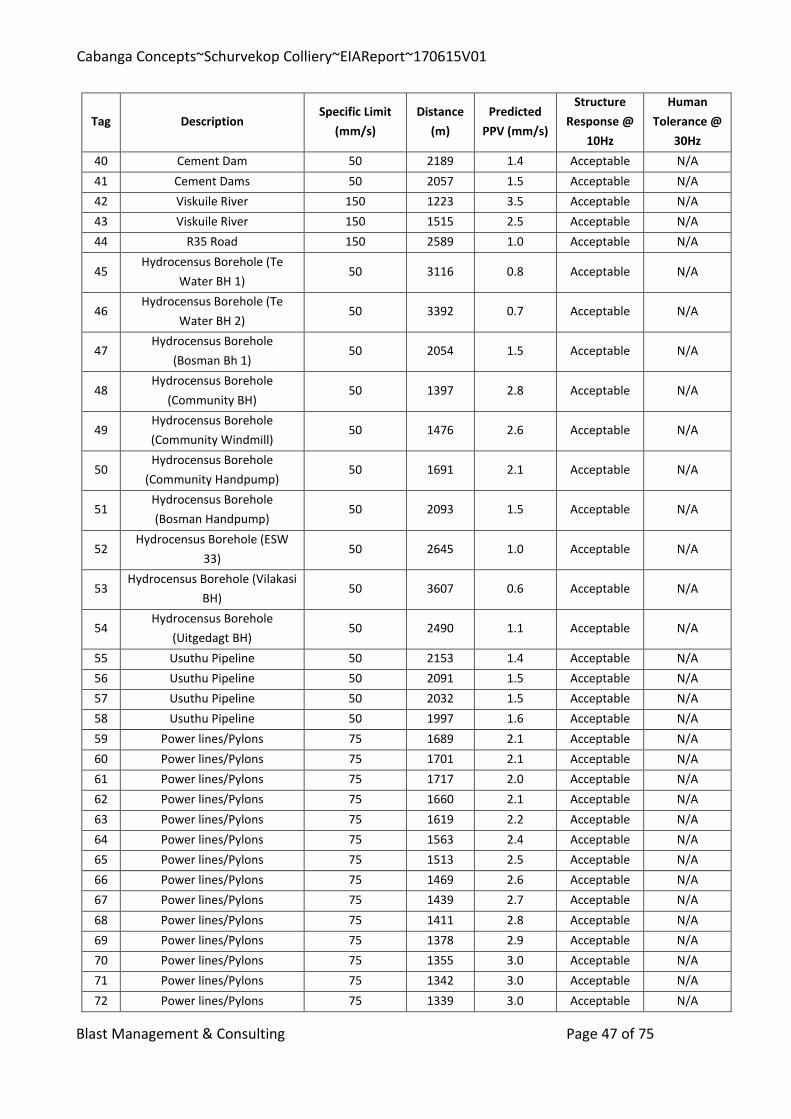
Cabanga Concepts~Schurvekop Colliery~EIAReport~170615V01
Blast Management & Consulting Page 47 of 75
Tag Description Specific Limit
(mm/s)
Distance
(m)
Predicted
PPV (mm/s)
Structure
Response @
10Hz
Human
Tolerance @
30Hz
40 Cement Dam 50 2189 1.4 Acceptable N/A
41 Cement Dams 50 2057 1.5 Acceptable N/A
42 Viskuile River 150 1223 3.5 Acceptable N/A
43 Viskuile River 150 1515 2.5 Acceptable N/A
44 R35 Road 150 2589 1.0 Acceptable N/A
45 Hydrocensus Borehole (Te
Water BH 1) 50 3116 0.8 Acceptable N/A
46 Hydrocensus Borehole (Te
Water BH 2) 50 3392 0.7 Acceptable N/A
47 Hydrocensus Borehole
(Bosman Bh 1) 50 2054 1.5 Acceptable N/A
48 Hydrocensus Borehole
(Community BH) 50 1397 2.8 Acceptable N/A
49 Hydrocensus Borehole
(Community Windmill) 50 1476 2.6 Acceptable N/A
50 Hydrocensus Borehole
(Community Handpump) 50 1691 2.1 Acceptable N/A
51 Hydrocensus Borehole
(Bosman Handpump) 50 2093 1.5 Acceptable N/A
52 Hydrocensus Borehole (ESW
33) 50 2645 1.0 Acceptable N/A
53 Hydrocensus Borehole (Vilakasi
BH) 50 3607 0.6 Acceptable N/A
54 Hydrocensus Borehole
(Uitgedagt BH) 50 2490 1.1 Acceptable N/A
55 Usuthu Pipeline 50 2153 1.4 Acceptable N/A
56 Usuthu Pipeline 50 2091 1.5 Acceptable N/A
57 Usuthu Pipeline 50 2032 1.5 Acceptable N/A
58 Usuthu Pipeline 50 1997 1.6 Acceptable N/A
59 Power lines/Pylons 75 1689 2.1 Acceptable N/A
60 Power lines/Pylons 75 1701 2.1 Acceptable N/A
61 Power lines/Pylons 75 1717 2.0 Acceptable N/A
62 Power lines/Pylons 75 1660 2.1 Acceptable N/A
63 Power lines/Pylons 75 1619 2.2 Acceptable N/A
64 Power lines/Pylons 75 1563 2.4 Acceptable N/A
65 Power lines/Pylons 75 1513 2.5 Acceptable N/A
66 Power lines/Pylons 75 1469 2.6 Acceptable N/A
67 Power lines/Pylons 75 1439 2.7 Acceptable N/A
68 Power lines/Pylons 75 1411 2.8 Acceptable N/A
69 Power lines/Pylons 75 1378 2.9 Acceptable N/A
70 Power lines/Pylons 75 1355 3.0 Acceptable N/A
71 Power lines/Pylons 75 1342 3.0 Acceptable N/A
72 Power lines/Pylons 75 1339 3.0 Acceptable N/A

Cabanga Concepts~Schurvekop Colliery~EIAReport~170615V01
Blast Management & Consulting Page 48 of 75
Tag Description Specific Limit
(mm/s)
Distance
(m)
Predicted
PPV (mm/s)
Structure
Response @
10Hz
Human
Tolerance @
30Hz
73 Power lines/Pylons 75 1345 3.0 Acceptable N/A
74 Power lines/Pylons 75 1346 3.0 Acceptable N/A
75 Power lines/Pylons 75 1350 3.0 Acceptable N/A
76 Power lines/Pylons 75 1364 3.0 Acceptable N/A
77 Power lines/Pylons 75 1386 2.9 Acceptable N/A
78 Power lines/Pylons 75 1416 2.8 Acceptable N/A
79 Power lines/Pylons 75 1455 2.7 Acceptable N/A
80 Power lines/Pylons 75 1500 2.5 Acceptable N/A
81 Power lines/Pylons 75 2845 0.9 Acceptable N/A
82 Power lines/Pylons 75 2909 0.8 Acceptable N/A
83 Power lines/Pylons 75 3004 0.8 Acceptable N/A
84 Power lines/Pylons 75 3104 0.8 Acceptable N/A
85 Power lines/Pylons 75 3202 0.7 Acceptable N/A
86 Power lines/Pylons 75 3300 0.7 Acceptable N/A
87 Power lines/Pylons 75 3392 0.7 Acceptable N/A
88 Power lines/Pylons 75 3499 0.6 Acceptable N/A
89 Power lines/Pylons 75 3462 0.6 Acceptable N/A
90 Power lines/Pylons 75 3373 0.7 Acceptable N/A
91 Power lines/Pylons 75 3285 0.7 Acceptable N/A
92 Power lines/Pylons 75 3199 0.7 Acceptable N/A
93 Power lines/Pylons 75 3133 0.7 Acceptable N/A
94 Power lines/Pylons 75 1742 2.0 Acceptable N/A
95 Power lines/Pylons 75 1829 1.8 Acceptable N/A
96 Power lines/Pylons 75 1917 1.7 Acceptable N/A
97 Power lines/Pylons 75 2000 1.6 Acceptable N/A
98 Power lines/Pylons 75 2033 1.5 Acceptable N/A
99 Power lines/Pylons 75 2069 1.5 Acceptable N/A
100 Power lines/Pylons 75 2123 1.4 Acceptable N/A
101 Power lines/Pylons 75 2191 1.4 Acceptable N/A
102 Power lines/Pylons 75 2252 1.3 Acceptable N/A
103 Power lines/Pylons 75 2322 1.2 Acceptable N/A
104 Power lines/Pylons 75 2299 1.2 Acceptable N/A
105 Power lines/Pylons 75 2269 1.3 Acceptable N/A
106 Power lines/Pylons 75 2092 1.5 Acceptable N/A
107 Power lines/Pylons 75 2247 1.3 Acceptable N/A
108 Power lines/Pylons 75 2300 1.2 Acceptable N/A
109 Power lines/Pylons 75 2376 1.2 Acceptable N/A
110 Power lines/Pylons 75 2448 1.1 Acceptable N/A
111 Power lines/Pylons 75 2525 1.1 Acceptable N/A
112 Power lines/Pylons 75 2589 1.0 Acceptable N/A
113 Power lines/Pylons 75 2645 1.0 Acceptable N/A
114 Power lines/Pylons 75 2708 1.0 Acceptable N/A
115 Power lines/Pylons 75 2835 0.9 Acceptable N/A

Cabanga Concepts~Schurvekop Colliery~EIAReport~170615V01
Blast Management & Consulting Page 49 of 75
Tag Description Specific Limit
(mm/s)
Distance
(m)
Predicted
PPV (mm/s)
Structure
Response @
10Hz
Human
Tolerance @
30Hz
116 Power lines/Pylons 75 2964 0.8 Acceptable N/A
117 Power lines/Pylons 75 3038 0.8 Acceptable N/A
118 Power lines/Pylons 75 3108 0.8 Acceptable N/A
119 Power lines/Pylons 75 3183 0.7 Acceptable N/A
120 Power lines/Pylons 75 3258 0.7 Acceptable N/A
121 Power lines/Pylons 75 3335 0.7 Acceptable N/A
122 Power lines/Pylons 75 3416 0.6 Acceptable N/A
123 Structures 25 2343 1.2 Acceptable Perceptible
15.2 Summary of ground vibration levels
The Box-cut operations were evaluated for expected levels of ground vibration from future blasting
operations. Review of the sites and the surrounding installations / houses / buildings showed that
structures vary in distances from the box-cut area. The influences will also vary with distance from
the specific area. The evaluation considered a distance up to 3500 m from the mining area.
Structures identified outside of the box-cut area ranged from the Farm Buildings, Grave yard, Power
lines, cement dam and Viskuile River that are close to the box-cut and the Usuthu Pipeline that are
relatively far from the Box-cut area. Structure conditions ranged from industrial construction to
poor condition old structures. There is no main concern with regards to ground vibration for these
structures. The nearest public houses are located 598 m from the box-cut boundary. The levels
predicted do show low levels of ground vibration that could be experienced as unpleasant at the
maximum charge on the human perception scale. The ground vibration levels predicted ranged
between 0.6 mm/s and 18.7 mm/s for structures surrounding the box-cut area. Ground vibration
levels at the nearest buildings where people may be present is 11.5 mm/s. None of the structures
considered in the evaluation showed any concern for possible damages.
15.3 Ground Vibration and human perception
Considering the effect of ground vibration with regards to human perception, vibration levels
calculated were applied to an average of 30Hz frequency and plotted with expected human
perceptions on the safe blasting criteria graph (see Figure 12 below). Data applicable to human
response only is plotted. The frequency range selected is the expected average range for
frequencies that will be measured for ground vibration when blasting is done. From Figure 12 it can
be seen that the ground vibration levels predicted is expected to be greater than the perceptible
level but mostly less than the unpleasant level. People at the nearest farmhouse may experience
ground vibration levels as unpleasant. This analysis of vibration levels is only associated with POI’s
where people may live or congregate.

Cabanga Concepts~Schurvekop Colliery~EIAReport~170615V01
Blast Management & Consulting Page 50 of 75
Figure 12: The effect of ground vibration with human perception and vibration limits
15.4 Vibration impact on roads
The R35 Provincial road is located 2272 m from the box-cut area. The expected levels of ground
vibration are well within the limits for this road. No specific actions are required for this road. Gravel
roads linking farm areas are within 2041 m of the box-cut area. These routes are specifically of
concern when blasting is done. There may be people and animals on these routes and will require
careful planning to main safe blasting radius
15.5 Potential that vibration will upset adjacent communities
Ground vibration and air blast generally upset people living in the vicinity of mining operations. The
nearest settlement of people is buildings approximately 598 m from the planned operation. These
settlements are located such that levels of ground vibration predicted may be perceptible and
unpleasant but not damaging.
The importance of good public relations cannot be over-stressed. People tend to react negatively
on experiencing effects from blasting such as ground vibration and air blast. Even at low levels when
damage to structures is out of the question it may upset people. Proper and appropriate
communication with neighbours about blasting, monitoring and control will be required.
6 6
12.5 12.5
3062m 3062m
598m 598m
0.1
1
10
100
1000
1 10 100
Gro
und V
ibra
tio
n (
mm
/s)
Frequency (Hz)
Schurvekop CollieryGround Vibration Limits & Human Perception
Perceptible Unpleasant Intolerable 6mm/s Limit
12.5mm/s Limit Predicted PPV (mm/s) 3062m 598m
Perceptible
Unpleasant
Intolerable
Safe Blasting Zone
Above Limit Zone
Vibration at 30Hz

Cabanga Concepts~Schurvekop Colliery~EIAReport~170615V01
Blast Management & Consulting Page 51 of 75
15.6 Review of expected air blast
Presented herewith are the expected air blast level contours and discussion of relevant influences.
Expected air blast levels were calculated for each POI identified surrounding the mining area and
evaluated with regards to possible structural concerns. A table is provided for the maximum charge
model done with regards to:
• “Tag” No. is number corresponding to the location indicated on POI figures.
• “Description” indicates the type of the structure.
• “Distance” is the distance between the structure and edge of the box-cut area.
• “Air Blast (dB)” is the calculated air blast level at the structure.
• “Possible concern” indicates if there is any concern for structural damage or human
perception. Indicators used are:
o “Problematic" where there is real concern for possible damage – at levels greater
than 134 dB.
o “Complaint” where people will be complaining due to the experienced effect on
structures at levels of 120 dB and higher (not necessarily damaging).
o “Acceptable” if levels are less than 120 dB.
o “Low” where there is very limited possibility that the levels will give rise to any
influence on people or structures. Levels below 115 dB could be considered to have
low or negligible possibility of influence.
Presented are simulations for expected air blast levels from the maximum charge mass at the box-
cut area. Colour codes used in tables are as follows:
Air blast levels higher than proposed limit is coloured “Red”
Air blast levels indicated as possible Complaint is coloured “Mustard”
POI’s that are found inside the pit area is coloured “Olive Green”

Cabanga Concepts~Schurvekop Colliery~EIAReport~170615V01
Blast Management & Consulting Page 52 of 75
• Maximum charge per delay 1360 kg – Box-cut Area
Figure 13: Air blast influence from maximum charge for Box-cut Area

Cabanga Concepts~Schurvekop Colliery~EIAReport~170615V01
Blast Management & Consulting Page 53 of 75
Table 8: Air blast evaluation for maximum charge
Tag Description Distance (m) Air blast (dB) Possible Concern?
1 Grave yard (Site 1 - ±78 graves) 1513 123.9 N/A
2 Grave yard (Site 2 - ±3 graves) 1163 126.2 N/A
3 Grave yard (Site 3 - ±9 graves) 699 130.5 N/A
4 Grave yard (Site 4 - ±26 graves) 1615 123.4 N/A
5 Cement Dam 2201 120.8 N/A
6 Dam 2388 120.1 N/A
7 Farm Buildings/Structures 3365 117.3 Acceptable
8 Farm Buildings/Structures 3388 117.2 Acceptable
9 Dam 3090 118.0 N/A
10 Informal Housing 2938 118.4 Acceptable
11 Dam 2488 119.8 N/A
12 Farm Buildings/Structures 1710 122.9 Complaint
13 Buildings/Structures 1835 122.3 Complaint
14 Ruins 3236 117.6 Acceptable
15 Farm Buildings/Structures 1130 126.4 Complaint
16 Cement Dam 898 128.3 N/A
17 Pan 447 134.2 N/A
18 R35 Road 2272 120.5 N/A
19 Buildings/Structures 598 131.8 Complaint
20 Informal Housing 2435 120.0 Acceptable
21 Buildings/Structures 2686 119.1 Acceptable
22 Informal Housing 2839 118.6 Acceptable
23 Informal Housing 3056 118.1 Acceptable
24 Informal Housing 2966 118.3 Acceptable
25 Cement Dam 2892 118.5 N/A
26 R35 Road 2293 120.5 N/A
27 Viskuile River 1954 121.8 N/A
28 Viskuile River 1277 125.4 N/A
29 Road 2041 121.4 N/A
30 Cement Dam 749 129.9 N/A
31 Ruins 2710 119.0 Acceptable
32 Informal Housing 1349 124.9 Complaint
33 Informal Housing 1636 123.3 Complaint
34 Farm Buildings/Structures 3062 118.0 Acceptable
35 Dam 2333 120.3 N/A
36 Buildings/Structures 2157 121.0 Complaint
37 Road 2564 119.5 N/A
38 Dam 2626 119.3 N/A
39 Cement Dam 2087 121.3 N/A
40 Cement Dam 2189 120.9 N/A
41 Cement Dams 2057 121.4 N/A

Cabanga Concepts~Schurvekop Colliery~EIAReport~170615V01
Blast Management & Consulting Page 54 of 75
Tag Description Distance (m) Air blast (dB) Possible Concern?
42 Viskuile River 1223 125.8 N/A
43 Viskuile River 1515 123.9 N/A
44 R35 Road 2589 119.5 N/A
45 Hydrocensus Borehole (Te Water BH 1) 3116 117.9 N/A
46 Hydrocensus Borehole (Te Water BH 2) 3392 117.1 N/A
47 Hydrocensus Borehole (Bosman Bh 1) 2054 121.4 N/A
48 Hydrocensus Borehole (Community BH) 1397 124.6 N/A
49 Hydrocensus Borehole (Community
Windmill) 1476 124.2 N/A
50 Hydrocensus Borehole (Community
Handpump) 1691 123.0 N/A
51 Hydrocensus Borehole (Bosman Handpump) 2093 121.2 N/A
52 Hydrocensus Borehole (ESW 33) 2645 119.3 N/A
53 Hydrocensus Borehole (Vilakasi BH) 3607 116.7 N/A
54 Hydrocensus Borehole (Uitgedagt BH) 2490 119.8 N/A
55 Usuthu Pipeline 2153 121.0 N/A
56 Usuthu Pipeline 2091 121.3 N/A
57 Usuthu Pipeline 2032 121.5 N/A
58 Usuthu Pipeline 1997 121.6 N/A
59 Power lines/Pylons 1689 123.0 N/A
60 Power lines/Pylons 1701 123.0 N/A
61 Power lines/Pylons 1717 122.9 N/A
62 Power lines/Pylons 1660 123.2 N/A
63 Power lines/Pylons 1619 123.4 N/A
64 Power lines/Pylons 1563 123.7 N/A
65 Power lines/Pylons 1513 123.9 N/A
66 Power lines/Pylons 1469 124.2 N/A
67 Power lines/Pylons 1439 124.4 N/A
68 Power lines/Pylons 1411 124.5 N/A
69 Power lines/Pylons 1378 124.7 N/A
70 Power lines/Pylons 1355 124.9 N/A
71 Power lines/Pylons 1342 125.0 N/A
72 Power lines/Pylons 1339 125.0 N/A
73 Power lines/Pylons 1345 124.9 N/A
74 Power lines/Pylons 1346 124.9 N/A
75 Power lines/Pylons 1350 124.9 N/A
76 Power lines/Pylons 1364 124.8 N/A
77 Power lines/Pylons 1386 124.7 N/A
78 Power lines/Pylons 1416 124.5 N/A
79 Power lines/Pylons 1455 124.3 N/A
80 Power lines/Pylons 1500 124.0 N/A
81 Power lines/Pylons 2845 118.6 N/A
82 Power lines/Pylons 2909 118.5 N/A
83 Power lines/Pylons 3004 118.2 N/A
84 Power lines/Pylons 3104 117.9 N/A
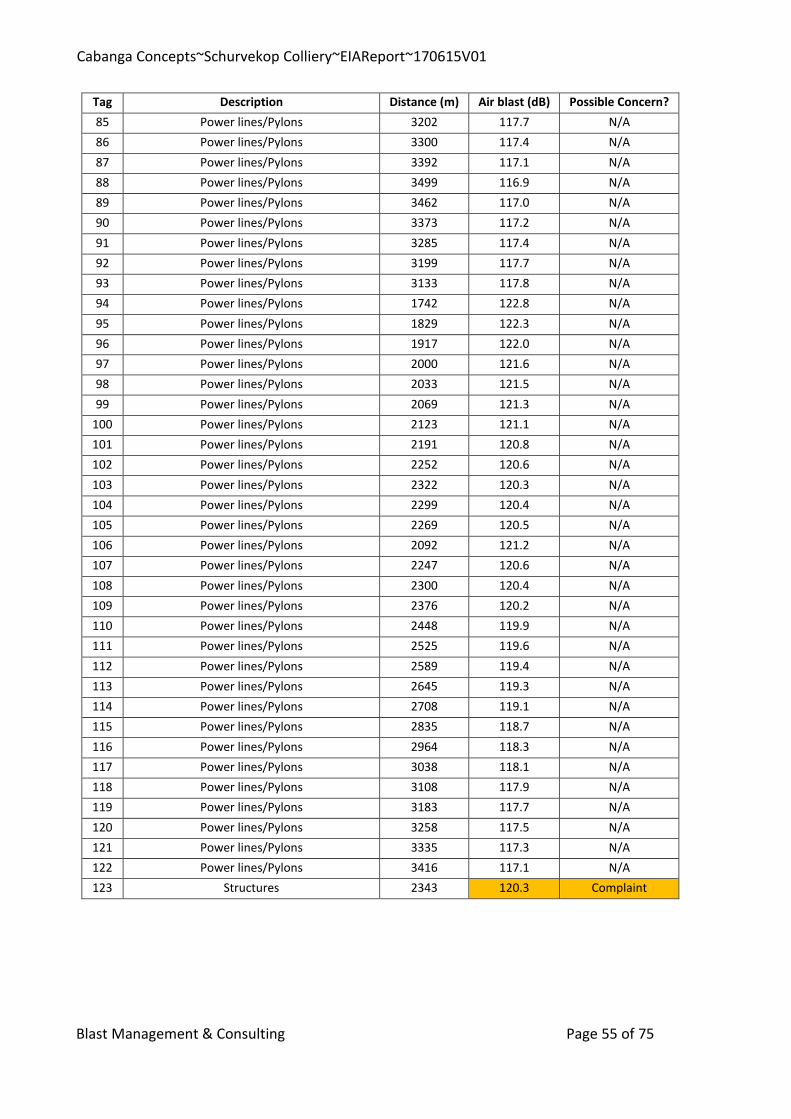
Cabanga Concepts~Schurvekop Colliery~EIAReport~170615V01
Blast Management & Consulting Page 55 of 75
Tag Description Distance (m) Air blast (dB) Possible Concern?
85 Power lines/Pylons 3202 117.7 N/A
86 Power lines/Pylons 3300 117.4 N/A
87 Power lines/Pylons 3392 117.1 N/A
88 Power lines/Pylons 3499 116.9 N/A
89 Power lines/Pylons 3462 117.0 N/A
90 Power lines/Pylons 3373 117.2 N/A
91 Power lines/Pylons 3285 117.4 N/A
92 Power lines/Pylons 3199 117.7 N/A
93 Power lines/Pylons 3133 117.8 N/A
94 Power lines/Pylons 1742 122.8 N/A
95 Power lines/Pylons 1829 122.3 N/A
96 Power lines/Pylons 1917 122.0 N/A
97 Power lines/Pylons 2000 121.6 N/A
98 Power lines/Pylons 2033 121.5 N/A
99 Power lines/Pylons 2069 121.3 N/A
100 Power lines/Pylons 2123 121.1 N/A
101 Power lines/Pylons 2191 120.8 N/A
102 Power lines/Pylons 2252 120.6 N/A
103 Power lines/Pylons 2322 120.3 N/A
104 Power lines/Pylons 2299 120.4 N/A
105 Power lines/Pylons 2269 120.5 N/A
106 Power lines/Pylons 2092 121.2 N/A
107 Power lines/Pylons 2247 120.6 N/A
108 Power lines/Pylons 2300 120.4 N/A
109 Power lines/Pylons 2376 120.2 N/A
110 Power lines/Pylons 2448 119.9 N/A
111 Power lines/Pylons 2525 119.6 N/A
112 Power lines/Pylons 2589 119.4 N/A
113 Power lines/Pylons 2645 119.3 N/A
114 Power lines/Pylons 2708 119.1 N/A
115 Power lines/Pylons 2835 118.7 N/A
116 Power lines/Pylons 2964 118.3 N/A
117 Power lines/Pylons 3038 118.1 N/A
118 Power lines/Pylons 3108 117.9 N/A
119 Power lines/Pylons 3183 117.7 N/A
120 Power lines/Pylons 3258 117.5 N/A
121 Power lines/Pylons 3335 117.3 N/A
122 Power lines/Pylons 3416 117.1 N/A
123 Structures 2343 120.3 Complaint

Cabanga Concepts~Schurvekop Colliery~EIAReport~170615V01
Blast Management & Consulting Page 56 of 75
15.7 Summary of findings for air blast
Air blast levels predicted for the maximum charge ranges between 116.7 and 131.8 dB for all the
POI’s considered. This includes the nearest points such as the Buildings and Farm Buildings. These
levels may contribute to effects such as rattling of roofs or door or windows but are not expected
to be damaging. As indicated above there is a high probability that effects due to air blast could lead
to complaints. The current accepted limit on air blast is 134 dB. Damages are only expected to occur
at levels greater than 134dB. Levels from prediction done indicate that air blast will only be greater
than 134 dB at distance of 447 m from the box-cut boundary. There are no private structures in this
area that are of concern. All private structures are further away. The nearest buildings are 598 m
from the box-cut boundary. Infrastructure such as the Pan and Graveyard are close to the box-cut
boundary but air blast does not have any influence on these installations.
Complaints from air blast are normally based on the actual effects that are experienced due to
rattling of roof, windows, doors etc. These effects could startle people and raise concern of possible
damage.
The calculations for air blast is based on the use of basic rules for stemming length and stemming
material. It is maintained that if stemming control is not exercised this effect could be greater with
greater range of complaints or damage. The box-cut is located such that “free blasting” – meaning
no controls on blast preparation – will not be possible.
15.8 Fly-rock unsafe zone
The occurrence of fly rock in any form will have a negative impact if found to travel outside the
unsafe zone. This unsafe zone may be anything between 10m or 1000m. A general unsafe zone is
normally considered to be within a radius of 500 m from the blast; but needs to be qualified and
determined as best possible.
Calculations are used to help and assist determining safe distances. A safe distance from blasting is
calculated following rules and guidelines from the International Society of Explosives Engineers
(ISEE) Blasters Handbook. Using this calculation the minimum safe distances can be determined that
should be cleared of people, animals and equipment. Figure 14 shows the results from the ISEE
calculations for fly rock range based on a 140 mm diameter blast hole and 3.5 m stemming length.
Based on these values a possible fly rock range with a safety factor of 2 was calculated to be 172 m.
The absolute minimum unsafe zone is then the 172 m. This calculation is a guideline and any
distance cleared should not be less. The occurrence of fly rock can however never be 100% excluded.
Best practices should be implemented at all times. The occurrence of fly rock can be mitigated but

Cabanga Concepts~Schurvekop Colliery~EIAReport~170615V01
Blast Management & Consulting Page 57 of 75
the possibility of the occurrence there of can never be eliminated. Figure 15 shows the area around
the box-cut that incorporates the 172 m unsafe zone.
Figure 14: Fly rock prediction calculation
172
0
50
100
150
200
250
300
350
400
450
500
1 1.5 2 2.5 3 3.5 4 4.5 5
Th
row
Dis
tan
ce
(m
)
Burden / Stemming Length (m)
Schurvekop Colliery Project - Overburden Blast Fly RockMaximum Throw Distance vs Burden/Stemming Height
Actual Stemming Fly Rock Calc - ISEE Fly Rock Calc - ISEE

Cabanga Concepts~Schurvekop Colliery~EIAReport~170615V01
Blast Management & Consulting Page 58 of 75
Figure 15: Predicted fly rock Exclusion Zone

Cabanga Concepts~Schurvekop Colliery~EIAReport~170615V01
Blast Management & Consulting Page 59 of 75
Review of the calculated unsafe zone showed no POI’s within the unsafe zone
15.9 Noxious fumes
The occurrence of fumes in the form the NOx gas is not a given and very dependent on various
factors as discussed in Section 13.6. However, the occurrence of fumes should be closely monitored.
Furthermore, nothing can be stated as to fume dispersal to nearby farmsteads, but if anybody is
present in the path of the fume cloud it could be problematic.
15.10 Water borehole influence
Boreholes for water were evaluated for possible influence from blasting. Ten Hydrocensus
boreholes were provided that could possibly be influenced due to excessive ground vibration at
maximum charge. The expected levels of ground vibration for the ten boreholes inside the area
evaluated are well within the limit applied for water boreholes. Table 9 shows the identified
boreholes. Figure 16 shows the location of the boreholes in the area. The limit for boreholes of 50
mm/s is expected at a distance of 246 m from the blast. None of the boreholes are closer than 1397
m.
Table 9: Identified Boreholes
Tag Description -Y -X Specific Limit
(mm/s) Distance (m)
Predicted PPV
(mm/s)
45
Hydrocensus
Borehole (Te Water
BH 1)
-51002.04 2909891.01 50 3116 0.8
46
Hydrocensus
Borehole (Te Water
BH 2)
-51502.15 2909692.94 50 3392 0.7
47
Hydrocensus
Borehole (Bosman Bh
1)
-50154.32 2906006.74 50 2054 1.5
48
Hydrocensus
Borehole
(Community BH)
-49699.76 2908768.75 50 1397 2.8
49
Hydrocensus
Borehole
(Community
Windmill)
-49632.50 2908943.92 50 1476 2.6
50 Hydrocensus
Borehole -49678.76 2909181.08 50 1691 2.1

Cabanga Concepts~Schurvekop Colliery~EIAReport~170615V01
Blast Management & Consulting Page 60 of 75
Tag Description -Y -X Specific Limit
(mm/s) Distance (m)
Predicted PPV
(mm/s)
(Community
Handpump)
51
Hydrocensus
Borehole (Bosman
Handpump)
-49168.52 2909856.22 50 2093 1.5
52 Hydrocensus
Borehole (ESW 33) -48983.19 2910449.51 50 2645 1.0
53
Hydrocensus
Borehole (Vilakasi
BH)
-47989.48 2911372.18 50 3607 0.6
54
Hydrocensus
Borehole (Uitgedagt
BH)
-46227.43 2908469.68 50 2490 1.1
Figure 16: Location of the Boreholes
15.11 Potential Environmental Impact Assessment: Operational Phase
The following is the impact assessment of the various concerns covered by this report. The matrix
below in Table 10 was used for analysis and evaluation of aspects discussed in this report. The before

Cabanga Concepts~Schurvekop Colliery~EIAReport~170615V01
Blast Management & Consulting Page 61 of 75
mitigation and after mitigation outcome of the analysis is provided in Table 11. This risk assessment
is a one-sided analysis and needs to be discussed with role players in order to obtain a proper
outcome and mitigation.
Table 10: Evaluation matrix criteria
The status of the impact
Status Description
Positive: a benefit to the holistic environment
Negative: a cost to the holistic environment
Neutral: no cost or benefit
The duration of the impact
Score
Duration Description
1 Short term Less than 2 years
2 Short to medium term
2 – 5 years
3 Medium term 6 – 25 years
4 Long term 26 – 45 years
5 Permanent 46 years or more
The extent of the impact
Score
Extent Description
1 Site specific Within the site boundary
2 Local Affects immediate surrounding areas
3 Regional Extends substantially beyond the site boundary
4 Provincial Extends to almost entire province or larger region
5 National Affects country or possibly world
The reversibility of the impact
Score
Reversibility Description
1 Completely reversible
Reverses with minimal rehabilitation & negligible residual affects
3 Reversible Requires mitigation and rehabilitation to ensure reversibility
5 Irreversible Cannot be rehabilitated completely/rehabilitation not viable
The magnitude (severe or beneficial) of the impact
Score
Severe/beneficial effect
Description
1 Slight Little effect - negligible disturbance/benefit
2 Slight to moderate
Effects observable - environmental impacts reversible with time
3 Moderate Effects observable - impacts reversible with rehabilitation
4 Moderate to high
Extensive effects - irreversible alteration to the environment
5 High Extensive permanent effects with irreversible alteration
The probability of the impact
Score
Rating Description
1 Unlikely Less than 15% sure of an impact occurring
2 Possible Between 15% and 40% sure of an impact occurring
3 Probable Between 40% and 60% sure that the impact will occur
4 Highly Probable Between 60% and 85% sure that the impact will occur
5 Definite Over 85% sure that the impact will occur

Cabanga Concepts~Schurvekop Colliery~EIAReport~170615V01
Blast Management & Consulting Page 62 of 75
The Consequence = Magnitude + Spatial Scale + Duration + Reversibility.
The Significance = Consequence x Probability.
The rating is described as follows:
Score out of 100 Significance
1 to 20 Low
21 to 40 Moderate to Low
41 to 60 Moderate
61 to 80 Moderate to high
81 to 100 High
Degree of loss of resource is rated as follows:
Low degree of loss
Where the resource will recover on its own with no/limited rehabilitation over an observable period of time;
Moderate degree of loss
Where the resource will recover over extended period or with rehabilitation or remedial measures to assist recovery of resource; and
High degree of loss
Where the resource cannot be recovered, or the resource will recover over extended time periods.

Cabanga Concepts~Schurvekop Colliery~EIAReport~170615V01
Blast Management & Consulting Page 63 of 75
Table 11: Risk assessment outcome before mitigation
Activity Impact Applicable Mine Phase ST
ATU
S
Mag
nit
ud
e
Exte
nt
Du
rati
on
Re
vers
ibili
ty
CO
NSE
QU
ENC
E
PR
OB
AB
ILIT
Y
SIG
NIF
ICA
NC
E (p
re-m
itig
atio
n)
Mit
igat
ion
De
gre
e o
f lo
ss o
f re
sou
rce
Mitigation Standard to be achieved
Mag
nit
ud
e
Exte
nt
Du
rati
on
Re
vers
ibili
ty
CO
NSE
QU
ENC
E
PR
OB
AB
ILIT
Y
SIG
NIF
ICA
NC
E (p
ost
-mit
igat
ion
)
Compliance with standards
Time periods for implementation
Functional requirements for monitoring
Responsible person
Bla
stin
g
Gro
un
d v
ibra
tio
n Im
pac
t o
n h
ou
ses
Co
nst
ruct
ion
Neg
ativ
e
1 2 1 1 5 2 10 N 1
No specific Mitigation is required. It is
recommended that good blasting
practise is applied, blast
designs reviewed prior to drilling, re-conformation of expected
levels of ground
vibration.
USB
M C
rite
ria
for
safe
bla
stin
g
1 2 1 1 5 2 10
USB
M
Du
rin
g d
evel
op
men
t o
f th
e b
ox-
cut
Mo
nit
ori
ng
of
gro
un
d v
ibra
tio
n a
nd
air
b
last
, vid
eo o
f th
e b
last
fo
r fl
y ro
ck.
Co
ntr
act
Bla
ster
Bla
stin
g
Gro
un
d v
ibra
tio
n
Imp
act
on
Bo
reh
ole
s
Co
nst
ruct
ion
Neg
ativ
e
1 2 1 1 5 1 5 N 1 1 2 1 1 5 1 5

Cabanga Concepts~Schurvekop Colliery~EIAReport~170615V01
Blast Management & Consulting Page 64 of 75
Bla
stin
g
Gro
un
d v
ibra
tio
n
Imp
act
on
gra
ves
Co
nst
ruct
ion
Neg
ativ
e
1 2 1 1 5 1 5 N 1 1 2 1 1 5 1 5
Bla
stin
g
Gro
un
d v
ibra
tio
n
Imp
act
on
Pyl
on
s
Co
nst
ruct
ion
Neg
ativ
e 1 2 1 1 5 1 5 N 1 1 2 1 1 5 1 5
Bla
stin
g
Gro
un
d v
ibra
tio
n
Imp
act
on
Pip
elin
e
Co
nst
ruct
ion
Neg
ativ
e
1 2 1 1 5 1 5 N 1 1 2 1 1 5 1 5
Bla
stin
g
Gro
un
d v
ibra
tio
n
Imp
act
on
Ro
ads
Co
nst
ruct
ion
Neg
ativ
e
1 2 1 1 5 1 5 N 1 1 2 1 1 5 1 5
Bla
stin
g
Air
bla
st Im
pac
t o
n
ho
use
s
Co
nst
ruct
ion
Neg
ativ
e
2 2 1 1 6 3 18 N 1 2 2 1 1 6 3 18

Cabanga Concepts~Schurvekop Colliery~EIAReport~170615V01
Blast Management & Consulting Page 65 of 75
Bla
stin
g
Air
Bla
st Im
pac
t o
n
Bo
reh
ole
s
Co
nst
ruct
ion
Neg
ativ
e
0 2 1 1 4 0 0 N 1 0 2 1 1 4 0 0
Bla
stin
g
Air
Bla
st Im
pac
t o
n
grav
es
Co
nst
ruct
ion
Neg
ativ
e 0 2 1 1 4 0 0 N 1 0 2 1 1 4 0 0
Bla
stin
g
Air
Bla
st Im
pac
t o
n
Pyl
on
s
Co
nst
ruct
ion
Neg
ativ
e
0 2 1 1 4 0 0 N 1 0 2 1 1 4 0 0
Bla
stin
g
Air
Bla
st Im
pac
t o
n
Pip
elin
e
Co
nst
ruct
ion
Neg
ativ
e
0 2 1 1 4 0 0 N 1 0 2 1 1 4 0 0
Bla
stin
g
Air
Bla
st Im
pac
t o
n
Ro
ads
Co
nst
ruct
ion
Neg
ativ
e
0 2 1 1 4 0 0 N 1 0 2 1 1 4 0 0

Cabanga Concepts~Schurvekop Colliery~EIAReport~170615V01
Blast Management & Consulting Page 66 of 75
Bla
stin
g
Fly
rock
Imp
act
on
h
ou
ses
Co
nst
ruct
ion
Neg
ativ
e
1 2 1 1 5 1 5 N 1 1 2 1 1 5 1 5
Bla
stin
g
Fly
rock
Imp
act
on
B
ore
ho
les
Co
nst
ruct
ion
Neg
ativ
e 0 2 1 1 4 0 0 N 1 0 2 1 1 4 0 0
Bla
stin
g
Fly
rock
Imp
act
on
gr
aves
Co
nst
ruct
ion
Neg
ativ
e
0 2 1 1 4 0 0 N 1 0 2 1 1 4 0 0
Bla
stin
g
Fly
rock
Imp
act
on
P
ylo
ns
Co
nst
ruct
ion
Neg
ativ
e
0 2 1 1 4 0 0 N 1 0 2 1 1 4 0 0
Bla
stin
g
Fly
rock
Imp
act
on
P
ipel
ine
Co
nst
ruct
ion
Neg
ativ
e
0 2 1 1 4 0 0 N 1 0 2 1 1 4 0 0

Cabanga Concepts~Schurvekop Colliery~EIAReport~170615V01
Blast Management & Consulting Page 67 of 75
Bla
stin
g
Fly
rock
Imp
act
on
R
oad
s
Co
nst
ruct
ion
Neg
ativ
e
0 2 1 1 4 0 0 N 1 0 2 1 1 4 0 0

Cabanga Concepts~Schurvekop Colliery~EIAReport~170615V01
Blast Management & Consulting Page 68 of 75
15.12 Mitigations
Evaluation of the effects from blasting operations for this project does not show specific mitigations
to be done. The design used is based on best practise and is a good guideline to be used during the
construction of the box-cut.
There are no specific ground vibration concerns on installations close to the box-cut area. There are
also no specific damage concerns with regards to air blast. It is however advised that control on
stemming will still need to be done properly not to experience adverse air blast levels that could
cause problems.
16 Operational Phase: Impact Assessment and Mitigation Measures
There is no operational phase evaluation done for this project in this report. The underground mine
is the operational phase and mining will be done mechanically. No drilling and blasting is anticipated
as part of the operational phase.
17 Closure Phase: Impact Assessment and Mitigation Measures
During the closure phase no mining, drilling and blasting operations are expected. It is uncertain if
any blasting will be done for demolition. If any demolition blasting will be required it will be
reviewed as civil blasting and addressed accordingly.
18 Alternatives (Comparison and Recommendation)
No specific alternative mining methods are currently under discussion or considered for drilling and
blasting.
19 Monitoring
A monitoring programme for recording blasting operations is recommended. This process will be
mainly for the development of the box-cut. The following elements should be part of such a
monitoring program:
• Ground vibration and air blast results
• Blast Information summary
• Meteorological information at time of the blast
• Video Recording of the blast
• Fly rock observations

Cabanga Concepts~Schurvekop Colliery~EIAReport~170615V01
Blast Management & Consulting Page 69 of 75
Most of the above aspects do not require specific locations of monitoring. Ground vibration and air
blast monitoring requires identified locations for monitoring. Monitoring of ground vibration and
air blast is done to ensure that the generated levels of ground vibration and air blast comply with
recommendations. Proposed positions were selected to indicate the nearest points of interest at
which levels of ground vibration and air blast should be within the accepted norms and standards
as proposed in this report. The monitoring of ground vibration will also qualify the expected ground
vibration and air blast levels and assist in mitigating these aspects properly. This will also contribute
to proper relationships with the neighbours. Three monitoring positions were identified around the
mining area. Monitoring positions are indicated in Figure 17 and Table 12 lists the positions with
coordinates. These points will need to be re-defined with the initial first blast and consider the final
blast design that will be applicable.
Figure 17: Monitoring Positions suggested for the Box-cut.
Table 12: List of possible monitoring positions
Tag Description Y X
3 Grave yard (Site 3 - ±9 graves) -49041.69 2906861.78
5 Cement Dam -49395.35 2905389.76
19 Buildings/Structures -47989.25 2907390.67

Cabanga Concepts~Schurvekop Colliery~EIAReport~170615V01
Blast Management & Consulting Page 70 of 75
20 Recommendations
The following recommendations are proposed.
20.1 Regulatory requirements
Regulatory requirements indicate specific requirements for all non-mining structures and
installations within 500 m from the mining operation. No such structures are observed within the
500 m.
20.2 Blast Designs
The blast designs used in this report forms part of the initial consideration of blasting operations. In
this evaluation there is scope to review the final blast designs to be used. It is then highly
recommended that this blast design be reviewed and a detail blasting code of practice be prepared
and accepted for the development of the box-cut. Designing of blasts must consider the location of
the blast and location of surface structures. The expected levels of ground vibration and air blast
must be considered and calculated for the nearest surface structures. The design must consider final
pattern, charging configurations and timing of the blast.
20.3 Safe blasting distance and evacuation
Calculated minimum safe distance is 172 m. This is the estimated area that must be cleared at least
around a blast before firing. General evacuation used in the mining industry is at least 500 m from
any blast. This may be further in some cases. The final blast designs that may be used will determine
the final decision on safe distance to evacuate people and animals. This distance may be greater
pending the final code of practice of the mine and responsible blaster’s decision on safe distance.
The blaster has a legal obligation concerning the safe distance and he needs to determine this
distance.
20.4 Road Closure
There are farm roads in the vicinity of the box-cut area that will need to be considered to ensure
safety of these road users at time of blasting. These roads must be closed during blasting.
20.5 Recommended ground vibration and air blast levels
The ground vibration and air blast levels limits recommended for blasting operations in this area are
provided in Table 13.

Cabanga Concepts~Schurvekop Colliery~EIAReport~170615V01
Blast Management & Consulting Page 71 of 75
Table 13: Recommended ground vibration air blast limits
Structure Description Ground Vibration Limit (mm/s) Air Blast Limit (dBL)
National Roads/Tar Roads: 150 N/A
Electrical Lines: 75 N/A
Railway: 150 N/A
Transformers 25 N/A
Water Wells 50 N/A
Telecoms Tower 50 134
General Houses of proper construction USBM Criteria or 25 mm/s Shall not exceed 134dB at point
of concern but 120 dB preferred Houses of lesser proper construction 12.5
Rural building – Mud houses 6
20.6 Blasting times
A further consideration of blasting times is when weather conditions could influence the effects
yielded by blasting operations. It is recommended not to blast too early in the morning when it is
still cool or when there is a possibility of atmospheric inversion or too late in the afternoon in winter.
Do not blast in fog. Do not blast in the dark. Refrain from blasting when wind is blowing strongly in
the direction of an outside receptor. Do not blast with low overcast clouds. These ‘do nots’ stem
from the influence that weather has on air blast. The energy of air blast cannot be increased but it
is distributed differently and therefore is difficult to mitigate.
It is recommended that a standard blasting time is fixed and blasting notice boards setup at various
routes around the project area that will inform the community of blasting dates and times.
20.7 Third party monitoring
Third party consultation and monitoring should be considered for all ground vibration and air blast
monitoring work. This will bring about unbiased evaluation of levels and influence from an
independent group. Monitoring could be done using permanent installed stations. Audit functions
may also be conducted to assist the mine in maintaining a high level of performance with regards
to blast results and the effects related to blasting operations.
21 Knowledge Gaps
The data provided from client and information gathered was sufficient to conduct this study.
Surface surroundings change continuously and this should be taken into account prior to initial
blasting operations considered. This report may need to be reviewed and update if necessary. This
report is based on data provided and internationally accepted methods and methodology used for
calculations and predictions.

Cabanga Concepts~Schurvekop Colliery~EIAReport~170615V01
Blast Management & Consulting Page 72 of 75
22 Conclusion
Blast Management & Consulting (BM&C) was contracted as part of the Environmental Impact
Assessment (EIA) to perform an initial review of possible impacts with regards to blasting operations
in the proposed Schurvekop Colliery located in the Mpumalanga Province of South Africa. Ground
vibration, air blast, fly rock and fumes are some of the aspects resulting from blasting operations.
The report concentrates on the possible influences of ground vibration, air blast and fly rock. It
intends to provide information, calculations, predictions, possible influences and mitigation of
blasting operations for this project.
The evaluation of effects yielded by blasting operations was evaluated over an area as wide as 3500
m. The range of structures observed and considered in this evaluation ranged between industrial
structures, farm buildings, Graves, Heritage structures and the Usuthu Pipeline. The proposed
surface infrastructure includes a box-cut adit, stockpile area, plant area, integrated mine residue
dump, workshops, change house, administration facilities and associated infrastructure. This project
is a greenfields project with no existing blasting operations.
The project area does not have people or houses at very close distance to the project area. The
nearest house or buildings is found 598 m away. The expected levels of ground vibration and air
blast for the proposed blasting operations yielded levels within the required limits. No specific
mitigation will be required other than applying best practice blast preparations.
The nearest public houses are located 598 m from the box-cut boundary. The levels predicted do
show low levels of ground vibration that could be experienced as unpleasant at the maximum
charge on the human perception scale. The ground vibration levels predicted for all installations
evaluated surrounding the box-cut area ranged between 0.6 mm/s and 18.7 mm/s. Ground vibration
levels at the nearest buildings where people may be present is 11.5 mm/s. None of the structures
considered in the evaluation showed any concern for possible damages.
Air blast predicted for the maximum charge ranges between 116.7 and 131.8 dB for all the POI’s
considered. No specific damages are expected from the levels calculated. Damages are only
expected to occur at levels greater than 134dB and 134 dB is only expected at distances closer than
447 m to the box-cut area. There are no private structures in this area that are of concern. All private
structures are further away. The nearest buildings are 598 m from the box-cut boundary. The levels
at private houses or settlements are expected to be within limits and not damaging. Levels at
nearest houses may cause effects such as rattling of roofs or doors and cause complaints.
Infrastructure such as the Pan and Graveyard are close to the box-cut boundary but air blast does
not have any influence on these installations.
Cabanga Concepts~Schurvekop Colliery~EIAReport~170615V01
Blast Management & Consulting Page 73 of 75
An exclusion zone for safe blasting was also calculated. The exclusion zone was established to be at
least 172 m. Normal practice observed in mines is a 500 m exclusion zone. The use of minimum 172
m exclusion zone is rather recommended in this instance. This may be reduced once blasting has
started and distances are confirmed.
Ten Hydrocensus boreholes were identified that could possibly be influenced due to excessive
ground vibration at maximum charge. The expected levels of ground vibration for the ten boreholes
inside the area evaluated are well within the limit applied for water boreholes.
Recommendations were made that should be considered, specifically for re-conformation of the
blast design, monitoring of ground vibration and air blast, maintain safe blasting zones, adhere to
the safe ground vibration and air blast limits and blast at recommended times.
This concludes this investigation for the Schurvekop Colliery Project. There is no reason to believe
that this operation cannot continue if attention is given to the recommendations made.
23 Curriculum Vitae of Author
J D Zeeman was a member of the Permanent Force - SA Ammunition Core for period January 1983
to January 1990. During this period, work involved testing at SANDF Ammunition Depots and
Proofing ranges. Work entailed munitions maintenance, proofing and lot acceptance of
ammunition.
From July 1992 to December 1995, Mr Zeeman worked at AECI Explosives Ltd. Initial work involved
testing science on small scale laboratory work and large scale field work. Later, work entailed
managing various testing facilities and testing projects. Due to restructuring of the Technical
Department, Mr Zeeman was retrenched but fortunately was able to take up an appointment with
AECI Explosives Ltd.’s Pumpable Emulsion Explosives Group for underground applications.
From December 1995 to June 1997 Mr Zeeman provided technical support to the Underground Bulk
Systems Technology business unit and performed project management on new products.
Mr Zeeman started Blast Management & Consulting in June 1997. The main areas of focus are Pre-
blast monitoring, Insitu monitoring, Post-blast monitoring and specialized projects.
Mr Zeeman holds the following qualifications:
1985 - 1987 Diploma: Explosives Technology, Technikon Pretoria
1990 - 1992 BA Degree, University Of Pretoria
1994 National Higher Diploma: Explosives Technology, Technikon Pretoria
1997 Project Management Certificate: Damelin College
2000 Advanced Certificate in Blasting, Technikon SA
Member: International Society of Explosives Engineers

Cabanga Concepts~Schurvekop Colliery~EIAReport~170615V01
Blast Management & Consulting Page 74 of 75
Blast Management & Consulting has been active in the mining industry since 1997, with work being
done at various levels for all the major mining companies in South Africa. Some of the projects in
which BM&C has been involved include:
Iso-Seismic Surveys for Kriel Colliery in conjunction with Bauer & Crosby Pty Ltd.; Iso-Seismic surveys
for Impala Platinum Limited; Iso-Seismic surveys for Kromdraai Opencast Mine; Photographic
Surveys for Kriel Colliery; Photographic Surveys for Goedehoop Colliery; Photographic Surveys for
Aquarius Kroondal Platinum – Klipfontein Village; Photographic Surveys for Aquarius – Everest South
Project; Photographic Surveys for Kromdraai Opencast Mine; Photographic inspections for various
other companies, including Landau Colliery, Platinum Joint Venture – three mini-pit areas;
Continuous ground vibration and air blast monitoring for various coal mines; Full auditing and
control with consultation on blast preparation, blasting and resultant effects for clients, e.g. Anglo
Platinum Ltd, Kroondal Platinum Mine, Lonmin Platinum, Blast Monitoring Platinum Joint Venture –
New Rustenburg N4 road; Monitoring of ground vibration induced on surface in underground
mining environment; Monitoring and management of blasting in close relation to water pipelines in
opencast mining environment; Specialized testing of explosives characteristics; Supply and service
of seismographs and VOD measurement equipment and accessories; Assistance in protection of
ancient mining works for Rhino Minerals (Pty) Ltd.; Planning, design, auditing and monitoring of
blasting in new quarry on new road project, Sterkspruit, with Africon, B&E International and Group
5 Roads; Structure Inspections and Reporting for Lonmin Platinum Mine Limpopo Pandora Joint
Venture 180 houses – whole village; Structure Inspections and Reporting for Lonmin Platinum Mine
Limpopo Section - 1000 houses / structures.
BM&C have installed a world class calibration facility for seismographs, which is accredited by
Instantel, Ontario Canada as an accredited Instantel facility. The projects listed above are only part
of the capability and professional work that is done by BM&C.

Cabanga Concepts~Schurvekop Colliery~EIAReport~170615V01
Blast Management & Consulting Page 75 of 75
24 References
1. Berger P. R., & Associates Inc., Bradfordwoods, Pennsylvania, 15015, Nov 1980, Survey
of Blasting Effects on Ground Water Supplies in Appalachia., Prepared for United States
Department of Interior Bureau of Mines.
2. BME Training Module – Vibration, air blast and fly rock, Module V, Dated 5 August 2001.
3. Chiapetta F., Van Vreden A., 2000. Vibration/Air blast Controls, Damage Criteria, Record
Keeping and Dealing with Complaints. 9th Annual BME Conference on Explosives,
Drilling and Blasting Technology, CSIR Conference Centre, Pretoria, 2000.
4. Dowding C.H., Construction Vibrations, 1996, Prentice Hall, Upper Saddle River, NJ
07458.
5. Farnfield Dr R., Client Report: Air Overpressure from Le Maitre Flash Report, Dated: 27
April 2007.
6. Hawkins J., 9 May 2000, Impacts of Blasting on Domestic Water Wells, Workshop on
Mountaintop Mining Effects on Groundwater.
7. Mechanical vibration and shock – Vibration of buildings – Guidelines for the
measurement and evaluation of their effects on buildings, SABS ISO 4886:1990.
8. Oriard, L.L., 1999, The Effects of Vibration and Environmental Forces: A guide for
Investigation of Structures, International Society of Explosives Engineers, Cleveland,
Ohio, USA.
9. Persson P.A., Holmberg R. and Lee J., 1994, Rock Blasting and Explosives Engineering,
Boca Raton, Florida: CRC Press.
10. Richards A. B., Moore A.J., Terrock Consulting Engineers Pty Ltd., 2002, Fly rock Control
– By Chance or Design, Paper Presented at ISEE Conference – New Orleans.
11. Rowland, J.H.(III), Mainiero R., and Hurd D.A.(Jr.), Factors Affecting Fumes Production of
an Emulsion and Anfo/Emulsion Blends.
12. Sapko M., Rowland J., Mainiero R., Zlochower I., Chemical and Physical Factors that
Influence no Production during Blasting – Exploratory Study.
13. Scott A., Open Pit Blast Design, 1996, Julius Kruttschnitt Mineral Research Centre, The
University of Queensland.
14. Siskind D.E., Stachura V.J., Stagg M.S. and Kopp J.W., 1980. Structure Response and
Damage Produced by Air blast From Surface Mining. US Bureau of Mines RI 8485.