blair, steven macpherson and booth, campbell and elders
TRANSCRIPT

This paper is a preprint of a paper accepted by IET Electrical Systems in Transportation and is subject to Institution of
Engineering and Technology Copyright. When the final version is published, the copy of record will be available at IET
Digital Library.
Superconducting fault current limiter application in a
power-dense marine electrical system
S.M. Blair*, C.D. Booth*, I.M. Elders*, N.K. Singh*1, G.M. Burt*, J. McCarthy
†
*Institute for Energy and Environment, University of Strathclyde, Glasgow, UK,
†Rolls-Royce Marine Electrical Systems, Portsmouth, UK, [email protected]
Keywords: Fault level, marine electrical systems, protection and control, superconducting fault
current limiter
Abstract
Power-dense, low-voltage marine electrical systems have the potential for extremely high fault
currents. Superconducting fault current limiters (SFCLs) have been of interest for many years and
offer an effective method for reducing fault currents. This is very attractive in a marine vessel in terms
of the benefits arising from reductions in switchgear rating (and consequently size, weight and cost)
and damage at the point of fault. However, there are a number of issues that must be considered prior
to installation of any SFCL device(s), particularly in the context of marine applications. Accordingly,
this paper analyses several such issues, including: location and resistance sizing of SFCLs; the
potential effects of an SFCL on system voltage, power and frequency; and practical application issues
such as the potential impact of transients such as transformer inrush. Simulations based upon an actual
vessel are used to illustrate discussions and support assertions. It is shown that SFCLs, even with
relatively small impedances, are highly effective at reducing prospective fault currents; the impact
that higher resistance values has on fault current reduction and maintaining the system voltage for
1 Dr Nand Singh is now with Mott MacDonald Ltd., Croydon, CR0 2EE, U.K

2
other non-faulted elements of the system is also presented and it is shown that higher resistance values
are desirable in many cases. It is demonstrated that the exact nature of the SFCL application will
depend significantly on the vessel’s electrical topology, the fault current contribution of each of the
generators, and the properties of the SFCL device, such as size, weight, critical current value and
recovery time.
1 Introduction
Superconducting fault current limiters (SFCLs) have the potential to facilitate highly power-dense,
low-voltage electrical systems. This applies particularly to marine electrical systems, in which
electrical power requirements for propulsion, auxiliary systems and other loads are increasing [1], [2].
The necessary generation capacity at a given voltage level may result in fault currents such that
procurement of adequately rated switchgear is prohibitively expensive, or impossible; furthermore,
there are increased safety concerns when fault currents become excessively high. As will be
demonstrated later in this paper, fault currents well in excess of 200kA peak can be encountered. The
preference for use of low voltage marine electrical systems is driven by the costs of increased
insulation associated with higher voltages, employing crew with particular operating qualifications
and increasingly stringent safety regulations. Restriction of fault currents by a means that does not add
operational constraints during non-fault conditions is therefore very attractive [3], [4], [5].
Resistive SFCLs operate on the principle that passing a current, which is greater than the
superconductor’s critical current, Ic, through a superconducting wire causes a small amount of ohmic
heating and, when the wire temperature increases sufficiently, results in the superconductor
“quenching”, and transitioning to a resistive state [1], [4], [5]. Hence, there are virtually no losses in
the SFCL during normal operation (ignoring power losses associated with the operation of the
cryogenic system), yet an SFCL intrinsically inserts impedance into the fault current path during a
fault, as long as its transition threshold conditions are satisfied. SFCLs are not restricted to a single
current limiting operation, but usually require a recovery period after operation, ranging from several
seconds [6] to several minutes [4], during which the element is cooled until it returns to its
3
superconducting state. SFCLs are therefore a much more favourable solution to addressing high fault
levels than traditional solutions such as fault current limiting reactors, Is-limiters and reduced
electrical network interconnection [5], all of which have a number of operational and safety-related
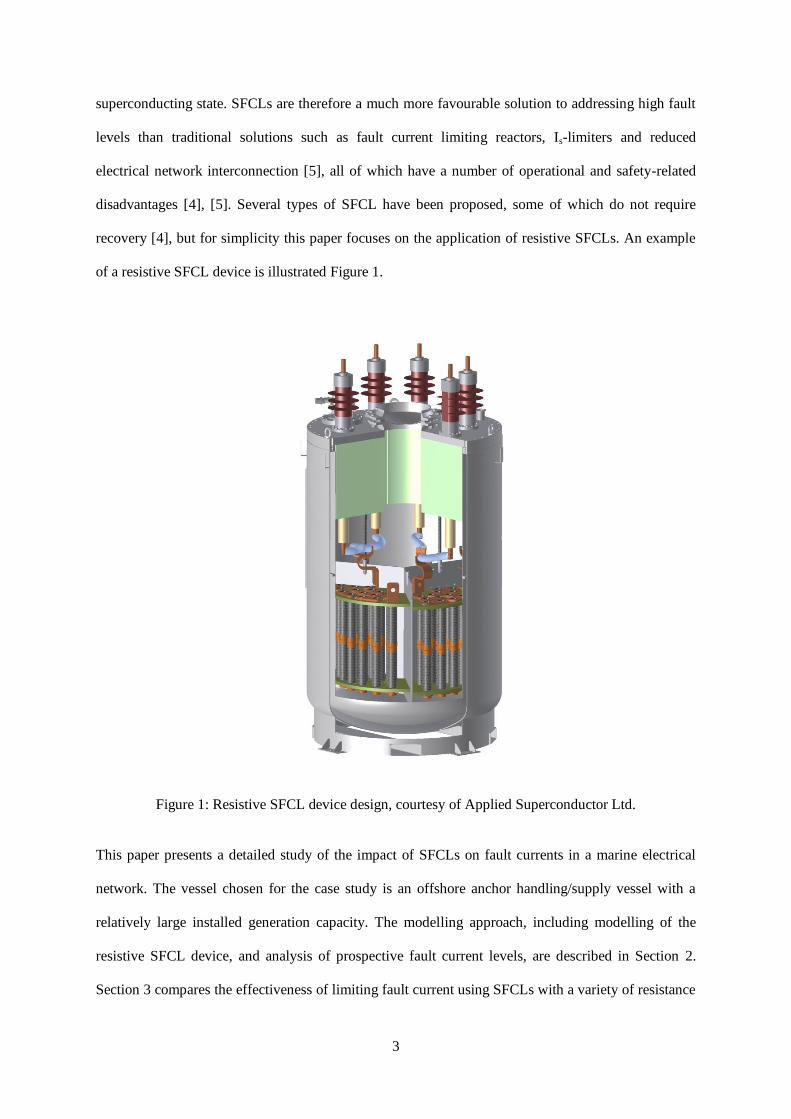
disadvantages [4], [5]. Several types of SFCL have been proposed, some of which do not require
recovery [4], but for simplicity this paper focuses on the application of resistive SFCLs. An example
of a resistive SFCL device is illustrated Figure 1.
Figure 1: Resistive SFCL device design, courtesy of Applied Superconductor Ltd.
This paper presents a detailed study of the impact of SFCLs on fault currents in a marine electrical
network. The vessel chosen for the case study is an offshore anchor handling/supply vessel with a
relatively large installed generation capacity. The modelling approach, including modelling of the
resistive SFCL device, and analysis of prospective fault current levels, are described in Section 2.
Section 3 compares the effectiveness of limiting fault current using SFCLs with a variety of resistance

4
values and considers the impact of locating the devices at different locations within the power system.
The effects of SFCLs on voltage, power and frequency and other practical application concerns are
explored in Section 4. Based on the results presented, the paper concludes with a summary of the
various aspects that must be considered prior to the application of SFCLs in marine vessels, and
suggestions for further investigation are made.
2 Case study marine system
The vessel under consideration has six synchronous diesel generators, four 2.1MW and two 4MW
units, as presented in the electrical system diagram in Figure 2. The 4MW generators are associated
with local propulsion and thruster motors; they are also connected to the main switchboard and are
therefore capable of supplying other non-propulsive loads. As depicted in Figure 2, the system can be
divided into two similar subsystems – connected by bus-tie circuit breakers – with loads evenly
distributed between them. Auxiliary loads are connected to both 690V and 230V switchboards.
Figure 2: Marine electrical system

5
2.1 Marine model and analysis method
The electrical system modelling has been carried out using PSCAD/EMTDC [7]. As is typical of AC
marine electrical systems, it is an isolated (unearthed) system and has a nominal frequency of 60Hz.
Two types of synchronous generators have been used in the modelling of system; relevant generator
data is provided in the Appendix. The generators’ excitation control systems have been implemented
based on IEEE standard model AC1A [8], using the default parameters, and a standard governor
control system provided in PSCAD has been used. A pi-equivalent model of cables has been used
during this investigation, with resistance of 83.9µΩ/m and inductive reactance of 142.5µΩ/m (this
data was supplied by the project’s industrial partner). Cable lengths are illustrated in Figure 3.
Standard PSCAD transformer components have been used to model system transformers; the
transformers do not play a significant role in the studies presented.
Figure 3: Fault locations, SFCL locations (A, B, C or D), and cable lengths
Figure 2 shows presence of both static and dynamic loads. However, it can be seen that motors are
connected through power electronic converters capable of providing a current control scheme.
Therefore, with a current controlled scheme in place, pre- and post-fault currents of the drive systems
remain unchanged, i.e., load current is controlled to 1pu which allows motoring load to be modelled

6
as static load, leading to simplified modelling and shorter simulation times. The motor-generator
arrangement is assumed to be disconnected from the system; the 230V loads connected to the main
switchboard are supplied via the parallel transformer. This assumption is valid for fault level studies
because the motor is convertor-interfaced and would not contribute significantly to the fault current.
The emergency generator, emergency switchboard, and shore connection are not considered in this
study.
This paper considers the worst case scenario of three-phase faults, applied at the locations of interest
(shown in Figure 3) with a negligible fault resistance value. Fault currents are calculated by PSCAD
using the EMTDC simulation engine [7]. It is assumed that the selected circuit breakers are capable of
closing onto and breaking the maximum prospective fault current supplied by only one “half” of the
available generation. For this reason the bus-tie (at location A in Figure 3) must be open when all
generation is operational unless fault current limitation is present.
2.2 Resistive SFCL model
In order to accurately examine the dynamics and operational characteristics of a marine electrical
system incorporating an SFCL – such as the peak make fault current (the maximum possible
instantaneous value of the prospective short-circuit current [9]) – the resistance in each phase of the
SFCL is modelled independently. An exponential SFCL model (effectively a refined version of the
models presented in [3], [10] and [11]) is used to approximate the development of resistance; this
process is triggered when the instantaneous current in each phase first exceeds the critical current
value, Ic [12]. Hence, the SFCL model intrinsically reacts to current magnitudes in each individual
phase and does not have to be configured to operate at a specific time; this is a valuable refinement
when compared to other models (such as [3], [10], [11], [13] and [14]), which may tend to
overestimate the reduction in peak make fault current and lead to inaccurate transient results until the
final SFCL resistance value is reached. The model used in this study is effective at estimating the
peak make fault current reduction, yet it avoids the complexities of thermo-electric models such as
those described in [15], [16] and [17].

7
Equation (1) describes the model used in the studies presented in this paper, where: R0 is the
maximum SFCL resistance value; τ is the time constant which determines how quickly the SFCL
reaches R0; and iSFCL(t) is the instantaneous phase current in the SFCL. The value of τ is assumed to be
10ms, which implies that the SFCL phase resistance reaches approximately 80% of R0 within the first
cycle (depending on the point during the first cycle when Ic is reached). This may be a conservative
estimate for τ; in reality the transition time is also dependent on the fault current magnitude [18]) but,
for sufficiently large values of R0, a more optimistic value such as 1ms only makes a small difference
in terms of reducing peak make current. In either case, the SFCL resistance is sufficient to
significantly limit the first peak of fault current.
𝑅𝑆𝐹𝐶𝐿 𝑡 = 0, 𝑏𝑒𝑓𝑜𝑟𝑒 𝑖𝑆𝐹𝐶𝐿 𝑡 ≥ 𝐼𝑐
𝑅0 1 − 𝑒−𝑡𝜏 , 𝑎𝑓𝑡𝑒𝑟 𝑖𝑆𝐹𝐶𝐿 𝑡 ≥ 𝐼𝑐
Equation 1: SFCL resistance model, calculated independently for each phase
Ic is selected to be approximately 2pu of the maximum load current that can pass through the SFCL in
each scenario. The value of Ic will slightly affect the peak make limitation (although only for
relatively small values of R0), but Ic (and τ) can be selected in line with empirical results of
superconductor quenching to approximate the behaviour of a particular SFCL device. The
superconductor recovery time is not modelled in this study but it is assumed that the SFCL must be
removed from service during the post-fault period, as discussed in Section 4.4. A typical SFCL
resistance characteristic is shown in Figure 4.

8
Figure 4: Typical per phase SFCL resistance characteristic and effect on fault current
2.3 Fault level analysis
Table 1 lists the magnitudes of currents evident at three different fault locations, with the bus-tie
circuit breaker closed and with no fault current limitation. For each location the peak make, peak
break (equivalent to the peak magnitude at the third cycle after fault inception – chosen to be
reflective of the time at which the breaker may trip after delays associated with protection relay and
breaker operation times), and RMS break (RMS value of current at the fifth peak, an approximation of
the RMS steady-state symmetrical fault component [9]) values are provided. Fault F3 is not shown
because it results in very similar fault currents to those associated with fault F1; however different
results are obtained depending on the SFCL location(s), as shown in Sections 3 and 4. For fault F4,
Table 1 implies that the DC offset decays very slowly, after approximately several seconds, due to the
increased X/R ratio caused by the transformer impedance in the fault current path. However, the
potential for damage due to short circuits on the 230V distribution system are by comparison
significantly lower – due to the additional transformer impedance in the current path – and are
therefore not considered further in this paper. The generator feeder fault current (fault F2) is less than
the bus-tie fault current (fault F1) due to the cable impedance between the locations, which reduces
the fault contribution from the four 2.1MW generators.

9
Fault location Peak make (kA) Peak break (kA) RMS break (kA)
690V bus (fault F1) 232.4 114.7 66.02
Generator feeder (fault F2) 141.6 81.1 52.7
230V bus (fault F4) 5.15 5.11 3.59
Table 1: Prospective fault currents (without fault current limitation)
Figure 5 illustrates the total unrestricted fault current for fault F1, where the fault occurs after 1
second and is present for 0.1 seconds. For an electrical system with 16.4MW of generation capacity, a
fault current approaching 250kA peak is calculated, which may be prohibitively high. Fault F1 occurs
at a voltage zero-crossing on phase A; hence phase A exhibits the highest possible peak fault current
due to the increased DC component associated with the point-on-wave of fault inception [19]. Other
point-on-wave fault inceptions, where the fault does not occur at a voltage zero-crossing on any of the
phases, result in a lower peak fault current, close to the peak symmetrical short-circuit calculation [1]
of 183kA.
Figure 5: Fault F1 on the 690V bus (without SFCL)
2.4 Voltage and power perturbations
Figure 6 presents the bus voltages for fault F1 at t=1s, calculated as the sum of the squares of the
instantaneous voltage in each phase, scaled to a per unit value as expressed by Equation (2). This

10
approach is used because the averaging caused by an RMS measurement may obscure transients. The
dip in voltage is clearly apparent in Figure 6 and it is evident that the voltage starts recovering soon
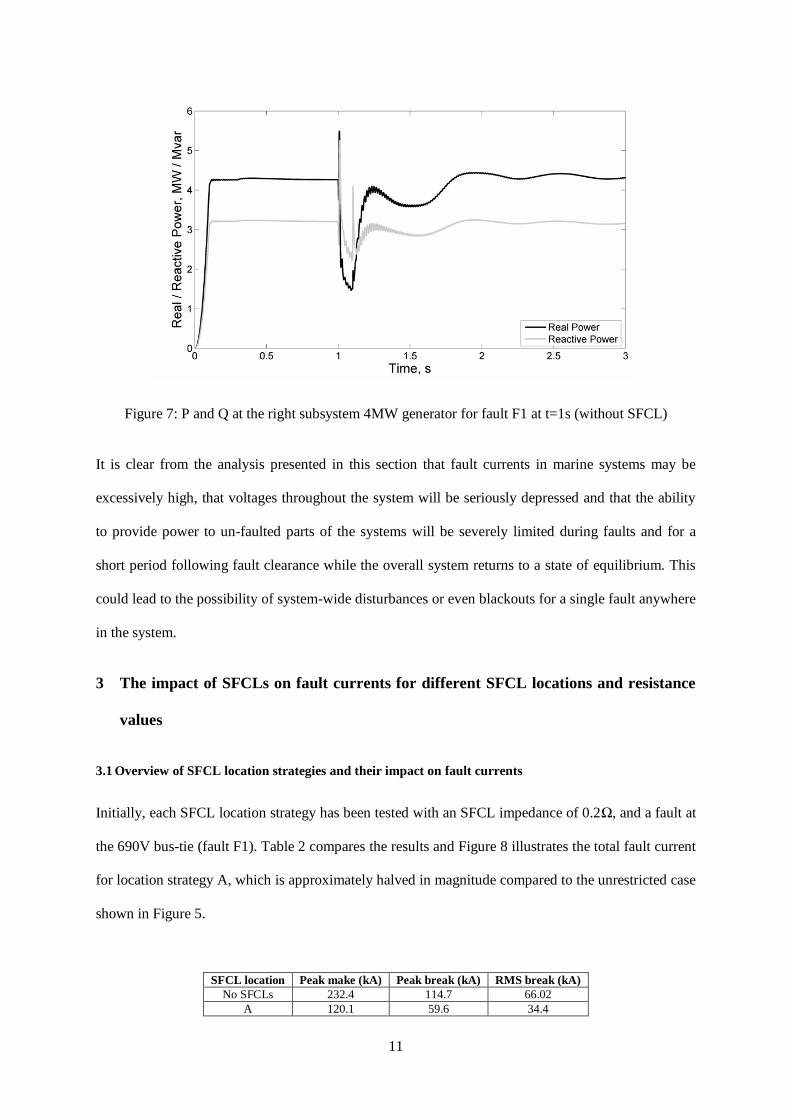
after faults are cleared. For the same fault conditions, Figure 7 illustrates the disturbance to real and
reactive power at the output of the 4MW generator in the right subsystem. Clearly, the nature of the
prime movers, generators and their control systems will influence post-fault behaviour.
𝑉𝑝𝑢 = 2
3𝑉 2 𝑉𝑎(𝑡)2 + 𝑉𝑏(𝑡)2 + 𝑉𝑐(𝑡)2
Equation 2: Calculation of instantaneous per unit voltage
Figure 6: Bus voltages for fault F1 at t=1s (without SFCL)
11
Figure 7: P and Q at the right subsystem 4MW generator for fault F1 at t=1s (without SFCL)
It is clear from the analysis presented in this section that fault currents in marine systems may be
excessively high, that voltages throughout the system will be seriously depressed and that the ability
to provide power to un-faulted parts of the systems will be severely limited during faults and for a
short period following fault clearance while the overall system returns to a state of equilibrium. This
could lead to the possibility of system-wide disturbances or even blackouts for a single fault anywhere
in the system.
3 The impact of SFCLs on fault currents for different SFCL locations and resistance
values
3.1 Overview of SFCL location strategies and their impact on fault currents
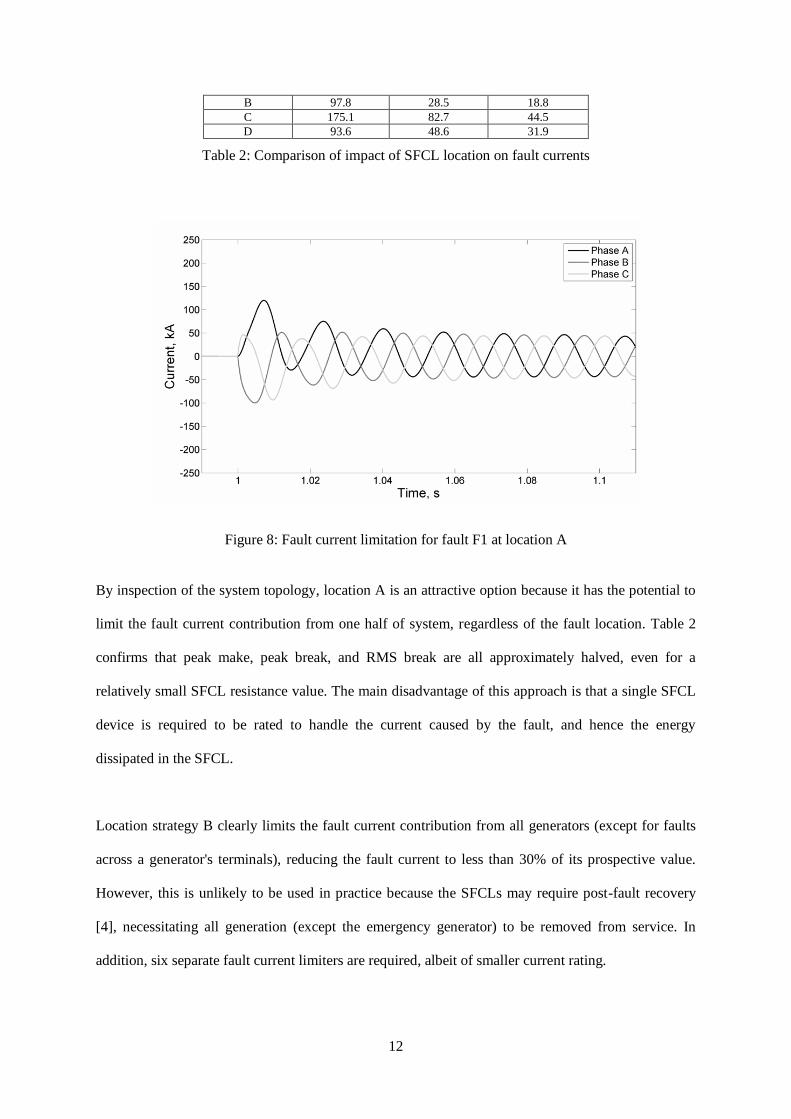
Initially, each SFCL location strategy has been tested with an SFCL impedance of 0.2Ω, and a fault at
the 690V bus-tie (fault F1). Table 2 compares the results and Figure 8 illustrates the total fault current
for location strategy A, which is approximately halved in magnitude compared to the unrestricted case
shown in Figure 5.
SFCL location Peak make (kA) Peak break (kA) RMS break (kA)
No SFCLs 232.4 114.7 66.02
A 120.1 59.6 34.4
12
B 97.8 28.5 18.8
C 175.1 82.7 44.5
D 93.6 48.6 31.9
Table 2: Comparison of impact of SFCL location on fault currents
Figure 8: Fault current limitation for fault F1 at location A
By inspection of the system topology, location A is an attractive option because it has the potential to
limit the fault current contribution from one half of system, regardless of the fault location. Table 2
confirms that peak make, peak break, and RMS break are all approximately halved, even for a
relatively small SFCL resistance value. The main disadvantage of this approach is that a single SFCL
device is required to be rated to handle the current caused by the fault, and hence the energy
dissipated in the SFCL.
Location strategy B clearly limits the fault current contribution from all generators (except for faults
across a generator's terminals), reducing the fault current to less than 30% of its prospective value.
However, this is unlikely to be used in practice because the SFCLs may require post-fault recovery
[4], necessitating all generation (except the emergency generator) to be removed from service. In
addition, six separate fault current limiters are required, albeit of smaller current rating.

13
Strategy C is a compromise of the advantages and disadvantages of strategy B, and restricts the
contribution only from the 4MW generators. The result in Table 2 for peak make for this SFCL
location is relatively high, because of the relatively large peak make contribution from the 2.1MW
generators (due to their relatively small sub-transient reactance; see Appendix).
Table 2 illustrates that location D offers better fault current limitation than location A. It also has the
advantage that it can limit fault currents for all fault locations when the main bus-tie circuit breaker is
open. Hence, the impact of SFCLs located at D will be analysed in more detail in Section 3.2, and this
location is compared to location A in terms of other effects on the electrical system in Section 4.
3.2 Effects of different SFCL resistance and fault location
Figure 9 and Figure 10 illustrate respectively how SFCL resistance affects the peak make and RMS
break fault currents. It can be observed that in most cases there is only a small reduction in fault
current for resistance values greater than approximately 0.2Ω, as the equivalent impedance of the
loads in the system, which effectively remain ”in circuit” when the SFCL develops full resistance, are
significantly lower than this value (e.g. for a system load of approximately 8MW, the impedance is
0.02Ω). For location B and with an SFCL resistance of greater than approximately 0.25Ω, the peak
fault current contribution from each generator is typically less than twice load current, and diminishes
to load current levels or less after the first peak. Such severe fault current limitation could potentially
lead to use of smaller, lighter, and less expensive switchgear. Note that the slight increase in the total
fault current, for example with location C at 0.5Ω in Figure 9, is due to the fault current being limited
sufficiently (below Ic) such that one phase of the SFCL does not quench. This implies that a two-
phase SFCL may sufficiently reduce fault currents in unearthed electrical systems (noting that the
voltage in the limited phases will rise by a factor of 3 of the nominal value), leading to potential
savings in size, weight and cost [20]. Furthermore, only a certain range of SFCL resistance values will
cause a two-phase quench in a three-phase SFCL; this will not be discussed further in this paper but
will be investigated and reported on in the future.

14
Figure 9: Peak make fault current for fault F1, for alternative SFCL locations
Figure 10: RMS break fault current for fault F1, for alternative SFCL locations
By inspection, location D has the potential to limit approximately half of the steady-state fault current
for faults at the bus-tie. Figure 10 shows that an SFCL resistance of approximately 0.2Ω is necessary
to achieve this. In the case study system, a resistance of 0.2Ω also reduces the peak fault current by
more than half of the unrestricted value due to the relatively small sub-transient reactance of the
2.1MW generators. However, this SFCL deployment strategy does not limit the fault contribution
from either of the two 4MW generators, for faults at the bus-tie or one of the 4MW generator feeders

15
(fault F1 or F2). In the latter case, relatively large values of SFCL resistance only trim approximately
one third off the fault current, as shown in Table 3. However, Table 4 illustrates that location D is
highly effective at limiting faults elsewhere on the 690V bus, at location F3.
SFCL resistance Peak make (kA) Peak break (kA) RMS break (kA)
0Ω 141.8 81.9 53.0
0.02Ω 129.5 77.4 50.7
0.1Ω 108.0 59.2 38.9
0.2Ω 98.9 54.2 34.7
0.5Ω 92.9 51.5 32.8
1Ω 93.8 51.8 32.9
2Ω 91.9 51.1 32.3
Table 3: Comparison of limitation for SFCL location D, for fault F2
SFCL resistance Peak make (kA) Peak break (kA) RMS break (kA)
0Ω 232.3 114.7 66.0
0.02Ω 118.7 57.7 35.1
0.1Ω 81.8 39.3 21.4
0.2Ω 78.4 37.6 20.2
0.5Ω 76.9 36.8 19.6
1Ω 77.1 36.9 19.7
2Ω 76.5 36.6 19.5
Table 4: Comparison of limitation for SFCL location D, for fault F3
4 Other SFCL application considerations
This section introduces several issues – other than the level of fault current limitation – that will be
pertinent when considering the role of SFCLs in a marine application. The previous section identified
that locations A and D are effective at limiting fault currents; hence they are explored in more detail
in this section. Faults F1 and F3 are examined in each case.
4.1 Effects of SFCL on system voltage, power and frequency
The simulation in Section 2.4 has been extended to examine the effects that SFCLs have on system
voltage, power and frequency, and to help assess the nature of system recovery following a fault and
whether this recovery process may be assisted by SFCLs. In each case, a fault is applied at t=1s and
the bus-tie circuit breaker is opened after approximately 100ms (depending on the individual phase
current zero-crossings). This clears the fault from the right subsystem. The left subsystem must open

16
further circuit breakers (at each of its three generator feeders) to clear the fault but this is not
considered further.
For SFCL location A, the voltage dip and power perturbations are reduced considerably for the
operational (right) subsystem, as shown in Figure 11 and Figure 12, respectively. The voltage
waveform is again calculated using Equation (2). Note that for an SFCL resistance of 0.1Ω the voltage
initially collapses until the SFCL reaches an appreciable resistance value, and that the subsequent
overvoltage (to approximately 105% of the nominal value) is due to the action of the generator exciter
under certain large values of apparent “overload”. Hence, for compact electrical systems such as
marine vessels, it is important to investigate the generators’ dynamic response to the relatively
unusual scenarios presented by SFCLs; the presence of fault current limitation may have implications
for the design of automatic voltage regulation systems. Before the bus-tie circuit breaker opens, the
SFCL can simply be thought of as a (serially-connected) resistive load of the appropriate power rating
(i.e., P = V2/R = 690
2/1.0 = 476kW, for an SFCL resistance of 1Ω). Hence, increasing the SFCL
resistance value reduces the transient increase in real power delivered by the generator, as illustrated
in Figure 12 for an SFCL resistance of 1Ω.
Figure 11: 690V bus voltage for SFCL location A, for fault F1 (or F3)
17
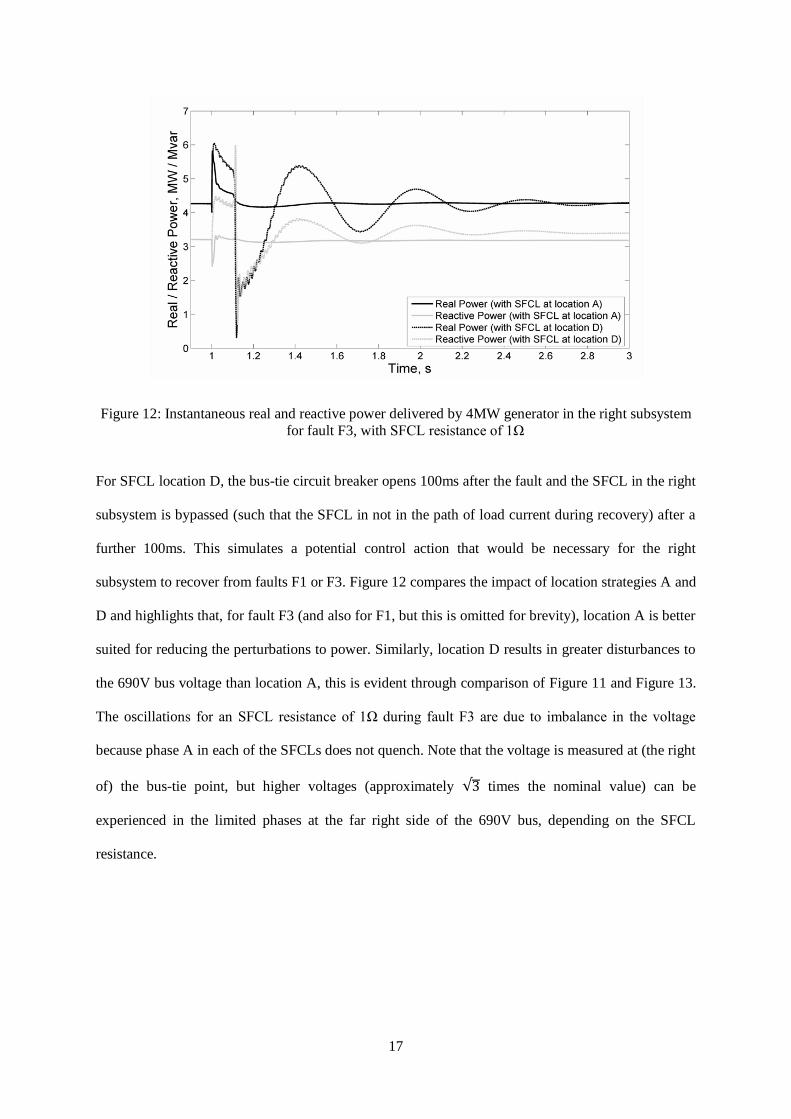
Figure 12: Instantaneous real and reactive power delivered by 4MW generator in the right subsystem
for fault F3, with SFCL resistance of 1Ω
For SFCL location D, the bus-tie circuit breaker opens 100ms after the fault and the SFCL in the right
subsystem is bypassed (such that the SFCL in not in the path of load current during recovery) after a
further 100ms. This simulates a potential control action that would be necessary for the right
subsystem to recover from faults F1 or F3. Figure 12 compares the impact of location strategies A and
D and highlights that, for fault F3 (and also for F1, but this is omitted for brevity), location A is better
suited for reducing the perturbations to power. Similarly, location D results in greater disturbances to
the 690V bus voltage than location A, this is evident through comparison of Figure 11 and Figure 13.
The oscillations for an SFCL resistance of 1Ω during fault F3 are due to imbalance in the voltage
because phase A in each of the SFCLs does not quench. Note that the voltage is measured at (the right
of) the bus-tie point, but higher voltages (approximately 3 times the nominal value) can be
experienced in the limited phases at the far right side of the 690V bus, depending on the SFCL
resistance.

18
Figure 13: 690V bus voltage for SFCL location D, for faults F1 and F3
Figure 14 and Figure 15 illustrate the frequency of the power system during faults F1 and F3,
respectively. With the SFCL present at location A, the generators slow down during the fault due to
the apparent overload. It can be seen that SFCL location A, with a relatively large resistance value, is
effective at reducing both the magnitude of the transient frequency deviation and the time to recover
to nominal frequency after the fault is cleared. Hence the risk that generators’ under-frequency
protection systems would trip is also significantly reduced. Location D is relatively ineffective at
reducing the frequency disturbance, especially for fault F1; this is because the fault contribution from
the 4MW generators is fed directly into the fault without limitation. The damping provided by larger
values of SFCL resistance will be increasingly important for generators with lower inertia values.

19
Figure 14: System frequency for Fault F1
Figure 15: System frequency for Fault F3
It can be concluded that although small values of SFCL resistance such as 0.1Ω can significantly
reduce the peak make and RMS break fault current values, larger values are desirable to reduce
perturbations in voltage, power and frequency. Although location D can offer greater fault current
limitation than location A, it is far less attractive in terms of the effect on system stability, both during
and after a fault. Similarly, for the application of SFCLs at other locations, it is necessary to examine
the dynamic effects on the electrical system.
20
4.2 Consequences of SFCLs on protection
The effects of resistive SFCLs on power system protection system have been examined, for example
in [5], [17] and [21], and location A (at the bus-tie) is likely to have the lowest impact on overcurrent
protection [5]; the overcurrent protection settings are the same, regardless of whether or not the bus-
tie circuit breaker is closed. However for location D, the total prospective fault current may be
substantially reduced if the bus-tie circuit breaker is open. While beneficial, this will complicate the
coordination of overcurrent protection. Protection will not be discussed further in this paper but will
be investigated and reported on in the future.
It is important to note that even with an SFCL, for example at the bus-tie, the peak fault current is still
significantly high (approximately 118kA) and will stress the electrical system equipment, particularly
the circuit breakers, during a fault. In addition, high impedance faults can result in much lower fault
currents (below Ic), but still have the potential to cause considerable damage at the point of fault [1]
and often develop into more serious faults.
4.3 Non-fault transients and their potential to cause SFCL mal-operation
Typical system transients, such as transformer inrush current and motor starting current, have the
potential to cause mal-operation of the SFCL (and in some cases the protection system). However for
the vessel studied, large motor loads are converter-interfaced and presumably “soft-start” and other
loads (all directly connected to the main 690V switchboard via transformers) are relatively small. The
largest distribution transformer in the vessel, 350kVA, draws an inrush current of approximately 1kA
(five times load current), as shown in Figure 16. Note that there is a considerable DC offset with a
long decay time, as dictated by the high X/R ratio. Hence, for this particular vessel, it can be
concluded that the most serious prospective fault currents are significantly larger in magnitude than
transformer inrush and that an SFCL with an appropriately rated Ic will not mal-operate during
transformer inrush. With respect to transformer inrush and protection, each generator is capable of
supplying approximately 40kA (peak) for faults with negligible resistance; an overcurrent protection

21
scheme can therefore readily differentiate between fault current and transformer inrush, even if only a
single 2.1MW generator is in operation.
Figure 16: Transformer inrush current at 350kVA transformer feeder
However, for vessels where multiple transformers may be energised simultaneously, or where larger
transformers are employed, inrush studies must be carried out – for each SFCL location strategy – and
the potential for SFCL mal-operation established. While there are no anticipated problems associated
with transformer inrush for the vessel studied in this paper, Ic must always be selected with careful
reference to transformer inrush currents [22]. For larger transformers, inrush could be significant and
might impinge on fault current levels (and therefore on SFCL operation thresholds), particularly in
situations where prospective faults levels are reduced due to all generation not being in service.
4.4 Other practical concerns
Table 5 illustrates that the total energy dissipated in the SFCL (at location A, for fault F1), due to
ohmic heating, is reduced for higher values of SFCL resistance because of the significant reduction in
fault current, as calculated by Equation (3) where tf is the time of fault occurrence and tc is the time
when the fault is cleared. This is important because it will affect the length of the recovery time of a
resistive SFCL [15]. Note that energy dissipation may be substantially lower if an impedance is

22
placed in parallel with the SFCL [5] and external to the cryogenic environment, but this will also
affect the current limitation properties [22].
𝑄 = 𝑖𝑆𝐹𝐶𝐿(𝑡)2𝑅𝑆𝐹𝐶𝐿 𝑡 𝑑𝑡𝑡𝑐
𝑡𝑓
Equation 3: Total SFCL energy dissipation
SFCL resistance Total energy dissipated
0.01Ω 685.8kJ
0.05Ω 403.2kJ
0.1Ω 213.8kJ
1.0Ω 27.9kJ
Table 5: Energy dissipation, per phase, in the SFCL for different values of SFCL resistance
It has been shown how, for location A, a relatively large SFCL resistance can reduce both the severity
of electrical disturbances and the amount of energy dissipated in the SFCL during faults. However, a
negative consequence of increased SFCL resistance (in the quenched state), for example by using
longer superconducting elements (rather than reducing the cross-sectional area, which may adversely
affect the thermal and physical stability), is that the gain in resistance must be balanced with the
potential increase in size, weight and cost. Large values of SFCL resistance have also been shown (in
Section 3.2) to significantly reduce the RMS break contribution of each generator close to (or below)
load current levels; such severe limitation of fault current could lead to the use of smaller, lighter and
cheaper switchgear, which could offset penalties associated with using a larger SFCL. However, the
impact on system protection would require investigation; severe reduction of fault current could result
in overcurrent protection becoming unsuitable.
Further work is required to select the most suitable deployment strategy from these alternatives,
taking into account the physical dimensions of the SFCL and its auxiliary equipment (i.e., the
cryogenic system and its operational requirements), and the corresponding naval architecture
constraints of the vessel. Furthermore, thorough investigation of the operational implications of SFCL
deployment, such as impact on supply restoration [23], [24] is required. This is particularly important

23
because SFCLs may not immediately be available after operation due to the recovery period [4], [5].
During this period, certain modes of operation – such as closing the bus-tie circuit breakers with all
generation in service – must be forbidden as the prospective fault current levels may be in excess of
switchgear interruption capacities and/or equipment current carrying capabilities.
5 Conclusions
Power-dense, low-voltage marine electrical systems have the potential for extremely high fault
currents. This study shows that SFCLs, even with relatively small impedances, are highly effective at
reducing prospective fault currents. Severe limitation of fault currents using relatively large values of
SFCL resistance is very attractive in a marine vessel because this has been shown to: reduce
perturbations to voltage, power and frequency; help reduce the energy dissipated in the SFCL; and
offer the prospect of using smaller, lighter and cheaper switchgear.
For the case study presented in this paper, a number of analyses have been carried out relating to the
magnitude of reduction in fault current achievable for different locations and values of SFCL
resistance. This has shown that locations A and D and a resistance of 1Ω are favourable and can
provide a reduction of 50% and 63% in peak fault current respectively. These strategies will also
permit the bus-tie to be closed even when all generation is in service, providing greater operational
flexibility and security of supply. However, in this particular case, location A is preferred due to its
ability to drastically reduce the disruption to the power system during and after faults, and hence is
more likely to assist system recovery after faults have been cleared.
However, the chosen fault current limitation scheme will depend significantly on any particular
vessel's electrical topology and naval architecture, and on the fault current contribution from each of
the generators. The potential for transformer inrush to cause mal-operation of the SFCL and the
protection system must be appraised for vessels with a large number or capacity of transformers; a
peak of 1kA is experienced in the case study vessel. The level of fault current reduction, dictated by
the resistance of the SFCL in its resistive state, must also be examined to ensure that the fault current

24
is not reduced to levels that may not be detectable by overcurrent protection and/or will not cause
protection coordination problems. If this is the case, then alternative, more complex and costly
protection methods, for example differential protection employing communications, may be required.
The SFCL critical current rating should also be minimised, but clearly must be greater than maximum
load current and must include a further margin to cater for any expected non-fault transients.
The use of SFCLs in compact marine networks has the potential to create unusual, complex
interactions with the generator exciter and governor control systems; further work is needed to fully
understand these relationships and to assess the implications that the presence of fault current
limitation may have on the design of automatic voltage regulation systems.
6 Appendix: generator model data
4MW 2.1MW
Apparent power 5.4MVA 2.3MVA
Inertia constant 3.17s 3.17s
Armature resistance (Ra) 0.009pu 0.008pu
Xp 0.103pu 0.103pu
Xd 2.0pu 2.2pu
Xd’ 0.21pu 0.205pu
Xd’’ 0.14pu 0.119pu
Xq 2.0pu 2.0pu
Xq’’ 0.14pu 0.119pu
Tdo’ 6.55s 6.55s
Tdo’’ 0.039s 0.039s
Tqo’ 0.85s 0.85s
Tqo’’ 0.071s 0.071s
Acknowledgements
25
This work was carried out within the Rolls-Royce University Technology Centre at the University of
Strathclyde. The authors gratefully acknowledge the funding and support offered by Rolls-Royce.
References
[1] Husband, M., and Booth, C.D.: “Superconducting fault current limiters for marine
applications,” International Conference on World Maritime Technology Conference, London,
UK, March 2006
[2] Booth, C, Elders, I., Schuddebeurs, J., McDonald, J., and Loddick, S.: “Power system
protection for more and full electric marine systems,” Proceedings of IMarEST - Part B -
Journal of Marine Design and Operations, 2008, vol. 2008, pp. 37–45
[3] Su, C.L., Su, C.Y., Lee, C.C., Chen, C.J.: “Fault current limiter allocation in electric ship power
systems,” IEEE Electric Ship Technologies Symposium, Baltimore, USA, April 2009, pp. 53-
58
[4] Noe, M., and Steurer, M.: “High-temperature superconductor fault current limiters: concepts,
applications, and development status,” Superconductor Science and Technology, 2007, vol. 20,
pp. R15-R29
[5] Blair, S.M., Singh, N.K., Booth, C.D., and Burt, G.M.: “Operational control and protection
implications of fault current limitation in distribution networks,” Proceedings of the 44th
International Universities Power Engineering Conference, September 2009, Glasgow, UK
[6] Gromoll, B., Ries, G., Schmidt, W., Kraemer, H., Seebacher, B., Utz, B., Nies, R., Neumueller,
H., Baltzer, E., Fischer, S., and Heismann, B.: “Resistive fault current limiters with YBCO
films 100 kVA functional model,” IEEE Transactions on Applied Superconductivity, 1999, vol.
9, pp. 656-659
[7] Manitoba HVDC Research Centre, available: https://pscad.com/products/pscad/, accessed June
2010
[8] IEEE Std. 421.5-2005 (Revision of IEEE Std 421.5-1992): “IEEE Recommended Practice for
Excitation System Models for Power System Stability Studies,” 2006

26
[9] IEC 60909-0: “Short-circuit currents in three-phase a.c. systems - Part 0: Calculation of
currents,” 2001
[10] Sung, B.C., Park, D.K., and Ko, T.K.: “Study on Optimal Location of a Resistive SFCL
Applied to an Electric Power Grid,” IEEE Transactions on Applied Superconductivity, 2009,
vol. 19, pp. 2048-2052
[11] Blair, S.M., Singh, N.K., Elders, I.M., Booth, C.D., Burt, G.M., and McCarthy, J.:
“Investigation of Superconducting Fault Current Limiter Application in a Power-Dense Marine
Electrical Network,” The 5th IET International Conference on Power Electronics, Machines
and Drives, Brighton, UK, April 2010
[12] Oliver, A., Smith, A., Husband, M., Bailey, M., and Feng, Y.: “Assessment of Small Bend
Diameter Magnesium Diboride Wire for a Superconducting Fault Current Limiter Application,”
IEEE Transactions on Applied Superconductivity, 2009, vol. 19, 2009, pp. 1942-1945
[13] Singh, N.K., Tumilty, R.M., Burt, G.M., Bright, C.G., Brozio, C.C., Roberts, D.A., Smith,
A.C., and Husband, M.: “System-Level Studies of a MgB2 Superconducting Fault-Current
Limiter in an Active Distribution Network,” IEEE Transactions on Applied Superconductivity,
2010, vol. 20, pp. 54-60
[14] Emhemed, A.S., Tumilty, R.M., Singh, N.K., Burt, G.M., and McDonald, J.R.: “Analysis of
Transient Stability Enhancement of LV-Connected Induction Microgenerators by Using
Resistive-Type Fault Current Limiters,” IEEE Transactions on Power Systems, 2010, vol. 25,
pp. 885-893
[15] Dul'kin, I.N., Yevsin, D.V., Fisher, L.M., Ivanov, V.P., Kalinov, A.V., and Sidorov, V.A.:
”Modeling Thermal Process in a Resistive Element of a Fault Current Limiter,” IEEE
Transactions on Applied Superconductivity, 2008, vol. 18, pp. 7-13
[16] Paul, W., Chen, M., Lakner, M., Rhyner, J., Braun, D., Lanz W., and Kleimaier, M.:
“Superconducting fault current limiter: applications, technical and economical benefits,
simulations and test results,” 2000, CIGRE no. 13-201
[17] Langston, J., Steurer, M., Woodruff, S., Baldwin, T., and Tang, J.: ”A generic real-time
computer Simulation model for Superconducting fault current limiters and its application in

27
system protection studies,” IEEE Transactions on Applied Superconductivity, 2005, vol. 15, pp.
2090-2093
[18] Kraemer, H., Schmidt, W., Utz, B., Wacker, B., Neumueller, H., Ahlf, G., and Hartig, R.: “Test
of a 1 kA Superconducting Fault Current Limiter for DC Applications,” IEEE Transactions on
Applied Superconductivity, 2005, vol. 15, pp. 1986-1989
[19] Areva T&D: “Network Protection & Automation Guide,” (2005.), pp. 89
[20] Stemmle, M., Steurer, M, McLaren, P.G., Muthumuni, D, Foucher, F.: “Transient Studies of
Fault Current Limiters in Ship Power Systems with PSCAD,” Flux Magazine, 2005, no. 9, pp.
12-14
[21] Lee, B.W., Sim, J., Park, K.B., and Oh, I.S.: “Practical Application Issues of Superconducting
Fault Current Limiters for Electric Power Systems,” IEEE Transactions on Applied
Superconductivity, 2008, vol. 18, pp. 620-623
[22] Dommerque, R., Krämer, S., Hobl, A., Böhm, R., Bludau, M., Bock, J., Klaus, D., Piereder, H.,
Wilson, A., Krüger, T., Pfeiffer, G., Pfeiffer, K., and Elschner, S.: “First commercial medium
voltage superconducting fault-current limiters: production, test and installation,”
Superconductor Science and Technology, 2010, vol. 23
[23] Butler, K., Sarma, N., Whitcomb, C., Do Carmo, H., and Zhang, H.: “Shipboard systems
deploy automated protection,” IEEE Computer Applications in Power, 1998 vol. 11, pp. 31-36
[24] Gong, Y., Huang, Y., and Schulz, N.: “Integrated protection system design for shipboard power
system,” IEEE Transactions on Industry Applications, 2008, vol. 44, pp. 1930-1936