blackstone mortgage trust reports first quarter 2017 · pdf fileblackstone mortgage trust...
TRANSCRIPT
_____________________________
Blackstone Mortgage Trust, Inc.
345 Park Avenue
New York, New York 10154
T 212 655 0220
Blackstone Mortgage Trust Reports
First Quarter 2017 Results
New York, April 25, 2017: Blackstone Mortgage Trust, Inc. (NYSE:BXMT) today reported its first quarter 2017 results.
Stephen D. Plavin, Chief Executive Officer, said, “With $1 billion of originations in the quarter and a very strong forward pipeline, BXMT is off
to a great start in 2017. Our portfolio of senior loans is 91% floating rate and remains 100% performing with an average LTV of 61%.”
Blackstone Mortgage Trust issued a full detailed presentation of its first quarter 2017 results, which can be viewed at www.bxmt.com.
Quarterly Investor Call Details
Blackstone Mortgage Trust will host a conference call on Wednesday, April 26, 2017 at 10:00 a.m. EDT to discuss first quarter 2017 results. The
conference call can be accessed by dialing +1 (888) 268-4178 (U.S. domestic) or +1 (617) 597-5494 (international), with the passcode 245-054-
61# or by webcast at www.bxmt.com (listen only). For those unable to listen to the live broadcast, a recorded replay will be available on the
company’s website or by telephone beginning approximately two hours after the event. The replay call number is +1 (888) 286-8010 (U.S.
domestic) or +1 (617) 801-6888 (international), with the passcode 838-112-72#.
About Blackstone Mortgage Trust
Blackstone Mortgage Trust (NYSE:BXMT) is a real estate finance company that originates senior loans collateralized by commercial real estate in
North America and Europe. Our investment objective is to preserve and protect shareholder capital while producing attractive risk-adjusted returns
primarily through dividends generated from current income from our loan portfolio. We are externally managed by BXMT Advisors L.L.C., a
subsidiary of Blackstone. Further information is available at www.bxmt.com.
About Blackstone
Blackstone (NYSE:BX) is one of the world’s leading investment firms. Blackstone seeks to create positive economic impact and long-term value
for its investors, the companies it invests in, and the communities in which it works. Blackstone does this by using extraordinary people and
flexible capital to help companies solve problems. Blackstone’s asset management businesses, with over $360 billion in assets under management,

include investment vehicles focused on private equity, real estate, public debt and equity, non-investment grade credit, real assets and secondary
funds, all on a global basis. Further information is available at www.blackstone.com. Follow Blackstone on Twitter @Blackstone.
Forward-Looking Statements and Other Matters
This release may contain forward-looking statements within the meaning of Section 27A of the Securities Act of 1933, as amended, and Section
21E of the Securities Exchange Act of 1934, as amended, which reflect Blackstone Mortgage Trust’s current views with respect to, among other
things, Blackstone Mortgage Trust’s operations and financial performance. You can identify these forward-looking statements by the use of words
such as “outlook,” “indicator,” “believes,” “expects,” “potential,” “continues,” “may,” “will,” “should,” “seeks,” “predicts,” “intends,” “plans,”
“estimates,” “anticipates” or the negative version of these words or other comparable words. Such forward-looking statements are subject to
various risks and uncertainties. Accordingly, there are or will be important factors that could cause actual outcomes or results to differ materially
from those indicated in these statements. Blackstone Mortgage Trust believes these factors include but are not limited to those described under the
section entitled “Risk Factors” in its Annual Report on Form 10-K for the fiscal year ended December 31, 2016, as such factors may be updated
from time to time in its periodic filings with the Securities and Exchange Commission (“SEC”) which are accessible on the SEC’s website at
www.sec.gov. These factors should not be construed as exhaustive and should be read in conjunction with the other cautionary statements that are
included in this release and in the filings. Blackstone Mortgage Trust assumes no obligation to update or supplement forward‐looking statements
that become untrue because of subsequent events or circumstances.
Investor and Media Relations Contacts
Weston Tucker
Investor Relations
Blackstone
+1 (212) 583-5231
Paula Chirhart
Media Relations
Blackstone
+1 (212) 583-5263

Blackstone Mortgage Trust, Inc.
April 25, 2017
First Quarter 2017 Results

184 0 92 102 0 70 0 152 195 99 206 202 201 221 3 0 103 120 0 115 99 0 171 146
Blackstone Mortgage Trust 1
GAAP earnings of $0.54 per share and Core Earnings(a) of $0.61 per share. Book value of $26.28 per
share. $0.62 per share dividend equates to an 8.0% dividend yield.(b)
1Q loan originations totaled $1.0 billion and were 100% floating rate, senior loans with a weighted
average LTV(c) of 60%. Cumulative direct originations since inception of $14.3 billion.
100% performing $9.7 billion(d) portfolio of senior loans with a weighted average LTV(c) of 61%
91% of the portfolio is floating rate; a 1.0% increase in USD LIBOR would result in a $0.19 increase
in net interest income per share per annum
Closed $1.1 billion of credit facility upsizes and $2.8 billion of credit facility extensions, bringing
total asset-level financing capacity to $10.1 billion
Subsequent to quarter end, closed $125 million upsize of ‘swing-line’ corporate liquidity facility
increasing the total commitment to $250 million and reducing its rate by 0.50% to L+2.25%
Total liquidity of $670 million;(e) maximum origination capacity of $2.6 billion(f)
Subsequent to quarter end, entered into a joint venture with Walker & Dunlop to originate,
finance, and hold multifamily bridge loans
First Quarter 2017 Highlights
Information included in this presentation is as of or for the period ended March 31, 2017, unless otherwise indicated (a) See Appendix for a definition and reconciliation to GAAP net income (b) Based on annualized dividend and BXMT closing price as of March 31, 2017 (c) Based on LTV as of the dates loans were originated or acquired by BXMT (d) Includes $1.0 billion of Non-Consolidated Senior Interests, see Appendix for definition (e) Total liquidity includes $64 million of cash, $563 million of available borrowings, and $43 million of net receivables related to loan repayments (f) Potential loan originations assumes 4.0x asset-level leverage on total liquidity, net of $153 million of minimum liquidity requirements under applicable debt covenants
184 0 92 102 0 70 0 152 195 99 206 202 201 221 3 0 103 120 0 115 99 0 171 146
Blackstone Mortgage Trust 2
3Q'13 4Q'13 1Q'14 2Q'14 3Q'14 4Q'14 1Q'15 2Q'15 3Q'15 4Q'15 1Q'16 2Q'16 3Q'16 4Q'16 1Q'17
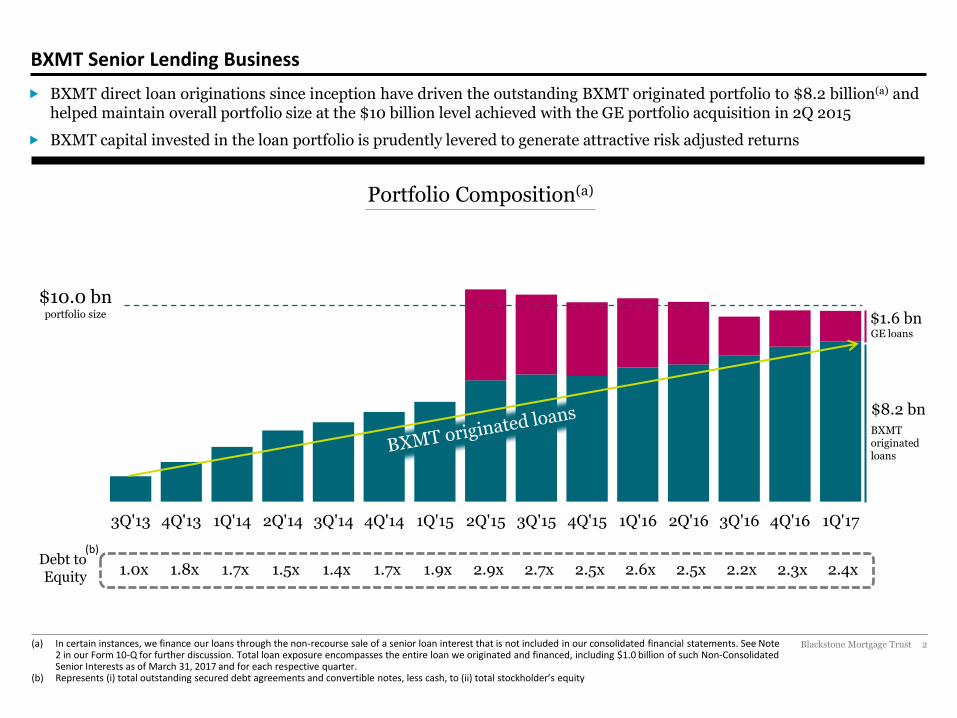
BXMT direct loan originations since inception have driven the outstanding BXMT originated portfolio to $8.2 billion(a) and helped maintain overall portfolio size at the $10 billion level achieved with the GE portfolio acquisition in 2Q 2015
BXMT capital invested in the loan portfolio is prudently levered to generate attractive risk adjusted returns
GE loans
78.5% 78.3% 78.5%
BXMT Senior Lending Business
(a) In certain instances, we finance our loans through the non-recourse sale of a senior loan interest that is not included in our consolidated financial statements. See Note 2 in our Form 10-Q for further discussion. Total loan exposure encompasses the entire loan we originated and financed, including $1.0 billion of such Non-Consolidated Senior Interests as of March 31, 2017 and for each respective quarter.
(b) Represents (i) total outstanding secured debt agreements and convertible notes, less cash, to (ii) total stockholder’s equity
Portfolio Composition(a)
76.7% 76.7% 77.% 76.9% Leverage 76.5% 77.6% 78.1% 78.2% 78.4% 78.7% (b)
79.1%
2.5x 2.2x 1.0x 1.8x 1.7x 1.5x Debt to Equity 1.4x 1.7x 1.9x 2.9x 2.7x 2.5x 2.6x
(b)
2.4x
$10.0 bn portfolio size
BXMT originated loans
78.0%
2.3x
$8.2 bn
$1.6 bn

184 0 92 102 0 70 0 152 195 99 206 202 201 221 3 0 103 120 0 115 99 0 171 146
Blackstone Mortgage Trust 3
$9,733
$1,223
Loan Originations
$1.0 billion of total originations in the quarter, up 21% quarter over quarter, with an all-in yield of L+5.25%; all six loans were with sponsors who are repeat BXMT borrowers
Two construction loans, totaling $348 million with a weighted average LTV(a) of 46% and all-in yield of L+6.01%, are indicative of the attractive risk-adjusted opportunities with diminished bank competition in construction lending
Future funding commitments at quarter end totaled $1.2 billion and will contribute to outstandings in future periods
100% senior loans
$1.0 billion total commitments
100% floating rate
Weighted Average LTV(a) of 60%
1Q 2017 Originations
(a) Reflects LTV as of the date loans were originated or acquired by BXMT (b) Includes $1.0 billion of Non-Consolidated Senior Interests, see Appendix for definition
Large loans: $161 million avg. size
Total Loan Commitments(b)
($ in millions)
1Q’17 Outstanding Loans
Future Funding Commitments
184 0 92 102 0 70 0 152 195 99 206 202 201 221 3 0 103 120 0 115 99 0 171 146
Blackstone Mortgage Trust 4
$0.27
$0.45 $0.48 $0.48 $0.50
$0.52 $0.52 $0.52
$0.62 $0.62 $0.62 $0.62 $0.62 $0.62 $0.62
3Q'13 4Q'13 1Q'14 2Q'14 3Q'14 4Q'14 1Q'15 2Q'15 3Q'15 4Q'15 1Q'16 2Q'16 3Q'16 4Q'16 1Q'17
$0.67 $0.71
Earnings & Dividends
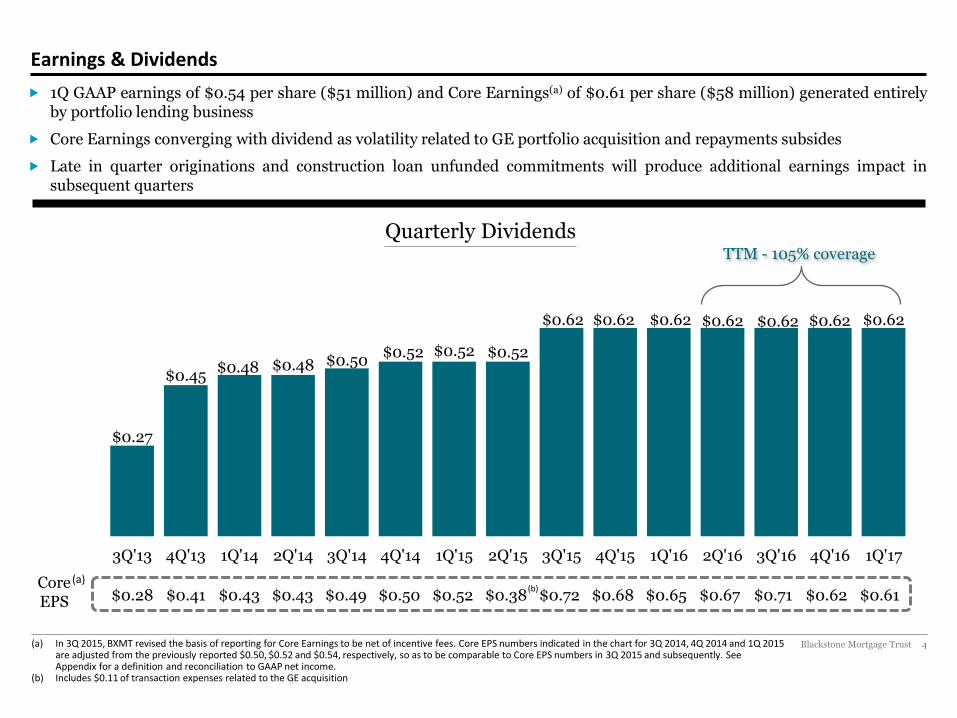
1Q GAAP earnings of $0.54 per share ($51 million) and Core Earnings(a) of $0.61 per share ($58 million) generated entirely by portfolio lending business
Core Earnings converging with dividend as volatility related to GE portfolio acquisition and repayments subsides
Late in quarter originations and construction loan unfunded commitments will produce additional earnings impact in subsequent quarters
(a) In 3Q 2015, BXMT revised the basis of reporting for Core Earnings to be net of incentive fees. Core EPS numbers indicated in the chart for 3Q 2014, 4Q 2014 and 1Q 2015 are adjusted from the previously reported $0.50, $0.52 and $0.54, respectively, so as to be comparable to Core EPS numbers in 3Q 2015 and subsequently. See Appendix for a definition and reconciliation to GAAP net income.
(b) Includes $0.11 of transaction expenses related to the GE acquisition
Quarterly Dividends
$0.28 $0.41 $0.43 $0.43 Core EPS $0.49 $0.50 $0.52 $0.38 $0.72 $0.68 $0.65
(a)
$0.61
TTM - 105% coverage
$0.62 (b)

184 0 92 102 0 70 0 152 195 99 206 202 201 221 3 0 103 120 0 115 99 0 171 146
Blackstone Mortgage Trust 5
50%
22%
10%
5%
3%
2% 8%
Condo
Portfolio Composition
$9.7 billion portfolio comprising 103 senior loans secured by institutional quality real estate concentrated in major markets: loans secured by assets located in New York, California and London/UK comprise 54% of the portfolio
Office Multifamily
Hotel
MHC
Other
Retail
Geographic Diversification(a) Collateral Diversification(a)
(a) In certain instances, we finance our loans through the non-recourse sale of a senior loan interest that is not included in our consolidated financial statements. See Note 2 in our Form 10-Q for further discussion. Total loan exposure encompasses the entire loan we originated and financed, including $1.0 billion of such Non-Consolidated Senior Interests as of March 31, 2017.
(b) Reflects LTV as of the date loans were originated or acquired by BXMT
Weighted Average LTV(b)
61% States that comprise less than 1% of total loan portfolio
CAN 5%
CA 17%
WA 2%
HI 5%
DC 2%
TX 2%
VA 2%
GA 3%
IL 7%
FL 10% UK
14%
OR 1%
AZ 1%
CO 1% MD
1%
NC 1%
NL 1%
MA 1%
DEU 1%
NY 23%
184 0 92 102 0 70 0 152 195 99 206 202 201 221 3 0 103 120 0 115 99 0 171 146
Blackstone Mortgage Trust 6
Balance Sheet
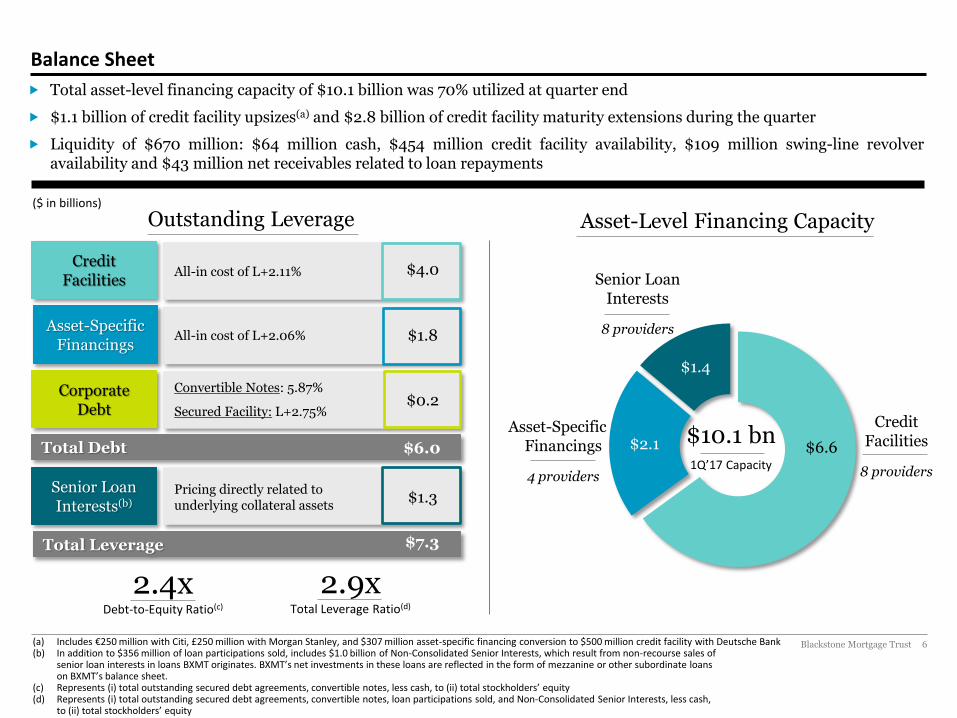
Total asset-level financing capacity of $10.1 billion was 70% utilized at quarter end
$1.1 billion of credit facility upsizes(a) and $2.8 billion of credit facility maturity extensions during the quarter
Liquidity of $670 million: $64 million cash, $454 million credit facility availability, $109 million swing-line revolver availability and $43 million net receivables related to loan repayments
Asset-Level Financing Capacity ($ in billions)
Outstanding Leverage
2.4x Debt-to-Equity Ratio(c)
2.9x Total Leverage Ratio(d)
Credit Facilities
All-in cost of L+2.11%
Asset-Specific Financings
All-in cost of L+2.06%
Corporate Debt
Convertible Notes: 5.87%
Secured Facility: L+2.75%
Total Debt
Senior Loan Interests(b)
Pricing directly related to underlying collateral assets
Total Leverage
$4.0
$1.8
$0.2
$1.3
$6.0
$7.3
(a) Includes €250 million with Citi, £250 million with Morgan Stanley, and $307 million asset-specific financing conversion to $500 million credit facility with Deutsche Bank (b) In addition to $356 million of loan participations sold, includes $1.0 billion of Non-Consolidated Senior Interests, which result from non-recourse sales of
senior loan interests in loans BXMT originates. BXMT’s net investments in these loans are reflected in the form of mezzanine or other subordinate loans on BXMT’s balance sheet.
(c) Represents (i) total outstanding secured debt agreements, convertible notes, less cash, to (ii) total stockholders’ equity (d) Represents (i) total outstanding secured debt agreements, convertible notes, loan participations sold, and Non-Consolidated Senior Interests, less cash,
to (ii) total stockholders’ equity
$6.6 $2.1
$1.4
Credit Facilities
8 providers
Senior Loan Interests
8 providers
Asset-Specific Financings
4 providers
$10.1 bn
1Q’17 Capacity
184 0 92 102 0 70 0 152 195 99 206 202 201 221 3 0 103 120 0 115 99 0 171 146
Blackstone Mortgage Trust 7
9%
91%
21%
79%
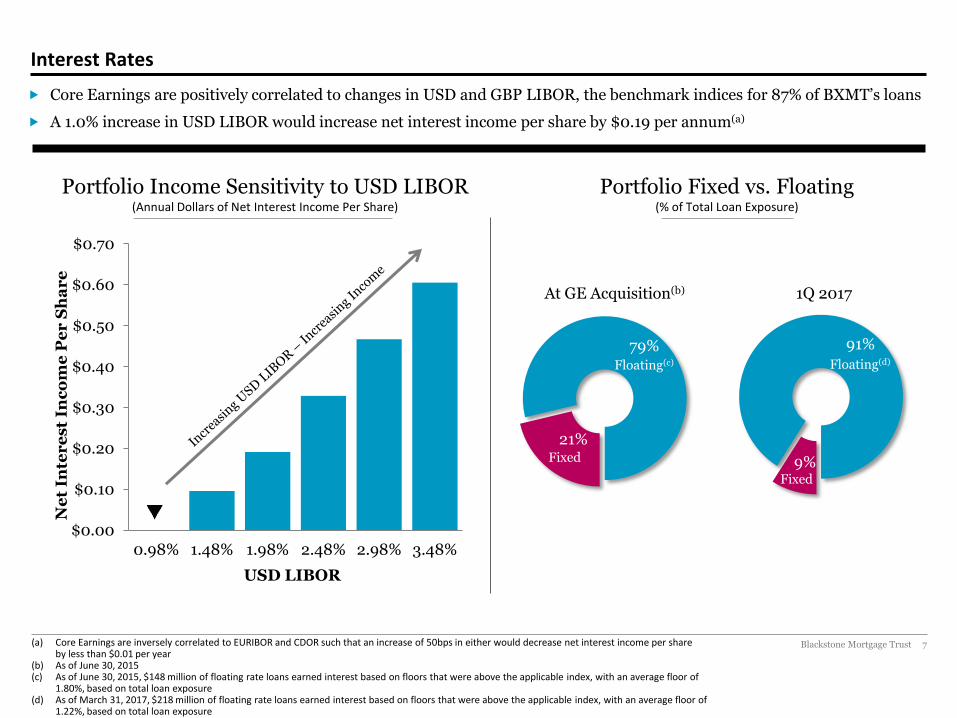
Interest Rates
Core Earnings are positively correlated to changes in USD and GBP LIBOR, the benchmark indices for 87% of BXMT’s loans
A 1.0% increase in USD LIBOR would increase net interest income per share by $0.19 per annum(a)
(a) Core Earnings are inversely correlated to EURIBOR and CDOR such that an increase of 50bps in either would decrease net interest income per share by less than $0.01 per year
(b) As of June 30, 2015 (c) As of June 30, 2015, $148 million of floating rate loans earned interest based on floors that were above the applicable index, with an average floor of
1.80%, based on total loan exposure (d) As of March 31, 2017, $218 million of floating rate loans earned interest based on floors that were above the applicable index, with an average floor of
1.22%, based on total loan exposure
Portfolio Income Sensitivity to USD LIBOR
(Annual Dollars of Net Interest Income Per Share)
Ne
t In
ter
es
t In
co
me
Pe
r S
ha
re
USD LIBOR
Portfolio Fixed vs. Floating
(% of Total Loan Exposure)
Floating(c)
Fixed
Floating(d)
89%
Fixed
At GE Acquisition(b) 1Q 2017
$0.00
$0.10
$0.20
$0.30
$0.40
$0.50
$0.60
$0.70
0.98% 1.48% 1.98% 2.48% 2.98% 3.48%

Appendix
184 0 92 102 0 70 0 152 195 99 206 202 201 221 3 0 103 120 0 115 99 0 171 146
Blackstone Mortgage Trust 9
4Q'16 LoansOutstanding
Fundings Repayments 1Q'17 LoansOutstanding
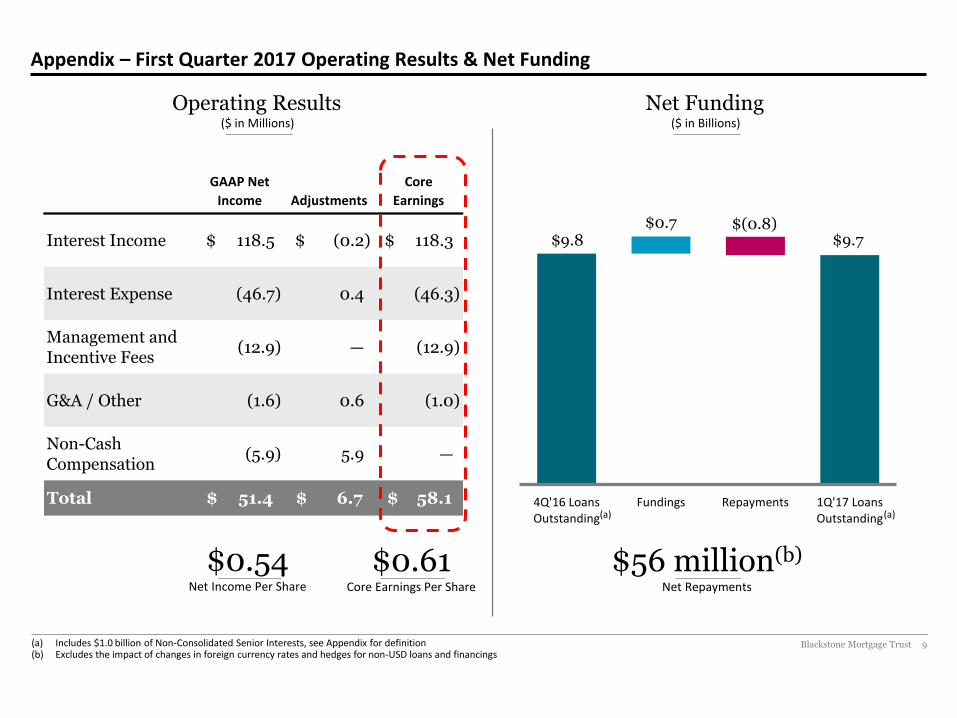
Appendix – First Quarter 2017 Operating Results & Net Funding
$56 million(b) Net Repayments
Net Funding
($ in Billions)
Operating Results
($ in Millions)
$9.8 $0.7 $(0.8)
$9.7
(a) Includes $1.0 billion of Non-Consolidated Senior Interests, see Appendix for definition (b) Excludes the impact of changes in foreign currency rates and hedges for non-USD loans and financings
$0.61 Core Earnings Per Share
$0.54 Net Income Per Share
GAAP Net
Income Adjustments
Core
Earnings
Interest Income 118.5$ (0.2)$ 118.3$
Interest Expense (46.7) 0.4 (46.3)
Management and Incentive Fees
(12.9) — (12.9)
G&A / Other (1.6) 0.6 (1.0)
Non-CashCompensation
(5.9) 5.9 —
Total 51.4$ 6.7$ 58.1$ (a) (a)
184 0 92 102 0 70 0 152 195 99 206 202 201 221 3 0 103 120 0 115 99 0 171 146
Blackstone Mortgage Trust 10
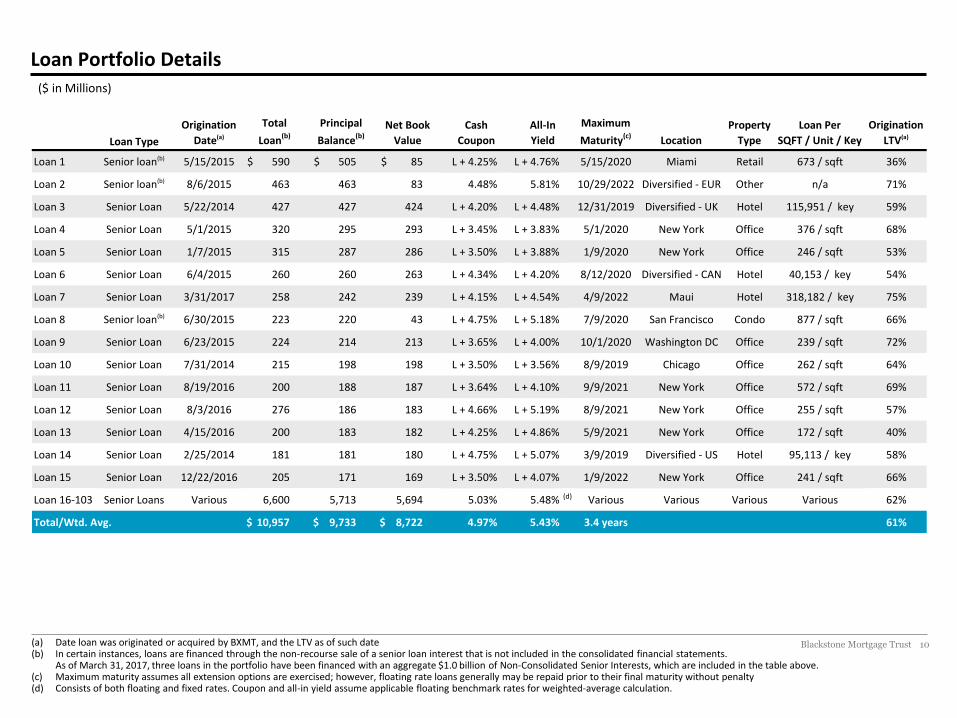
Loan Portfolio Details
(a) Date loan was originated or acquired by BXMT, and the LTV as of such date (b) In certain instances, loans are financed through the non-recourse sale of a senior loan interest that is not included in the consolidated financial statements.
As of March 31, 2017, three loans in the portfolio have been financed with an aggregate $1.0 billion of Non-Consolidated Senior Interests, which are included in the table above. (c) Maximum maturity assumes all extension options are exercised; however, floating rate loans generally may be repaid prior to their final maturity without penalty (d) Consists of both floating and fixed rates. Coupon and all-in yield assume applicable floating benchmark rates for weighted-average calculation.
($ in Millions)
Loan Type
Origination
Date(a)
Total
Loan(b)
Principal
Balance(b)
Net Book
Value
Cash
Coupon
All-In
Yield
Maximum
Maturity(c)
Location
Property
Type
Loan Per
SQFT / Unit / Key
Origination
LTV(a)
Loan 1 Senior loan(b) 5/15/2015 590$ 505$ 85$ L + 4.25% L + 4.76% 5/15/2020 Miami Retail 673 / sqft 36%
Loan 2 Senior loan(b) 8/6/2015 463 463 83 4.48% 5.81% 10/29/2022 Diversified - EUR Other n/a 71%
Loan 3 Senior Loan 5/22/2014 427 427 424 L + 4.20% L + 4.48% 12/31/2019 Diversified - UK Hotel 115,951 / key 59%
Loan 4 Senior Loan 5/1/2015 320 295 293 L + 3.45% L + 3.83% 5/1/2020 New York Office 376 / sqft 68%
Loan 5 Senior Loan 1/7/2015 315 287 286 L + 3.50% L + 3.88% 1/9/2020 New York Office 246 / sqft 53%
Loan 6 Senior Loan 6/4/2015 260 260 263 L + 4.34% L + 4.20% 8/12/2020 Diversified - CAN Hotel 40,153 / key 54%
Loan 7 Senior Loan 3/31/2017 258 242 239 L + 4.15% L + 4.54% 4/9/2022 Maui Hotel 318,182 / key 75%
Loan 8 Senior loan(b) 6/30/2015 223 220 43 L + 4.75% L + 5.18% 7/9/2020 San Francisco Condo 877 / sqft 66%
Loan 9 Senior Loan 6/23/2015 224 214 213 L + 3.65% L + 4.00% 10/1/2020 Washington DC Office 239 / sqft 72%
Loan 10 Senior Loan 7/31/2014 215 198 198 L + 3.50% L + 3.56% 8/9/2019 Chicago Office 262 / sqft 64%
Loan 11 Senior Loan 8/19/2016 200 188 187 L + 3.64% L + 4.10% 9/9/2021 New York Office 572 / sqft 69%
Loan 12 Senior Loan 8/3/2016 276 186 183 L + 4.66% L + 5.19% 8/9/2021 New York Office 255 / sqft 57%
Loan 13 Senior Loan 4/15/2016 200 183 182 L + 4.25% L + 4.86% 5/9/2021 New York Office 172 / sqft 40%
Loan 14 Senior Loan 2/25/2014 181 181 180 L + 4.75% L + 5.07% 3/9/2019 Diversified - US Hotel 95,113 / key 58%
Loan 15 Senior Loan 12/22/2016 205 171 169 L + 3.50% L + 4.07% 1/9/2022 New York Office 241 / sqft 66%
Loan 16-103 Senior Loans Various 6,600 5,713 5,694 5.03% 5.48% (d) Various Various Various Various 62%
Total/Wtd. Avg. 10,957$ 9,733$ 8,722$ 4.97% 5.43% 3.4 years 61%
184 0 92 102 0 70 0 152 195 99 206 202 201 221 3 0 103 120 0 115 99 0 171 146
Blackstone Mortgage Trust 11
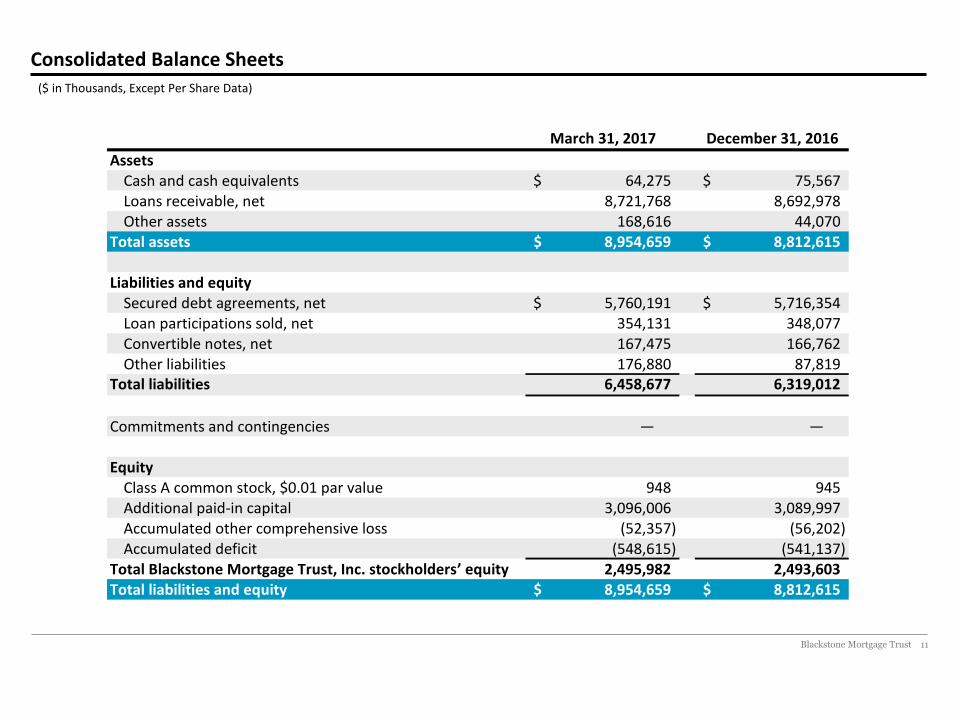
Consolidated Balance Sheets ($ in Thousands, Except Per Share Data)
March 31, 2017 December 31, 2016
AssetsCash and cash equivalents 64,275$ 75,567$ Loans receivable, net 8,721,768 8,692,978 Other assets 168,616 44,070
Total assets 8,954,659$ 8,812,615$
Liabilities and equitySecured debt agreements, net 5,760,191$ 5,716,354$ Loan participations sold, net 354,131 348,077 Convertible notes, net 167,475 166,762 Other liabilities 176,880 87,819
Total liabilities 6,458,677 6,319,012
Commitments and contingencies — —
EquityClass A common stock, $0.01 par value 948 945 Additional paid-in capital 3,096,006 3,089,997 Accumulated other comprehensive loss (52,357) (56,202) Accumulated deficit (548,615) (541,137)
Total Blackstone Mortgage Trust, Inc. stockholdersʼ equity 2,495,982 2,493,603 Total liabilities and equity 8,954,659$ 8,812,615$

184 0 92 102 0 70 0 152 195 99 206 202 201 221 3 0 103 120 0 115 99 0 171 146
Blackstone Mortgage Trust 12
Three Months Ended March 31, Year Ended March 31,
2017 2016
Income from loans and other investments
Interest and related income 118,517$ 123,025$
Less: Interest and related expenses 46,674 45,381
Income from loans and other investments, net 71,843 77,644
Other expenses
Management and incentive fees 12,921 13,613
General and administrative expenses 7,428 6,795
Total other expenses 20,349 20,408
Gain on investments at fair value — 66
Income from equity investment in unconsolidated subsidiary — 138
Income before income taxes 51,494 57,440
Income tax provision 89 241
Net income 51,405$ 57,199$
Net income attributable to non-controlling interests — (152)
Net income attributable to Blackstone Mortgage Trust, Inc. 51,405$ 57,047$
Per share information (basic and diluted)
Weighted-average shares of common stock outstanding 94,993,386 94,067,769
Net income per share of common stock 0.54$ 0.61$
Consolidated Statements of Operations
($ in Thousands, Except per Share Data)
184 0 92 102 0 70 0 152 195 99 206 202 201 221 3 0 103 120 0 115 99 0 171 146
Blackstone Mortgage Trust 13
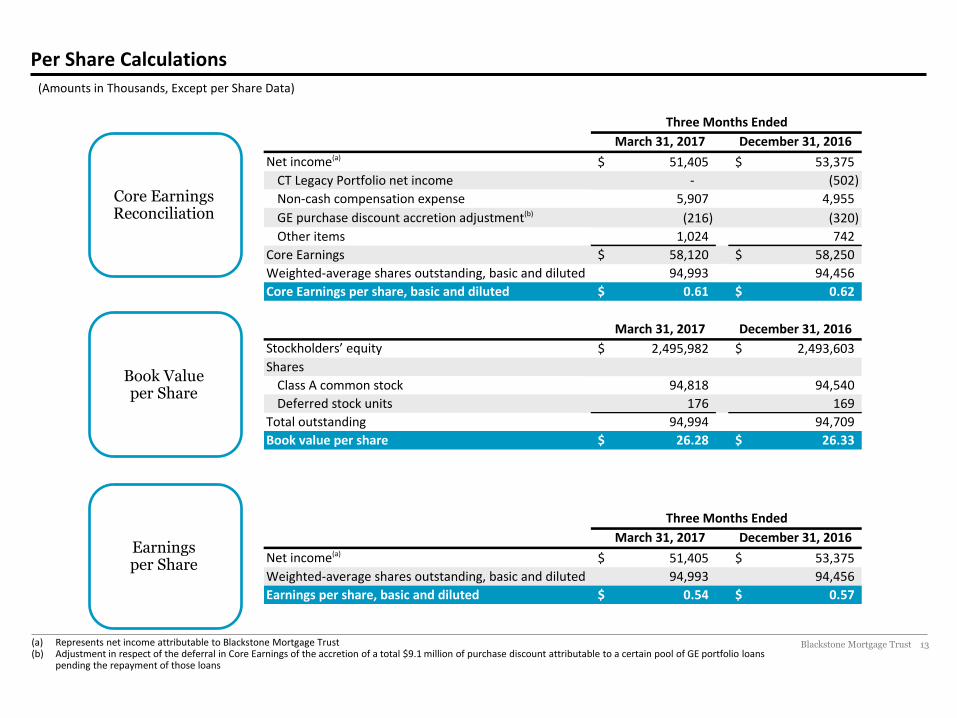
Per Share Calculations
(Amounts in Thousands, Except per Share Data)
(a) Represents net income attributable to Blackstone Mortgage Trust (b) Adjustment in respect of the deferral in Core Earnings of the accretion of a total $9.1 million of purchase discount attributable to a certain pool of GE portfolio loans
pending the repayment of those loans
Core Earnings Reconciliation
Book Value per Share
Earnings per Share
Three Months Ended
March 31, 2017 December 31, 2016
Net income(a) 51,405$ 53,375$
CT Legacy Portfolio net income - (502)
Non-cash compensation expense 5,907 4,955
GE purchase discount accretion adjustment(b) (216) (320)
Other items 1,024 742
Core Earnings 58,120$ 58,250$
Weighted-average shares outstanding, basic and diluted 94,993 94,456
Core Earnings per share, basic and diluted 0.61$ 0.62$
Three Months Ended
March 31, 2017 December 31, 2016
Net income(a) 51,405$ 53,375$
Weighted-average shares outstanding, basic and diluted 94,993 94,456
Earnings per share, basic and diluted 0.54$ 0.57$
March 31, 2017 December 31, 2016
Stockholdersʼ equity 2,495,982$ 2,493,603$
Shares
Class A common stock 94,818 94,540
Deferred stock units 176 169
Total outstanding 94,994 94,709
Book value per share 26.28$ 26.33$

184 0 92 102 0 70 0 152 195 99 206 202 201 221 3 0 103 120 0 115 99 0 171 146
Blackstone Mortgage Trust 14
Reconciliation of Net Income to Core Earnings(a)
(a) In 3Q 2015, BXMT revised the basis of reporting for Core Earnings to be net of incentive fees. Core EPS numbers indicated in the chart for 3Q 2014, 4Q 2014 and 1Q 2015 are adjusted from the previously reported $0.50, $0.52 and $0.54, respectively, so as to be comparable to Core EPS numbers in 3Q 2015 and subsequently.
(b) Represents net income attributable to Blackstone Mortgage Trust (c) Adjustment in respect of the deferral in Core Earnings of the accretion of a total $9.1 million of purchase discount attributable to a certain pool of GE portfolio loans
pending the repayment of those loans
(Amounts in Thousands, Except per Share Data)
Three Months Ended
Sep 30,
2013
Dec 31,
2013
Mar 31,
2014
Jun 30,
2014
Sep 30,
2014
Dec 31,
2014
Mar 31,
2015
Jun 30,
2015
Sep 30,
2015
Dec 31,
2015
Mar 31,
2016
Jun 30,
2016
Sep 30,
2016
Dec 31,
2016
Mar 31,
2017
Net income(b) 8,320$ 7,079$ 13,065$ 33,466$ 22,024$ 21,490$ 35,393$ 29,284$ 66,888$ 65,264$ 57,047$ 63,081$ 64,794$ 53,375$ 51,405$
CT Legacy Portfolio net (income) loss (437) 3,670 970 (15,508) (134) 4,833 (8,400) (1,857) (401) (3,408) 183 (3,825) (1,805) (502) -
Non-cash compensation expense 94 1,158 1,834 2,382 1,619 2,528 3,297 3,396 3,188 3,460 4,687 4,836 4,949 4,955 5,907
GE purchase discount accretion adjustment(c) - - - - - - - (459) (2,008) (1,542) (1,166) (1,247) (929) (320) (216)
Other items - 107 423 162 404 408 342 416 (119) 310 418 278 (65) 742 1,024
Core Earnings 7,977$ 12,014$ 16,292$ 20,502$ 23,913$ 29,259$ 30,632$ 30,780$ 67,548$ 64,084$ 61,169$ 63,123$ 66,944$ 58,250$ 58,120$
Weighted-average shares outstanding, basic and diluted 28,895 29,364 37,967 47,978 49,211 58,190 58,576 80,941 93,358 93,574 94,068 94,064 94,072 94,456 94,993
Net income per share, basic and diluted 0.29$ 0.24$ 0.34$ 0.70$ 0.45$ 0.37$ 0.60$ 0.36$ 0.72$ 0.70$ 0.61$ 0.67$ 0.69$ 0.57$ 0.54$
Core Earnings per share, basic and diluted 0.28$ 0.41$ 0.43$ 0.43$ 0.49$ 0.50$ 0.52$ 0.38$ 0.72$ 0.68$ 0.65$ 0.67$ 0.71$ 0.62$ 0.61$
184 0 92 102 0 70 0 152 195 99 206 202 201 221 3 0 103 120 0 115 99 0 171 146
Blackstone Mortgage Trust 15
Definitions
Core Earnings: Blackstone Mortgage Trust, Inc. (“BXMT”) discloses Core Earnings, a financial measure that is calculated and presented on the basis of methodologies other than in accordance with generally accepted accounting principles in the United States of America (“GAAP”) in this presentation.
Core Earnings is an adjusted measure that helps BXMT evaluate its performance excluding the effects of certain transactions and GAAP adjustments that it believes are not necessarily indicative of its current loan origination portfolio and operations. Although according to its management agreement BXMT calculates the incentive and base management fees due to its Manager using Core Earnings before incentive fees expense, beginning with the third quarter of 2015, BXMT reports Core Earnings after incentive fees expense, as BXMT believes this is a more meaningful presentation of the economic performance of its class A common stock.
Core Earnings is defined as GAAP net income (loss), including realized gains and losses not otherwise included in GAAP net income (loss), and excluding (i) net income (loss) attributable to the CT Legacy Portfolio, (ii) non-cash equity compensation expense, (iii) depreciation and amortization, (iv) unrealized gains (losses), and (v) certain non-cash items. Core Earnings may also be adjusted from time to time to exclude one-time events pursuant to changes in GAAP and certain other non-cash charges as determined by BXMT’s manager, subject to approval by a majority of its independent directors.
Core Earnings does not represent net income or cash generated from operating activities and should not be considered as an alternative to GAAP net income, or an indication of BXMT’s GAAP cash flows from operations, a measure of BXMT’s liquidity, or an indication of funds available for its cash needs. In addition, BXMT’s methodology for calculating Core Earnings may differ from the methodologies employed by other companies to calculate the same or similar supplemental performance measures, and accordingly, its reported Core Earnings may not be comparable to the Core Earnings reported by other companies.
Non-Consolidated Senior Interests: Senior interests in loans originated and syndicated to third parties. These non-recourse loan participations constitute additional financing capacity and are included in discussions of the loan portfolio.

184 0 92 102 0 70 0 152 195 99 206 202 201 221 3 0 103 120 0 115 99 0 171 146
Blackstone Mortgage Trust 16
Forward-Looking Statements
This presentation may contain forward-looking statements within the meaning of Section 27A of the Securities Act of 1933, as amended, and Section 21E of the Securities Exchange Act of 1934, as amended, which reflect BXMT’s current views with respect to, among other things, BXMT’s operations and financial performance. You can identify these forward-looking statements by the use of words such as “outlook,” “indicator,” “believes,” “expects,” “potential,” “continues,” “may,” “will,” “should,” “seeks,” “predicts,” “intends,” “plans,” “estimates,” “anticipates” or the negative version of these words or other comparable words. Such forward-looking statements are subject to various risks and uncertainties. Accordingly, there are or will be important factors that could cause actual outcomes or results to differ materially from those indicated in these statements. BXMT believes these factors include but are not limited to those described under the section entitled “Risk Factors” in its Annual Report on Form 10-K for the fiscal year ended December 31, 2016, as such factors may be updated from time to time in its periodic filings with the Securities and Exchange Commission (“SEC”) which are accessible on the SEC’s website at www.sec.gov. These factors should not be construed as exhaustive and should be read in conjunction with the other cautionary statements that are included in this presentation and in the filings. BXMT assumes no obligation to update or supplement forward‐looking statements that become untrue because of subsequent events or circumstances.