blackstone bank and stanton banks habitat mapping
TRANSCRIPT

JNCC Report No. 425
Blackstone Bank and Stanton Banks Habitat Mapping
A. Mitchell M. Service R. Bates
February 2009
© JNCC, Peterborough 2009
ISSN 0963-8091

For further information please contact: Marine Protected Sites Team Joint Nature Conservation Committee Monkstone House City Road Peterborough Cambridgeshire PE1 1JY Email: [email protected] Tel: +44 (0)1733 866840 Fax: +44 (0)1733 555948 Website: www.jncc.gov.uk/marineprotectedsites
This report should be cited as: Mitchell, A., Service, M., Bates, R. 2009. Blackstone Bank and Stanton Banks Habitat Mapping. JNCC Report No. 425

Blackstone Bank and Stanton Banks Habitat Mapping
1
Contents Contents ...................................................................................................................................... 1 1. Methods and materials ....................................................................................................... 2
1.1. Acoustic surveys ........................................................................................................ 2 1.2 Ground-truthing surveys ............................................................................................ 3 1.3 RoxAnn data analysis ................................................................................................. 3 1.4 Multibeam data analysis ............................................................................................. 4 1.5 Ground-truthing data analysis .................................................................................... 4
2. Results and discussion ........................................................................................................ 9 2.1 Blackstone Bank ......................................................................................................... 9 2.2 Stanton Banks ........................................................................................................... 14
3. References ........................................................................................................................ 20

Blackstone Bank and Stanton Banks Habitat Mapping
2
1 Methods and materials All surveys were undertaken aboard the RV Lough Foyle (AFBI) during June 2003 and February 2004. 1.1 Acoustic surveys Multibeam sonar datasets were collected over two areas in Stanton Banks and in the Blackstone Bank area on 25th and 26th June 2003 respectively, using an EM2000 Multibeam Echosounder (MBES, Kongsberg Simrad Ltd; operators: J. Hancock and C. Harper). The sonar has a frequency of 200kHz and ping rate of 10Hz. It operates with 111 roll-stabilised beams per ping with a 1.5 degree beam width along-track and 2.5 degree beam width across-track. The system has an angular coverage of 120 degrees. In addition to bathymetric coverage, the system has an integrated seabed imaging capability through a combination of phase and amplitude detection (referred to here as ‘backscatter’). The EM2000 was deployed with the following ancillary parts:
• Seapath 200 – this provides real-time heading, attitude, position and velocity solutions with a 1pps timing clock for update of the sonar together with full differential corrections supplied by the IALA GPS network. The GPS derived heading is measured with a 2.5m beam, 0.075 degree RMS (root mean square).
• Motion Reference Unit - MRU5 - Roll and pitch accuracies of 0.03 degree RMS. • Sound velocity meter - Applied Microsystems singaround velocimeter to measure
sound velocity at the sonar head. The data derived from the Seapath 200 and MRU5 were integrated within the Merlin acquisition software suit for full geo-reference solutions at each sounding (depth) location. A number of software suites were used during the acquisition and subsequent data reduction. During the survey Merlin acquisition software was used on a Solaris UNIX workstation (Simrad Survey Systems) for acquisition and quality assurance/quality control. This recorded all the acquisition data and also applied sound velocity at the sonar head and through the water column. Roll, pitch, timing, and heading calibrations were undertaken with this software. Tidal corrections were applied to the multibeam data from 10 minute tidal curves modelled using information from the Admiralty Tide Tables and the UK Hydrographic Office. The tidal models were entered directly into the navigation computer and to the multibeam acquisition software during acquisition so that real-time corrections could be made. Post-processing of bathymetric data was carried by J. Hancock of Kongsberg Simrad. This involved using the software Neptune (Simrad Survey Systems) Version 4.11 for Windows to produce cleaned XYZ data (eastings, northings, depth). Subsequent to removing poor data points the bathymetric and amplitude (backscatter) data were processed using the Poseidon suite of programmes for production of the sonar mosaics. Further quality assurance/quality control was performed on the data using the software packages Cfloor (Roxar) and Fledermaus (IVS).

Blackstone Bank and Stanton Banks Habitat Mapping
3
RoxAnn datasets were collected by M. Service (AFBI) on 25th and 26th June 2003 during the multibeam sonar survey. RoxAnn datasets were obtained using a hull-mounted 38kHz transducer, a GroundMaster RoxAnn signal processor combined with RoxMap software, saving at a rate of between 1 and 5s intervals. An Atlas differential Geographical Positioning Systems (dGPS), providing positional information, was integrated via the RoxMap laptop. Track spacing varied between 500m for the large area and 100m for the multibeam survey areas. For the purpose of this report work, the RoxAnn data has only been used in its raw format, post erroneous datapoint removal. Sidescan sonar data was not collected due to equipment failure early on in the June 2003 research cruise. 1.2 Ground-truthing surveys Ground-truthing information was gathered at Stanton Banks on 25th June 2003 by M. Service. Four video tows were completed for sub-area 1 and three tows for sub-area 2. Ground-truthing data was collected for the Blackstone Bank region on 16th February 2004 by M. Service and J. Strong (QUB). Ground-truthing was limited at Stanton Banks by poor weather conditions and the size of the survey area. The video tows were undertaken from a towed sledge that was deployed from the stern of the ship. The amount of cable deployed and depth of water were noted during these surveys such that sledge layback could be calculated and the position corrected. The video system comprised of a Kongsberg Simrad Osprey underwater video camera operated using a Simrad video control deck unit and recorded on VHS tapes via a Panasonic video recorder. Positional information was imprinted on the film using a dGPS linked to TrakView overlay system. Videotapes were later copied to DVD using a Philips DVD Recorder. A stills camera system (Photosea 1000A 35mm camera and Photosea 1500S strobe) was also fitted to the sledge and operated through the Simrad video control unit. Slide film was used, with the resulting stills scanned onto computer using a Nikon CoolScan IV slide scanner. These images were enhanced using Adobe Photoshop, and catalogued with positional information, which was determined as far as possible using the associated video footage. The video footage from both Stanton Banks and Blackstone Bank was of excellent quality due to the superb visibility in these areas. This has allowed further processing of the footage in terms of detailed substrate and conspicuous species descriptions for each tow. A total of 53 stills images were successfully captures over three tows in Stanton Banks, and 23 stills images were captured at Blackstone Bank. These stills are of very good resolution facilitating habitat and biotope characterisation. 1.3 RoxAnn data analysis The datasets was exported from RoxMap and split into a number of spreadsheets due to the large size of the datasets so that they could be edited and examined within MS Excel, and by using non-earth plots in a GIS to examine erroneous depth values. The data was cleaned with respect to depth spikes and ‘sticking’ of E1, E2 (‘roughness’ and ‘hardness’) and depth values that occurred when the ship was turning. No positional jumps were present in the data. The data was then transferred to an MS Access database which was read through the project GIS, such that the RoxAnn data was overlaid upon the multibeam dataset and classed

Blackstone Bank and Stanton Banks Habitat Mapping
4
according to roughness or hardness. This later facilitated the spatial discrimination of habitats. 1.4 Multibeam data analysis Multibeam data for three sites (Stanton Banks 1, Stanton Banks 2 and Blackstone Bank) was provided as XYZ files and as backscatter mosaics (in .tif format). The XYZ files contained positions given in Universal Transverse Mercator (Zone 29N) projection, based on 5x5m grid spacing. The XYZ files were imported into MS Access, where the depth values were converted into negative numbers such that they were comparable with the RoxAnn data format and would enable production of elevation models. The data was loaded into ArcMap 8.3, and TIN (triangulated irregular networks) files created from the data using the 3D Analyst extension, which use depth as the elevation field. The TIN files were then converted into Raster grids. These elevation / bathymetric data layers were then presented in ArcScene 8.3, where they are viewed in 3D. The accompanying datasets (RoxAnn tracks, ground-truthing data) were overlaid on these bathymetric layers to improve habitat interpretation. The multibeam backscatter images were georeferenced in ArcMap and also added into ArcScene in 3D. 1.5 Ground-truthing data analysis The video data was played back and where the footage was of adequate quality, notes were made of substratum type and characterising species. The positions of the video at such points were noted from the video overlay. Positional data, saved every 5 seconds, was also recorded using RoxAnn during the research. The stills images showed more detail than the video footage and added to the habitat descriptions by facilitating species identification. The positions of each tow was entered into MS Access, with the associated species and substratum information. Once all footage had been examined, habitats were assigned to each area based upon the species and substratum descriptions. Habitat classification adheres as closely as possible to the JNCC Marine Habitat Classifications v97.06 (Connor et al, 1997) and v04.05 (Connor et al, 2004). The habitat categories identified from the video data are provided in Tables 1a and 1b below.

Blackstone Bank and Stanton Banks Habitat Mapping
5
Table 1a. Habitat Descriptions for the Blackstone Banks area.
Habitat code Substratum description Characterising fauna/flora Energy environment Comments CGS (sand) – no still available
Megarippled or rippled coarse sand with pebbles in troughs. Occasional scattered cobbles and boulders, and high quantity of comminuted shell.
Very little, occasional Venerupid shell or Pecten maximus
Moderate energy, deep wave-exposed
As per National Marine Habitat Classification version 97.06. (Connor et al, 1997)
CGS (cobbles)
Cobbles and/or pebbles on coarse, clean sand or gravel. Occasional scattered boulders.
Crustose bryozoans and sponges, Pomatoceros spp., Balanus crenatus, occasional Holothuria forskali, Diazona volacea and Pentapora fascialis
Moderate energy As per National Marine Habitat Classification version 97.06 (Connor et al, 1997)

Blackstone Bank and Stanton Banks Habitat Mapping
6
Habitat code Substratum description Characterising fauna/flora Energy environment Comments CR.HCR.DpSp.PhaAxi - Phakellia ventilabrum and Axinellid sponges on deep, wave-exposed rock
Bedrock or boulders. Thin layers of sand and/or comminuted shell in rock fissures
Diverse branching and massive sponges (Axinella infundibuliformis, Polymastia sp., Phakellia ventibrum, Raspailia sp). Crustose bryozoans, sponges and coralline algae where water depth is shallower than 45m.
High energy – wave and tidal current exposure.
As per National Marine Habitat Classification version 04.05 (Connor et al, 2004).
CR.MCR.EcCr.CarSp.PenPcom – Caryophyllia smithii and sponges with Pentapora fascialis, Porella compressa and crustose communities on wave-exposed circalittoral rock
Bedrock or boulders, some cobble.
Pentapora fascialis, Diazona volacea, Caryophyllia smithii and Holothuria forskali, bryozoan crusts, sponges also common
Moderate – high energy. Wave and current exposed.
As per National Marine Habitat Classification version 04.05 (Connor et al, 2004).
Blackstone Bank and Stanton Banks Habitat Mapping
7
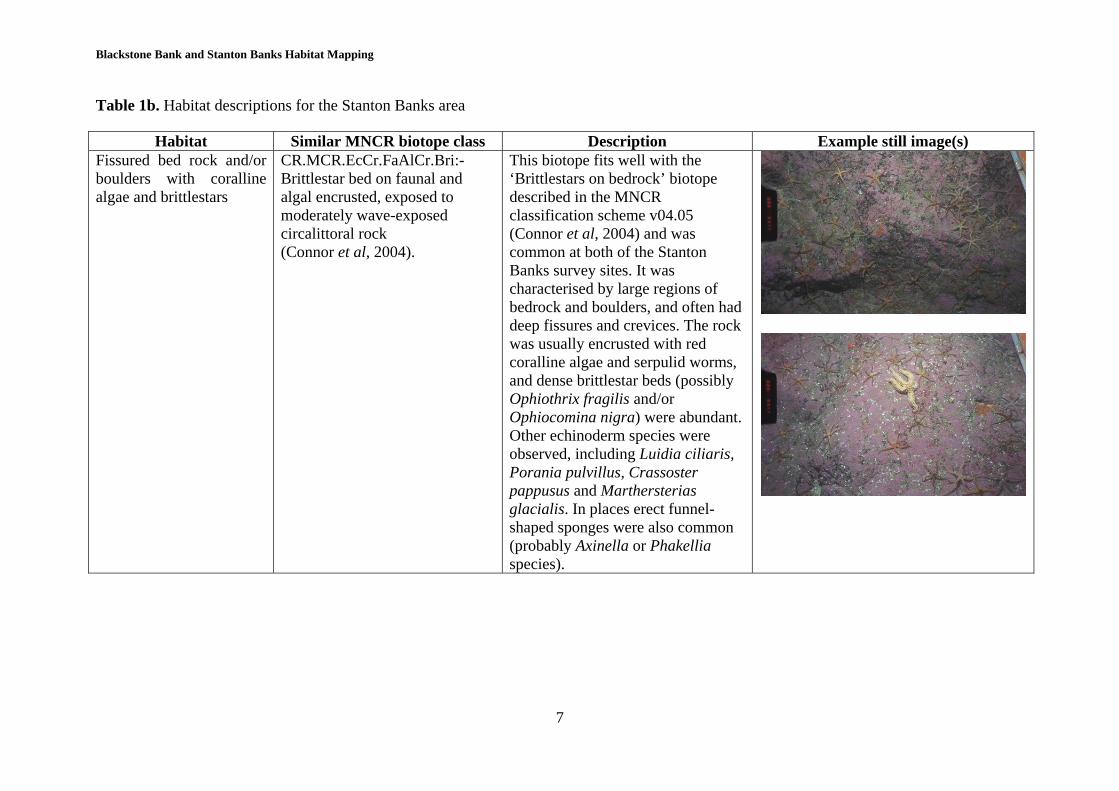
Table 1b. Habitat descriptions for the Stanton Banks area
Habitat Similar MNCR biotope class Description Example still image(s) Fissured bed rock and/or boulders with coralline algae and brittlestars
CR.MCR.EcCr.FaAlCr.Bri:- Brittlestar bed on faunal and algal encrusted, exposed to moderately wave-exposed circalittoral rock (Connor et al, 2004).
This biotope fits well with the ‘Brittlestars on bedrock’ biotope described in the MNCR classification scheme v04.05 (Connor et al, 2004) and was common at both of the Stanton Banks survey sites. It was characterised by large regions of bedrock and boulders, and often had deep fissures and crevices. The rock was usually encrusted with red coralline algae and serpulid worms, and dense brittlestar beds (possibly Ophiothrix fragilis and/or Ophiocomina nigra) were abundant. Other echinoderm species were observed, including Luidia ciliaris, Porania pulvillus, Crassoster pappusus and Marthersterias glacialis. In places erect funnel-shaped sponges were also common (probably Axinella or Phakellia species).

Blackstone Bank and Stanton Banks Habitat Mapping
8
Habitat Similar MNCR biotope class Description Example still image(s) Cobbles with Faunal crust Cr.MCR.EcCr.FaAlCr:- Faunal
and algal crusts on exposed to moderately wave-exposed circalittoral rock (Connor et al, 2004).
This biotope was similar to the ‘Fissured bedrock’ biotope described above but the substrate consisted of cobbles over gravel/sand rather than bedrock and boulders. Brittlestars were also absent although many of the cobbles were encrusted with coralline algae and serpulid worms. There was very little other conspicuous epifauna.
Clean gravel with patchy epifaunal crust (primarily serpulid worms) with thin sand veneers
CGS: Circalittoral gravel and sands (Connor et al, 1997)
This biotope consisted of gravel with what appeared to be interstitial sand (possibly a thin sand veneer?). There were few conspicuous epifaunal species, with the exception of serpulid worms. There are no obvious biotopes previously described into which this habitat type can be fitted, other than the broad biotope complex ‘Circalittoral gravel and sands.
Clean shell sand with little epifauna
CGS: Circalittoral gravel and sands (Connor et al, 1997)
This biotope was extensively mega-rippled in certain areas. This habitat was graduated with increasing amount of cobble encrusted with tubeworms. Cobble and gravel was more prevalent in the troughs of the ripples. There was no conspicuous epifauna associated with these areas.

Blackstone Bank and Stanton Banks Habitat Mapping
9
2. Results and discussion 2.1 Blackstone Bank Figures 1 and 2 below show a bathymetric plot for the Blackstone Bank survey area (in 2 dimensions and in 3 dimensions). The region shows two quite extensive distinctly raised areas, one to the far northeast of the area and one to the southwest, with an additional series of seafloor rises that are more scattered than the previous in the middle of the area. The areas to the northeast and southwest rise from approximately 50 m to 25 m at the ‘peaks’, and each area encompasses some 2 km2. These bathymetric rises correspond to bedrock outcrops and constitute rocky reef habitat. The peaks in the central survey area, although showing less extensive cover of the seafloor, also rise from 50 m to 23 m and represent bedrock outcrops. These are likely to be highly heterogeneous areas in terms of biological community composition. The maximum depth in the survey area is 95 m, and consists of a level area to the west of the region.

Blackstone Bank and Stanton Banks Habitat Mapping
10
Figure 1. Bathymetric plot in 2 dimensions for Blackstone Bank, showing positions of ground truthing data.

Blackstone Bank and Stanton Banks Habitat Mapping
11
Figure 2. Bathymetric plot in 3 dimensions for Blackstone Bank (vertical exaggeration 5-fold). Figure 3 below shows the multibeam backscatter data for the region, overlaid with the video tow data which has been classed according to habitat as detailed above and positionally corrected to allow for layback. It is possible from the multibeam backscatter to identify a number of different classes of reflectors, with a paler reflecting area to the northwest, corresponding to the deep water area, and darker more heterogeneous reflectors to the south and east of the survey area. There also appears to be a class of ‘in between’ reflector which may correspond to a mixed substratum. The darker reflecting areas seem to correspond in general to the bathymetric highs from figure 1, and in terms of identified habitats seem to line up with the rock habitats interspersed with cobble areas. The paler reflecting areas correspond in general to the gravel and sands biotopes.

Blackstone Bank and Stanton Banks Habitat Mapping
12
Figure 3. Multibeam backscatter for Blackstone Bank with classed video tows. Based upon the bathymetric information, backscatter reflectance classes, the roughness and hardness data provided along the survey tracks by RoxAnn and the video ground-truthing it was possible to map four habitats throughout the survey region by interrogating each data layer within a GIS and manually drawing habitat coverage. This was also facilitated by 3D viewing in ArcScene GIS. The resulting habitat map is displayed in figure 4, with a 3D view given in figure 5 (with classed video tows overlaid).

Blackstone Bank and Stanton Banks Habitat Mapping
13
Figure 4. Final Habitat Map for the Blackstone Bank Area, showing positions of ground-truthing.

Blackstone Bank and Stanton Banks Habitat Mapping
14
Figure 5. Three-dimensional view of Habitat Map for the Blackstone Bank Area, with classed video tracks overlaid. Figures 4 and 5 substantiate the initial observations made from inspection of the multibeam bathymetric data. The red and blue areas represent two reef biotopes, which also cover a number of transitional states. Together these habitats constitute approximately 3.5 km2 of seafloor and represent over 50% of the seabed in this area. The reef areas are separated by a series of cobble and sand areas, which to the northwest were extensively rippled (most probably through wave action). The reef habitat itself shows a wide range of slope angles, and is interspersed by fissures and gullies that are filled with comminuted shell and small boulders. The reefs in this area are characterised by diverse, rich sponge communities with bryozoan crusts and the common occurrence of the holothurian Holothuria forskali and ascidian Diazona violacea. The cobble and sand areas are generally far lower in diversity, due in part most probably to the mobile nature of the substrate. In some of the sand areas Pecten maximus was observed. Close to the ‘peaks’ where there is a degree of sediment stabilisation the cobbles show a rich encrusting community of sponges and bryozoans, with the frequent occurrence of Caryophyllia smithii and other ‘reef-dwellers’. 2.2 Stanton Banks The two areas surveyed within Stanton Banks showed impressive bathymetry, with great rocky outcrops covering well over half of each survey. These rose from 83 m to 34 m in area 1, and from 90 m to 44 m in Area 2. These are shown in three dimensions in Figures 6 and 7, respectively. Area 2 in particular shows deep gullies between large peaks of bedrock.

Blackstone Bank and Stanton Banks Habitat Mapping
15
Figure 6. Bathymetry of Stanton Banks Area 1 (south) (vertical exaggeration 6-fold) (orientated so N at top).
Figure 7. Bathymetry of Stanton Banks Area 2 (North) (vertical exaggeration 6-fold) (orientated so N at top). As part of the Mapping Inshore Coral Habitats (MINCH) Project, co-ordinated by the Scottish Association for Marine Science, the following geological interpretation was given for the two Stanton Banks sites: “Both areas surveyed on Stanton Banks show a landscape criss-crossed by deep gullies (up to 30m deep). The gullies have regular orientations from north of 35°, 135° and 175° in Stanton

Blackstone Bank and Stanton Banks Habitat Mapping
16
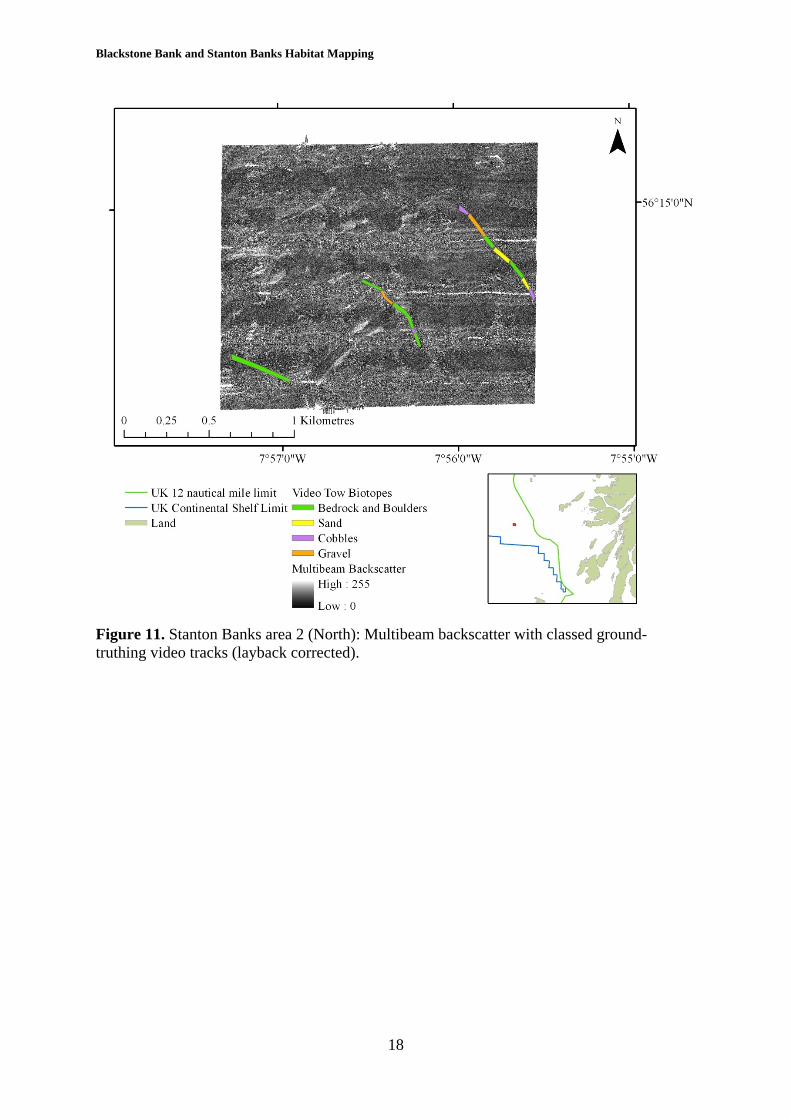
1 (South, Figure 6) and 50°, 140° and 155° in Stanton 2 (North, Figure 7). The major gullies, N175° in Stanton 1 and N50° in Stanton 2, are approximately 100 m wide, the other orientations are typically a few tens of metres wide. These are probably fracture orientations within the Lewisian rocks. The distinct differences in the orientation of fractures between the two areas, although only about 10 km apart, may reflect differing terrain within the Lewisian. These gullies are large and if they represent erosion along fracture lines they indicate deeper erosion than evident onshore. This may reflect that onshore the depth of erosion is obscured by soil cover and that this area, Stanton Bank, was exposed to more intense periglacial erosion for longer than those areas onshore that may been covered with ice and that the gullies were swept clean during the marine transgression. Based on visual surveys in 1970 (Eden et al., 1971) it is presumed that the seabed is exposed rock with coarse shell sand in the gullies. This is confirmed by the unfavourable conditions for grab sampling and the results of the video drops.” (Roberts et al, 2004) The following figures (9, 10, 11 and 12) are the result of the overlaying and interpretation of the multibeam bathymetric and backscatter datasets, coupled with the video ground-truthing and RoxAnn track data.
Figure 9. Stanton Banks area 1 (south): Multibeam backscatter with classed ground-truthing video tracks (layback corrected).

Blackstone Bank and Stanton Banks Habitat Mapping
17
Figure 10. Stanton Banks area 1 (south): Habitat Map with positions of video tows.
Blackstone Bank and Stanton Banks Habitat Mapping
18
Figure 11. Stanton Banks area 2 (North): Multibeam backscatter with classed ground-truthing video tracks (layback corrected).

Blackstone Bank and Stanton Banks Habitat Mapping
19
Figure 12. Stanton Banks area 2 (North): Habitat Map with positions of video tows. The two survey areas at Stanton Banks were relatively topographically complex with extensive gullies (see above). The topographical highs corresponded to regions of bedrock outcrops heavily encrusted with coralline algae, keel worms and brittlestars, with regions of sponges in places. The seabed at the bottom of the gullies was predominantly clean sand, and between these regions were areas of cobbles and gravel. Each area represents approximately 2.5 km2 and 1.5 km2 of reef habitat respectively. Interpretation of the backscatter data revealed four acoustically distinct ground-types, and from the limited ground-truthing they correlated well with the four biotopes (Figures 9 and 11). It is likely that the varying degree of sand underlying the cobbles and gravel modified the acoustic signature of these regions, and therefore enabled the four biotopes to be distinguished. No evidence of Lophelia pertusa was found from the video tows, or from any ‘signature’ patterns on the multibeam bathymetries.

Blackstone Bank and Stanton Banks Habitat Mapping
20
3. References Connor, D.W., Dalkin, M.J., Hill, T.O., Holt, R.H.F., & Sanderson, W.G. 1997. Marine Nature Conservation Review: marine biotope classification for Britain and Ireland. Vol. 2. Sublittoral biotopes. Version 97.06. Joint Nature Conservation Committee Report, No. 230. Connor, D.W., Allen, J.H., Golding, N., Howell, K.L., Lieberknecht, L.M., Northen, K.O. & Reker, J.B. 2004. The Marine Habitat Classification for Britain and Ireland Version 04.05 JNCC, Peterborough ISBN 1 861 07561 8 (internet version) www.jncc.gov.uk/MarineHabitatClassification Roberts, J.M., Bates, C.R., Brown C.J., Long, D., Mitchell, A., Service, M. & Wilson, C.K. 2004. Mapping Inshore Coral Habitats: The MINCH project. Final report. 115pp.

Blackstone Bank and Stanton Banks Habitat Mapping
21
JOINT NATURE CONSERVATION COMMITTEE REPORT DISTRIBUTION Report number 425 JNCC Contract number n/a Date received March 2004 Report title Blackstone Bank and Stanton Banks Habitat Mapping Contract title As above Contractors Agri-Food and Biosciences Institute Northern Ireland
(formerly the Department of Agriculture and Rural Development – DARD) and Queens University, Belfast.
Comments These surveys were run under a Memorandum of
Agreement (MoA) between JNCC, the Agri-Food and Biosciences Institute and Queens University, Belfast. The aim of these surveys was to map the extent of Annex I bedrock reef in two areas to the north and east of Northern Ireland, and to characterise the biological communities present.
Restrictions None

Blackstone Bank and Stanton Banks Habitat Mapping
22
DISTRIBUTION: JOINT NATURE CONSERVATION COMMITTEE Nominated Officer (Neil Golding) 1 copy JNCC report collection 2 copies Project area (Marine Protected Sites) 1 + top copy, spares NATURAL ENGLAND HQ Library, Peterborough 1 copy Northminster House Peterborough SCOTTISH NATURAL HERITAGE HQ, Library, Edinburgh 1 copy Silvian House 3rd Floor East 231 Corstorphine Road Edinburgh EH12 7AT COUNTRYSIDE COUNCIL FOR WALES HQ, Library, Bangor, 1 copy Maes Y Ffynnon Penrhosgarnedd Bangor Gwynedd LL57 2DW NORTHERN IRELAND ENVIRONMENT AGENCY HQ Library, Belfast 1 copy Klondyke Building Cromac Avenue Gasworks Business Park Lower Ormeau Road Belfast BT7 2JA
Blackstone Bank and Stanton Banks Habitat Mapping
23
OTHERS M Service 1 copy Agri-Food and Biosciences Institute Newforge Lane Belfast BT9 5PK A Clements 1 copy Marine Habitat Mapping Group Centre for Coastal and Marine Research School of Environmental Sciences University of Ulster Cromore Road, Coleraine BT52 1SA Relevant recipients who must receive copies; Copyright Libraries Agent, 5 copies 100 Euston Road, London NW1 2HQ British Library, Legal Deposit Office, 1 copy Boston Spa, Wetherby, West Yorkshire LS23 7BQ Official Publications 1 copy Proquest Information & Learning The Quorum Barnwell Road Cambridge CB5 8SW Zoological Record (Thomson Zoological Ltd) 1 copy Innovation Centre York Science Park Innovation Way Heslington York YO10 5DG NHBS 5 copies 2-3 Wills Road Totnes Devon TQ9 5XN Pam Moncur 1 copy Scottish Natural Heritage Publication Department Battleby

Blackstone Bank and Stanton Banks Habitat Mapping
24
Redgorton Perth PH1 3EW