black workers in the bay area - northstar news
TRANSCRIPT
Black Workers in the Bay AreaEEmmppllooyymmeenntt TTrreennddss aanndd JJoobb QQuuaalliittyy:: 11997700 ––22000000
SStteevveenn CC.. PPiittttss,, PPhh..DDCCeenntteerr ffoorr LLaabboorr RReesseeaarrcchh aanndd EEdduuccaattiioonn,, UUCC BBeerrkkeelleeyy
NNoovveemmbbeerr 22000066CCEENNTTEERR FFOORR LLAABBOORR RREESSEEAARRCCHH
AANNDD EEDDUUCCAATTIIOONN
IInnssttiittuuttee ooff IInndduussttrriiaall RReellaattiioonnss
UUnniivveerrssiittyy ooff CCaalliiffoorrnniiaa
22552211 CChhaannnniinngg WWaayy
BBeerrkkeelleeyy,, CCAA 9944772200--55555555
OOffffiiccee ((551100)) 664422--00332233
FFaaxx ((551100)) 664422--66443322
hhttttpp::////llaabboorrcceenntteerr..bbeerrkkeelleeyy..eedduu
The Center for Labor Research and Education (Labor Center) is a public service and outreach program
of the UC Berkeley Institute of Industrial Relations.Founded in 1964, the Labor Center conducts research
and education on issues related to labor and employment.The Labor Center’s curricula and leadership trainings
serve to educate a diverse new generation of labor leaders. The Labor Center conducts research on topicssuch as job quality and workforce development issues,and we work with unions, government, and employers
to develop innovative policy perspectives and programs.We also provide an important source of research and
information on unions and the changing workforce forstudents, scholars, policymakers and the public.


Black Workers in the Bay Area: Employment Trends and Job Quality: 1970 – 2000
Steven C. Pitts, Ph.D.
Center for Labor Research and EducationUniversity of California, Berkeley
November 2006
Cover photo courtesy of Service Employees International Union


TA B L E O F C O N T E N T S
1
TABLE OF CONTENTS
2 Executive Summary
14 Introduction: “Beyond Wal-Mart”
19 Chapter One: Low-wage Employment and Black Workers: A Persistent Problem
32 Chapter Two: Low-wage Employment: Black Men, Black Women, and Black Youth
51 Chapter Three: Changes in the Industrial Distribution of Black Workers: The Increasing Importance of Low-wage Industries
61 Chapter Four: Changes in the Occupational Distribution of Black Workers: The Continued Importance of Low-wage Occupations and the Rising Importance of Professional Occupations
72 Chapter Five: An Industrial and Occupation Look at the Differing Fates of Black Women and Black Men between 1970 and 2000
77 Conclusion: Toward a New Approach to the Crisis of Work in the Black Community

2
Black Workers in the Bay Area: Employment Trends and Job Quality: 1970 – 2000
Executive SummaryBeyond Wal-Mart
Everyday, thousands of African Americans in the Bay Area begin their routine by heading towork. Unfortunately, many of these workers are employed in bad jobs that do not allow for adecent quality of life. The jobs they hold don’t pay well. Their jobs don’t provide retirementand health benefits. Their jobs are “dead-end” jobs inasmuch as they do not link to better jobseither within the firm or at other businesses. Many of their jobs don’t provide the on-the-jobprotection from employers’ arbitrary decisions: a protection which comes from the presenceof a union. As a result, many workers are forced to work multiple jobs in order to buy essen-tial goods and services. Others are forced to choose between food and prescription drugs,between gasoline and decent child care, or between decent housing and college for their kids.The living standards for these workers and their families suffer as a result.
However, these low-wage Black workers are largely invisible when it comes to the discussionemanating in public policy circles and little attention is paid to their plight. A great deal ofattention is placed on the problem of unemployment in the Black community. Job trainingand job readiness programs are designed to assist youth and jobless adults find employment.But while these programs might be successful at finding employment for some of the joblessand might be effective at moving some low-wage workers into better jobs, nothing is done totransform the millions of low-wage jobs into jobs that pay family-sustaining wages.
In reality, there is a two-dimensional crisis of work in the Black community. One dimensionis the crisis of unemployment, which is the typical face of the jobs problem among AfricanAmericans. In the popular media, the unemployment crisis is captured by scenes of approxi-mately 11,000 applicants—largely Black and Latino—lining up for 400 vacancies in anOakland Wal-Mart. However, this scene portrays only one part of the employment dilemmafacing African Americans. The other serious problem is the crisis of low-wage jobs held byBlacks who have employment. Too many African Americans work at jobs that do not pro-vide wages (and benefits) to properly raise a family.
The presence of Wal-Mart in central city communities reflects a perceived Hobson’s Choicebetween no jobs or low-wage jobs. Unemployment in the Black community is high; at the sametime, low-wage work is endemic in the Black community. Wal-Mart and its supporters advocatethat communities with high poverty rates should accept a bad job as being better than no job.Some Black communities are rejecting these limited options. The largely Black citizens ofInglewood, California rallied and rejected Wal-Mart’s plans to open a store in their city. Black res-idents of the Southside of Chicago said no to this “no job or a Wal-Mart low-wage job” choice andblocked the entry of the chain demanding quality jobs. Chicago citizens banded together and per-suaded the city council to pass a “big-box” ordinance that required large retailers to pay a “livingwage”. Support for this law was so high that the council was almost able to override a mayoral veto.

E X E C U T I V E S U M M A R Y
3
The dilemma of no jobs or low-wage jobs reflects the dominance of “low road” economic devel-opment policies. These policies seek to attract businesses to regions and cities regardless of thequality of jobs they offer residents. These policies foster intense competition between cities fortax bases and a vicious race to the bottom as local governments offer higher and higher subsi-dies that actually lower the net benefits of the firm’s presence in a region. The proliferation ofthese policies has created such an atmosphere that many local leaders decry any policies thatseek to mitigate the negative impacts of new firms or create labor standards as antithetical toan economically healthy region. These policies result in the proliferation of low-wage jobs.What is needed is to go “beyond Wal-Mart” to identify public policies that raise labor stan-dards and transform bad jobs as well as reduce the high levels of unemployment.
——————
Since the end of slavery, visionaries within the Black community, including Ida B. Wells,W.E.B. Bois, and Paul Robeson, have led a freedom movement with the dual objectives ofeliminating racial inequality and improving the quality of life for Blacks in this country.Beginning in the mid-1950s with the Brown v. Board of Education Supreme Court decisionand the Montgomery Bus Boycott, this struggle took the form of the modern civil right move-ment. The activities of millions of people in that movement brought about the end of de juresegregation in the United States and opened up new opportunities for African Americans.The hope was that the end of the legal barriers to advancement and the enactment of poli-cies to redress the historic racial injustices would result in a qualitative change in life out-comes for Blacks in this country. Thirty years have passed since the victories of the moderncivil rights movement and it is appropriate to examine whether these successes have, in fact,led to the desired changes. This report, “Black Workers in the Bay Area: EmploymentTrends and Job Quality: 1970 – 2000”, looks at one sphere of Black life—the labor mar-ket—and explores the question of Black advancement in this arena since 1970. It presents adetailed view of the Black workforce with a focus on the incidence of low-wage work. To theextent the end of legal segregation has not lowered the incidence of low-wage work, this real-ity speaks to the need for renewed efforts at transforming the realities of Black workers in thelabor market.
Low-wage Employment and Black Workers: A Persistent Problem
For the purposes of this report, we define a low-wage job in 2000 to be a job that paid a wageless than or equal to $11.50 per hour, twice the California state minimum wage at that time.This threshold is a conservative estimate of income needed for basic needs because it severe-ly understates the income required to live decently in the Bay Area. A 2004 report releasedby the United Way of the Bay Area determined that for a two-parent family with children topay for basic expenses, each parent would need to work full-time and each earn between $11and $18 per hour.

4
Black Workers in the Bay Area: Employment Trends and Job Quality: 1970 – 2000
In order to examine the prevalence of low-wage jobs prior to 2000, a mechanism had to bedeveloped to apply the 2000 threshold to earlier years in a consistent manner. In 2000, thethreshold of twice the minimum wage generated an annual income of two-thirds the medianincome in Bay Area. A person working 2000 hours at $11.50 per hour would earn $23,000per year; the annual median income in the Bay Area in 2000 was $35,500. Consequently, weused a cutoff of two-thirds the median income in the Bay Area for thresholds in 1970.
Figure ALow-wage Job Threshold
Year Low-wage Threshold2000 $11.501970 $2.31
Using this threshold, the analysis of the data found a slight increase in the proportion of Blackworkers with low-wage jobs between 1970 and 2000. In 1970, 25.7% of all Black workersheld low-wage jobs; by 2000, this figure had risen to 27.8%. Given the conservative defini-tion of low-wage work, this small rise underestimates the seriousness of this problem for theBlack community.
Often, the public portrayal of low-wage work confines it to realm of part-time workers. Theimplication here is that if low-wage workers would simply work full-time their poverty con-dition would be alleviated. The actual data indicates otherwise. In 1970, 18.4% of full-timeworkers received low wages; in 2000, this figure rose to 21.4%. In addition, the proportion oflow-wage workers who had full-time jobs rose dramatically between 1970 and 2000. In 1970,37.4% of all low-wage workers held full-time jobs; by 2000, 49.2% of all low-wage workersheld full-time jobs.
Low-wage Employment: Black Men, Black Women and Black Youth
The proportion of Blacks earning low wages has stayed constant at approximately one-quarterof the workforce. However, this reality masks sharp divergences between the trajectories ofBlack men and Black women workers in the labor market. In addition, Black youth have foundit increasingly difficult to obtain employment with decent wages.
Black MenSince 1970, there has been a tremendous deterioration in job outcomes for Black men. Keymeasures of labor market performance include labor force participation rates (the proportion ofthe population that is either working or seeking employment); unemployment rates (the proportionof the labor force that is seeking employment); the prevalence of full-time work (the proportion of

E X E C U T I V E S U M M A R Y
5
the population with a full-time job); and the prevalence of low-wage work (the proportion of work-ers with low-wage jobs). By these measures, the years between 1970 and 2000 witnessed a sharpdeterioration in outcomes for Black men. As mentioned earlier in this chapter, Black menshowed an increased propensity not to be in the labor force and a lower rate of holding full-time employment between 1970 and 2000. Thus, the labor force participation rate for Blackmales fell from 82.4% to 68.5%, and the propensity to maintain full-time employment fellfrom 45.7% to 39.3%. In addition, the rate of unemployment rose: in 1970, 4.2% of work-ing age Black males were unemployed; in 2000, the rate was 9.5%. With respect to low-wageemployment, the proportion of Black male workers with low-wage jobs rose from 14.9% to27.0% between 1970 and 2000.
Examining full-time work, in 1970, 11.7% of full-time Black male workers earned low wages;in 2000, the percentage had risen to 21.3%. In addition, full-time jobs constituted a growingproportion of low-wage employment for Black men. In 1970, 45.8% of low-wage Black maleworkers held full-time jobs; in 2000, 52.6% of low-wage Black male workers held full-time jobs.
Black Women Since 1970, Black women have fared better than Black men in the aggregate, but this over-all performance masks important diversity among Black women. Between 1970 and 2000, theproportion of Black women holding low-wage jobs fell from 38.9% to 28.6%. Focusing juston full-time Black women workers, 29.4% of full-time Black women workers earned lowwages in 1970; in 2000, the figure was 21.4%.
This picture of overall improvement is more complicated when the data is viewed from otherperspectives. Examining low-wage Black women workers, in 1970, 33.5% worked full time;by 2000, this figure rose to 46.2%. In addition, labor market performance varied by age. Foryoung women (ages 18-25), the prevalence of full-time work fell slightly as did the labor forceparticipation rate; for the same age categories, the unemployment rate rose slightly. For olderage categories, these indicators improved. (The sole exception to this rule being the unem-ployment rate for women between ages 25 and 35.) Educational attainment did not improvelabor market participation, except when women had college degrees. (Obtaining a highschool degree did improve prospects for holding full-time employment.)
The age of Black women workers and the level of their educational attainment did influencethe prevalence of low-wage work. For instance, while the percentage of Black women hold-ing low-wage jobs fell among college graduates and remained stable among women with atleast some college, the rates rose among women with less education. In addition, while theproportion of Black women over 36 years of age who worked at low wages fell between 1970and 2000, it rose for younger Black women.

6
Black Workers in the Bay Area: Employment Trends and Job Quality: 1970 – 2000
Young Black WorkersSince 1970, young Black workers find themselves increasingly concentrated in low-wage jobs.With respect to low-wage employment, prospects have worsened for young Black workerssince 1970. In that year, 40.2% of young Black workers had low-wage jobs; by 2000, the fig-ure has risen to 63.6%. The prevalence of low-wage work increased for young Black workerswith full-time jobs; between 1970 and 2000, the increase was from 29.0% to 58.6%.
The Increasing Importance of Low-wage Industries
The key story emerging from the analysis of the industrial distribution of Black workers is thatindustries which provide low wages to large numbers of its workers have an increasing impor-tance in the employment prospects of Black workers. Between 1970 and 2000, low-wageindustries played an increasing role in the employment prospects of Black workers. Threeindustries that were among the leading employers of Black workers saw a significant leap intheir ranking between 1970 and 2000. Business Services (ranked #10 in 1970; ranked #1 in2000); Retail (1970: #15; 2000: #5); and Non-Hospital Medical and Other Health Services(1970: #18; 2000: #8). In all three industries, at least one-third of Black workers earned lowwages in 2000. In addition, six of the top industries in 2000 experienced an expansion of theirlow-wage Black workforce between 1970 and 2000. Figures B and C summarize this data.
Figure BTop Industries
2000 & 1970 Rankings
Industry 2000 Rank 1970 RankBusiness Services 1 10Educational Services 2 1Transportation 3 4Finance, Insurance, and Real Estate 4 3Retail 5 15Hospitals 6 5Federal Public Administration 7 3Non-Hospital Medical and Other Health Services 8 18Durable Goods Manufacturing 9 2Construction 10 7Postal Service 16 8Personal Services 25 6

E X E C U T I V E S U M M A R Y
7
Figure CTop Industries
Change in Percentage of Low-wage Jobs
Rank % Low-wage JobsIndustry 2000 1970 2000 ChangeBusiness Services 1 33.4% 32.4% unchangedEducational Services 2 33.0% 28.8% fewerTransportation 3 7.3% 24.1% moreFinance, Insurance, and Real Estate 4 32.4% 21.5% fewerRetail 5 40.8% 46.4% moreHospitals 6 25.4% 19.8% fewerFederal Public Administration 7 13.3% 18.3% moreNon-Hospital Medical and Other Health Services 8 22.2% 32.7% moreDurable Goods Manufacturing 9 14.1% 21.4% moreConstruction 10 10.7% 23.5% morePostal Service 16 15.9% 10.2% fewerPersonal Services 25 66.2% 49.8% fewer
The Continued Importance of Low-wage Occupations and the Rising Importance of Professional Occupations
The key stories in this analysis are the continued importance of selected low-wage occupa-tions and the rise of importance of certain professional occupations. Between 1970 and 2000,certain occupations within which a disproportionate number of Black workers earn low wagesmaintained their status of key occupations for Bay Area Blacks. Clerical Workers remainedthe largest occupation for Black workers; Sales Workers rose in importance (ranked #9 in1970; ranked #3 in 2000); Operatives (1970: tied for #1; 2000: #6); and Laborers (1970: #4;2000: #8) moved down the list but stayed in the top tier. In each occupation, at least one-third of Black workers earned low wages; figures range from 33.0% among Clerical Workersto 38.8% among Laborers. Of these four, the proportion of low-wage workers rose between1970 and 2000 for all except Sales Workers. (Figures D and E present the 1970 and 200 rank-ings and data on low-wage employment.)

8
Black Workers in the Bay Area: Employment Trends and Job Quality: 1970 – 2000
Figure DTop Occupations
2000 & 1970 Rankings
Occupation 2000 Rank 1970 RankClerical Workers 1 1TManagers, Officials, and Proprietors 2 8Sales Workers 3 9Miscellaneous Professionals 4 13Business Professionals 5 22Operatives 6 1TEducation Professionals 7 11Laborers 8 4Stenographers and Secretaries 9 7Service Workers 10 3Craftsmen 14 5Mechanics 18 10Janitors 19 6
Figure ETop Occupations
Changes in Low-wage Jobs
Occupation 2000 Rank % Low-wage Jobs Change1970 2000
Clerical Workers 1 28.1% 33.0% moreManagers, Officials, and Proprietors 2 13.3% 16.2% moreSales Workers 3 40.8% 35.7% fewerMiscellaneous Professionals 4 40.9% 21.0% fewerBusiness Professionals 5 10.0% 5.7% fewerOperatives 6 18.3% 38.7% moreEducation Professionals 7 20.0% 17.8% fewerLaborers 8 15.6% 38.8% moreStenographers and Secretaries 9 25.6% 22.9% fewerService Workers 10 58.1% 28.4% fewerCraftsmen 14 15.7% 25.5% moreMechanics 18 11.1% 20.8% moreJanitors 19 25.0% 40.1% more

E X E C U T I V E S U M M A R Y
9
In 1970, only one professional occupation was ranked among the top ten occupations held byBlack Workers in the Bay Area—Managers, Officials, and Proprietors—and that occupa-tion group ranked #8. By 2000, three additional professional occupations—MiscellaneousProfessionals; Business Professionals; and Educational Professionals—reached the top ten.In each of these four occupations, the share of Black workers with low wages was relativelysmall, and only in the Managers, Officials, and Proprietors occupation did the share risebetween 1970 and 2000.
In 1970, four traditional blue collar occupations (Operatives; Laborers; Craftsmen; andMechanics) ranked among the ten leading occupations of Bay Area Black workers (rankingtied for #1, #4, #5, and #10, respectively). Of the leading occupations in 1970, those four hadsome of the lowest percentages of low-wage workers. However, by 2000, each occupation fellin ranking (#6, #8, #14, and #18, respectively). In addition, between 1970 and 2000, the per-centage of low-wage workers in those occupations rose significantly.
The Differing Fates of Black Women and Black Men in the Bay Area
Between 1970 and 2000, the trajectory of wages for Black men and Black women moved inopposite directions: Black male workers experienced rising levels of low-wage work, whileBlack female workers experienced falling levels of low-wage work. Much of the difference inthese outcomes can be explained by examining what happened to the percentage of low-wageworkers in the industries and occupations where the Black workforces were predominatelymale or female. In 1970, six of the ten leading industries had men in the majority of their Blackworkforce; 2000, four of these had a larger percentage of low-wage Black workers. Looking atthose leading occupations where Black men outnumbered Black women in 1970, all had a larg-er proportion of low-wage Black workers in 2000. Examining those leading industries andoccupations where Black women outnumbered Black men in 1970, all four of the industriesand three of the six occupations had a lower percentage of low-wage workers in 2000.
Figure F re-examines the top ten industries in 1970 and 2000 (already identified in Chapter3) from the perspective of gender. In 1970, four of the top ten industries are labeled “female”because women make up the majority of the Black workforce; six of the top ten industries in1970 are labeled “male”. All four “female” industries—Educational Services; Hospitals;Personal Services; and Finance, Insurance, and Real Estate—saw a decrease in the propor-tion of low-wage employment. In contrast, four of the six “male” industries—Durable GoodsManufacturing; Federal Public Administration; Transportation; and Construction—sawincreases in the proportion of low-wage jobs.

10
Black Workers in the Bay Area: Employment Trends and Job Quality: 1970 – 2000
Figure FTop Industries (Grouped into “Female” and “Male” Industries)
Change in Percentage of Low-wage Jobs
Industry Rank % Low-wage jobs Change1970 2000 1970 2000
FemaleEducational Services 1 2 33.0% 28.8% fewerHospitals 5 6 25.4% 19.8% fewerPersonal Services 6 25 66.2% 49.8% fewerFinance, Insurance, and Real Estate 9 4 32.4% 21.5% fewerNon-hospital Medical and Other Health Services 18 8 22.2% 32.7% moreMaleDurable Goods Manufacturing 2 9 14.1% 21.4% moreFederal Public Administration* 3 7 13.3% 18.3% moreTransportation 4 3 7.3% 24.1% moreConstruction 7 10 10.7% 23.5% morePostal Service 8 16 15.9% 10.2% fewerBusiness and Repair Services 10 1 33.4% 32.4% unchangedRetail 15 5 40.8% 46.4% more
* In 1970, the majority of the Black workers in the Federal Public Administration industry weremale; by 2000, the majority of the Black workers were female.
The same analysis can be performed looking at the occupational distribution of Black men andwomen. Figure G segments the top occupations in “male” and “female” occupations and pres-ents the rankings in 1970 and 2000 along with the change in the proportion of low-wage jobs.In three of the “female” occupations—Service Workers; Stenographers and Secretaries; andSales Workers—the proportion of low-wage jobs fell. The proportion of low-wage employ-ment rose on all of the “male” occupations (Operatives; Laborers; Craftsmen; Janitors;Managers, Officials, and Proprietors; and Mechanics).

E X E C U T I V E S U M M A R Y
11
Figure GTop Occupations (Grouped into “Female” and “Male” Occupations)
Change in Percentage of Low-wage Jobs
Rank % Low-wage jobs ChangeOccupation 1970 2000 1970 2000FemaleClerical Workers 1 1 28.1% 33.0% moreService Workers* 3 10 58.1% 28.4% fewerStenographers and Secretaries 7 9 25.6% 22.9% fewerSales Workers*** 9 3 40.8% 35.7% fewerEducation Professionals 11 7 20.0% 17.8% fewerBusiness Professionals 22 5 10.0% 5.7% fewerMaleOperatives 1 6 18.3% 38.7% moreLaborers 4 8 15.6% 38.8% moreCraftsmen 5 14 15.7% 25.5% moreJanitors 6 19 25.0% 40.1% moreManagers, Officials, and Proprietors** 8 2 13.3% 16.2% moreMechanics 10 18 11.1% 20.8% moreMiscellaneous Professionals** 13 4 40.9% 21.0% fewer
* male in 2000; ** female in 2000; *** even split in 2000
Recommendations
The persistence of a large number of low-wage Black workers despite the victories of the mod-ern civil rights movement and the dismantling of legal segregation implies a need to transformthe approach to work in the Black community on conceptual, policy, and programmatic levels.
Conceptual ImplicationsThere are two aspects of the job crisis facing Black communities that need to be reconceptu-alized. First, thinking on these issues must broaden beyond a focus on unemployment and rec-ognize the existence of a substantial segment of the Blacks who work at low wages. Second,the reconceptualization must incorporate a structural analysis within any understanding ofthe job crisis facing Black communities. The U.S. economy has stopped producing large num-bers of blue collar jobs which, during previous times, provided good wages. Approaches thatare limited to addressing real or imagined shortcomings on the part of individuals seekingemployment will not be largely successful.

12
Black Workers in the Bay Area: Employment Trends and Job Quality: 1970 – 2000
Policy ImplicationsThe rise in conservative political power over the past thirty years has caused conventionalwisdom to shift responsibility for unemployment from labor market structures to individualjob seekers. Thus policy solutions have emphasized job training and job readiness programsthat seek to impart hard skills, soft skills, or provide applicants with better information onemployment prospects. While individuals need to be fully prepared to take advantage of labormarket opportunities, this singular focus on individuals ignores the prospects that individualsfind in the labor market and the nature of jobs that are held currently by Black workers.Policy makers must recognize the dual nature of the job crisis facing the Black community:the crisis of unemployment and the crisis of low-wage employment, and then explore howpublic policy can influence job quality outcomes in labor market by enacting standards forfirms.
The quality of employment is affected by the skill levels of individuals; the demand for work-ers by firms; and the social and political context that constrains the choices made by individ-uals and firms. While policies often have targeted the first two factors what is forgotten is theability of public policy to influence outcomes by creating standards for labor market behav-ior. Child labor laws, minimum wage laws, and occupational health and safety regulations areexamples of policies that constrain the actions of firms in order to improve the quality of workand, therefore, improve societal well-being. The benefits of these interventions have beenlost in recent years in the rush to create “business-friendly” climates. Consequently, labormarket standards have eroded and the quality of work has declined for most workers. Givenhistorical and contemporary discrimination, Black workers are most adversely impacted bythe decline of these protective standards. There is a need to examine policies that willincrease standards in the areas of: wages (minimum wage laws; living wage laws); benefits(protecting employer-based health care and pension plans); and the right to unionize.
Programmatic ImplicationsThe narrow approach to the job crisis has resulted in an allocation of resources to programsand organizations that have a singular focus on unemployment. These organizations and pro-grams seek to change an individual’s situation by moving that person from unemployment toany job or from a current job to another job. However, recognition of the low-wage job crisisand the contemporary state of the U.S. economy in which millions of low wage jobs are beingcreated on an annual basis requires that resources and programs also address the need to trans-form the low-wage jobs themselves. Labor market standards are one way to effect thesechanges. A wide variety of jurisdictions are exploring ways to extend health benefits to unin-sured workers and some are mandating that selected industries pay workers a higher wage

E X E C U T I V E S U M M A R Y
13
Complementing these programs must be efforts to help workers and their communities organ-ize and work collectively to address the crisis of low-wage jobs. The policy successes of themodern civil rights movement occurred because years of legal segregation and extra-legal vio-lence forged a Black community with dense social networks and a multiplicity of organiza-tions. This organizational capacity sustained the movement through ebbs and flows ofactivism and finally provided the basis for the eventual defeat of de jure segregation. Any sus-tained successes in raising the quality of jobs held by Black workers will require a similar levelof organizational capacity.
In addition, much is made of the role of blue collar manufacturing jobs in the developmentof stable Black communities with decent incomes and the subsequent devastation visitedupon Black communities in the aftermath of the deindustrialization of the 1970s and 1980s.What is not said is that most of these jobs were well-paying jobs because they were union jobs.When Blacks migrated from Georgia and the Carolinas to New York City, they entered alabor market heavily influenced by powerful unions. When Blacks left Alabama andMississippi for jobs in Detroit’s auto industry and Chicago’s steel industry, they helped toorganize the United Auto Workers and the United Steelworkers of America. When Blacksmoved from Louisiana and Texas to California, they found jobs in heavily unionized maritimeand aircraft industries. Unions can enable workers to successful obtain higher wages and bet-ter benefits from their employer. In conjunction with community allies, unions have thepotential to gather the political power necessary to pass legislation and fund the necessaryenforcement agencies to create labor standards that raise the quality of work. An importantelement of any strategy to raise job quality for Black workers will be unionization.

14
Black Workers in the Bay Area: Employment Trends and Job Quality: 1970 – 2000
INTRODUCTION
“Beyond Wal-Mart”
Wake up early any weekday morning and drive through Black communities in the Bay Area.You will see men and women walking to the bus stop. You will also see men and women head-ing to their cars. Everyday, thousands of African Americans in the Bay Area begin their rou-tine by heading to work. They drive the buses throughout the area. They work in the schoolsas teachers, clerical staff, and maintenance workers. Some work as laborers, carpenters, andironworkers and their travels take them to construction sites in any of the counties in theregion. Others drive delivery trucks or repair electrical lines or work in hospitals. Blacks pro-vide security at office buildings and ring up sales in stores. Black people work.
Unfortunately, many of these workers are employed in bad jobs that do not allow for a decentquality of life. The jobs they hold don’t pay well. Their jobs don’t provide retirement andhealth benefits. Their jobs are “dead-end” jobs inasmuch as they do not link to better jobseither within the firm or at other businesses. Many of their jobs don’t provide the on-the-jobprotection from employers’ arbitrary decisions: a protection which comes from the presenceof a union. As a result, many workers are forced to work multiple jobs in order to buy essen-tial goods and services. Others are forced to choose between food and prescription drugs,between gasoline and decent child care, or between decent housing and college for their kids.The living standards for these workers and their families suffer as a result.
However, these low-wage Black workers are largely invisible when it comes to the discussionemanating in public policy circles and little attention is paid to their plight. A great deal ofattention is placed on the problem of unemployment in the Black community. Job trainingand job readiness programs are designed to assist youth and jobless adults find employment.But while these programs might be successful at finding employment for some of the joblessand might be effective at moving some low-wage workers into better jobs, nothing is done totransform the millions of low-wage jobs into jobs that pay family-sustaining wages. Some eco-nomic development plans target the retail sector in an attempt to either revitalize downtowndistricts or generate tax revenue. However, the entry of stores such as Wal-Mart results inemployment at low wages and little or no benefits.
The presence of Wal-Mart in central city communities reflects a perceived Hobson’s Choicebetween no jobs or low-wage jobs. Unemployment in the Black community is high; at thesame time, low-wage work is endemic in the Black community. Wal-Mart and its supportersadvocate that communities with high poverty rates should accept a bad job as being betterthan no job. Some Black communities are rejecting these limited options. The largely Blackcitizens of Inglewood, California rallied and rejected Wal-Mart’s plans to open a store in their
* This research was funded by a grant received from the Akonadi Foundation. The project was completed due the assistanceof Steve Wertheim and Ryan Rideau.

B E Y O N D WA L - M A R T
15
city. Black residents of the Southside of Chicago said no to this “no job or a Wal-Mart low-wage job” choice and blocked the entry of the chain demanding quality jobs. Chicago citi-zens banded together and persuaded the city council to pass a “big-box” ordinance thatrequired large retailers to pay a “living wage”. Support for this law was so high that the coun-cil was almost able to override a mayoral veto.
The dilemma of no jobs or low-wage jobs reflects the dominance of “low road” economic devel-opment policies. These policies seek to attract businesses to regions and cities regardless of thequality of jobs they offer residents. These policies foster intense competition between cities fortax bases and a vicious race to the bottom as local governments offer higher and higher subsi-dies that actually lower the net benefits of the firm’s presence in a region. The proliferation ofthese policies has created such an atmosphere that local leaders decry any policies that seek tomitigate the negative impacts of new firms or create labor standards as antithetical to an eco-nomically healthy region. These policies result in the proliferation of low-wage jobs. What isneeded is to go “beyond Wal-Mart” to identify public policies that raise labor standards andtransform bad jobs as well as reduce the high levels of unemployment.
Such new public policies would attempt to block the low-road path toward economic devel-opment and build a high road alternative. They would include minimum wage, living wage,and industry wage laws that establish wage floors in regional labor markets. They wouldinclude “clawback” policies so that any firms receiving government subsidies would berequired to return a portion or all of these benefits if they did not fulfill promises surroundingjob creation. They include community benefits agreements designed to ensure that low-income neighborhoods and their residents benefit from economic development. They includelinked workforce and economic development programs with incentives to place local resi-dents on a pathway to good paying jobs and seek to develop those sectors of the local econo-my which provide a possibility for decent jobs.
What is also needed are policies designed to empower poor communities and their residentsin economic decision-making. Without this power, any attempts to affect the local econom-ic development game on the behalf of low-income workers will result in political compromis-es yielding few gains to poor people. Foremost in these policies are policies which allow work-ers to organize on their behalf without the interference of employers. Unions are an indispen-sable weapon as low-wage workers seek to raise the quality of the jobs they hold. However, inthe past thirty years, the right to organize has been under attack as deliberate efforts by busi-nesses combined with government regulatory neglect and rapid changes in the structure ofthe economy have resulted in lowest levels of unionization since the Great Depression. Theimpact of the loss of effective workplace collective action has been the loss of dignity on thejob and lower living standards.
——————

16
Black Workers in the Bay Area: Employment Trends and Job Quality: 1970 – 2000
Since the end of slavery, visionaries within the Black community, including Ida B. Wells,W.E.B. Bois, and Paul Robeson, have led a freedom movement with the dual objectives ofeliminating racial inequality and improving the quality of life for Blacks in this country.Beginning in the mid-1950s with the Brown v. Board of Education Supreme Court decisionand the Montgomery Bus Boycott, this struggle took the form of the modern civil right move-ment. The activities of millions of people in that movement brought about the end of de juresegregation in the United States and opened up new opportunities for African Americans.The hope was that the end of the legal barriers to advancement and the enactment of poli-cies to redress the historic racial injustices would result in a qualitative change in life out-comes for Blacks in this country. Thirty years have passed since the victories of the moderncivil rights movement and it is appropriate to examine whether these successes have, in fact,led to the desired changes. This report, “Black Workers in the Bay Area: Employment Trendsand Job Quality: 1970 – 2000,” looks at one sphere of Black life—the labor market—andexplores the question of Black advancement in this arena since 1970. It presents a detailedview of the Black workforce with a focus on the incidence of low-wage work.1 To the extentthe end of legal segregation has not lowered the incidence of low-wage work, this realityspeaks to the need for renewed efforts at transforming the realities of Black workers in thelabor market.
The research project was guided by the three central theses. First, there is a two-dimensionalcrisis of work in the Black community. One dimension is the crisis of unemployment, whichis the typical face of the jobs problem among African Americans. In the popular media, theunemployment crisis is captured by scenes of approximately 11,000 applicants—largely Blackand Latino—lining up for 400 vacancies in an Oakland Wal-Mart.2 However, this scene por-trays only one part of the employment dilemma facing African Americans. The other seriousproblem is the crisis of low-wage jobs held by Blacks who have employment. Too manyAfrican Americans work at jobs that do not provide wages (and benefits) to properly raise afamily. The purpose of this research project is to gain a deeper understanding of the fate ofBlacks who have jobs.3
Second, there is a need to broaden the conceptual approach to problems of Blacks in low-wage labor markets. In her book, Poverty Knowledge, Alice O’Connor draws attention to theways the intellectual approach to studying poverty has changed over the years with differentacademic disciplines and different methodologies dominating the discussion at differentpoints in time.4 Currently, most policy debates accept the notion that the roots of poverty liein the behavior of the individual and attempts are made to address poverty by changing indi-viduals’ characteristics and behavior. What is ignored in this dialogue is the structural or insti-tutional context within which individuals must contend. It is only a short extension ofO’Connor’s argument to see the narrow parameters of the dominant approaches to low-wagework. Focus is almost exclusively on individual workers: what skills they have/don’t have;which of their behaviors are positive or dysfunctional; how to move them away from theircurrent job. Little effort is made to understand: why certain jobs are created; what determinedthe level of pay in these jobs beyond individual characteristics; and what choices do low-wage

B E Y O N D WA L - M A R T
17
workers face in the labor market. In a context where an extremely large number of jobs areprojected in occupations that currently offer low-wages, it is important to expand our knowl-edge beyond the traits of individual workers and examine the structure of the economy. Weneed to do more than attempt to move workers out of these jobs; we need to seek ways toimprove the jobs that will be created.
Third, accompanying this narrow intellectual approach to the low-wage employment issuesfacing Black workers is a limited policy and programmatic approach. Flowing from the analy-sis that roots the dilemma of low-wage work in the skills and behaviors of individuals, policyinitiatives focus upon addressing deficiencies of low-wage job seekers by increasing individu-als’ “job readiness” and their set of hard skills. Education officials and workforce developmentorganizations seek to implement these policies in order to enhance individual employmentprospects. Economic development policies seek to increase the number of jobs through effortsto recruit business and/or efforts to create a favorable business climate. As mentioned earlier,these efforts result in a plethora of low-wage retail jobs or interjurisdictional competition forfirms that drain government treasuries. None of these policies challenge the structures whichgovern firm behavior. While there are attempts to affect firm behavior through minimumwage, living wage, and industry wage laws, these efforts are fought fiercely by various elementsof the business community resistant to any constraint on their behavior.5 What is needed isan expansion of these efforts to complement workforce development policies targeting indi-vidual workers and economic development policies targeting firms.
Key Findings
• Despite the passage of civil rights legislation aimed at providing equal opportunity, the proportion of Black workers has stayed significantly high.
– In 1970, 25.7 % of all Black workers in the Bay Area held low-wage jobs.
– In 2000, the figure was 27.8%.
• Six of the ten industries employing the largest number of Black workers in 2000 employ a larger proportion of low-wage Black workers in 2000 than they did in 1970.
• Since 1970, there has been a tremendous deterioration in job outcomes for Black men whether one measures these outcomes by labor force participation,unemployment, full-time work, or wages.
• Black men and Black women have fared differently in the labor market since 1970. A key reason for these differences has been the differences in the changesin low wage work in the industries and occupations where Black men and Black
women are concentrated.

18
Black Workers in the Bay Area: Employment Trends and Job Quality: 1970 – 2000
Chapter One will provide a broad portrait of the Bay Area African American workforce. Thisportrait will include an overview of the Black working-age population and the prevalence oflow-wage work. Chapter Two will explore the incidence of low-wage work among key demo-graphic groups. We find that a significant portion of the Black workforce is mired in low-wagelabor. While this portion has stayed large between 1970 and 2000, Black men and women fol-lowed different trajectories during this time period. Chapters Three and Four will identify theindustries and occupations that had a high concentration of Black workers in 1970; identifywhether these industries and occupations are still areas of concentration in 2000; and explorehow wages in these sectors have changed for Blacks between 1970 and 2000. We find changesin the relative importance of many industries and occupations; however, the net result is stilla high level of low-wage Black employment. Chapter Five will re-trace the changes in theindustrial and occupational distribution of Black workers through the lens of gender. Thisanalysis will shed some light on how changes in job quality were felt by different segments ofthe Black community. The report will conclude by exploring some of the conceptual, policy,and programmatic implications of this research.

L O W - WA G E E M P L O Y M E N T A N D B L A C K W O R K E R S : A P E R S I S T E N T P R O B L E M
19
CHAPTER ONE
Low-wage Employment andBlack Workers: A PersistentProblem
Chapter Overview
This chapter presents an overview of the Black working-age population with a focus on theincidence of low-wage work.6 It begins by defining the key terms used throughout this reportand provides an overview of the Black working-age population in the Bay Area. It then pres-ents data on the persistence of low-wage work among Black workers. The chapter concludesby sketching the complex relationship between educational attainment and low-wageemployment.
Some key findings in this chapter are:
• Since the end of the modern civil rights movement, the problem of low-wageemployment among Black workers is still significant.
– In 1970, 25.7 % of all Black workers in the Bay Area held low-wage jobs.
– In 2000, the figure was 27.8%.
• Since 1970, the proportion of low-wage employment has been rising regardless of the level of educational attainment.
Key Terms and an Overview of the Bay Area Black Working Age Population
Key DefinitionsThe quality of a job can be measured by several dimensions. Most obvious is the wage the jobprovides. Other criteria include: the availability of retirement, health care, and other non-monetary benefits; the safety environment in the workplace; any linkages to better jobs eitherwithin the firm or with other businesses; and the presence of due process procedure in the faceof the arbitrary use of employer authority. Many commentators have expressed concern overthe large number of bad jobs created by the U.S. economy in recent years. A bad job can bedefined as possessing some combination of the following characteristics:

20
Black Workers in the Bay Area: Employment Trends and Job Quality: 1970 – 2000
• Wages that do not allow an individual to sustain a family at a decent living standard
• The absence of health care and retirement benefits
• Unsafe working conditions
• The lack of career ladders internal or external to the firm
• The lack of protection from the abuse of an employer’s authority
This project will focus on the wages provided by the job. For our purposes, we define a LOW-WAGE job in 2000 to be a job that paid a wage less than or equal to $11.50 per hour, twicethe California state minimum wage at that time. This threshold is a conservative estimate ofincome needed for basic needs because it severely understates the income required to livedecently in the Bay Area. A 2004 report released by the United Way of the Bay Area deter-mined that for a two-parent family with children to pay for basic expenses, each parent wouldneed to work full-time and each earn between $11 and $18 per hour.7
In order to examine the prevalence of low-wage jobs prior to 2000, a mechanism had to bedeveloped to apply the 2000 threshold to earlier years in a consistent manner. In 2000, thethreshold of twice the minimum wage generated an annual income of two-thirds the medianincome in Bay Area. A person working 2000 hours at $11.50 per hour would earn $23,000per year; the median wage in the Bay Area in 2000 was $35,500. Consequently, we used a cut-off of two-thirds the median income in the Bay Area for the threshold in 1970.
Figure 1.1Low-wage Job Threshold
Year Low-wage Threshold2000 $11.501970 $2.31
Other important definitions are straightforward:
Bay Area: The Bay Area was defined by the following nine counties: Alameda, ContraCosta, Marin, Napa, San Francisco, San Mateo, Santa Clara, Solano, and Sonoma.
Working Age Population: All persons between 18-65 years of age (inclusive).
Labor Force: All persons who have had some paid employment or, if they have not, havebeen seeking employment.
Workers: All persons who have worked for pay during the year.
Young Workers: All persons between 18-25 years of age (inclusive).
L O W - WA G E E M P L O Y M E N T A N D B L A C K W O R K E R S : A P E R S I S T E N T P R O B L E M
21
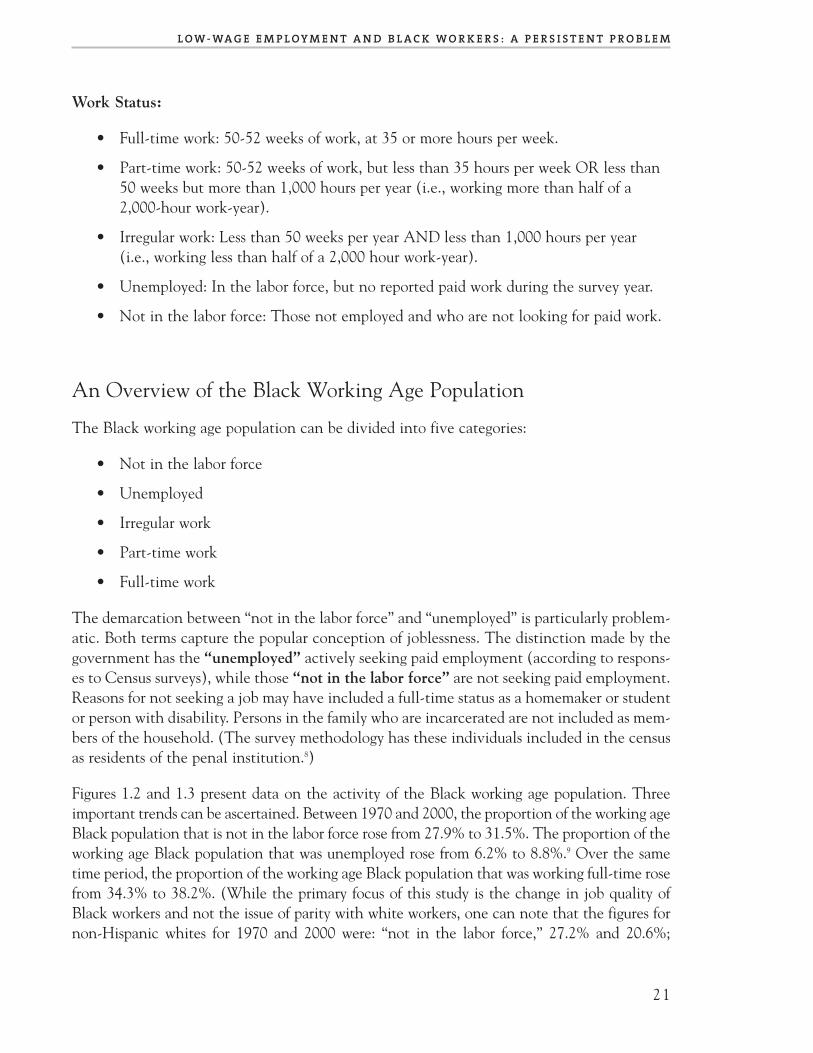
Work Status:
• Full-time work: 50-52 weeks of work, at 35 or more hours per week.
• Part-time work: 50-52 weeks of work, but less than 35 hours per week OR less than50 weeks but more than 1,000 hours per year (i.e., working more than half of a2,000-hour work-year).
• Irregular work: Less than 50 weeks per year AND less than 1,000 hours per year(i.e., working less than half of a 2,000 hour work-year).
• Unemployed: In the labor force, but no reported paid work during the survey year.
• Not in the labor force: Those not employed and who are not looking for paid work.
An Overview of the Black Working Age Population
The Black working age population can be divided into five categories:
• Not in the labor force
• Unemployed
• Irregular work
• Part-time work
• Full-time work
The demarcation between “not in the labor force” and “unemployed” is particularly problem-atic. Both terms capture the popular conception of joblessness. The distinction made by thegovernment has the “unemployed” actively seeking paid employment (according to respons-es to Census surveys), while those “not in the labor force” are not seeking paid employment.Reasons for not seeking a job may have included a full-time status as a homemaker or studentor person with disability. Persons in the family who are incarcerated are not included as mem-bers of the household. (The survey methodology has these individuals included in the censusas residents of the penal institution.8)
Figures 1.2 and 1.3 present data on the activity of the Black working age population. Threeimportant trends can be ascertained. Between 1970 and 2000, the proportion of the working ageBlack population that is not in the labor force rose from 27.9% to 31.5%. The proportion of theworking age Black population that was unemployed rose from 6.2% to 8.8%.9 Over the sametime period, the proportion of the working age Black population that was working full-time rosefrom 34.3% to 38.2%. (While the primary focus of this study is the change in job quality ofBlack workers and not the issue of parity with white workers, one can note that the figures fornon-Hispanic whites for 1970 and 2000 were: “not in the labor force,” 27.2% and 20.6%;

22
Black Workers in the Bay Area: Employment Trends and Job Quality: 1970 – 2000
“unemployed”, 2.5% and 3.9%; and “full-time”, 43.5% and 51.3%.) It is important to note thatthese figures for the entire working age Black population mask sharp differences in the activityof Black men and Black women. These differences will be discussed in the next chapter.
Figure 1.2Portrait of the Bay Area Black Working Age Population (18 - 65)
1970
Figure 1.3Portrait of the Bay Area Black Working Age Population (18 - 65)
2000

L O W - WA G E E M P L O Y M E N T A N D B L A C K W O R K E R S : A P E R S I S T E N T P R O B L E M
23
Black Workers and Low-wage Employment
• Between 1970 and 2000, the proportion of Black workers employed at low-wage jobs remained at approximately 25% despite elimination of legal barriers to Black advancement
• The increase in educational attainment has not completely mitigated the trendtoward low-wage employment among Black workers
One key finding in this research project is the slight increase in the proportion of Black work-ers with low-wage jobs between 1970 and 2000. In 1970, 25.7% of all Black workers held low-wage jobs; by 2000, this figure had risen to 27.8% (see Figure 1.4). Given the conservativedefinition of low-wage work, this small rise underestimates the seriousness of this problem forthe Black community.
Figure 1.4All Black Workers
Percent in Low-wage Jobs 1970 and 2000
25.7%
27.8%

24
Black Workers in the Bay Area: Employment Trends and Job Quality: 1970 – 2000
As mentioned in the introduction to this report, a central thesis guiding this project is thetwo dimensions of the job crisis in the Black community. Thus it is instructive to compare thesegment of the Black labor force holding low-wage jobs to the segment of the Black laborforce that is unemployed. In 1970, 8.6% of the Black labor force was unemployed and 23.4%of the Black labor force held low-wage jobs. In 2000, the unemployed proportion of the Blacklabor force had risen to 12.8%, while the low-wage proportion of the Black labor force hadrisen to 24.2%. (These figures for Black low-wage work differ from those presented earlier inthis paragraph because the former figures were examining only the Blacks who held paidemployment, while the latter figures are examining all Blacks in the labor force —- workingand unemployed. Since latter numbers have the same number of low-wage workers as the for-mer numbers but are looking at a larger overall pool of people, the resulting percentage islower.) This data indicates the number of Black workers receiving low wages far exceeds thenumber of Blacks in the labor force who are unemployed.
Figure 1.5The Black Labor Force
Percent that is Unemployed or in Low-wage Jobs 2000

L O W - WA G E E M P L O Y M E N T A N D B L A C K W O R K E R S : A P E R S I S T E N T P R O B L E M
25
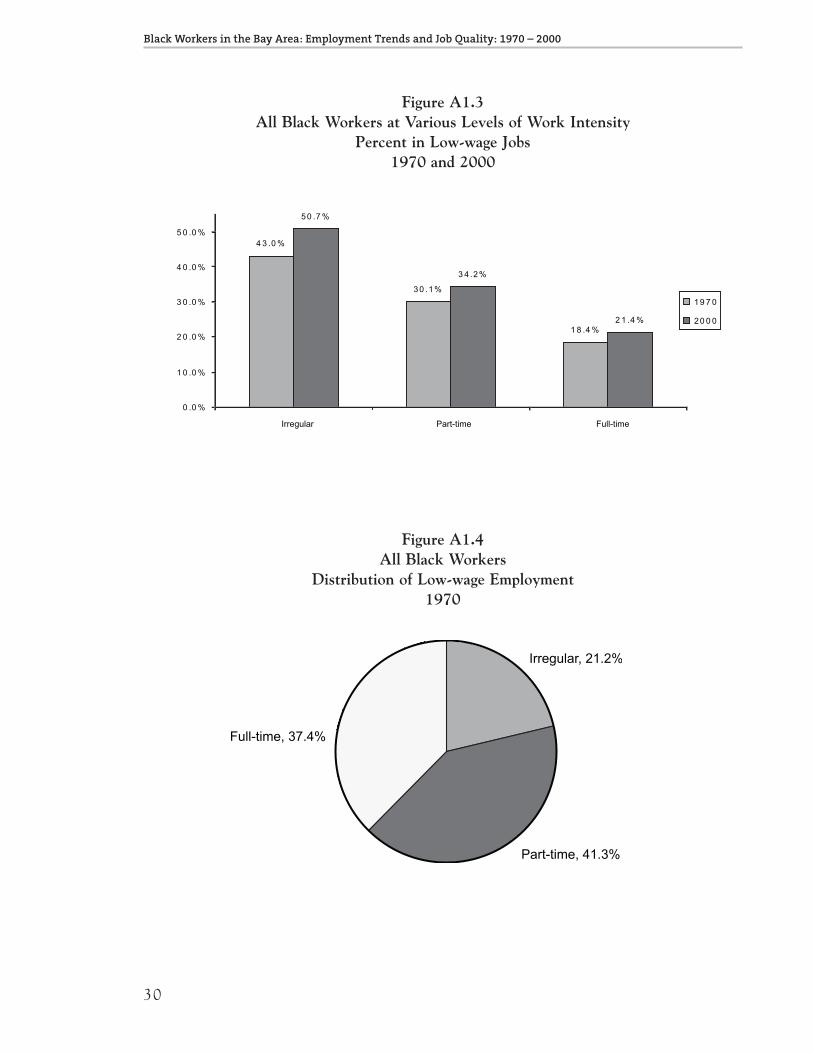
Low-wage Employment and Full-time WorkOften, the public portrayal of low-wage work confines it to realm of part-time workers. Theimplication here is that if low-wage workers would simply work full-time their poverty con-dition would be alleviated. The actual data indicates otherwise. Low-wage work exists regard-less of the regularity of work, and the increase in low-wage work since 1970 exists independ-ent of whether one examines irregular, part-time, or full-time work. Between 1970 and 2000,the proportion of irregular workers receiving low wages rose from 43.0% to 50.7%. Between1970 and 2000, the proportion of part-time workers receiving low wages rose from 30.1% to34.2%. In 1970, 18.4% of full-time workers received low wages; in 2000, this figure rose to21.4%.
In addition, the proportion of low-wage workers who had full-time jobs rose dramaticallybetween 1970 and 2000. As Figure 1.6 indicates, in 1970, 37.4% of all low-wage workers heldfull-time jobs; by 2000, 49.2% of all low-wage workers held full-time jobs. (Figures A1.4 andA1.5 show what proportion of low-wage workers held full-time, part-time, and irregular jobsin 1970 and 2000.)
Figure 1.6Low-wage Black Workers
Percent that Held Full-time Jobs 1970 and 2000

26
Black Workers in the Bay Area: Employment Trends and Job Quality: 1970 – 2000
Low-wage Employment and Educational AttainmentEducation is often touted as a panacea to the dilemma of poverty and low-wage work andBlacks are exhorted to get more education. The data indicates that the relationship betweeneducation and low-wage work is much more complicated. Several points do emerge:
• The incidence of low-wage work does fall as educational attainment increases;
• At the same time, education does not immunize workers against low wages; at everylevel of educational attainment, the proportion of workers with low-wage jobs rosebetween 1970 and 2000; and
• Among low-wage workers, the proportion of workers with at least some collegeexperience rose.
As Figure 1.7 shows, the educational attainment level of the Bay Area Black working agepopulation rose dramatically between 1970 and 2000. In 1970, 53.7% of the population hadnot completed high school; in 2000, this figure had fallen to 16.8%. In 1970, the proportionof the population with some education beyond high school was just 21.5%; by 2000, the pro-portion had risen to 58.2%.
Figure 1.7Black Working Age Population (18-65)
Educational Attainment 1970 and 2000
1970 20008th Grade or Less 17.3 1.0Some High School 26.4 15.8High School Degree or GED 35.1 25.1Some College 16.5 40.8Bachelor Degree or More 5.0 17.4
However, despite this increase in formal education, the proportion of Black workers holdinglow-wage jobs rose from 1970 to 2000. At each level of educational attainment, the percent-age of Black workers earning low wages rose between 1970 and 2000 (See Figure 1.8). Whilethe proportion does fall with each increase level of education, the proportion still rises overtime for each level. Figure 1.8 also presents a glimpse at the complicated relationship betweeneducational attainment, the structure of the economy, racial barriers, and economic out-comes. In 1970, given the nature of the economy and the legacies of segregation, having somehigh school education, a high school education, or some college education did not qualita-tively alter the propensity for holding a low-wage job. However, in 2000, the data indicates asharper delineation in the relationship between education and low-wage work at each levelof educational attainment.

L O W - WA G E E M P L O Y M E N T A N D B L A C K W O R K E R S : A P E R S I S T E N T P R O B L E M
27
Figure 1.8Black Workers at Different Levels of Educational Attainment
Percent in Low-wage Jobs 1970 and 2000
1970 20008th Grade or Less 29.9 71.8Some High School 29.7 55.5High School Degree or GED 26.9 41.8Some College 20.9 25.4Bachelor Degree or More 8.1 9.7
In addition, among low-wage workers, a larger proportion had some college experience. In1970, the share of low-wage employment held by Black workers with some college experiencewas 17.7%; by 2000, the share was 50.5%. (Figures 1.9 and 1.10 separate this data into dis-tinct charts for workers with some college but no degree and workers with at least a Bachelor’sdegree.) This data speaks to a structural problem in labor markets that result in low-wagelabor increases regardless of educational level.
Figure 1.9Low-wage Black Workers
Percent With Some College Experience (without a college degree)1970 and 2000

28
Black Workers in the Bay Area: Employment Trends and Job Quality: 1970 – 2000
Figure 1.10Low-wage Black Workers
Percent With At Least a Bachelor’s Degree 1970 and 2000
Conclusion
The data in both 1970 and 2000 indicates that the job crisis in the Black community doeshave two dimensions. In both years, the portion of the Black workforce with low-wage jobsexceeded that portion which was unemployed. In addition, the level of low-wage employmentamong Black workers was approximately the same in 1970 and 2000; this stability occurreddespite the victories of the modern civil rights movement which eliminated most vestiges oflegal segregation and, consequently, expanded opportunities for Blacks. Finally, the relation-ship between educational attainment and economic outcomes is much more complicatedthan popularly assumed. On the one hand, the percentage of low-wage workers fell as educa-tional attainment increased; at the same time, the percentage of low-wage jobs increased foreach level of education between 1970 and 2000.

A P P E N D I X T O C H A P T E R O N E
29
Appendix to Chapter One
Figure A1.1Distribution of Bay Area Black Labor Force
1970
Figure A1.2Distribution of Bay Area Black Labor Force
2000
30
Black Workers in the Bay Area: Employment Trends and Job Quality: 1970 – 2000
Figure A1.3All Black Workers at Various Levels of Work Intensity
Percent in Low-wage Jobs1970 and 2000
Figure A1.4 All Black Workers
Distribution of Low-wage Employment 1970

L O W - WA G E E M P L O Y M E N T : B L A C K M E N , B L A C K W O M E N A N D B L A C K Y O U T H
31
Figure A1.5All Black Workers
Distribution of Low-wage Employment 2000

32
Black Workers in the Bay Area: Employment Trends and Job Quality: 1970 – 2000
CHAPTER TWO
Low-wage Employment: Black Men, Black Women, and Black Youth
Chapter Overview
The previous chapter indicated the proportion of Blacks earning low wages has stayed con-stant at approximately one-quarter of the workforce. However, this reality masks sharp diver-gences between the trajectory of Black men and Black women workers in the labor market.In addition, Black youth have found it increasingly difficult to obtain employment withdecent wages.
Some key findings in this chapter are:
• Since 1970, there has been a tremendous deterioration in job outcomes for Black men, whether one measures these outcomes by labor force participation,unemployment, full-time work, or wages.
• Since 1970, Black women have fared better than Black men in the aggregate, but this overall performance masks important diversity among Black women.
• Since 1970, young Black workers find themselves increasingly concentrated in low-wage jobs.

L O W - WA G E E M P L O Y M E N T : B L A C K M E N , B L A C K W O M E N , A N D B L A C K Y O U T H
33
Differences Between Black Male and Black Female Participation in the Workforce
An understanding of the different fates of Black men and Black women in the labor marketbetween 1970 and 2000 begins with recognizing that their participation in the workforce dif-fered greatly. Chapter One presented data indicating the distribution of the Black workingage population across five categories. Figure 2.1 shows the difference between men andwomen in two of those categories: “not in the labor force” and “full-time work”. Between1970 and 2000, the proportion of Black men who were out of the labor force rose from 17.6%to 31.5%; in contrast, the proportion of Black women who were out of the labor force fellfrom 36.9% to 31.5%. With respect to full-time work, the proportion of Black men fell from45.7% to 39.3%, while the proportion of Black women rose from 24.5% to 37.2%.10
Figure 2.1Percent Not in the Labor Force and Full-time Work
A Comparison of Black Men and Black Women 1970 and 2000
34
Black Workers in the Bay Area: Employment Trends and Job Quality: 1970 – 2000
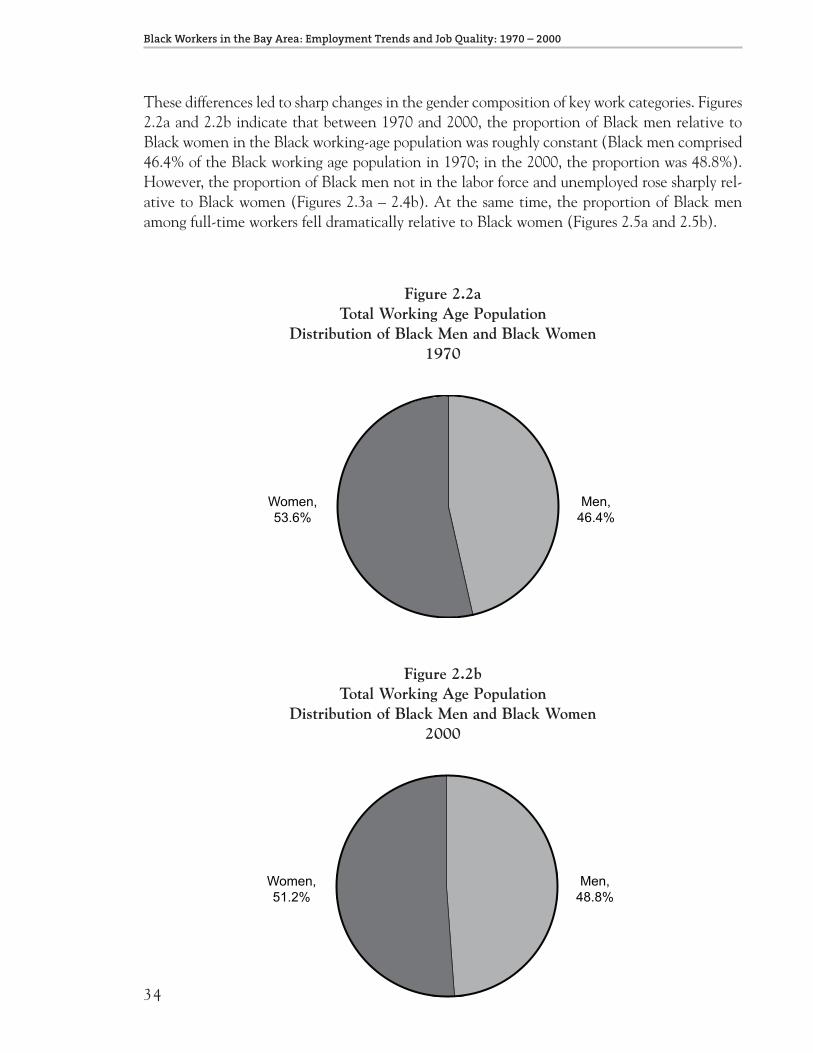
These differences led to sharp changes in the gender composition of key work categories. Figures2.2a and 2.2b indicate that between 1970 and 2000, the proportion of Black men relative toBlack women in the Black working-age population was roughly constant (Black men comprised46.4% of the Black working age population in 1970; in the 2000, the proportion was 48.8%).However, the proportion of Black men not in the labor force and unemployed rose sharply rel-ative to Black women (Figures 2.3a – 2.4b). At the same time, the proportion of Black menamong full-time workers fell dramatically relative to Black women (Figures 2.5a and 2.5b).
Figure 2.2aTotal Working Age Population
Distribution of Black Men and Black Women 1970
Figure 2.2bTotal Working Age Population
Distribution of Black Men and Black Women 2000

L O W - WA G E E M P L O Y M E N T : B L A C K M E N , B L A C K W O M E N , A N D B L A C K Y O U T H
35
Figure 2.3aWorking Age Population Not in the Labor Force
Distribution of Black Men and Black Women 1970
Figure 2.3bWorking Age Population Not in the Labor Force
Distribution of Black Men and Black Women 2000

36
Black Workers in the Bay Area: Employment Trends and Job Quality: 1970 – 2000
Figure 2.4aTotal Unemployed Population
Distribution of Black Men and Black Women 1970
Figure 2.4bTotal Unemployed Population
Distribution of Black Men and Black Women 2000

L O W - WA G E E M P L O Y M E N T : B L A C K M E N , B L A C K W O M E N , A N D B L A C K Y O U T H
37
Figure 2.5aAll Full-time Workers
Distribution of Black Men and Black Women 1970
Figure 2.5bAll Full-time Workers
Distribution of Black Men and Black Women 2000

38
Black Workers in the Bay Area: Employment Trends and Job Quality: 1970 – 2000
Black Men in the Labor Market
• A larger proportion of Black men are not in the labor force and unemployed.
• There has been a rise in the proportion of Black men holding low-wage employment.
• There has been an increase in the proportion of full-time jobs held by Black men that pay low wages.
• Full-time work is a growing proportion of low-wage employment for Black men.
Key measures of labor market performance include labor force participation rates (the propor-tion of the population that is either working or seeking employment); unemployment rates(the proportion of the labor force that is seeking employment); the prevalence of full-timework (the proportion of the population with a full-time job); and the prevalence of low-wagework (the proportion of workers with low-wage jobs). By these measures, the years between1970 and 2000 witnessed a sharp deterioration in outcomes for Black men. As mentioned ear-lier in this chapter, Black men showed an increased propensity not to be in the labor forceand a lower rate of holding full-time employment between 1970 and 2000 (see Figure 2.1).Thus, the labor force participation rate for Black males fell from 82.4% to 68.5%, and thepropensity to maintain full-time employment fell from 45.7% to 39.3%. In addition, the rateof unemployment rose: in 1970, 4.2% of working age Black males were unemployed; in 2000,the rate was 9.5%. With respect to low-wage employment, the proportion of Black male work-ers with low-wage jobs rose from 14.9% to 27.0% between 1970 and 2000 (see Figure 2.6).

L O W - WA G E E M P L O Y M E N T : B L A C K M E N , B L A C K W O M E N , A N D B L A C K Y O U T H
39
Figure 2.6Black Male Workers
Percent in Low-wage Jobs 1970 and 2000
Additional analysis indicates the comprehensive nature of this deterioration. Low-wage workincreased for Black male workers irrespective of work intensity—whether they had irregular,part-time, or full-time work. (Figure A2.1 indicates that the proportion of low-wage employ-ment in each of those three categories rose between 1970 and 2000.) Examining full-timework, in 1970, 11.7% of full-time Black male workers earned low wages; in 2000, the percent-age has risen to 21.3%. In addition, full-time jobs constituted a growing proportion of low-wage employment for Black men. In 1970, 45.8% of low-wage Black male workers held full-time jobs; in 2000, 52.6% of low-wage Black male workers held full-time jobs.
Figure 2.7Full-time Black Male Workers
Percent in Low-wage Jobs 1970 and 2000

40
Black Workers in the Bay Area: Employment Trends and Job Quality: 1970 – 2000
Figure 2.8Low-wage Black Male Workers
Percent in Full-time Jobs 1970 and 2000
Similar patterns emerge for the Black male labor market performance stratified by educationand age. As Figure A2.2 indicates, the proportion of Black men who were out of the laborforce or unemployed rose for every level of educational attainment. With regard to full-timeemployment, Black men with college degrees were the only group that saw an increase in theproportion holding full-time work. Figure A2.3 shows a similar trend for Black men across agecategories: regardless of age category, the proportion of Black men who were not in the laborforce or unemployed rose between 1970 and 2000, and the proportion of Black men who heldfull-time employment fell in each age category.
Figure 2.9 gives a final indication of how poorly Black men in the Bay Area have fared since1970. The data mirrors what was seen in Chapter One: between 1970 and 2000, an educa-tional premium developed for Black male workers; at the same time, at each level of educa-tional attainment, the percentage of jobs that paid low wages increased.
Figure 2.9Black Male Workers at Different Levels of Educational Attainment
Percent in Low-wage Jobs 1970 and 2000
1970 20008th Grade or Less 13.1 83.9Some High School 16.8 50.5High School Degree or GED 16.0 38.6Some College 15.2 23.8Bachelor Degree or More 6.0 11.0

L O W - WA G E E M P L O Y M E N T : B L A C K M E N , B L A C K W O M E N , A N D B L A C K Y O U T H
41
Black Women in the Labor Force
• There has been a decrease in the proportion of Black female workers holding low-wage jobs.
• There has been a decrease in the proportion of full-time jobs held by Black women that pay low wages.
• An increasing proportion who have low-wage jobs work full-time.
• These general trends obscure a great deal of difference among Black women given age categories and levels of educational attainment.
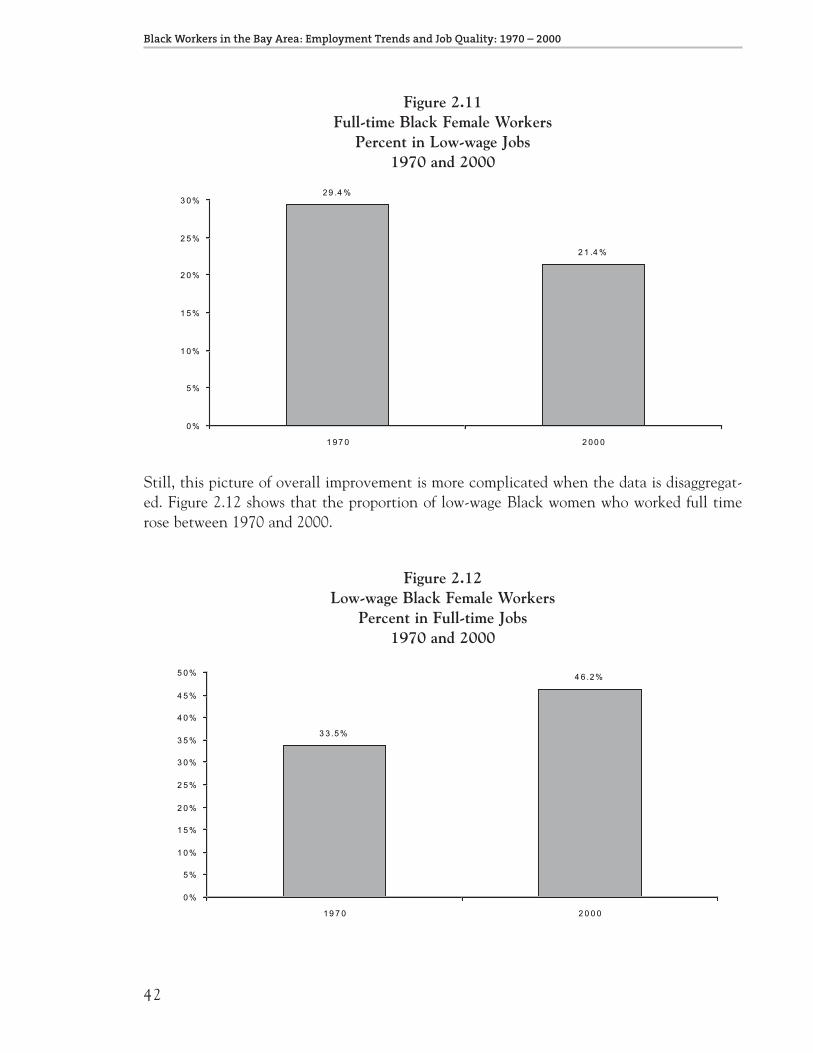
As mentioned earlier, the labor market performance of Black women differed sharply fromthat of Black men. Between 1970 and 2000, the Black female labor force participation raterose from 63.1% to 68.5%. The percentage of full-time Black female workers increased from24.55 to 37.2%. While the unemployment rate rose from 7.9% to 8.3%, Figure 2.10 illustratesthat the proportion of Black women holding low-wage jobs fell from 38.9% in 1970 to 28.6%in 2000. In 1970, 29.4% of full-time Black women workers earned low wages; in 2000, the fig-ure was 21.4% (see Figure 2.11).
Figure 2.10Black Female Workers
Percent in Low-wage Jobs 1970 and 2000
42
Black Workers in the Bay Area: Employment Trends and Job Quality: 1970 – 2000
Figure 2.11Full-time Black Female Workers
Percent in Low-wage Jobs 1970 and 2000
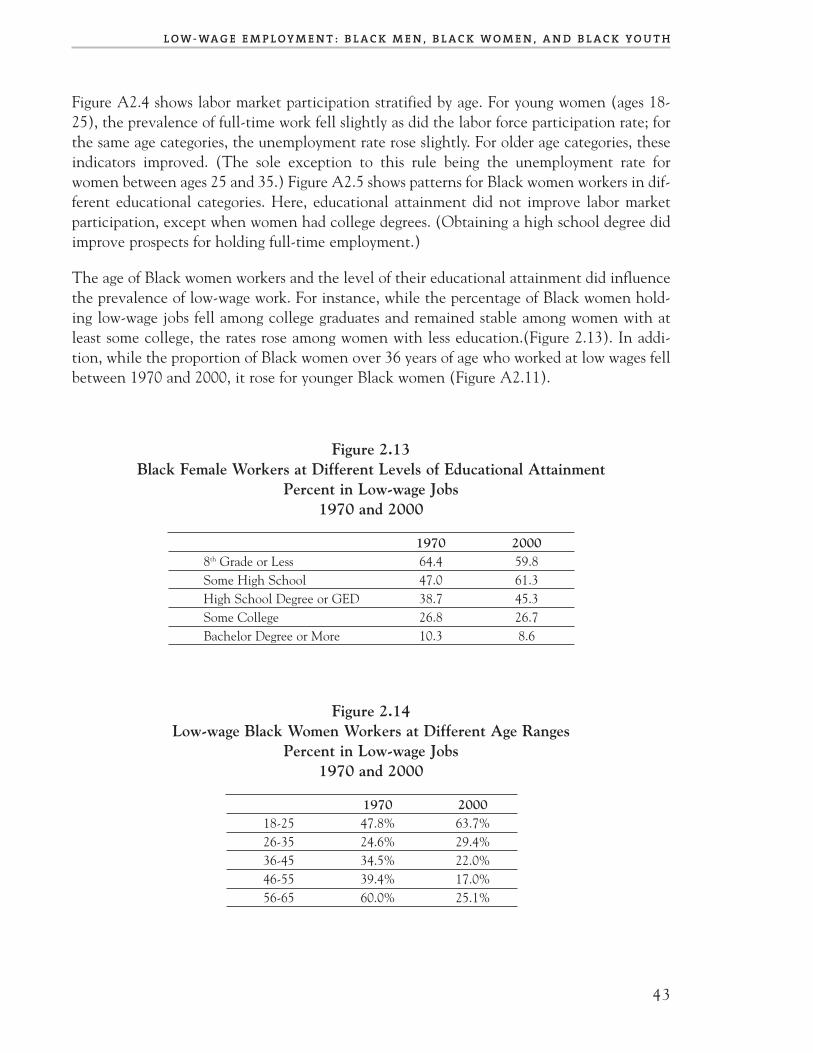
Still, this picture of overall improvement is more complicated when the data is disaggregat-ed. Figure 2.12 shows that the proportion of low-wage Black women who worked full timerose between 1970 and 2000.
Figure 2.12Low-wage Black Female Workers
Percent in Full-time Jobs 1970 and 2000
L O W - WA G E E M P L O Y M E N T : B L A C K M E N , B L A C K W O M E N , A N D B L A C K Y O U T H
43
Figure A2.4 shows labor market participation stratified by age. For young women (ages 18-25), the prevalence of full-time work fell slightly as did the labor force participation rate; forthe same age categories, the unemployment rate rose slightly. For older age categories, theseindicators improved. (The sole exception to this rule being the unemployment rate forwomen between ages 25 and 35.) Figure A2.5 shows patterns for Black women workers in dif-ferent educational categories. Here, educational attainment did not improve labor marketparticipation, except when women had college degrees. (Obtaining a high school degree didimprove prospects for holding full-time employment.)
The age of Black women workers and the level of their educational attainment did influencethe prevalence of low-wage work. For instance, while the percentage of Black women hold-ing low-wage jobs fell among college graduates and remained stable among women with atleast some college, the rates rose among women with less education.(Figure 2.13). In addi-tion, while the proportion of Black women over 36 years of age who worked at low wages fellbetween 1970 and 2000, it rose for younger Black women (Figure A2.11).
Figure 2.13Black Female Workers at Different Levels of Educational Attainment
Percent in Low-wage Jobs1970 and 2000
1970 20008th Grade or Less 64.4 59.8Some High School 47.0 61.3High School Degree or GED 38.7 45.3Some College 26.8 26.7Bachelor Degree or More 10.3 8.6
Figure 2.14Low-wage Black Women Workers at Different Age Ranges
Percent in Low-wage Jobs 1970 and 2000
1970 200018-25 47.8% 63.7%26-35 24.6% 29.4%36-45 34.5% 22.0%46-55 39.4% 17.0%56-65 60.0% 25.1%

44
Black Workers in the Bay Area: Employment Trends and Job Quality: 1970 – 2000
Finally, Figure 2.15 indicates the distribution of all low-wage jobs held by Black women acrossselected categories has changed between 1970 and 2000. By 2000, slightly more than half ofall Black women holding low-wage jobs had at least some college education (with or withoutcompleting a degree), a sharp increase from 1970. In 2000, 55.9% of low-wage Black womenworkers were between 18 and 35. Full-time Black women workers made up 46.2% of low-wageworkers in 2000.
Figure 2.15Low-wage Black Women Workers
Percent by Selected Categories 1970 and 2000
1970 2000Some College Education 22.5% 51.9%Between 18 and 35 Years 41.4% 55.9%Full-time Workers 33.5% 46.2%
Young Black Workers and Low-wage Employment
• Since 1970, a larger percentage of young Black workers have come to hold low-wage jobs.
• It is increasingly difficult for young Black workers to obtain full-time work that does not pay low wages.
• These difficulties exist for both young Black men and young Black women.
Looking at the experiences of young Blacks (ages 18-25) in the labor market, a different pat-tern emerges. While the change in the distribution of young Blacks across the five work cat-egories is approximately the same as that for the entire Black working age population (seeFigure A2.6), the sharp gender differences that can be seen across the entire Black workingage population do not exist for young Black workers.
With respect to low-wage employment, prospects have worsened for young Black workerssince 1970. In that year, 40.2% of young Black workers had low-wage jobs; by 2000, the fig-ure has risen to 63.6% (see Figure 2.16).

L O W - WA G E E M P L O Y M E N T : B L A C K M E N , B L A C K W O M E N , A N D B L A C K Y O U T H
45
Figure 2.16Young Black Workers
Percent in Low-wage Jobs 1970 and 2000
The prevalence of low-wage work increased for irregular workers, part-time workers, and full-time workers. For irregular work, the increase was from 45.1% to 66.1%; for irregular work, theincrease was from 47.8% to 67.5%; for full-time work, the increase was from 29.0% to 58.6%.
Figure 2.17Full-time Young Black Workers
Percent in Low-wage Jobs 1970 and 2000

46
Black Workers in the Bay Area: Employment Trends and Job Quality: 1970 – 2000
These changes resulted in full-time work representing a larger share of low-wage employmentfor young Black workers. As Figure 2.18 indicates, full-time work comprised 26.3% of low-wage jobs in 1970; by 2000, its share rose to 36.4%.
Figure 2.18Low-wage Young Black Workers
Percent in Full-time Jobs 1970 and 2000
Conclusion
The period between 1970 and 2000 was disastrous for Black men in the labor market. Usingany common measure of performance, economic outcomes for Black males worsened consid-erably. For Black women, the picture is more complicated. Overall, the percentage of Blackwomen earning low wages fell. However, outcomes for Black women varied with different ageand education levels. Black youth fared worse in the labor market between 1970 and 2000.This result was consistent for young Black men and young Black women.

A P P E N D I X T O C H A P T E R T W O -
47
Appendix to Chapter Two
Figure A2.1Black Male Workers at Various Levels of Work Intensity
Percent of Low-wage Jobs1970 and 2000
Figure A2.2Black Men at Different Levels of Educational Attainment
Labor Market Participation Behavior 1970 and 2000
1970 2000Not in the labor force8th grade or less 28.9% 68.1%Some high school 21.4% 55.9%High school degree or GED 10.4% 35.9%Some college 15.8% 24.1%Bachelor degree or more 5.7% 11.8%Unemployed8th grade or less 1.4% 7.2%Some high school 6.6% 14.4%High school degree or GED 6.0% 13.2%Some college 1.7% 6.6%Bachelor degree or more 0.0% 4.5%Full-time Employment8th grade or less 42.2% 9.2%Some high school 40.7% 14.4%High school degree or GED 47.8% 31.4%Some college 48.3% 47.2%Bachelor degree or more 62.8% 63.6%

48
Black Workers in the Bay Area: Employment Trends and Job Quality: 1970 – 2000
Figure A2.3Black Men at Different Age Levels
Labor Market Participation Behavior 1970 and 2000
1970 2000Not in the labor force
18 – 25 21.7% 36.3%26 - 35 10.4% 28.1%36 - 45 12.5% 27.7%46 – 55 19.9% 27.8%56 - 65 30.4% 49.0%
Unemployed18 – 25 11.6% 16.7%26 - 35 2.2% 9.5%36 - 45 2.1% 7.8%46 – 55 3.4% 7.8%56 - 65 1.1% 5.1%
Full-time Employment18 – 25 23.8% 19.3%26 - 35 54.4% 42.0%36 - 45 56.9% 46.3%46 – 55 52.1% 47.7%56 - 65 35.9% 30.5%

A P P E N D I X T O C H A P T E R T W O
49
Figure A2.4Black Women at Different Age LevelsLabor Market Participation Behavior
1970 and 2000
1970 2000Not in the Labor Force
18-25 36.4% 37.0%26-35 32.0% 23.6%36-45 31.5% 25.6%46-55 31.5% 25.6%56-65 47.1% 30.4%
Unemployed18-25 12.5% 13.7%26-35 7.0% 10.1%36-45 8.7% 8.0%46-55 8.7% 8.0%56-65 5.7% 5.3%
FFuullll--ttiimmee EEmmppllooyymmeenntt18-25 19.3% 18.6%26-35 28.0% 39.9%36-45 30.4% 45.4%46-55 30.4% 45.4%56-65 26.4% 45.5%

50
Black Workers in the Bay Area: Employment Trends and Job Quality: 1970 – 2000
Figure A2.5Black Women at Different Levels of Educational Attainment
Labor Market Participation Behavior1970 and 2000
1970 2000Not in the Labor Force
8th Grade or Less 55.2% 68.2%Some High School 45.1% 52.5%High School Degree or GED 32.3% 38.4%Some College 20.3% 26.8%Bachelor Degree or More 23.8% 16.3%
Unemployed8th Grade or Less 5.7% 9.0%Some High School 10.8% 13.9%High School Degree or GED 8.5% 11.2%Some College 3.9% 6.8%Bachelor Degree or More 7.2% 3.8%
Full-time Employment8th Grade or Less 13.0% 7.0%Some High School 17.1% 13.3%High School Degree or GED 27.1% 30.8%Some College 39.1% 42.0%Bachelor Degree or More 33.3% 53.1%
Figure A2.6Portrait of the Bay Area Young Black Working Age Population (18-25)
1970 and 2000

C H A N G E S I N T H E I N D U S T R I A L D I S T R I B U T I O N O F B L A C K W O R K E R S
51
CHAPTER THREE
Changes in the IndustrialDistribution of Black Workers:The Increasing Importance ofLow-wage Industries to BlackEmployment
Chapter Overview
One way to begin to understand the changes in wages is to observe the industries withinwhich Blacks work and the occupations they hold and then examine how these industries andoccupations changed between 1970 and 2000.11 This chapter provides data on those indus-tries where large numbers of Black workers were employed in 1970 and how those concentra-tions changed in 2000.12 The key story emerging from this analysis is that industries whichprovide low wages to large numbers of its workers have an increasing importance in theemployment prospects of Black workers. In addition to presenting numbers on the level ofBlack employment in selected industries, the chapter also describes these sectors with respectto low-wage employment and gender.
Some key findings in this chapter are:
• The Educational Services, Transportation, and Hospital industries maintained their importance as employers of Black workers between 1970 and 2000.
• Between 1970 and 2000, Business Services, Retail, and Non-Hospital Medical and Other Health Services were industries whose importance rose.
• Six of the top ten industries that employed the largest number of Black workers saw an increase in the proportion of low-wage Black workers between 1970 and 2000.

52
Black Workers in the Bay Area: Employment Trends and Job Quality: 1970 – 2000
The Rising Importance of Low-wage Industries
• The Business Services, Retail, and Non-Hospital Medical and Other HealthServices industries saw the greatest increase in the rankings of industries employing the largest number of Black workers. In each of these industries, at least one-third of Black workers earned low wages.
Between 1970 and 2000, low-wage industries played an increasing role in the employmentprospects of Black workers. This importance can be seen in two ways. First, when examiningthe ten industries which employed the largest number of Blacks in 2000, three saw a signifi-cant leap in ranking: Business Services (ranked #10 in 1970; ranked #1 in 2000); Retail (1970:#15; 2000: #5); and Non-Hospital Medical and Other Health Services (1970: #18; 2000: #8).In all three industries, at least one-third of Black workers earned low wages in 2000. In theBusiness Services industry 32.4% of Black workers earned low wages. This figure was virtuallyunchanged from 1970. In the Retail industry, 46.4% of Black workers earned low wages; thisrepresented an increase from the 1970 figure of 40.8%. In the Non-Hospital Medical andOther Health Services industry, 32.7% of Black workers earned low wages; this was also a high-er figure compared to the 22.2% figure in 1970. Thus, industries that became more importantin hiring Black workers between 1970 and 2000 were paying significant segments of their Blackworkforce low wages. (In 2000, 27.8% of Black workers received low wages.)
Second, eight of the ten industries employing the largest number of Black workers in 1970remained in the top ten rankings in 2000. Of those eight industries, four saw the proportionof Black workers receiving low wages increase between 1970 and 2000. These industries were:Transportation; Federal Public Administration; Durable Goods Manufacturing; andConstruction. As indicated in the previous paragraph, the proportion of Black workers earn-ing low wages remained constant in the Business Services industry. In three industries—Educational Services; Finance, Insurance, and Real Estate; and Hospitals—the proportion ofBlack workers earning low wages fell. Looking at this information in combination with thenewly important industries (Retail and Non-Hospital and Other Health Services), we can seethat six of the top industries in 2000 experienced an expansion of their low-wage Black work-force between 1970 and 2000. (Figures 3.1 and 3.2 summarize this data. Note: two indus-tries—Postal Services and Personal Services—were no longer among the top ten employersof Black workers by 2000. In their place, two industries—Retail and Non-Hospital Medicaland Other Health Services—entered the list of top ten employers. In order to report dataclearly on these four industries for both 1970 and 2000, Figures 3.1 and 3.2 lists twelve indus-tries. For expository reasons, these twelve industries are called “Top Industries.”)

C H A N G E S I N T H E I N D U S T R I A L D I S T R I B U T I O N O F B L A C K W O R K E R S
53
Figure 3.1Top Industries
2000 & 1970 Rankings
Industry 2000 Rank 1970 RankBusiness Services 1 10Educational Services 2 1Transportation 3 4Finance, Insurance, and Real Estate 4 3Retail 5 15Hospitals 6 5Federal Public Administration 7 3Non-Hospital Medical and Other Health Services 8 18Durable Goods Manufacturing 9 2Construction 10 7Postal Service 16 8Personal Services 25 6
Figure 3.2Top Industries
Change in Percentage of Low-wage Jobs
Rank % Low-wage JobsIndustry 2000 1970 2000 ChangeBusiness Services 1 33.4% 32.4% unchangedEducational Services 2 33.0% 28.8% fewerTransportation 3 7.3% 24.1% moreFinance, Insurance, and Real Estate 4 32.4% 21.5% fewerRetail 5 40.8% 46.4% moreHospitals 6 25.4% 19.8% fewerFederal Public Administration 7 13.3% 18.3% moreNon-Hospital Medical and Other Health Services 8 22.2% 32.7% moreDurable Goods Manufacturing 9 14.1% 21.4% moreConstruction 10 10.7% 23.5% morePostal Service 16 15.9% 10.2% fewerPersonal Services 25 66.2% 49.8% fewer
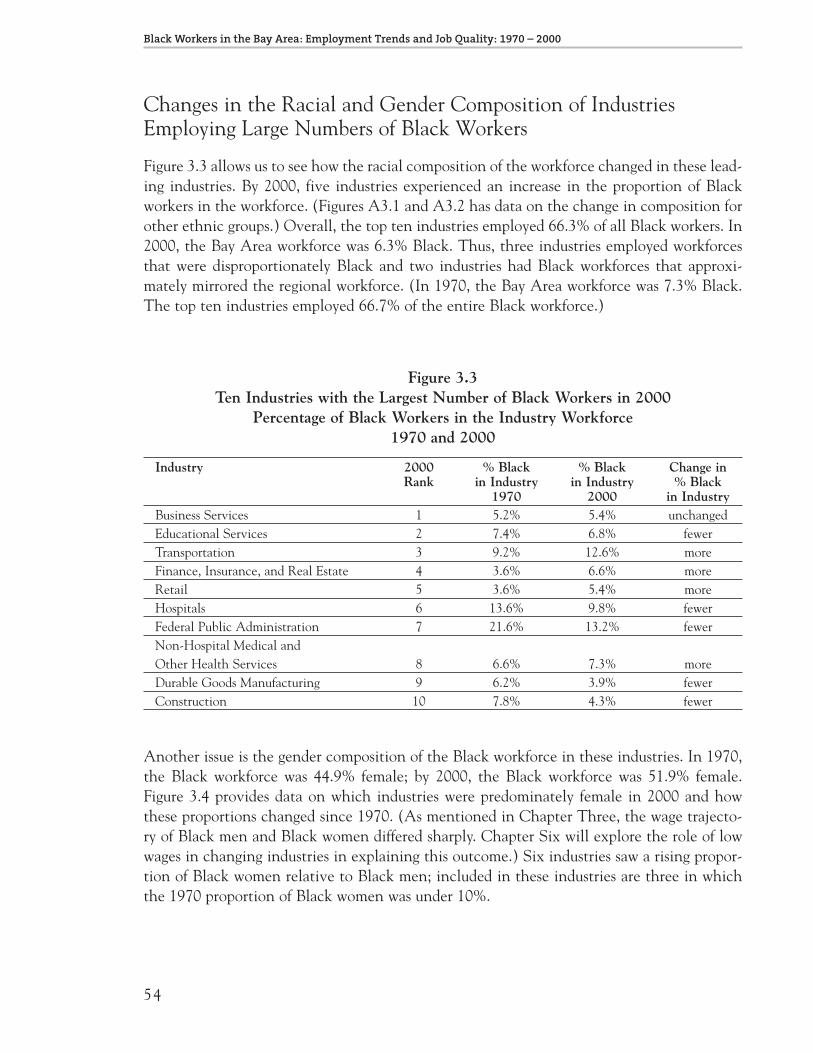
54
Black Workers in the Bay Area: Employment Trends and Job Quality: 1970 – 2000
Changes in the Racial and Gender Composition of IndustriesEmploying Large Numbers of Black Workers
Figure 3.3 allows us to see how the racial composition of the workforce changed in these lead-ing industries. By 2000, five industries experienced an increase in the proportion of Blackworkers in the workforce. (Figures A3.1 and A3.2 has data on the change in composition forother ethnic groups.) Overall, the top ten industries employed 66.3% of all Black workers. In2000, the Bay Area workforce was 6.3% Black. Thus, three industries employed workforcesthat were disproportionately Black and two industries had Black workforces that approxi-mately mirrored the regional workforce. (In 1970, the Bay Area workforce was 7.3% Black.The top ten industries employed 66.7% of the entire Black workforce.)
Figure 3.3Ten Industries with the Largest Number of Black Workers in 2000
Percentage of Black Workers in the Industry Workforce1970 and 2000
Industry 2000 % Black % Black Change inRank in Industry in Industry % Black
1970 2000 in IndustryBusiness Services 1 5.2% 5.4% unchangedEducational Services 2 7.4% 6.8% fewerTransportation 3 9.2% 12.6% moreFinance, Insurance, and Real Estate 4 3.6% 6.6% moreRetail 5 3.6% 5.4% moreHospitals 6 13.6% 9.8% fewerFederal Public Administration 7 21.6% 13.2% fewerNon-Hospital Medical and Other Health Services 8 6.6% 7.3% moreDurable Goods Manufacturing 9 6.2% 3.9% fewerConstruction 10 7.8% 4.3% fewer
Another issue is the gender composition of the Black workforce in these industries. In 1970,the Black workforce was 44.9% female; by 2000, the Black workforce was 51.9% female.Figure 3.4 provides data on which industries were predominately female in 2000 and howthese proportions changed since 1970. (As mentioned in Chapter Three, the wage trajecto-ry of Black men and Black women differed sharply. Chapter Six will explore the role of lowwages in changing industries in explaining this outcome.) Six industries saw a rising propor-tion of Black women relative to Black men; included in these industries are three in whichthe 1970 proportion of Black women was under 10%.

C H A N G E S I N T H E I N D U S T R I A L D I S T R I B U T I O N O F B L A C K W O R K E R S
55
Figure 3.4Ten Industries with the Largest Number of Black Workers in 2000
Percentage of Black Female Workers among Black Workers in the Industry 1970 and 2000
Industry 2000 Rank % Female % Female Change in1970 2000 % Female
Business Services 1 41.7% 45.4% moreEducational Services 2 69.0% 68.9% unchangedTransportation 3 8.5% 27.7% moreFinance, Insurance, and Real Estate 4 56.8% 67.0% moreRetail 5 44.4% 42.0% unchangedHospitals 6 73.4% 68.8% fewerFederal Public Administration 7 38.9% 63.3% moreNon-Hospital Medical and Other Health Services 8 77.7% 81.2% moreDurable Goods Manufacturing 9 9.8% 32.5% moreConstruction 10 8.9% 18.7% more
Conclusion
Industries with growing percentages of low-wage Black workers became increasingly impor-tant employers of Black workers. The Retail and Non-Hospital Medical and Other HealthServices industries were not ranked among the ten industries that employed the largest num-ber of Black workers in 1970; in 2000, they were ranked #5 and #8, respectively. In addition,both of these industries employed a high percentage of low-wage Black workers (Retail –46.4%; Non-hospital Medical and Other Health Services – 32.7%) Overall, of the ten indus-tries employing the largest number of Black workers in 2000, six saw the proportion of Blackworkers earning low wages rise between 1970 and 2000.

56
Black Workers in the Bay Area: Employment Trends and Job Quality: 1970 – 2000
Appendix to Chapter Three
Figures A3.1 and A3.2 present data on the ethnic distribution of the workforces in theseindustries in 1970 and 2000. What is striking is the sharp reduction in white workers in theseindustries. In 1970, the top ten industries had majority non-Hispanic white majorities whichranged from 67.6% to 84.6%. None of the industries had a combined Asian and Latino pres-ence of over 15%.13 By 2000, the ethnic compositions changed dramatically: only one indus-try had a white majority over 60%; in two industries, white workers comprised the largest plu-rality but not a majority; and in the other seven industries white majorities were below 60%.The reduction in white presence was matched by the increase in Asian and Latino presence.The lowest combined Asian and Latino percentage in any one industry was 24%; the highestwas 42%.

A P P E N D I X T O C H A P T E R 3
57
Figu
re A
3.1:
T
en I
ndus
trie
s w
ith
the
Lar
gest
Num
ber
of B
lack
Wor
kers
in 2
000
Eth
nic
Dis
trib
utio
n of
the
Em
ploy
ees
in 1
970
Bla
ckW
hite
Nat
ive
Am
eric
anA
sian
Lat
ino
Oth
erB
usin
ess
Serv
ices
5.2%
83.1
%0.
3%3.
9%7.
1%0.
3%Ed
ucat
iona
l ser
vice
s7.
4%83
.7%
0.1%
3.9%
4.8%
0.1%
Tran
spor
tati
on9.
2%77
.6%
0.4%
4.8%
7.6%
0.3%
Fina
nce,
Ins
uran
ce, a
nd R
eal E
stat
e3.
6%84
.6%
0.5%
6.0%
5.2%
0.2%
Ret
ail
3.6%
85.3
%0.
3%4.
2%6.
2%0.
5%H
ospi
tals
13.6
%71
.1%
0.5%
7.8%
6.9%
0.0%
Fede
ral P
ublic
Adm
inis
trat
ion
21.6
%67
.6%
0.0%
7.0%
3.8%
0.0%
Non
-Hos
pita
l Med
ical
and
Oth
er H
ealt
h Se
rvic
es6.
6%83
.2%
0.4%
4.7%
5.1%
0.0%
Dur
able
Goo
ds M
anuf
actu
ring
6.2%
80.2
%0.
5%3.
0%9.
8%0.
3%C
onst
ruct
ion
7.8%
79.7
%0.
3%1.
8%10
.3%
0.1%
Figu
re A
3.2:
T
en I
ndus
trie
s w
ith
the
Lar
gest
Num
ber
of B
lack
Wor
kers
in 2
000
Eth
nic
Dis
trib
utio
n of
the
Em
ploy
ees
in 2
000
Bla
ckW
hite
Nat
ive
Am
eric
anA
sian
Lat
ino
Oth
erB
usin
ess
Serv
ices
5.4%
57.8
%0.
4%21
.0%
12.6
%2.
8%Ed
ucat
iona
l ser
vice
s6.
8%65
.3%
0.4%
12.3
%12
.0%
3.3%
Tran
spor
tati
on12
.6%
48.6
%0.
7%18
.4%
15.6
%4.
1%Fi
nanc
e, I
nsur
ance
, and
Rea
l Est
ate
6.6%
59.9
%0.
4%20
.2%
10.2
%2.
8%R
etai
l5.
4%57
.0%
0.6%
17.4
%15
.4%
4.3%
Hos
pita
ls9.
8%49
.1%
0.3%
25.9
%11
.2%
3.7%
Fede
ral P
ublic
Adm
inis
trat
ion
13.2
%51
.6%
0.7%
18.4
%12
.8%
3.2%
Non
-Hos
pita
l Med
ical
and
Oth
er H
ealt
h Se
rvic
es7.
3%55
.5%
0.5%
20.4
%12
.7%
3.7%
Dur
able
Goo
ds M
anuf
actu
ring
3.9%
50.2
%0.
4%26
.5%
16.0
%2.
9%C
onst
ruct
ion
4.3%
54.1
%0.
5%7.
5%30
.8%
2.7%
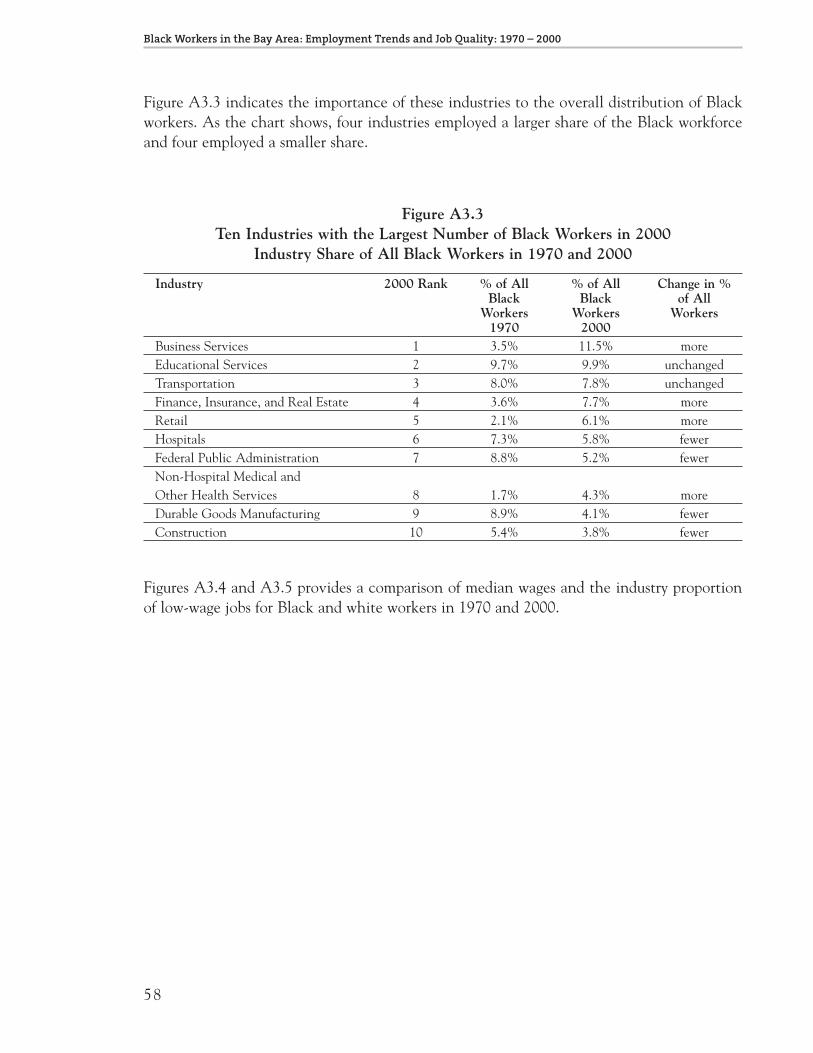
58
Black Workers in the Bay Area: Employment Trends and Job Quality: 1970 – 2000
Figure A3.3 indicates the importance of these industries to the overall distribution of Blackworkers. As the chart shows, four industries employed a larger share of the Black workforceand four employed a smaller share.
Figure A3.3Ten Industries with the Largest Number of Black Workers in 2000
Industry Share of All Black Workers in 1970 and 2000
Industry 2000 Rank % of All % of All Change in %Black Black of All
Workers Workers Workers1970 2000
Business Services 1 3.5% 11.5% moreEducational Services 2 9.7% 9.9% unchangedTransportation 3 8.0% 7.8% unchangedFinance, Insurance, and Real Estate 4 3.6% 7.7% moreRetail 5 2.1% 6.1% moreHospitals 6 7.3% 5.8% fewerFederal Public Administration 7 8.8% 5.2% fewerNon-Hospital Medical and Other Health Services 8 1.7% 4.3% moreDurable Goods Manufacturing 9 8.9% 4.1% fewerConstruction 10 5.4% 3.8% fewer
Figures A3.4 and A3.5 provides a comparison of median wages and the industry proportionof low-wage jobs for Black and white workers in 1970 and 2000.

A P P E N D I X T O C H A P T E R 3
59
Figu
re A
3.4a
:
Top
Ind
ustr
ies
– C
ompa
riso
n of
Per
cent
age
Low
-wag
e B
lack
and
Whi
te W
orke
rs 1
970
Ran
k%
Low
-wag
e Jo
bsIn
dust
ry19
7020
00B
lack
Wor
kers
Whi
te W
orke
rsEd
ucat
iona
l Ser
vice
s1
233
.0%
18.2
%D
urab
le G
oods
Man
ufac
turi
ng2
914
.1%
6.1%
Fede
ral P
ublic
Adm
inis
trat
ion
34
13.3
%9.
2%Tr
ansp
orta
tion
47
7.3%
5.9%
Hos
pita
ls5
325
.4%
18.1
%Pe
rson
al S
ervi
ces
66
66.2
%42
.7%
Con
stru
ctio
n7
2510
.7%
7.3%
Post
al S
ervi
ce8
1015
.9%
11.3
%Fi
nanc
e, I
nsur
ance
, and
Rea
l Est
ate
916
32.4
%18
.3%
Bus
ines
s Se
rvic
es10
133
.4%
17.2
%R
etai
l 15
540
.8%
24.7
%N
on-H
ospi
tal M
edic
al a
nd O
ther
Hea
lth
Serv
ices
188
22.2
%25
.9%
Figu
re A
3.4b
:
Top
Ind
ustr
ies
– C
ompa
riso
n of
Per
cent
age
Low
-wag
e B
lack
and
Whi
te W
orke
rs 2
000
Ran
k%
Low
Wag
e Jo
bsIn
dust
ry19
7020
00B
lack
Wor
kers
Whi
te W
orke
rsEd
ucat
iona
l Ser
vice
s1
228
.8%
23.5
%D
urab
le G
oods
Man
ufac
turi
ng2
921
.4%
9.5%
Fede
ral P
ublic
Adm
inis
trat
ion
37
18.3
%18
.1%
Tran
spor
tati
on4
324
.1%
18.6
%H
ospi
tals
56
19.8
%9.
5%Pe
rson
al S
ervi
ces
625
49.8
%39
.9%
Con
stru
ctio
n7
1023
.5%
13.8
%Po
stal
Ser
vice
816
10.2
%5.
8%Fi
nanc
e, I
nsur
ance
, and
Rea
l Est
ate
94
21.5
%12
.9%
Bus
ines
s Se
rvic
es10
132
.4%
14.3
%R
etai
l 15
546
.4%
30.6
%N
on-H
ospi
tal M
edic
al a
nd O
ther
Hea
lth
Serv
ices
188
32.7
%19
.1%

60
Black Workers in the Bay Area: Employment Trends and Job Quality: 1970 – 2000
Figu
re A
3.5a
:
Top
Ind
ustr
ies
– C
ompa
riso
n of
Rea
l Med
ian
Wag
es (
$200
0) f
or B
lack
and
Whi
te W
orke
rs 1
970
Ran
kR
eal M
edia
n W
age
($20
00)
Indu
stry
1970
2000
Bla
ck W
orke
rsW
hite
Wor
kers
Educ
atio
nal S
ervi
ces
12
$ 1
6.45
$
18.8
4 D
urab
le G
oods
Man
ufac
turi
ng2
9$
16.
50
$ 20
.87
Fede
ral P
ublic
Adm
inis
trat
ion
34
$ 1
5.34
$
20.9
3 Tr
ansp
orta
tion
47
$ 1
9.70
$
20.7
8 H
ospi
tals
53
$ 1
2.73
$
15.6
2 Pe
rson
al S
ervi
ces
66
$ 8
.30
$ 11
.13
Con
stru
ctio
n7
25$
17.
52
$ 26
.23
Post
al S
ervi
ce8
10$
15.
13
$ 16
.59
Fina
nce,
Ins
uran
ce, a
nd R
eal E
stat
e9
16$
10.
99
$ 15
.78
Bus
ines
s Se
rvic
es10
1$
10.
99
$ 17
.52
Ret
ail
155
$ 1
2.51
$
14.2
6 N
on-H
ospi
tal M
edic
al a
nd O
ther
Hea
lth
Serv
ices
188
$ 1
4.31
$
16.0
3
Figu
re A
3.5b
:
Top
Ind
ustr
ies
– C
ompa
riso
n of
Rea
l Med
ian
Wag
es (
$200
0) f
or B
lack
and
Whi
te W
orke
rs 2
000
Ran
kR
eal M
edia
n W
ages
($2
000)
Indu
stry
1970
2000
Bla
ck W
orke
rsW
hite
Wor
kers
Educ
atio
nal S
ervi
ces
12
$ 1
5.43
$
17.9
6 D
urab
le G
oods
Man
ufac
turi
ng2
9$
17.
79
$ 26
.28
Fede
ral P
ublic
Adm
inis
trat
ion
37
$ 1
8.27
$
20.9
8 Tr
ansp
orta
tion
43
$ 1
6.83
$
19.2
3 H
ospi
tals
56
$ 1
7.31
$
24.2
9 Pe
rson
al S
ervi
ces
625
$ 1
1.63
$
13.3
3 C
onst
ruct
ion
710
$ 1
7.19
$
22.3
1 Po
stal
Ser
vice
816
$ 1
8.75
$
19.2
1 Fi
nanc
e, I
nsur
ance
, and
Rea
l Est
ate
94
$ 1
6.83
$
23.0
8 B
usin
ess
Serv
ices
101
$ 1
5.63
$
23.8
1 R
etai
l 15
5$
12.
16
$ 16
.15
Non
-Hos
pita
l Med
ical
and
Oth
er H
ealt
h Se
rvic
es18
8$
14.
42
$ 19
.23

C H A N G E S I N T H E O C C U PAT I O N A L D I S T R I B U T I O N O F B L A C K W O R K E R S
61
CHAPTER FOUR
Changes in the OccupationalDistribution of Black Workers:The Continued Importance ofLow-wage Occupations and theRising Importance ofProfessional Occupations
Chapter Overview
This chapter presents data on the occupations held by Black workers in large numbers in 1970and how those occupational concentrations changed by 2000. In many ways, the structure ofthis chapter will mirror the structure of the last chapter with the key difference being thefocus on occupations instead of industries.14 The key stories in this analysis are the continuedimportance of selected low-wage occupations and the rise of importance of certain profession-al occupations.
Some key findings in this chapter are:
• Between 1970 and 2000, the Clerical Workers occupation maintained its rank as the largest occupation for Bay Area Black workers, and Sales Workers rose in importance.
• Professional occupations rose in importance.
• Blue collar occupations such as Operatives, Laborers, Craftsmen, Janitors, and Mechanics became less important for Black workers.

62
Black Workers in the Bay Area: Employment Trends and Job Quality: 1970 – 2000
The Continued Importance of Selected Low-wage Occupations
• In 2000, in four occupations that ranked within the top eight occupations held by Blacks, over one-third of the Black workers earned low wages
• These occupations were: Clerical Workers; Sales Workers; Operatives; and Laborers
Between 1970 and 2000, certain occupations within which a disproportionate number ofBlack workers earn low wages maintained their status of key occupations for Bay Area Blacks.Clerical Workers remained the largest occupation for Black workers; Sales Workers rose inimportance (ranked #9 in 1970; ranked #3 in 2000); Operatives (1970: tied for #1; 2000: #6);and Laborers (1970: #4; 2000: #8) moved down the list but stayed in the top tier. In eachoccupation, at least one-third of Black workers earned low wages; figures range from 33.0%among Clerical Workers to 38.8% among Laborers. Of these four, the proportion of low-wageworkers rose between 1970 and 2000 for all except Sales Workers. (Figures 4.1 and 4.2 pres-ent the 1970 and 200 rankings and data on low-wage employment. Note: similar to whatoccurred among the ranked industries, some of the ten leading occupations for Black workersin 1970 were not ranked among the top ten occupations in 2000. Craftsmen, Mechanics, andJanitors fell from the top ten by 2000; Miscellaneous, Business Professionals, and EducationalProfessionals join the list of top ten occupations by 2000. Figures 4.1 and 4.2 will list thirteenoccupations; these occupations will be called “Top Occupations”. )
Figure 4.1Top Occupations
2000 & 1970 Rankings
Occupation 2000 Rank 1970 RankClerical Workers 1 1TManagers, Officials, and Proprietors 2 8Sales Workers 3 9Miscellaneous Professionals 4 13Business Professionals 5 22Operatives 6 1TEducation Professionals 7 11Laborers 8 4Stenographers and Secretaries 9 7Service Workers 10 3Craftsmen 14 5Mechanics 18 10Janitors 19 6

C H A N G E S I N T H E O C C U PAT I O N A L D I S T R I B U T I O N O F B L A C K W O R K E R S
63
Figure 4.2Top Occupations
Changes in Low-wage Jobs
Occupation 2000 Rank % Low-wage Jobs Change1970 2000
Clerical Workers 1 28.1% 33.0% moreManagers, Officials, and Proprietors 2 13.3% 16.2% moreSales Workers 3 40.8% 35.7% fewerMiscellaneous Professionals 4 40.9% 21.0% fewerBusiness Professionals 5 10.0% 5.7% fewerOperatives 6 18.3% 38.7% moreEducation Professionals 7 20.0% 17.8% fewerLaborers 8 15.6% 38.8% moreStenographers and Secretaries 9 25.6% 22.9% fewerService Workers 10 58.1% 28.4% fewerCraftsmen 14 15.7% 25.5% moreMechanics 18 11.1% 20.8% moreJanitors 19 25.0% 40.1% more
The Rising Importance of Professional Occupations
• In 2000, three of the top seven occupations were professional and managerial classes.
• These occupations were: Managers, Officials, and Proprietors; MiscellaneousProfessionals; Business Professionals; and Educational Professionals.
In 1970, only one professional occupation was ranked among the top ten occupations held byBlack Workers in the Bay Area—Managers, Officials, and Proprietors—and that occupationgroup ranked #8. By 2000, three additional professional occupations—MiscellaneousProfessionals; Business Professionals; and Educational Professionals—reached the top ten.(See Figure 4.1 for these rankings.) In each of these four occupations, the share of Black work-ers with low wages was relatively small, and only in the Managers, Officials, and Proprietorsoccupation did the share rise between 1970 and 2000. (Figure 4.2 presents this data.)
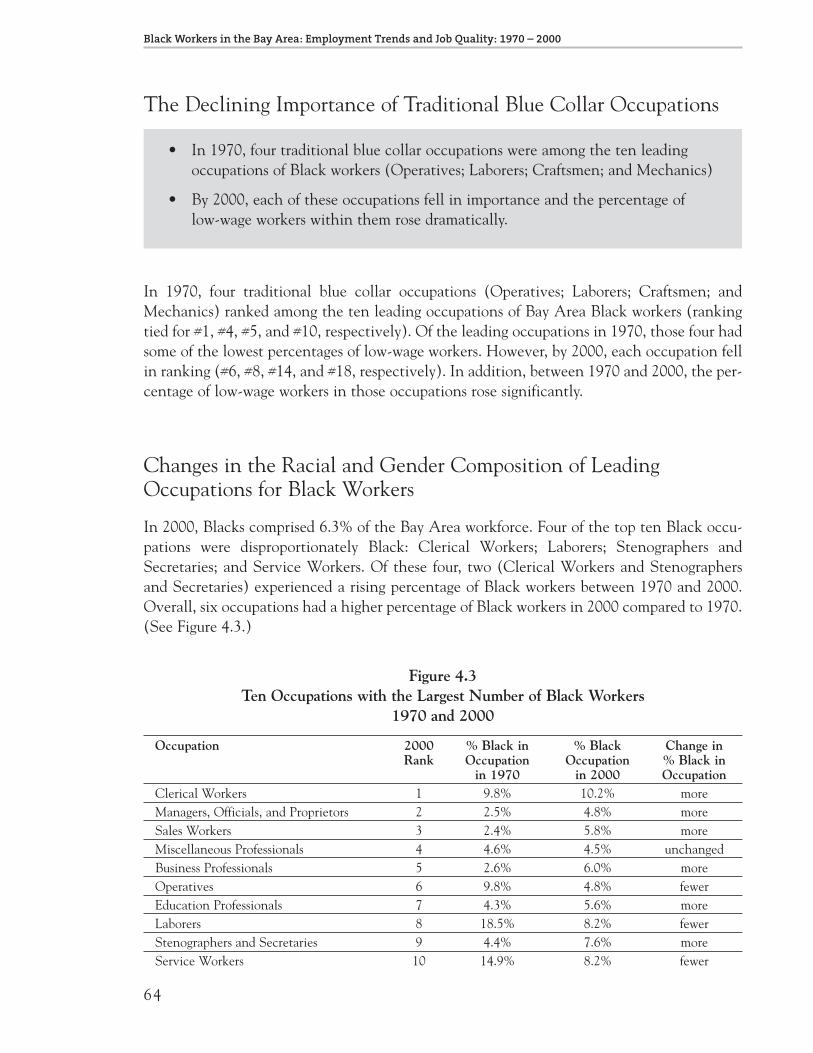
64
Black Workers in the Bay Area: Employment Trends and Job Quality: 1970 – 2000
The Declining Importance of Traditional Blue Collar Occupations
• In 1970, four traditional blue collar occupations were among the ten leading occupations of Black workers (Operatives; Laborers; Craftsmen; and Mechanics)
• By 2000, each of these occupations fell in importance and the percentage of low-wage workers within them rose dramatically.
In 1970, four traditional blue collar occupations (Operatives; Laborers; Craftsmen; andMechanics) ranked among the ten leading occupations of Bay Area Black workers (rankingtied for #1, #4, #5, and #10, respectively). Of the leading occupations in 1970, those four hadsome of the lowest percentages of low-wage workers. However, by 2000, each occupation fellin ranking (#6, #8, #14, and #18, respectively). In addition, between 1970 and 2000, the per-centage of low-wage workers in those occupations rose significantly.
Changes in the Racial and Gender Composition of LeadingOccupations for Black Workers
In 2000, Blacks comprised 6.3% of the Bay Area workforce. Four of the top ten Black occu-pations were disproportionately Black: Clerical Workers; Laborers; Stenographers andSecretaries; and Service Workers. Of these four, two (Clerical Workers and Stenographersand Secretaries) experienced a rising percentage of Black workers between 1970 and 2000.Overall, six occupations had a higher percentage of Black workers in 2000 compared to 1970.(See Figure 4.3.)
Figure 4.3Ten Occupations with the Largest Number of Black Workers
1970 and 2000
Occupation 2000 % Black in % Black Change inRank Occupation Occupation % Black in
in 1970 in 2000 OccupationClerical Workers 1 9.8% 10.2% moreManagers, Officials, and Proprietors 2 2.5% 4.8% moreSales Workers 3 2.4% 5.8% moreMiscellaneous Professionals 4 4.6% 4.5% unchangedBusiness Professionals 5 2.6% 6.0% moreOperatives 6 9.8% 4.8% fewerEducation Professionals 7 4.3% 5.6% moreLaborers 8 18.5% 8.2% fewerStenographers and Secretaries 9 4.4% 7.6% moreService Workers 10 14.9% 8.2% fewer

C H A N G E S I N T H E O C C U PAT I O N A L D I S T R I B U T I O N O F B L A C K W O R K E R S
65
Women made up 51.9% of the Bay Area Black workforce in 2000. In that year, three occu-pations were disproportionately female (Clerical Workers; Educational Professionals; andStenographers and Secretaries) and two had Black female workforces which approximatedthe proportion of Black women in the entire Bay Area Black workforce (Managers, Officials,and Proprietors and Sales Workers). In six occupations, the proportion of Black women (rel-ative to Black men) rose between 1970 and 2000. In two occupations, the Black workforcewent from predominately male to predominately female between 1970 and 2000 (Managers,Officials, and Proprietors and Business Professionals), while the Black portion of theMiscellaneous Professional occupation became predominately male; and Black Sales Workersmoved from a small majority of female workers to an even distribution between men andwomen. (See Figure 4.4.)
Figure 4.4Ten Occupations with the Largest Number of Black Workers in 2000
Gender Distribution of Black Workers 1970 and 2000
Occupation 2000 % Female % Female Change in Rank 1970 2000 % Female
Clerical Workers 1 66.0% 69.6% MoreManagers, Officials, and Proprietors 2 30.0% 51.9% MoreSales Workers 3 55.5% 50.0% FewerMiscellaneous Professionals 4 59.1% 48.8% FewerBusiness Professionals 5 40.0% 67.0% MoreOperatives 6 26.1% 29.4% MoreEducation Professionals 7 71.9% 67.8% FewerLaborers 8 3.4% 13.3% MoreStenographers and Secretaries 9 95.4% 91.4% FewerService Workers 10 73.4% 48.3% More

66
Black Workers in the Bay Area: Employment Trends and Job Quality: 1970 – 2000
Conclusion
Three trends are notable in the way occupational distribution for Bay Area Black workers haschanged between 1970 and 2000. First, Sales and Clerical occupations retained their impor-tance, and in both occupations, over one-third of Black workers earned low wages in 1970and 2000. Second, higher-wage blue collar occupations (Operatives; Laborers; Craftsmen;and Mechanics) were less significant occupations for Black workers by 2000. Third, profes-sional occupations (Managers, Officials, and Proprietors; Miscellaneous Professionals;Business Professionals; and Educational Professionals) became more important. While thefirst two trends tended to depress wages among Black workers overall, the latter trend tendedto increase wages.
A P P E N D I X T O C H A P T E R F O U R
67
Appendix to Chapter Four
Figures A4.1 and A4.2 present data on the 1970 and 2000 ethnic distributions of the leadingoccupations for Black workers in 2000. This information allows us to see how the ethnic com-position has changed during that time period. Two trends are striking. Among professionaloccupations that became increasingly important for Black workers between 1970 and 2000,there was a sharp reduction in the proportion of whites in all four occupations and a sharpincrease in the proportion of Asian workers. Among the occupations that saw a sharp reduc-tion in the proportion of Black workers (Operatives; Laborers; and Service Workers), therewas a sharp rise in the proportion of Latino workers.

68
Black Workers in the Bay Area: Employment Trends and Job Quality: 1970 – 2000
Figu
re A
4.1:
Te
n O
ccup
atio
ns w
ith th
e La
rges
t Num
ber
of B
lack
Wor
kers
in 2
000
– Et
hnic
Dis
trib
utio
n of
the
Empl
oyee
s 19
70
Bla
ckW
hite
Nat
ive
Am
eric
anA
sian
Lat
ino
Oth
erC
leri
cal W
orke
rs9.
8%77
.0%
0.2%
5.8%
6.9%
0.3%
Man
ager
s, O
ffici
als,
and
Prop
riet
ors
2.5%
91.0
%0.
0%3.
3%3.
1%0.
1%Sa
les
Wor
kers
2.4%
90.7
%0.
0%2.
5%4.
1%0.
3%M
isce
llane
ous
Prof
essi
onal
s4.
6%88
.8%
0.0%
3.1%
3.3%
0.2%
Bus
ines
s Pr
ofes
sion
als
2.6%
91.4
%0.
3%3.
1%2.
6%0.
0%O
pera
tive
s9.
8%67
.7%
0.5%
6.2%
15.8
%0.
0%Ed
ucat
ion
Prof
essi
onal
s4.
3%88
.1%
0.0%
2.9%
4.5%
0.2%
Labo
rers
18.5
%59
.1%
0.6%
2.7%
18.7
%0.
4%St
enog
raph
ers
an S
ecre
tari
es4.
4%85
.6%
0.8%
4.1%
4.8%
0.2%
Serv
ice
Wor
kers
14.9
%67
.6%
0.5%
8.0%
8.8%
0.2%
Figu
re A
4.2:
Te
n O
ccup
atio
ns w
ith th
e La
rges
t Num
ber
of B
lack
Wor
kers
in 2
000
– Et
hnic
Dis
trib
utio
n of
the
Empl
oyee
s 20
00
Bla
ckW
hite
Nat
ive
Am
eric
anA
sian
Lat
ino
Oth
erC
leri
cal W
orke
rs10
.2%
47.4
%0.
5%21
.0%
17.4
%3.
5%M
anag
ers,
Offi
cial
s, an
d Pr
opri
etor
s4.
8%67
.4%
0.4%
14.8
%9.
6%3.
0%Sa
les
Wor
kers
5.8%
65.1
%0.
4%14
.9%
10.5
%3.
3%M
isce
llane
ous
Prof
essi
onal
s4.
5%55
.4%
0.3%
30.1
%6.
9%2.
9%B
usin
ess
Prof
essi
onal
s6.
0%61
.9%
0.5%
21.3
%7.
8%2.
6%O
pera
tive
s4.
8%27
.0%
0.5%
33.5
%30
.9%
3.4%
Educ
atio
n Pr
ofes
sion
als
5.6%
73.5
%0.
2%9.
1%8.
5%3.
1%La
bore
rs8.
2%31
.0%
0.4%
9.8%
48.0
%2.
6%St
enog
raph
ers
an S
ecre
tari
es7.
6%61
.4%
0.5%
13.7
%13
.3%
3.5%
Serv
ice
Wor
kers
8.2%
49.6
%0.
7%16
.8%
20.6
%4.
1%

A P P E N D I X T O C H A P T E R F O U R
69
Figure A4.3 illustrates the importance of the leading occupations in 2000 to the overall dis-tribution of Black workers. In six occupations, the share of Black workers in these jobs rela-tive to the entire Black workforce rose.
Figure A4.3Ten Occupations with the Largest Number of Black Workers in 2000
Occupation Share of All Black Workers in 1970 and 2000
Occupation 2000 Rank % of All % of All Change in %Black Black of All Black
Workers Workers Workersin 1970 in 2000
Clerical Workers 1 15.2% 16.6% moreManagers, Officials, and Proprietors 2 3.0% 13.7% moreSales Workers 3 2.7% 5.9% moreMiscellaneous Professionals 4 2.2% 5.8% moreBusiness Professionals 5 1.0% 4.5% moreOperatives 6 15.2% 4.2% fewerEducation Professionals 7 2.5% 4.1% moreLaborers 8 8.8% 3.8% fewerStenographers and Secretaries 9 4.3% 3.4% fewerService Workers 10 12.3% 3.4% fewer
Figures A4.4 and A4.5 provide a comparison of median wages and the occupational propor-tion of low wage jobs for Black and white workers in 1970 and 2000.

70
Black Workers in the Bay Area: Employment Trends and Job Quality: 1970 – 2000
Figu
re A
4.4a
:
Top
Occ
upat
ions
– C
ompa
riso
n of
Per
cent
age
of L
ow-w
age
Bla
ck a
nd W
hite
Wor
kers
197
0
Ran
k%
Low
-wag
e Jo
bsO
ccup
atio
n19
70 R
ank
2000
Ran
kB
lack
Wor
kers
Whi
te W
orke
rsC
leri
cal W
orke
rs1T
128
.1%
23.4
%O
pera
tive
s1T
618
.3%
15.4
%Se
rvic
e W
orke
rs3
1058
.1%
31.0
%La
bore
rs4
815
.6%
14.7
%C
raft
smen
514
15.7
%7.
3%Ja
nito
rs6
1925
.0%
22.2
%St
enog
raph
ers
and
Secr
etar
ies
79
25.6
%18
.2%
Man
ager
s, O
ffici
als,
and
Prop
riet
ors
82
13.3
%7.
6%Sa
les
Wor
kers
93
40.8
%21
.6%
Mec
hani
cs10
1811
.1%
5.4%
Educ
atio
n Pr
ofes
sion
als
117
20.0
%10
.5%
Mis
cella
neou
s Pr
ofes
sion
als
134
40.9
%9.
6%B
usin
ess
Prof
essi
onal
s22
510
.0%
5.7%
Figu
re A
4.4b
:
Top
Occ
upat
ions
– C
ompa
riso
n of
Per
cent
age
of L
ow-w
age
Bla
ck a
nd W
hite
Wor
kers
200
0
Ran
k%
Low
-wag
e Jo
bsO
ccup
atio
n19
70 R
ank
2000
Ran
kB
lack
Wor
kers
Whi
te W
orke
rsC
leri
cal W
orke
rs1T
133
.0%
29.5
%O
pera
tive
s1T
638
.7%
27.2
%Se
rvic
e W
orke
rs3
1028
.4%
27.3
%La
bore
rs4
838
.8%
35.9
%C
raft
smen
514
25.5
%22
.2%
Jani
tors
619
40.1
%40
.3%
Sten
ogra
pher
s an
d Se
cret
arie
s7
922
.9%
19.6
%M
anag
ers,
Offi
cial
s, an
d Pr
opri
etor
s8
216
.2%
10.2
%Sa
les
Wor
kers
93
35.7
%22
.3%
Mec
hani
cs10
1820
.8%
14.0
%Ed
ucat
ion
Prof
essi
onal
s11
717
.8%
16.5
%M
isce
llane
ous
Prof
essi
onal
s13
421
.0%
11.3
%B
usin
ess
Prof
essi
onal
s22
55.
7%7.
5%

A P P E N D I X T O C H A P T E R F O U R
71
Figu
re A
4.5a
:
Top
Occ
upat
ions
– C
ompa
riso
n of
Rea
l Med
ian
Wag
es (
$200
0) f
or B
lack
and
Whi
te W
orke
rs 1
970
Ran
kR
eal M
edia
n W
age
($20
00)
Occ
upat
ion
1970
Ran
k20
00 R
ank
Bla
ck W
orke
rsW
hite
Wor
kers
)C
leri
cal W
orke
rs1T
1$
13.
60
$ 1
4.04
O
pera
tive
s1T
6$
15.
34
$ 1
6.92
Se
rvic
e W
orke
rs3
10$
8.9
2 $
14.
05
Labo
rers
48
$ 1
7.52
$
18.
20
Cra
ftsm
en5
14$
16.
93
$ 2
1.52
Ja
nito
rs6
19$
14.
04
$ 1
5.34
St
enog
raph
ers
and
Secr
etar
ies
79
$ 1
2.51
$
13.
39
Man
ager
s, O
ffici
als,
and
Prop
riet
ors
82
$ 1
7.32
$
24.
05
Sale
s W
orke
rs9
3$
13.
17
$ 1
7.52
M
echa
nics
1018
$ 1
6.30
$
21.
86
Educ
atio
n Pr
ofes
sion
als
117
$ 1
8.87
$
24.
62
Mis
cella
neou
s Pr
ofes
sion
als
134
$ 1
7.52
$
22.
31
Bus
ines
s Pr
ofes
sion
als
225
$ 1
6.81
$
22.
96
Figu
re A
4.5b
:
Top
Occ
upat
ions
– C
ompa
riso
n of
Rea
l Med
ian
Wag
es (
$200
0) f
or B
lack
and
Whi
te W
orke
rs 2
000
Ran
kR
eal M
edia
n W
age
($20
00)
Occ
upat
ion
1970
Ran
k20
00 R
ank
Bla
ck W
orke
rsW
hite
Wor
kers
Cle
rica
l Wor
kers
1T1
$ 1
4.40
$
14.
96
Ope
rati
ves
1T6
$ 1
3.49
$
16.
33
Serv
ice
Wor
kers
310
$ 1
8.75
$
18.
27
Labo
rers
48
$ 1
3.94
$
14.
90
Cra
ftsm
en5
14$
18.
71
$ 1
9.23
Ja
nito
rs6
19$
12.
40
$ 1
2.82
St
enog
raph
ers
and
Secr
etar
ies
79
$ 1
5.38
$
16.
67
Man
ager
s, O
ffici
als,
and
Prop
riet
ors
82
$ 2
0.00
$
26.
15
Sale
s W
orke
rs9
3$
15.
20
$ 2
0.28
M
echa
nics
1018
$ 1
8.75
$
20.
05
Educ
atio
n Pr
ofes
sion
als
117
$ 1
8.75
$
20.
43
Mis
cella
neou
s Pr
ofes
sion
als
134
$ 1
9.38
$
26.
28
Bus
ines
s Pr
ofes
sion
als
225
$ 2
0.19
$
25.
64

72
Black Workers in the Bay Area: Employment Trends and Job Quality: 1970 – 2000
CHAPTER FIVE
An Industrial and OccupationalLook at the Differing Fates ofBlack Women and Black Menbetween 1970 and 2000
Chapter Overview
As detailed in Chapter 2, between 1970 and 2000, Black men and Black women in the BayArea moved along radically different trajectories in the labor market. Re-visiting just onemeasure of employment outcomes, the proportion of Black men working in low-wage jobsrose from 14.9% to 27.0%; for Black women, this proportion fell from 29.4% to 21.4%. Toexplore the causes of these different paths, we identified the top ten industries and occupa-tions (with respect to Black employment), then label these sectors as “male” or “female” basedupon the proportion of each gender in 1970. Next, we trace the changes median wage andthe proportion of low-wage employment in these sectors over time.
The key story that emerges is that industrial and occupational change has a great deal to dowith the different wage paths taken by Black men and Black women. There was a general ten-dency for those industries and occupations where the Black workforce was predominatelymale to see an increase in low-wage employment between 1970 and 2000; in contrast, inindustries and occupations where women are the majority of the Black workforce, the propor-tion of low-wage work tended to fall.
Some key findings in this chapter are:
Industries• Of the six male-dominated industries in 1970, four employed a larger proportion
of low-wage workers by 2000.
• Of the four female-dominated industries in 1970, all employed a smaller proportion of low-wage workers by 2000.
Occupations• Of the six male-dominated occupations in 1970, all contained a larger proportion
of low-wage workers by 2000.
• Of the six female-dominated occupations in 1970, three contained a smaller proportion of low-wage workers by 2000.
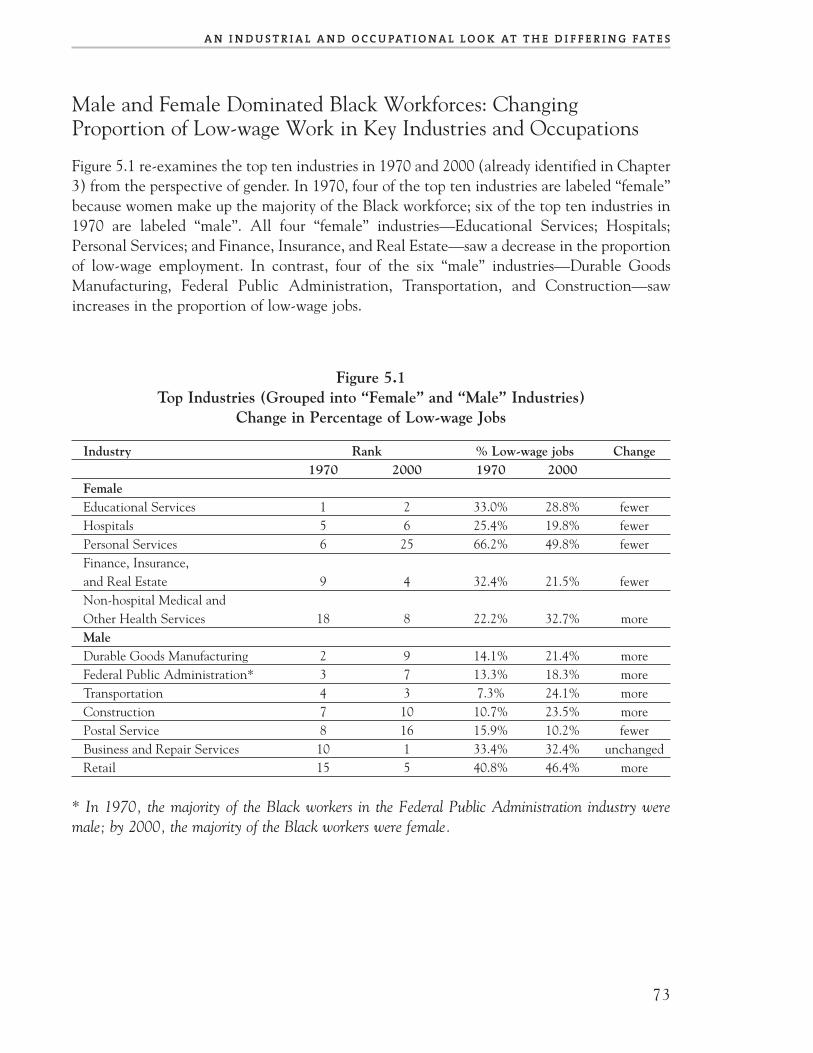
A N I N D U S T R I A L A N D O C C U PAT I O N A L L O O K AT T H E D I F F E R I N G FAT E S
73
Male and Female Dominated Black Workforces: ChangingProportion of Low-wage Work in Key Industries and Occupations
Figure 5.1 re-examines the top ten industries in 1970 and 2000 (already identified in Chapter3) from the perspective of gender. In 1970, four of the top ten industries are labeled “female”because women make up the majority of the Black workforce; six of the top ten industries in1970 are labeled “male”. All four “female” industries—Educational Services; Hospitals;Personal Services; and Finance, Insurance, and Real Estate—saw a decrease in the proportionof low-wage employment. In contrast, four of the six “male” industries—Durable GoodsManufacturing, Federal Public Administration, Transportation, and Construction—sawincreases in the proportion of low-wage jobs.
Figure 5.1Top Industries (Grouped into “Female” and “Male” Industries)
Change in Percentage of Low-wage Jobs
Industry Rank % Low-wage jobs Change1970 2000 1970 2000
FemaleEducational Services 1 2 33.0% 28.8% fewerHospitals 5 6 25.4% 19.8% fewerPersonal Services 6 25 66.2% 49.8% fewerFinance, Insurance, and Real Estate 9 4 32.4% 21.5% fewerNon-hospital Medical and Other Health Services 18 8 22.2% 32.7% moreMaleDurable Goods Manufacturing 2 9 14.1% 21.4% moreFederal Public Administration* 3 7 13.3% 18.3% moreTransportation 4 3 7.3% 24.1% moreConstruction 7 10 10.7% 23.5% morePostal Service 8 16 15.9% 10.2% fewerBusiness and Repair Services 10 1 33.4% 32.4% unchangedRetail 15 5 40.8% 46.4% more
* In 1970, the majority of the Black workers in the Federal Public Administration industry weremale; by 2000, the majority of the Black workers were female.

74
Black Workers in the Bay Area: Employment Trends and Job Quality: 1970 – 2000
The same analysis can be performed looking at the occupational distribution of Black menand women. Figure 5.2 segments the top occupations in “male” and “female” occupations andpresents the rankings in 1970 and 2000 along with the change in the proportion of low-wagejobs. In three of the “female” occupations—Service Workers; Stenographers and Secretaries;and Sales Workers—the proportion of low-wage jobs fell. The proportion of low-wageemployment rose on all of the “male” occupations (Operatives; Laborers; Craftsmen; Janitors;Managers, Officials, and Proprietors; and Mechanics).
Figure 5.2Top Occupations (Grouped into “Female” and “Male” Occupations)
Change in Percentage of Low-wage Jobs
Rank % Low-wage jobs ChangeOccupation 1970 2000 1970 2000FemaleClerical Workers 1 1 28.1% 33.0% moreService Workers* 3 10 58.1% 28.4% fewerStenographers and Secretaries 7 9 25.6% 22.9% fewerSales Workers*** 9 3 40.8% 35.7% fewerEducation Professionals 11 7 20.0% 17.8% fewerBusiness Professionals 22 5 10.0% 5.7% fewerMaleOperatives 1 6 18.3% 38.7% moreLaborers 4 8 15.6% 38.8% moreCraftsmen 5 14 15.7% 25.5% moreJanitors 6 19 25.0% 40.1% moreManagers, Officials, and Proprietors** 8 2 13.3% 16.2% moreMechanics 10 18 11.1% 20.8% moreMiscellaneous Professionals** 13 4 40.9% 21.0% fewer
* male in 2000; ** female in 2000; *** even split in 2000

A N I N D U S T R I A L A N D O C C U PAT I O N A L L O O K AT T H E D I F F E R I N G FAT E S
75
Change in the Distribution of Black Men and Black Women in Key Industries and Occupations
Figures 5.3 and 5.4 present information on the changing distribution of Black men and Blackwomen in key industries and occupations between 1970 and 2000. While the data reinforcespopular anecdotes—women are concentrated in clerical and service occupations; men domi-nate blue-collar occupations and managerial professions—some changes in the intensities ofthese concentrations can be noted.
By 2000, the Black workforce had a lower percentage of women workers in all of the 1970“female” industries except Finance, Insurance, and Real Estate. In each of the “male” indus-tries, women comprised a larger percentage of the Black workforce, and in contrast to 1970,no industry had a Black workforce that was over 90% male. This same trend is evident in thekey occupations. In four of the six “female” occupations, the proportion of Black women inthose occupations fell; in five of the seven “male” occupations, the proportion of Blackwomen rose.
Figure 5.3Top Industries (Grouped into “Female” and “Male” Industries)
Changing Gender Composition of Black Workers
Rank Male FemaleIndustry 1970 2000 1970 2000 1970 2000FemaleEducational Services 1 2 31.0% 31.1% 69.0% 68.9%Hospitals 5 6 26.6% 31.2% 73.4% 68.8%Personal Services 6 25 12.2% 31.8% 87.8% 68.2%Finance, Insurance, and Real Estate 9 4 43.2% 33.0% 56.8% 67.0%Non-Hospital Medical and Other Health Services 18 8 18.8% 22.3% 81.2% 77.7%MaleDurable Goods Manufacturing 2 9 90.2% 67.5% 9.8% 32.5%Federal Public Administration 3 7 61.1% 36.7% 38.9% 63.3%Transportation 4 3 91.5% 72.3% 8.5% 27.7%Construction 7 10 91.1% 81.3% 8.9% 18.7%Postal Service 8 16 56.8% 61.1% 43.2% 38.9%Business Services 10 1 58.3% 54.6% 41.7% 45.4%Retail 15 5 58.0% 55.6% 42.0% 44.4%

76
Black Workers in the Bay Area: Employment Trends and Job Quality: 1970 – 2000
Figure 5.4Top Occupations (Grouped into “Female” and “Male” Occupations)
Changing Gender Composition of Black Workers
Rank Male FemaleOccupation 1970 2000 1970 2000 1970 2000FemaleClerical Workers 1T 1 34.0% 30.4% 66.0% 69.6%Service Workers* 3 10 26.6% 51.7% 73.4% 48.3%Stenographers and Secretaries 7 9 4.6% 8.6% 95.4% 91.4%Sales Workers*** 9 3 44.5% 50.0% 55.5% 50.0%Education Professionals 11 7 32.2% 28.1% 67.8% 71.9%Business Professionals 22 5 33.0% 60.0% 67.0% 40.0%MaleOperatives 1T 6 73.9% 70.6% 26.1% 29.4%Laborers 4 8 96.6% 86.7% 3.4% 13.3%Craftsmen 5 14 98.0% 83.1% 2.0% 16.9%Janitors 6 19 77.1% 79.4% 22.9% 20.6%Managers, Officials, and Proprietors** 8 2 70.0% 48.1% 30.0% 51.9%Mechanics 10 18 92.6% 92.9% 7.4% 7.1%Miscellaneous Professionals** 13 4 51.2% 40.9% 48.8% 59.1%
* male in 2000; ** female in 2000; *** even split in 2000
Conclusion
Between 1970 and 2000, the wage trajectories for Black men and Black women moved inopposite directions: Black male workers experienced rising levels of low-wage work, whileBlack female workers experienced falling levels of low-wage work. Much of the difference inthese outcomes can be explained by examining what happened to the percentage of low-wageworkers in the industries and occupations where the Black workforce was predominately maleor female. In 1970, six of the ten leading industries had men in the majority of their Blackworkforce; 2000, four of these had a larger percentage of low-wage Black workers. Looking atthose leading occupations where Black men outnumbered Black women in 1970, all had alarger proportion of low-wage Black workers in 2000. Examining those leading industries andoccupations where Black women outnumbered Black men in 1970, all four of the industriesand three of the six occupations had a lower percentage of low-wage workers in 2000.

T O WA R D A N E W A P P R O A C H T O T H E C R I S I S O F W O R K I N T H E B L A C K C O M M U N I T Y
77
Conclusion: Toward a NewApproach to the Crisis of Work in the Black Community
Since 1970, over one-quarter of Black workers in the Bay Area have earned low wages. Thislarge proportion has persisted despite the clear successes of the modern civil rights movement.The large number of low-wage Black workers—who exceed those who are officially unem-ployed–implies a need to transform the approach to work in the Black community on con-ceptual, policy, and programmatic levels.
Conceptual Implications
There are two aspects of the job crisis facing Black communities that need to be reconceptu-alized. First, thinking on these issues must broaden in order to recognize the existence of asubstantial segment of the Blacks who work at low wages. Broadening the focus of employ-ment concerns is not intended to replace concerns about stubbornly high levels of unemploy-ment; not is it intended to minimize the impact of mass incarceration on the Black commu-nity. But, simply, it will be impossible to build thriving communities when large numbers ofthe community’s workers do not earn livable wages. Second, the reconceptualization mustincorporate a structural analysis within any understanding of the job crisis facing Black com-munities. The U.S. economy has stopped producing large numbers of blue collar jobs which,during previous times, provided good wages. Approaches that are limited to addressing real orimagined shortcomings on the part of individuals seeking employment will not be largely suc-cessful.
Policy Implications
The old framework identifies the central problem facing Blacks in the labor market as unem-ployment. During the modern civil rights movement, structural racism was seen as the pri-mary source of unemployment—either in the hiring practices of employers or in institutionsresponsible for preparing individuals for work and matching workers to the labor market.With the rise in conservatism over the past thirty years, conventional wisdom has shiftedresponsibility for unemployment from labor market structures to individual job seekers. Thuspolicy solutions have emphasized job training and job readiness programs that seek to imparthard skills, soft skills, or provide applicants with better information on employment prospects.

78
Black Workers in the Bay Area: Employment Trends and Job Quality: 1970 – 2000
While individuals need to be fully prepared to take advantage of labor market opportunities,this singular focus on individuals ignores the prospects that individuals find in the labor mar-ket and the nature of jobs that are held currently by Black workers. Policy makers must rec-ognize the dual nature of the job crisis facing the Black community: the crisis of unemploy-ment and the crisis of low-wage employment, and then explore how public policy can influ-ence job quality outcomes in labor market by enacting standards for firms.
Broadly speaking, the quality of employment is affected by three general forces: the skill lev-els of individuals; the demand for workers by firms; and the social and political context thatconstrains the choices made by individuals and firms. Primarily, policies have targeted thefirst two forces as attempts are made to influence the education and training of workers, andthe location and start-up decisions of businesses. Often what is forgotten is the ability of pol-icy to influence outcomes by creating standards for labor market behavior. Child labor laws,minimum wage laws, and occupational health and safety regulations are examples of policiesthat constrain the actions of firms in order to improve the quality of work and, therefore,improve societal well-being. The benefits of these interventions have been lost in recent yearsin the rush to create “business-friendly” climates. Consequently, labor market standards haveeroded and the quality of work has declined for most workers. Given historical and contem-porary discrimination, Black workers are most adversely impacted by the decline of these pro-tective standards. There is a need to examine policies that will increase standards in the areasof: wages (minimum wage laws; living wage laws); benefits (protecting employer-based healthcare and pension plans); and the right to unionize.
Programmatic Implications
The narrow approach to the job crisis has resulted in an allocation of resources to programsand organizations that have a singular focus on unemployment. Government agencies,churches, and community-based organizations develop a variety of job training/jobreadiness/labor exchange programs. At their core, these programs seek to change an individ-ual’s situation by moving that person from unemployment to any job or from a current job toanother job. However, recognition of the low-wage job crisis and the contemporary state ofthe U.S. economy in which millions of low wage jobs are being created on an annual basisrequires that resources and programs also address the need to transform the low-wage jobsthemselves. Labor market standards are one way to effect these changes. A wide variety ofjurisdictions are exploring ways to extend health benefits to uninsured workers and some aremandating that selected industries pay workers a higher wage. Voters in San Francisco passedan initiative establishing a specific minimum wage for workers in the city. The Board ofSupervisors in San Francisco enacted legislation to expand health care coverage to residents.Residents in Emeryville, California voted for a wage standard specifically covering the city’shotel industry. As mentioned in the Introduction, the City Council in Chicago nearly over-rode a mayoral veto to establish wage and health benefits standards for “big box” stores.

T O WA R D A N E W A P P R O A C H T O T H E C R I S I S O F W O R K I N T H E B L A C K C O M M U N I T Y
79
Complementing these programs must be efforts to help workers and their communities organ-ize and work collectively to address the crisis of low-wage jobs. Two important points must bemade in this regard. First, the policy successes of the modern civil rights movement occurredbecause years of legal segregation and extra-legal violence forged a Black community withdense social networks and a multiplicity of organizations. This organizational capacity sus-tained the movement through ebbs and flows of activism and finally provided the basis forthe eventual defeat of de jure segregation. Any sustained successes in raising the quality ofjobs held by Black workers will require a similar level of organizational capacity.
Second, much is made of the role of blue collar manufacturing jobs in the development of sta-ble Black communities with decent incomes and the subsequent devastation visited uponBlack communities in the aftermath of the deindustrialization of the 1970s and 1980s. Whatis not said is that most of these jobs were well-paying jobs because they were union jobs.When Blacks migrated from Georgia and the Carolinas to New York City, they entered alabor market heavily influenced by powerful unions. When Blacks left Alabama andMississippi for jobs in Detroit’s auto industry and Chicago’s steel industry, they helped toorganize the United Auto Workers and the United Steelworkers of America. When Blacksmoved from Louisiana and Texas to California, they found jobs in heavily unionized maritimeand aircraft industries. Unions can enable workers to successful obtain higher wages and bet-ter benefits from their employer. In conjunction with community allies, unions have thepotential to gather the political power necessary to pass legislation and fund the necessaryenforcement agencies to create labor standards that raise the quality of work. An importantelement of any strategy to raise job quality for Black workers will be unionization.

80
Black Workers in the Bay Area: Employment Trends and Job Quality: 1970 – 2000
1 The data sources for this report are the U.S. Census Bureau’s Public Use Microdata Set (PUMS) forthe years 1970, 1980, 1990, and 2000; the Bureau of Labor Statistics’ Current Population Survey.
2 Sarkar, Pia (2005) “Want a Wal-Mart Job?...”, San Francisco Chronicle (August 17)
3 This report’s focus does not imply that African Americans are the only racial and ethnic group toface differential outcomes in the labor market or that the labor market experiences of AfricanAmericans should be privileged over other groups. Race still matters in determining a wide variety ofsocial and economic outcomes in United States society and it affects the life chances of all persons ofcolor. In addition, the old binary approach to race —- reducing the country’s realities to simply Blackand white —- was never fully accurate and has even less validity today. However, while race affectsall racial and ethnic groups, the way in which race affects particular groups will vary across groupsgiven the unique histories of each group. To ignore these key distinctions renders any effort to serious-ly address racialized outcomes impotent. In order to address the impacts of racism on AfricanAmericans, it is essential to study and understand the racial realities of Blacks and not subsume theseexperiences under the rubric of “people of color”.
4 Alice O’Connor, Poverty Knowledge: Social Science, Social Policy, and the Poor in TwentiethCentury U.S. History (2001).
5 For example see Dave Carpenter, “Push Is on for Higher Wal-Mart Wages”, Houston Chronicle(June 21, 2006).
6 The data source for this report is the U.S. Census Bureau’s Public Use Microdata Set (PUMS) forthe years 1970, 1980, 1990, and 2000. The data is available online courtesy of the University ofMinnesota’s Minnesota Population Center at http://www.ipums.umn.edu/usa/ .
7 See, The Bottom Line: Setting a Real Standard for Bay Area Working Families (http://www.uwba.org/helplink/reports/BottomLine.pdf).
8 In an earlier report, “Black Workers in the Bay Area: 1970 – 2000: A Data Brief (Steven Pitts andSteve Wertheim), we mistakenly said that persons who were formerly incarcerated were counted inthe household as not in the labor force.
9 Note: this figure is not identical to the published official unemployment rate. That rate looks at theproportion of the labor force that is unemployed. Here, we are examining the proportion of the entireworking-age population that is unemployed. The key difference is that the latter calculation looks ata broad population (the working age population) compared to the former calculation, which exam-ines only the labor force.
10 This phase of the research project is unable to shed light on what accounts for these divergent fates.Possible causes for these trends include the rise of Black male involvement in the criminal justice system;a decline in the industries that provide full-time work for Black men; and a rise in Black female labor forceparticipation associated with a rise in service sector employment (especially in care industries).

E N D N O T E S
81
11 The industrial composition of employment is important because most economic development poli-cies try to influence individual firm behavior or industry behavior. The expansion or contraction ofindustries in response to these policies and other conditions determines both the size of the workforceand the distribution of workers across industries. These policies are in contrast to workforce develop-ment policies that seek to improve the skill level of individual workers and thus are inherently linkedto occupations. Often different industries utilize workers with similar skill sets; thus, occupational cat-egories may be the same in different industries and workers may change employment across industries.Still, when most residents think about government efforts to impact employment, people consider theattempt by governments to attract firms and industries to their region. In addition, the industrial dis-tribution of employment is important because a key strategy to improve the quality of existing jobs isunionization, and most unions attempt to organize workers based on firms and industries.
It is also important to present data on industry because the employment prospects for workers—andhence, their prospects for earning potential—partially are shaped by the structure of the industriesthat are hiring. Without the demand for labor on the part of firms that are offering livable wages, itwill be increasing difficult for job seekers to find employment that allows them to raise their familiesat decent living standards. As the industrial structure of the economy changes—measured by the levelof employment in each industry; the distribution of jobs across different industries; and the wages paidby these industries—so will change the prospects for jobs that pay well. This chapter will examinesome of these changes.
12 There are many ways to define “concentrations.” While this report utilizes a definition based uponthe sheer size of the Black workforce, an alternative definition could be based upon disproportionali-ty. In this case, the top industrial concentration would be determined by where the proportion ofBlacks in the sector was larger than the proportion of Blacks in the overall workforce. Both definitionshave validity and the choice depends upon the context of the study.
13 The ethnic categories—Black, non-Hispanic white, Native American, Asian, and Latino—wereconstructed so that they are mutually exclusive. For ease of exposition, the term white will be usedinstead of non-Hispanic white.
14 The occupational distribution of employment is important because one of the features of the mod-ern economic order is greater churning in labor markets. There are fewer long-term attachmentsbetween firm and workers and there is increased movement across companies by workers. This move-ment may result in workers changing industries as they seek better employment opportunities. Whatallows a worker to change jobs more or less successfully is the set of skills they possess; these skill setscoalesce into specific occupations that can be pursued across industries. From the point of view of anindividual job seeker, occupations appear more important than industries as they attempt to find afirm—almost regardless of industry—with a job vacancy. Accordingly, many regional workforce devel-opment policies seek to train individuals for the fastest-growing occupations.

Black Workers in the Bay AreaEEmmppllooyymmeenntt TTrreennddss aanndd JJoobb QQuuaalliittyy:: 11997700 ––22000000
SStteevveenn CC.. PPiittttss,, PPhh..DDCCeenntteerr ffoorr LLaabboorr RReesseeaarrcchh aanndd EEdduuccaattiioonn,, UUCC BBeerrkkeelleeyy
NNoovveemmbbeerr 22000066CCEENNTTEERR FFOORR LLAABBOORR RREESSEEAARRCCHH
AANNDD EEDDUUCCAATTIIOONN
IInnssttiittuuttee ooff IInndduussttrriiaall RReellaattiioonnss
UUnniivveerrssiittyy ooff CCaalliiffoorrnniiaa
22552211 CChhaannnniinngg WWaayy
BBeerrkkeelleeyy,, CCAA 9944772200--55555555
OOffffiiccee ((551100)) 664422--00332233
FFaaxx ((551100)) 664422--66443322
hhttttpp::////llaabboorrcceenntteerr..bbeerrkkeelleeyy..eedduu
The Center for Labor Research and Education (Labor Center) is a public service and outreach program
of the UC Berkeley Institute of Industrial Relations.Founded in 1964, the Labor Center conducts research
and education on issues related to labor and employment.The Labor Center’s curricula and leadership trainings
serve to educate a diverse new generation of labor leaders. The Labor Center conducts research on topicssuch as job quality and workforce development issues,and we work with unions, government, and employers
to develop innovative policy perspectives and programs.We also provide an important source of research and
information on unions and the changing workforce forstudents, scholars, policymakers and the public.