black veatch corporation - buyers-world.nl · black & veatch owes no duty of care to any...
TRANSCRIPT

BLACK & VEATCH CORPORATION 11401 LAMAR, OVERLAND PARK, KS 66211 USA +1 757‐903‐7528 | [email protected]
April 12, 2012 JA Solar B&V Project 174283 860 Hillview Court Suite 100 Milpitas, CA 95035 U.S.A. via email Attention: Tamara Montague and Yuan Wang
Subject: Final Solar Module Due Diligence Report
Black & Veatch is pleased to submit this Final Solar Module Due Diligence Report to JA Solar. Please contact if there are any corrections or additional information that should be incorporated into this report. We would be happy to update this report as new information on the modules becomes available for review. Should you have any comments, please feel free to contact me at (757) 903‐7528. Very truly yours, BLACK & VEATCH CORPORATION Dr. Ralph Romero Director RR Enclosure[s] cc:
Solar Module Due Diligence
FINAL B&V Project Number 174283
April 12, 2012
Black & Veatch Corporation 11401 Lamar
Overland Park, Kansas 66211 Tel: (913) 458‐2000 www.bv.com

Principal Investigator: Dr. Ralph Romero
© Copyright, Black & Veatch Corporation, 2012. All rights reserved. The Black & Veatch name and logo are registered trademarks of Black & Veatch Holding Company

JA Solar Hong Kong Limited Solar Module Due Diligence Legal Notice
April 12, 2012 LN‐1 Black & Veatch
Legal Notice
This report is intended for review by JA Solar Hong Kong Limited (hereinafter “Client”) and any other party who Client authorizes to receive this report. Until such time as a party that has reviewed the report has executed a Reliance Letter it shall be deemed an Unauthorized Party. Without the execution of such Reliance Letter in the form required by Black & Veatch by an Unauthorized Party, creating contractual terms and conditions between Black & Veatch and such Unauthorized Party, any access to this report or any of the information enclosed herein is without any risk or liability to Black & Veatch. Reliance on the information herein by any such Unauthorized Parties would be unreasonable and is strictly prohibited. Black & Veatch owes no duty of care to any Unauthorized Parties and none is created by this report. This report was prepared for Client by Black & Veatch and is based on information not within the control of Black & Veatch. Black & Veatch has assumed that the information, both verbal and written, provided by others is complete and correct; however, Black & Veatch does not guarantee the accuracy of the information, data, or opinions contained herein. Use of this report, or any information contained therein, by Unauthorized Parties shall constitute a waiver and release of Black & Veatch from and against all claims and liability, including, but not limited to, claims for breach of contract, breach of warranty, strict liability, negligence, negligent misrepresentation, and/or otherwise, and liability for special, incidental, indirect, or consequential damages, in connection with such use. In addition, use of this report, or any information contained therein by Unauthorized Parties, shall constitute agreement to defend and indemnify Black & Veatch from and against any claims and liability, including, but not limited to, liability for special, incidental, indirect, or consequential damages in connection with such use. The benefit of such releases, waivers, or limitations of liability shall extend to the related companies, and subcontractors of any tier of Black & Veatch, and the directors, officers, partners, employees, and agents of all released or indemnified parties. BLACK & VEATCH SHALL HAVE NO LIABILITY TO UNAUTHORIZED PARTIES FOR ANY LOSSES OR DAMAGES ARISING FROM OR IN ANY WAY RELATED TO THE REPORT AND/OR THE INFORMATION CONTAINED THEREIN. SUCH EXPRESS WAIVER OF LIABILITY BY THE UNAUTHORIZED PARTIES SHALL INCLUDE ALL CLAIMS WHICH THE UNAUTHORIZED PARTIES MAY ALLEGE IN CONNECTION WITH BLACK & VEATCH’S REPORT INCLUDING, BUT NOT LIMITED TO, BREACH OF CONTRACT, BREACH OF WARRANTY, STRICT LIABILITY, NEGLIGENCE, NEGLIGENT MISREPRESENTATION, AND/OR OTHERWISE.

JA Solar Hong Kong Limited Solar Module Due Diligence Table of Contents
April 12, 2012 TC‐1 Black & Veatch
Table of Contents
Legal Notice ................................................................................................................................................................. 1 1. Executive Summary .............................................................................................................................1‐1
1.1 Company ...................................................................................................................................1‐1 1.2 Module Design and Components ....................................................................................1‐2 1.3 Durability and Reliability ...................................................................................................1‐2 1.4 Module Manufacturing Facilities ....................................................................................1‐3 1.5 Manufacturing Process and Quality Assurance ........................................................1‐3 1.6 Quality Organization and Processes ..............................................................................1‐3 1.7 Module Performance ...........................................................................................................1‐4
2. Introduction ............................................................................................................................................2‐1
2.1 Scope of Work .........................................................................................................................2‐1 2.2 Approach and Methodology .............................................................................................2‐1 2.3 Assumptions ............................................................................................................................2‐1
3. Company Background .........................................................................................................................3‐1
3.1 JA Solar Company Background ........................................................................................3‐1 3.2 JA Solar Management Team ..............................................................................................3‐2
4. Module Design and Components ....................................................................................................4‐1
4.1 Module Design and Specification ....................................................................................4‐1 4.2 Supply Chain and Major Components ..........................................................................4‐4
5. Durability and Reliability ..................................................................................................................5‐1
5.1 Certifications and Standards ............................................................................................5‐1 5.1.1 IEC 61215 ..............................................................................................................5‐1 5.1.2 IEC 61730 ..............................................................................................................5‐2 5.1.3 UL 1703 ..................................................................................................................5‐2
5.2 Warranty and Warranty Claims ......................................................................................5‐3 5.3 Changes in Module Performance Over Time .............................................................5‐4
5.3.1 Light Induced Degradation (LID) ................................................................5‐4 5.3.2 Long Term Degradation ..................................................................................5‐5
6. Manufacturing Facilities ....................................................................................................................6‐1
6.1 Fengxian Module Assembly Facility ..............................................................................6‐1 7. Manufacturing Process and Quality Assurance ........................................................................7‐1

JA Solar Hong Kong Limited Solar Module Due Diligence Table of Contents
April 12, 2012 TC‐2 Black & Veatch
7.1 Overview ...................................................................................................................................7‐4 7.1.1 Incoming material inspection .......................................................................7‐4 7.1.2 Material preparation .........................................................................................7‐5 7.1.3 Solar cell tabbing and stringing ....................................................................7‐5 7.1.4 Layup and busbar soldering ..........................................................................7‐5 7.1.5 Pre‐laminate preparation ...............................................................................7‐5 7.1.6 Lamination ............................................................................................................7‐6 7.1.7 Trimming ...............................................................................................................7‐6 7.1.8 Framing ..................................................................................................................7‐6 7.1.9 Junction box Installation .................................................................................7‐6 7.1.10 Module curing and cleaning ...........................................................................7‐7 7.1.11 Electrical and flash testing .............................................................................7‐7 7.1.12 EL testing ...............................................................................................................7‐7 7.1.13 Module packaging ..............................................................................................7‐8
7.2 Safety ..........................................................................................................................................7‐8 8. Quality Organization and Processes .............................................................................................8‐1
8.1 Quality Assurance (QA) Organization...........................................................................8‐1 8.2 Quality Assurance Facilities ..............................................................................................8‐1 8.3 Equipment and Maintenance ...........................................................................................8‐1 8.4 Document Control .................................................................................................................8‐2 8.5 Product Serialization ...........................................................................................................8‐2
9. Module Performance ...........................................................................................................................9‐1
9.1 Record for Increasing Module Efficiency ....................................................................9‐1 9.2 Field Performance ................................................................................................................9‐2
9.1.1 Project Temperature Performance .............................................................9‐2 9.1.2 Low Light Performance ...................................................................................9‐3 9.1.3 Plant Performance Ratio .................................................................................9‐3 9.1.4 Field Performance Conclusions ....................................................................9‐4
9.3 Definitions of Performance ...............................................................................................9‐4 9.4.1 STC Rating .............................................................................................................9‐4 9.4.2 Temperature Coefficient of Power ..............................................................9‐4 9.4.3 Low Light Performance ...................................................................................9‐4 9.4.4 Performance Ratio .............................................................................................9‐4

JA Solar Hong Kong Limited Solar Module Due Diligence Table of Contents
April 12, 2012 TC‐3 Black & Veatch
Table of Contents (Continued)
List of Tables
Table 4‐1. Comparison of JA Solar and Suntech 280W Modules ...................................................... 4‐2 Table 4‐2. JA Solar Approved Vendors for Selected Module Materials ........................................ 4‐4 Table 5‐1. Qualification Testing .................................................................................................................... 5‐1 Table 5‐2. JA Solar Light Induced Degradation Measurements ....................................................... 5‐5 Table 5‐3. Estimated Degradation for the JAP6‐72 Module .............................................................. 5‐5 Table 7‐1. Observed Process Excursions and Resolution .................................................................. 7‐1
List of Figures
Figure 4‐1. JA Solar 72‐Cell Polycrystalline Silicon Module .............................................................. 4‐2 Figure 5‐1. Flow Diagram of JA Solar Customer Return Process .................................................... 5‐4 Figure 6‐1. Illustration of JA Solar’s Fengxian Module Assembly Facility ................................... 6‐1 Figure 7‐1. JA Solar Module Assembly Process Overview ................................................................. 7‐4 Figure 9‐1. Increase in JA Solar Cell and Module efficiency from 2008 to 2011 ...................... 9‐1 Figure 9‐2. Project Performance Ratio as a Function of Module Temperature ........................ 9‐2 Figure 9‐3. Temperature‐Corrected Performance Ratio .................................................................... 9‐3

JA Solar Hong Kong Limited Solar Module Due Diligence 1 Executive Summary
April 12, 2012 1‐1 Black & Veatch
1. Executive Summary
Black & Veatch was retained by JA Solar Hong Kong Limited (“JA Solar”) to perform technical due diligence on its JAM5(L) Secium, JAM6‐60, JAM6‐60 Secium, JAP6‐60, JAP6‐72 and JAP6‐60 Maple photovoltaic (“PV”) modules (“Modules”) and its manufacturing process for the Modules. Established in 2005, JA Solar was listed on NASDAQ in the United States (ticker symbol: JASO) on February 7, 2007. JA Solar manufactures its own cells and modules and also manufactures cells for other module companies. JA Solar is headquartered in Shanghai, China and reports 2.8 GW of monocrystalline and polycrystalline cell manufacturing capacity across two facilities in Hebei Province and Jiangsu Province. JA Solar has indicated that it was the world’s largest manufacturer of crystalline silicon PV cells in 2011. JA Solar also reports 1.2 GW of PV module capacity at its module facility in the Fengxian District of Shanghai as of the end of 2011. In July 2011, JA Solar finalized agreements to acquire 100% ownership of Solar Silicon Valley, a wafer producer with annual manufacturing capacity of 485 MW. JA Solar earned 10.7 billion RMB (approximately US$1.7B) in 2011 revenue with shipments of 1.69 GW. The company expects cell and module shipments for 2012 to be between 1.8 and 2.0 GW. The purpose of this report is to provide a technical due diligence review of the Modules and JA Solar’s manufacturing operations for the Modules as observed during visits to the operations in August and October of 2011. During the due diligence process, Black & Veatch evaluated information provided by JA Solar and made two visits to the JA Solar module manufacturing facility in the Fengxian District of Shanghai, China. Additionally, Black & Veatch reviewed performance and environmental test data provided by JA Solar. Information and assumptions provided by JA Solar were assumed to be current and correct. Black & Veatch notes the following major conclusions regarding the Modules. 1.1 Company
JA Solar is a vertically integrated manufacturer of solar components with a wafer production facility in Jiangsu Province, cell production facilities in Hebei and Jiangsu Provinces and a module assembly facility in Shanghai.
JA Solar was established in 2005 and has since grown into one of the world’s largest producers of solar PV cells with 2.8 GW of cell manufacturing capacity.
The manufacture of PV modules is a relatively new business for JA Solar as JA Solar started manufacturing “white label” modules for its customers as an additional service in Q4’09. Sales of PV modules made up 21% of JA Solar’s 2010 revenues while the majority of its revenues were derived from the sale of PV cells to other module companies.
JA Solar claims 1.2 GW of manufacturing capacity for modules under its own brand and white label modules for others as of the end of 2011.
Key members of JA Solar’s senior leadership have relevant experience at other solar equipment companies and in the semiconductor industry.

JA Solar Hong Kong Limited Solar Module Due Diligence 1 Executive Summary
April 12, 2012 1‐2 Black & Veatch
1.2 Module Design and Components
Black & Veatch finds the designs for most of the Modules to be substantially similar to the designs for the majority of other crystalline silicon PV modules which Black & Veatch has studied and appropriate to meet the Modules’ technical specifications
The design of the JAP6‐60 Maple module differs substantively from that of other PV modules. The solar cells used in the JAP6‐60 module are manufactured using wafers that are made by seeded directional solidification.
JA Solar warranties that the Modules will provide 90% of the minimal rated power during the first ten years of operation and 80% of the minimal rated power for the following 15 years. As the Modules have only been in the field for a couple of years, JA Solar was unable to provide Black & Veatch with measurement data that supports these values.
Black & Veatch reviewed the bill of materials and suppliers for the Modules during its August 2011 visit. Components and materials used in manufacturing come from both leading suppliers with long track records and from lesser known Chinese suppliers.
1.3 Durability and Reliability
All of the Modules have passed the key certification tests (IEC 61215 or UL 1703) which are considered standard qualifications by the solar energy industry. The required certifications vary by jurisdiction and users of the Modules should verify that they have selected the Modules with the appropriate certifications.
Long term field performance data was unavailable because the Modules are new products. JA Solar has recently installed a monitored test site and is gathering Module field performance data. Black & Veatch recommends further study of the long term performance and reliability of the Modules and finds the installation of this test site to be movement in the right direction.
JA Solar has not provided any information which would enable an estimate of the expected long term degradation of the Modules. In the absence of such data, Black & Veatch recommends assuming a base case annual degradation of 0.8 percent for JAM5(L) Secium, JAM6‐60, JAM6‐60 Secium, and 0.7 percent for JAP6‐60, JAP6‐72 and JAP6‐60 Maple. The actual degradation could vary substantially from one module to another, and could be better or worse than this base case assumption.
JA Solar has a well‐equipped test center in its Shanghai module facility that performs quality assurance functions and extended product testing.

JA Solar Hong Kong Limited Solar Module Due Diligence 1 Executive Summary
April 12, 2012 1‐3 Black & Veatch
1.4 Module Manufacturing Facilities
Assembly of the Modules takes place at JA Solar’s facility in the Fengxian District of Shanghai, China. JA Solar indicated that this facility had 500 MW of capacity as of the end of 2010.
Black & Veatch visited the Fengxian facility on August 8 and 9, 2011 and on October 31, 2011. The facility and capital equipment appeared comparable to those used by other leading crystalline silicon PV module manufacturers and reasonable for the assembly of crystalline silicon PV modules.
1.5 Manufacturing Process and Quality Assurance
JA Solar uses both manual and automated soldering for attaching ribbons to cells and connecting cells together into strings. Many Chinese module manufacturers with which Black & Veatch is familiar use manual soldering only.
Black & Veatch observed each step of the manufacturing process for the Modules. The module manufacturing process was consistent with accepted industry practice for the production of solar PV modules of this type.
During its August 8 and 9, 2011 visit to the JA Solar module assembly facility, Black & Veatch observed multiple excursions from JA Solar’s specified processes for manufacture of the Modules. These excursions are described in greater detail in the body of the report. On its subsequent visit on October 31, 2011, Black & Veatch noted that the excursions observed during the August visit had largely been corrected and that the control of the manufacturing process had been improved.
The number of quality checkpoints and inspection steps in JA Solar’s manufacturing process is similar to the checkpoints and inspections observed in manufacturing processes used by other solar PV module manufacturers.
JA Solar conducts certain periodic tests to sample the quality of certain process steps (e.g., solder pull tests every four hours). As of the August factory visit, JA Solar indicated that it would ship Modules even if they were produced during a period affected by a failed quality sampling test. During the subsequent October visit, JA Solar indicated that it will now quarantine affected Modules and will not ship them to customers until further testing had been completed. Black & Veatch considers this change to be a substantial improvement in JA Solar’s quality management practices.
JA Solar shared with Black & Veatch its process for qualifying suppliers and for periodic assessment of its suppliers. Black & Veatch believes that these processes are consistent with accepted industry practices.
1.6 Quality Organization and Processes
Black & Veatch found JA Solar’s quality management organization to be well‐staffed and reasonably experienced in managing manufacturing quality in volume manufacturing environments.
JA Solar Hong Kong Limited Solar Module Due Diligence 1 Executive Summary
April 12, 2012 1‐4 Black & Veatch
JA Solar has in place reasonable processes for training manufacturing personnel, maintaining equipment, controlling documentation and tracking key performance indicators.
JA Solar’s reported rate of turnover for direct labor is higher than what Black & Veatch has been informed of by other solar PV module assembly organizations in China. This may lead to higher recruiting and training costs to JA Solar and may require greater effort to maintain the same level of quality.
JA Solar’s product tracking and serialization practices use a combination of computer based systems and paper records. Black & Veatch finds that this system will store all the data that could possibly be needed only if the paper records are preserved but could require greater effort to extract the necessary information when compared to best‐in‐class computer based systems. JA Solar indicated that is transitioning to a fully computer based system.
1.7 Module Performance
Black & Veatch reviewed four months of operating data for a 20 MW Project in Italy built using JA Solar Modules. Black & Veatch found that the Project’s power loss due to temperature reasonably agreed with the Module datasheet, the Project demonstrated reasonable low light performance and the Project generally performed as expected over the period.

JA Solar Hong Kong Limited Solar Module Due Diligence 2 Introduction
April 12, 2012 2‐1 Black & Veatch
2. Introduction
2.1 Scope of Work
To conduct this due diligence review, Black & Veatch provided the following services:
Reviewed the background of JA Solar to provide context for this technology due diligence
Reviewed the Module designs and components. Assessed available durability and reliability information on the Modules Visited JA Solar’s module assembly facility twice to assess the manufacturing
of and quality assurance for the Modules. Reviewed available information on the Modules’ performance.
The primary objective of this report (Report) is to opine on factors that would affect the Modules’ performance and longevity in the field and JA Solar’s ability to deliver and service the Modules. Such factors would include the Module designs, quality of materials, performance in field, environmental tests, and the manufacturing and quality control processes. Black & Veatch is uniquely qualified to conduct this study due to its extensive background and experience in solar independent engineering and technology due diligence work. 2.2 Approach and Methodology
The Black & Veatch team, comprised of professionals with experience in solar module manufacturing, solar power plant performance, and supporting engineers, reviewed data provided by JA Solar to assess the status and performance of the technology and conducted visits to the JA Solar module assembly facility in Shanghai, China in August and October 2011. Data requests for additional or updated documentation were submitted as necessary. 2.3 Assumptions
During the assessment of this technology, Black & Veatch used and relied upon certain information provided by JA Solar. Black & Veatch believes the information provided by JA Solar is true and correct and reasonable for the purposes of this Report. Black & Veatch has not been requested to make an independent analysis, to verify the information provided to us, or to render an independent judgment of the validity of the information provided by others. As such, Black & Veatch cannot, and does not, guarantee the accuracy thereof to the extent that such information, data, or opinions were based on information provided by others. In preparing this Report and the opinions presented herein, Black & Veatch has made certain assumptions with respect to conditions that may exist, or events that may occur in the future. Black & Veatch believes that the use of this information and assumptions is reasonable for purposes of this Report. However, some events may occur or circumstances change in ways that cannot be foreseen or controlled by Black & Veatch and that may render these assumptions incorrect. To the extent that the actual future conditions differ

JA Solar Hong Kong Limited Solar Module Due Diligence 2 Introduction
April 12, 2012 2‐2 Black & Veatch
from those assumed herein, or provided to Black & Veatch by others, the actual results will differ from those that have been forecast in this Report. This Report summarizes Black & Veatch’s assessment of the technology. Throughout this Report, Black & Veatch has stated assumptions and reported information provided by others, all of which were relied upon in the development of the conclusions of this Report.

JA Solar Hong Kong Limited Solar Module Due Diligence 3 Company Background
April 12, 2012 3‐1 Black & Veatch
3. Company Background
Black & Veatch performed a brief review of the company history and management team for JA Solar. This review provides the commercial context for the technical sections to follow. 3.1 JA Solar Company Background
JA Solar is a publicly traded company (NASDAQ: JASO), specializing in the manufacturing of silicon wafers, solar cells and solar modules. JA Solar reports that it currently has approximately 3,800 full time employees. Its revenues in 2011 were US$1.7 billion and total assets at Q1 2012 were US$2.3 billion. Black & Veatch was informed that the company was initially formed in 2005 under the name Jing Ao Solar Company Ltd. JA Solar first began commercial solar cell production in April 2006 and has grown to be one of the largest manufacturers of solar cells in the industry. JA Solar was publicly listed on the NASDAQ in February 2007, and established its global headquarters in Shanghai in December of the same year. The manufacture of PV modules is a relatively new business for JA Solar as JA Solar started manufacturing “white label” modules for its customers as an additional service in Q4’09. Sales of PV modules have grown to 56% of revenue in Q4 2011, up from 21% of JA Solar’s 2010 revenues. The remainder of its revenues were derived from the sale of PV cells to other module companies. JA Solar has indicated that it operates under a vertically integrated manufacturing system, with silicon wafers, solar cells and solar modules being produced at separate facilities throughout China. Its first manufacturing facility in Ningjin, Hebei Province, is a solar cell manufacturing facility with a capacity of 900 MW. JA Solar has a second solar cell facility at Yangzhou, Jiangsu Province, with 1,200 MW capacity, as well as a dedicated research and development center. JA Solar has a silicon wafer facility located in Lianyungang, Jiangsu Province (300 MW), and a solar module assembly facility in Fengxian, Shanghai. The Fengxian module assembly had 500 MW of capacity at the end of 2010 and is planned to have 1,200 MW of capacity at the end of 2011. JA Solar is currently building an additional campus in Hefei, Anhui Province, China where additional wafer, cell and module manufacturing will take place. Black & Veatch was informed that through its research and development programs at the Yangzhou Solar Cell Facility, JA Solar has been able to produce cells with conversion efficiencies of 18% (mono‐crystalline cells) and 16.8% (multi‐crystalline). This research facility has also allowed the development of a high efficiency range of cells, the Secium and Maple cells, with 18.9% and 18.2% conversion efficiency. JA Solar reports that sales of its cells were initially strongest in the Chinese market, making up 64% of total sales in Q1 2010. However, growth in international sales has reduced the internal (China) share to 50% of total shipments in Q1 2011, with Europe (35%) and the USA (9%) making up the majority of the international market. This international expansion has coincided with the establishment of sales offices in the Silicon Valley, USA, and in Munich, Germany, the latter being JA Solar’s European headquarters.

JA Solar Hong Kong Limited Solar Module Due Diligence 3 Company Background
April 12, 2012 3‐2 Black & Veatch
Black & Veatch believes that since earning a profit for the first time in 2010, JA Solar has shown strong growth, reflected in increasing shipments and revenues. JA Solar shipments increased from 1.46 GW to 1.69 GW (16% increase) from 2010 to 2011. JA Solar held revenues relatively flat during this challenging period for module average selling prices. 3.2 JA Solar Management Team
Black & Veatch has learned that JA Solar’s senior management team is comprised of professionals with extensive backgrounds in the energy industry. Some highlights of the executive team’s experience in these disciplines include:
Baofang Jin, the Executive Chairman, has been the Chairman of the JA Solar Board of Directors since the company’s establishment in May 2005. Previously, he was Chairman of the Board of Directors and CEO of the Jinglong Group, China’s largest mono‐crystalline wafer manufacturer, and has over 15 years of semiconductor wafer manufacturing experience. Mr. Baofang Jin was also the Vice‐Chairman of the National People's Congress, Chinese People's Political Consultative Conference of Ningjin County.
Dr. Peng Fang is the Chief Executive Officer and a Board Director of the JA Solar Board of Directors. He is the former president of Huahong NEC, and winner of the Shanghai Magnolia Prize. Dr. Peng Fang is a Board Director of UCGEC, was chairman of the IEEE Electron Devices Society and has had various technology and management positions at Applied Materials and AMD in the United States.
Jian Xie is the Chief Operating Officer and a Board Director of the JA Solar Board of Directors. Mr. Xie has served in such capacities as the company's Director of Corporate Finance, Director of Investor Relations, Assistant to the Chief Executive Officer, Secretary of the Board of Directors and Vice President of Sales.
Yong Liu is the Chief Technology Officer and a Board Director of the JA Solar Board of Directors. Yong Liu has over 15 years experience of operation management experience at semiconductor wafer and solar cell manufacturing facilities.
Ming Yang, Vice President of Investor Relations and Business Development, has over 6 years experience working as a Wall Street buy side and sell side analyst, specializing in the renewable energy and semiconductor materials sectors. Ming Yang is also a former VP at Piper Jaffray.
Yong Jiang, VP of Module Division, has 15 years of experience in semiconductor and solar manufacturing. Mr. Jiang has worked in the solar industry since 2008 as the VP of Operations at Best Solar and as the General Manager of the module division of LDK Solar.
Jonathan Pickering, President of JA Solar, Americas Region and Vice President of JA Solar, has over 20 years of experience in the solar and semiconductor industries. Most recently he was General Manager and Executive Vice President of Lumeta Inc. where he led the development and commercialization of Lumeta’s PowerPly solar module designed for commercial rooftop applications. He was responsible for all aspects of the Lumeta business, including establishing partnerships with leading

JA Solar Hong Kong Limited Solar Module Due Diligence 3 Company Background
April 12, 2012 3‐3 Black & Veatch
solar project developers and integrators in the U.S. and in Europe. Prior to joining Lumeta, Mr. Pickering spent twenty years with Applied Materials, a leading capital equipment provider for the semiconductor, display and solar industries, where he served as Vice President and Head of Global Marketing and Business Development of the Solar Business Group. He holds a Master of Engineering from Carnegie Mellon University and a Bachelor of Science from the University of Surrey.
Black & Veatch finds that the senior leadership of JA Solar has extensive relevant experience in the semiconductor manufacturing and solar industries.

JA Solar Hong Kong Limited Solar Module Due Diligence 4 Module Design and Components
April 12, 2012 4‐1 Black & Veatch
4. Module Design and Components
Black & Veatch conducted a detailed review of the Module designs and bill of materials. Design and components can significantly impact product lifetime and long‐term durability and reliability. This section highlights Black & Veatch’s findings on design and components.
4.1 Module Design and Specification
Black & Veatch reviewed four monocrystalline Modules: JAM 5(L), JAM 5(L) Secium, JAM6‐60, and JAM6‐60 Secium. The JAM 5(L) Module incorporates 72 monocrystalline cells. Each cell measures 125 x 125 mm. The cells are connected in six strings of 12 cells each and the strings are connected in series. The main difference between the Modules is the type of cell that is used. The Secium cells are monocrystalline cells that may incorporate a selective emitter structure to enhance the cells’ spectral response. Black & Veatch did not review the Secium solar cell design nor the technology used to manufacture it. The non‐Secium Module utilizes screen‐printed monocrystalline cells without a selective emitter. The specified Module output for the JAM 5(L) is 155 to 195 W, while the JAM 5(L) Secium provides 180 to 215 W. Similarly, the JAM6‐60 Secium is specified as providing a higher output range (235 to 265 W) than the JAM6‐60 (200 to 250 W). Black & Veatch also reviewed four polycrystalline Modules: JAP6 – 60, JAP6‐60 Maple, JAP6‐72 and JAP6‐72 Maple. The former two Modules incorporate 60, 156 mm polycrystalline solar cells. The cells are connected in six strings of 10 cells each and the strings are connected in series. The latter two Modules have 72 cells distributed into 6 strings with 12 cells each. JA Solar indicated that the difference between the Maple Modules and the non‐Maple Modules are the types of solar cells used in the Module. The Maple cells are produced by a seeded directional solidification technology that produces wafers that contain some features of polycrystalline silicon and others of monocrystalline silicon. Black & Veatch did not review the Maple solar cell design nor the technology used to manufacture them. The Module output for the JAP6 – 60 is stated as 200 to 250 W, while the JAP6‐60 Maple is specified to provide 220 to 265 W. Similarly, JA Solar claims that the JAP6‐72 Maple provides a higher output range (270 to 320 W) than the JAP6‐72 (250 to 295 W). The Modules vary in size from 1.28 m2 for the JAM 5(L) to 1.95 m2 for the JAP6‐72. The Module specifications and design is similar to that of other major solar Module manufacturers. Black & Veatch conducted a detailed visual inspection of a JA Solar Module and did not observe any aspect of the Module that would impede it from meeting the technical specifications claimed by JA Solar.

JA Solar Hong Kong Limited Solar Module Due Diligence 4 Module Design and Components
April 12, 2012 4‐2 Black & Veatch
Figure 41. JA Solar 72Cell Polycrystalline Silicon Module
Black & Veatch reviewed the operating characteristics of the JAP6‐72 Module and compared them to those of the 280W module produced by Suntech. Suntech was chosen as a benchmark because it is the world’s largest producer of crystalline silicon solar PV modules. Table 4‐1 shows a comparison of the major operating characteristics of these modules. The JAP6‐72 Module is in a similar range for maximum power point voltage, current. The power tolerance of both the JA Solar and Suntech modules is 0/+5 Watts.
Table 41. Comparison of JA Solar and Suntech 280W Modules
JA Solar Suntech
Part number JA6‐72 STP‐ 280‐24/Vd
Peak Power (Pmax,Watts) 280 280
Power Tolerance (Watts) 0/+5 0/+5
Max Power Voltage (Vmp) 36.75 35.2
Max Power Current (Imp) 7.62 7.95
Open Circuit Voltage (Voc) 44.40 44.8
Short Circuit Current (Isc) 8.32 8.33
Source: Product datasheets The product datasheets list the remaining major operating characteristics and specifications of the JAP6‐72 solar Module. Black & Veatch believes that the nominal power temperature coefficient of ‐0.42 percent is in line with expectations for a polycrystalline silicon solar module. The operating temperature range from ‐40 °C to 85 °C is appropriate for most locations and installation configurations in North America. The maximum operating voltage of 1000V is consistent with other manufacturers and appropriate for utility‐scale systems. The ribbon used for tabbing and stringing is made of soft copper. Black & Veatch notes that soft copper ribbons are widely used in the solar PV industry but several module manufacturers favor ultrasoft copper ribbons with tensile strengths below 100 N/mm2 and elongation at fracture on the order of 25%. JA Solar has indicated that it does not specify the maximum tensile strength of its ribbon. Black & Veatch notes that softer copper ribbons (<200 N/mm2) tend to reduce cell breakage during manufacturing and reduces stress on cells and solder joints due to temperature variations during field operations. The ribbon has a tin‐lead coating that is a few microns thick. The coating is meant for good metallurgical contact between the ribbon and the cell busbar. The ribbons are attached to the entire length of the front cell busbar using either manual or automated soldering. In

JA Solar Hong Kong Limited Solar Module Due Diligence 4 Module Design and Components
April 12, 2012 4‐3 Black & Veatch
order to further reduce stress on the cells in the field due to temperature variations, Black & Veatch suggests considering the advantages of using discrete solder points instead of a continuous solder bead along the entire front cell busbar. The Module front glass is 3.2 mm thick, and comprised of low iron, tempered glass. The front glass is textured on the side that faces the cells. The glass is purchased from Chinese suppliers. Black & Veatch was informed that three different backsheets are used in the Modules in question. Two of the backsheets incorporate a polyvinylfluoride (PVF) film that is bonded to a polyester (PET) film, which in turn is bonded to an ethylvinylacetate (EVA) film. Black & Veatch was informed that the third backsheet has a PET/PET/EVA composition. JA Solar shared with Black & Veatch its list of approved backsheet vendors for Modules certified to the IEC 61215 and UL 1703 standards. These backsheets are used interchangeably by JA Solar to meet specific client requests for its Modules. The backsheets are made by well‐known US and European suppliers. The Module assembly is held in place by cross‐linked, fast‐cure EVA. The EVA is purchased from a US supplier. Lamination of the Module assembly takes place in laminating equipment made in China. A junction box is adhered to the Module back sheet. Several junction boxes are used depending on the Module type. The junction boxes are made by Chinese and US manufacturers. The junction boxes have an ingress protection (IP) rating of 65. An IP65 rating indicates that water sprayed from a 6.3mm diameter nozzle from any direction for at least three minutes will not have any harmful effect on the electronics inside the junction box. While IP65 junction boxes are commonly used in the solar PV industry, Black & Veatch believes an IP67 junction box could enhance the reliability of the Modules. IP67 junction boxes offer protection against water ingress when immersed in up to one meter of water for thirty minutes. JA Solar has indicated that it is transitioning to IP67 junction boxes as soon as possible. Several other module manufacturers employ IP67 junction boxes. The junction box contains the provisions for electrical connections from the cells to external wires and the bypass diodes. The diodes and leads coming from the cell strings are held in place in the junction box terminals by pressure contacts and are neither crimped nor soldered. Black & Veatch does not have experience with this type of connector in a PV module. The junction box is not potted. Not potting the junction box is common among Chinese PV module manufacturers. Black & Veatch suggested that JA Solar consider the advantages of using a pottant with good thermal conductivity and dielectric properties to enhance heat dissipation in the event of diode overheating and to protect against moisture ingress into the junction box. JA Solar has indicated that it is transitioning to potting its junction boxes as soon as possible. Extruding from the junction box are two TUV‐approved solar cables (4.0mm2 cross section) with TUV‐approved connectors. In some Module configurations the connectors are MC4‐compatible, while in others they are not. The Module is surrounded by an anodized aluminum extruded frame that is held in place by RTV. Black & Veatch is aware of the use of quick set adhesives by other module

JA Solar Hong Kong Limited Solar Module Due Diligence 4 Module Design and Components
April 12, 2012 4‐4 Black & Veatch
manufacturers and suggested that JA Solar consider replacing RTV in this function. JA Solar has indicated that it is transitioning to quick set adhesives as soon as possible. 4.2 Supply Chain and Major Components
During its August 2011 visit to JA Solar, Black & Veatch reviewed a partial bill of materials with the list of vendors supplied by JA Solar which is summarized in Table 4‐2. The suppliers for key components such as connectors, EVA, glass, junction box, and back sheet include some leading suppliers with long track records as well as some lesser‐known or less‐established suppliers.
Table 42. JA Solar Approved Vendors for Selected Module Materials
Module Component Number
of Suppliers Country of Origin
EVA 1 USA
Glass (tempered) 3 China
Junction box 6 China, USA
Back sheet 3 USA, Italy
Notes: Although Black & Veatch did review specific suppliers, names of specific suppliers were not listed as it was considered sensitive information.
Black & Veatch was briefed on the supplier selection process performed by JA Solar. The supplier selection process is based on a detailed procedure developed by JA Solar. A monthly review of suppliers is performed. Black & Veatch believes that the supplier selection and monitoring process conforms to accepted industry practices.

JA Solar Hong Kong Limited Solar Module Due Diligence 5 Durability and Reliability
April 12, 2012 5‐1 Black & Veatch
5. Durability and Reliability
5.1 Certifications and Standards
JA Solar has tested the Modules to the solar industry standards shown in Table 5‐1. In particular, Black & Veatch notes that most of the Modules have passed the IEC 61215 qualification testing. This standard is accepted by the PV industry as a suitable qualification test to give a baseline indication of a crystalline silicon PV module’s capability to survive in the field.
Table 51. Qualification Testing
Module Certification
JAM5(L) Secium IEC 61215, 61730 ETL Listed to UL 1703
JAM6‐60 IEC 61215, 61730 UL listed
JAM6‐60 Secium IEC 61215, 61730 ETL Listed to UL 1703
JAP6‐60 IEC 61215, 61730 UL listed
JAP6‐72 IEC 61215, 61730 ETL Listed to UL 1703
JAP6‐60 Maple IEC 61215, 61730 ETL Listed to UL 1703
Source: Product datasheets and testing certificates provided by JA Solar. Note: ETL Listed indicates testing to UL 1703 standard performed by Intertek and not UL.
The key Module certifications are described in greater detail below. 5.1.1 IEC 61215
IEC standard 61215 establishes the IEC requirements for the design qualification and approval of crystalline silicon PV modules. The objective of this test sequence is to determine the electrical and thermal characteristics of the module and to show, as far as is possible within reasonable constraints of cost and time, that the module is capable of withstanding prolonged exposure in climates described in the scope. The actual lifetime expectancy of modules will depend on their design, their environment and the conditions under which they are operated. IEC 61215 includes tests that are designed to reveal reliability concerns in crystalline silicon modules. Three of the most stringent tests are thermal cycling, which exposes the modules to 200 cycles in which the temperature varies from ‐40° C to +85° C; humidity freeze in which the modules experience 10 temperature cycles from +85° C (with 85
JA Solar Hong Kong Limited Solar Module Due Diligence 5 Durability and Reliability
April 12, 2012 5‐2 Black & Veatch
percent relative humidity) to ‐40° C; and damp heat, where the modules are held for 1000 hours at +85° C (with 85 percent relative humidity). Moisture penetration into the module is one of the reliability issues that are exposed by these tests, particularly the damp heat test. Moisture can eventually lead to module failure due to events such as the delamination of the back sheet, electrochemical corrosion of the solder joints and increase in the contact resistance at solder points and electrodes. Similarly, IEC 61215 includes tests to verify the resistance of the module to breakage of the glass under load or hail impact, junction box failure, robustness of the wires and connectors, among other potential failure modes. Experience has shown that a module design that receives IEC 61215 certification is very likely to perform adequately in the field. 5.1.2 IEC 61730
IEC 61730 is the internationally accepted safety standard for PV Modules. This standard will supersede UL 1703 within the United States. There are two parts to IEC 61730 and a brief description of each is found below. IEC 617301: Requirements for Construction IEC 61730 Part 1 addresses the fundamental construction requirements for PV modules. It is designed to provide safe mechanical and electrical operation during the expected lifetime of the PV module. It also aims to prevent electrical shock, fire hazards, and personal injury resulting from mechanical and environmental stresses. Part 1 pertains to construction requirements and is to be used in conjunction of IEC 61646. IEC 617302: Requirements for Testing IEC 61730‐2 describes the testing requirements for PV modules in order to provide safe electrical and mechanical operation during their expected lifetime. PV modules are assessed for the prevention of electrical shock, fire hazards, and personal injury due to mechanical and environmental stresses. 5.1.3 UL 1703
UL 1703 is the standard for safety for flat‐plate PV modules most often cited in the US. This standard assesses the safety performance of construction, materials and the manufacturing process of flat‐plate PV modules. Black & Veatch notes that some Modules were tested to the UL 1703 standard by Underwriters Laboratories, Inc. (UL) and others were tested by Intertek Group plc (Intertek). UL is a Nationally Recognized Testing Lab as designated by the United States Department of Labor. Intertek is a global provider of quality and safety solutions and is recognized by the Occupational Safety and Health Administration (OSHA) as a Nationally Recognized Testing Laboratory (NRTL). As an NRTL, Intertek is qualified to perform safety certification testing for products to be used in the U.S. Modules which were tested to the UL
JA Solar Hong Kong Limited Solar Module Due Diligence 5 Durability and Reliability
April 12, 2012 5‐3 Black & Veatch
1703 standard by UL are described as “UL Listed” and Modules tested by Intertek to the same standard are described as “ETL Listed.” The following are requirements of UL 1703, third edition:
Temperature Test. Voltage, Current and Power Measurement Test. Leakage Current Test. Strain Relief Test. Push Test. Bonding Path Resistance Test. Dielectric Voltage Withstand Test. Wet Insulation‐Resistance Test. Reverse Current Overload Test. Impact Test (Wiring Compartment). Fire Test (Class C). Water Spray Test. Temperature Cycling Test. Humidity Test. Hot Spot Endurance Test. Mechanical Loading Test.
5.2 Warranty and Warranty Claims
JA Solar’s peak power warranty currently warrants that its Modules will provide no less than 90 percent of their peak power at STC for up to 10 years, and no less than 80 percent of their peak power at STC for up to 25 years. JA Solar also offers a 10 year warranty against workmanship defects. Black & Veatch believes that these warranty terms are currently common in the PV industry. JA Solar has indicated that warranty insurance coverage is available for its Modules at additional cost. Black & Veatch has not reviewed the warranty insurance program. JA Solar indicated that it has not yet received any claims under the peak power warranty. In the event that a warranty claim or customer return is needed, JA Solar has indicated the following process for such a return.

JA Solar Hong Kong Limited Solar Module Due Diligence 5 Durability and Reliability
April 12, 2012 5‐4 Black & Veatch
Figure 51. Flow Diagram of JA Solar Customer Return Process
5.3 Changes in Module Performance Over Time
Power degradation of crystalline silicon solar PV modules commonly happens in two phases. There is first a rapid power degradation, commonly called Light Induced Degradation (LID) that takes place in the first few days of a module’s exposure to sunlight. The rate of degradation then levels off and the module continues to degrade at a less severe rate for the remainder of its life (the long term degradation rate). 5.3.1 Light Induced Degradation (LID)
JA Solar presented Black & Veatch with the results of measurements to determine short term degradation (commonly known as Light Induced Degradation or LID). The results of these measurements are summarized in Table 5‐2. Black & Veatch did not review the test protocol, methodology or the test data.

JA Solar Hong Kong Limited Solar Module Due Diligence 5 Durability and Reliability
April 12, 2012 5‐5 Black & Veatch
Table 52. JA Solar Light Induced Degradation Measurements
Module LID
JAM5(L) Secium 3.91%
JAM6‐60 2.90%
JAM6‐60 Secium 2.79%
JAP6‐60 1.36%
JAP6‐72 N/A
JAP6‐60 Maple 2.96%
Note: LID provided after 60 kWh of cumulative illumination
5.3.2 Long Term Degradation
As the Modules are relatively new products, JA Solar was unable to provide Black & Veatch with long term degradation data for the Modules. In the absence of degradation data from the manufacturer, Black & Veatch typically gives guidance for an annual long term degradation rate of 0.7 percent range for polycrystalline silicon modules 0.8 percent for monocrystalline. The degradation rate varies depending on temperature ranges, humidity, and irradiation at the site. Black & Veatch’s degradation guidance is based on publicly available data regarding the degradation of crystalline silicon modules and is described in detail in Appendix A. Table 5‐3 summarizes the estimated JAP6‐72 Module degradation rate.
Table 53. Estimated Degradation for the JAP672 Module
Year 1 Year 2 Year 3 …. Year 25
Short term degradation (LID) 1.36*
Long‐term degradation 0.7 0.7 0.7 … 0.7
Total Module Degradation (%) 2.06% 0.7 0.7 … 0.7
Notes: Degradation should be applied year over year. For example, the Year 2 degradation rate should be applied to the end of Year 1 degraded capacity. * LID rates are based on data provided by JA Solar summarized in Table 5‐2. LID for JAP6‐72 assumed to be same as JAP6‐60

JA Solar Hong Kong Limited Solar Module Due Diligence 6 Manufacturing Facilities
April 12, 2012 6‐1 Black & Veatch
6. Manufacturing Facilities
Black & Veatch made two visits to JA Solar’s module assembly facility in the Fengxian District of Shanghai, China. JA Solar personnel described the facilities and expansion plans for the sites. Black & Veatch witnessed the manufacturing process for the Modules which will be described in greater detail in the next section of the Report. JA Solar also has a wafer production facility in Jiangsu Province and cell production facilities in Hebei and Jiangsu Provinces. Black & Veatch did not visit these additional facilities as they were not in the scope of this Module assembly review. 6.1 Fengxian Module Assembly Facility
JA Solar’s Fengxian Module Assembly Facility is 200,000 m2 in size and is located in Shanghai, China. JA Solar claims that the facility had annual manufacturing capacity of 500 MW at the end of 2010 and planned to expand capacity to 800 MW by the end of 2011. The facility’s location is logistically advantageous as it is close to the Port of Shanghai, enabling shipping to customers around the world. Black & Veatch visited the Fengxian Module Assembly Facility on August 8 and 9, 2011. Black & Veatch personnel were shown the administrative area, the warehouse and one of three Module assembly plants currently in operation. The facility appeared well‐maintained and JA Solar personnel indicated that it has both space on the site and facilities (e.g., electricity, water, compressed air) to accommodate the planned expansion. Black & Veatch visited the facility again on October 31, 2011. During this second visit, Black & Veatch personnel revisited the first Module assembly plant and toured a second Module assembly plant.
Figure 61. Illustration of JA Solar’s Fengxian Module Assembly Facility

JA Solar Hong Kong Limited Solar Module Due Diligence
7 Manufacturing Process and Quality Assurance
April 12, 2012 7‐1 Black & Veatch
7. Manufacturing Process and Quality Assurance
Black & Veatch made two visits to the Fengxian Module Assembly Facility with JA Solar personnel to witness the Module assembly process and in‐process quality checkpoints. Black & Veatch found the assembly process to agree with established industry practice. Black & Veatch noted that the number and frequency of quality checkpoints also agreed with established industry practice. During the first visit, Black & Veatch observed several excursions from the documented process which could affect product quality. During the second visit, Black & Veatch observed that the excursions had largely been resolved and that control of the manufacturing process appeared to have improved. The excursions observed during the August site visit, as well as the status of each excursion during the October visit are summarized in the table below. Many of these issues appeared to be resolved as of Black & Veatch’s October site visit:
Table 71. Observed Process Excursions and Resolution
Description Aug 2011 observation Oct 2011 observation or resolution
Solder temperatures out of specification
At the workstations where two pieces of ribbon were being soldered together at right angles to form the Module busbars, a spot check performed by Black & Veatch of the solder temperatures showed that both workstations were out of specification. Additionally, it took quite a bit of time for quality assurance staff to find a calibrated tool for measuring the temperature of the solder tip and there was no record of any earlier temperature measurement for the day of Black & Veatch’s visit. This suggests that the solder tip temperatures were not being verified every two hours as stated in the process specification.
Numerous solder temperatures were spot‐checked and only one was out of the specified range. The Quality Assurance department immediately shut down the process step which was out of the specified range to address the problem and indicated that all modules subject to this process step would be quarantined for further assessment. Checks of measurement logs suggested that solder temperatures were consistently being monitored at the solder stations.
EVA left in open air
Black & Veatch saw a large shipment of EVA in a section of the warehouse that was hot and humid. JA Solar personnel indicated that EVA is supposed to be moved to a temperature and humidity controlled section of the warehouse within 10 minutes of arrival. Black & Veatch learned
JA Solar shared information from the EVA supplier indicating that the EVA may be stored for up to 6 months at less than 40 °C and ambient humidity conditions. This indicates that while the receiving of the EVA did not comply with internal procedures, no harm was likely done to the EVA.

JA Solar Hong Kong Limited Solar Module Due Diligence
7 Manufacturing Process and Quality Assurance
April 12, 2012 7‐2 Black & Veatch
Table 71. Observed Process Excursions and Resolution
Description Aug 2011 observation Oct 2011 observation or resolution
that this batch of EVA had been sitting in the wrong section of the warehouse since the day before (much longer than 10 minutes).
Cardboard close to EVA preparation
Cardboard boxes were being torn open and discarded in close proximity to the EVA preparation station. This could cause cardboard particulate to contaminate the EVA and end up in a PV Module.
Removal of the EVA rolls from the cardboard boxes had been moved to a separate area to minimize this risk of contamination.
Silicone curing temperature out of specification
After silicone is applied to the frame and the junction box, the Modules are held in a temperature and humidity controlled room to partially cure before additional handling. Black & Veatch observed that the temperature of the curing area was 19 °C which is outside the JA Solar specification of 25±2 °C. This could lead to the silicone not being sufficiently cured before additional handling of the Module. This in turn could increase failures in the field due to less robust adhesion at the frame and junction box.
Black & Veatch observed that the specification had changed to 20°C or greater and reviewed logs indicating that this requirement had been met during each of the four daily measurements for the past two days.
During the August site visit. Black & Veatch noted the following opportunities for process improvements:
Formation of L‐shaped Module busbar‐ JA Solar solders two lengths of ribbon together to achieve an L‐shaped busbar. Black & Veatch notes that an accepted industry practice is to fold a single, continuous piece of ribbon to achieve the right angle and avoid the solder junction. During the second site visit, JA Solar indicated that it was currently evaluating this alternate solution.
Frequency of soldering tip replacement – During the visit to the manual soldering area Black & Veatch was informed that the soldering iron tips are replaced every two weeks. JA Solar has since indicated that it has increased the frequency of solder iron tip changes to once every week. Black & Veatch believes that the operator should be trained to identify when a soldering iron tip is no longer adequate and should be able to replace the soldering iron tip at that time.
Pre‐formed ribbon for automatic solder ‐ Black & Veatch believes that cell breakage might be decreased by utilizing a pre‐formed ribbon which

JA Solar Hong Kong Limited Solar Module Due Diligence
7 Manufacturing Process and Quality Assurance
April 12, 2012 7‐3 Black & Veatch
incorporates a step (bend in ribbon) to ease the mechanical stress on the cells as they are strung together in electrical series interconnection.
Discontinuous solder ‐ Black & Veatch believes that cell breakage might decrease by soldering the ribbon to the cell at discrete points as opposed to soldering the entire length of the cell.
Pre‐laminate placement in laminator – Black & Veatch was informed that the standard operating procedure for lamination does not include specifications for the placement of the pre‐laminates in the laminator. During the second site visit, Black & Veatch observed that guides had been implemented to aid the repeatable placement of the pre‐laminates. Black & Veatch believes that the repeatability of the pre‐laminate placement is important to ensure consistent laminate quality.
Cold‐knife material trimming ‐ Black & Veatch suggests trimming excess EVA and backsheet material with a hot knife to reduce the stress impressed by the cutting action on the edge of the Module.
Quick‐cure adhesive ‐ Black & Veatch recommends an alternative framing encapsulant with a shorter cure time and higher viscosity which does not ooze from the frame. The current silicone adhesive requires time‐consuming manual cleaning before and after a 20‐hour cure period.
Module packaging ‐ Black & Veatch finds JA Solar’s packaging of the Modules to similar to the packaging used by many other Chinese PV module manufacturers. Black & Veatch notes that the volume of cardboard used in the packaging may cause disposal issues for its customers in the field. Black & Veatch encourages JA Solar to explore alternative packaging schemes which use less material.
Junction box pottant ‐ The junction box is not potted. Not potting the junction box is common among Chinese PV module manufacturers but Black & Veatch believes that filling the junction box with an appropriate material could reduce the possibility of moisture ingress, improve thermal conductivity and relieve the mechanical stress on the diodes and busbar loops. JA Solar has indicated that it is transitioning to potted junction boxes as soon as possible.
Box cutter use during Module cleaning ‐ In one of the final steps, excess silicone was removed from the front of the Module where it may have been squeezed out of the frame. Using a box cutter to remove this excess silicone may result in cutting silicone out from under the frame which can increase the likelihood of moisture ingress in the field. During the second site visit, Black & Veatch observed that the box cutter had been replaced with a plastic tool which was too dull to slip between the frame and the glass, thereby minimizing the risk of cutting the adhesive out from under the frame.
Insulation patch – Black & Veatch observed that a section of backsheet material is used as an electrical insulator to insulate the Module busbar ribbons from the back of the solar cells. This section of backsheet material is laminated between two sheets of EVA. Black & Veatch believes that the backsheet material being used is not designed to be laminated between two sheets of EVA. During the second site visit, JA Solar indicated that it was evaluating an EPE insulating patch which is designed to be laminated to EVA on both sides.
Frame is pressed together but not crimped – The four frame members are held in place using silicone adhesive and a corner key. Black & Veatch observed that the corner key is installed in the short members of the frame by the frame supplier, but the long frame members are not crimped to the corner key. Black &

JA Solar Hong Kong Limited Solar Module Due Diligence
7 Manufacturing Process and Quality Assurance
April 12, 2012 7‐4 Black & Veatch
Veatch believes that the frame may have a higher likelihood of meeting its durability expectations if the long frame members are crimped at the corner key.
Personnel safety measures ‐ Black & Veatch identified several measures which JA Solar should consider implementing to improve the safety of personnel in the production area. These measures are described in detail below.
7.1 Overview
Black & Veatch performed a detailed review of two of the three operations JA Solar Module assembly plants at Fengxian. The lines were well equipped and organized. Most Module assembly steps correspond to the accepted industry practice. The JA Solar Module manufacturing process, as shown in Figure 7‐1, is typical for crystalline silicon modules and incorporates multiple quality control steps. Assembly process steps are shown in blue rectangles and quality inspection steps are shown in green hexagons.
Material storage &
prep
Incoming inspection
Tabbing & stringing
Layup
Visual inspection
EL visual inspection
Lamination
Frame sealant applied
Junction box installation
Module cure(6‐8 hours)
Module cleaning
Electricaltest
Flash test
EL visual inspection
Trim excess material
Busbar soldering
Frame installation
Pack and ship
Figure 71. JA Solar Module Assembly Process Overview
The operators seemed well‐trained to perform the tasks assigned to them. Black & Veatch was briefed on the operator training program in place at JA Solar (see Section 8‐2 on training below). Representatives of the quality assurance organization were present throughout the manufacturing line. Black & Veatch observed that work instructions and photos of right/wrong operations were posted at the stations for each process step. All incoming material is subject to inspection prior to being released to manufacturing.
7.1.1 Incoming material inspection
Black & Veatch was informed that all incoming materials and components are inspected in accordance with an established procedure for each material and component. For example, EVA is subject to visual inspection, measurement of the physical dimensions, and degree of

JA Solar Hong Kong Limited Solar Module Due Diligence
7 Manufacturing Process and Quality Assurance
April 12, 2012 7‐5 Black & Veatch
cross‐linking after lamination. JA Solar did not provide detailed information on the level of sampling used in the incoming inspection. 7.1.2 Material preparation
Black & Veatch observed a material preparation area in which EVA was manually cut from rolls into the correct size for the Modules and lengths of conductive ribbon were soldered together to form the busbars. The process for cutting EVA to the correct lengths appeared to correspond to accepted industry practices. JA Solar indicated that only enough EVA is cut to meet the expected production to prevent preparation of excess EVA. Black & Veatch finds this to be appropriate as EVA must be used within several hours of opening its package. During the first site visit, Black & Veatch observed that cardboard boxes were being opened in close proximity to the EVA preparation which could result in cardboard particulate ending up in the PV Modules. Black & Veatch observed during the second site visit that opening the boxes took place in a separate room to minimize the possibility of contamination. 7.1.3 Solar cell tabbing and stringing
JA Solar uses both automated and manual tabbing and stringing of the solar cells. Tabbing is the soldering of electrically conductive ribbon to the solar cells and stringing is electrically connecting the cells together in series. The machines used for automated tabbing and stringing are supplied by a well‐known supplier to the solar PV industry. Black & Veatch also witnessed manual tabbing and stringing. The cells are placed on a warm plate during the tabbing operation to reduce the thermal stress during this operation. Black & Veatch notes that this is a good practice. Black & Veatch believes that cell breakage might decrease by utilizing a pre‐formed ribbon which incorporates a step (bend in ribbon) to ease the mechanical stress on the cells as they are strung together in electrical series interconnection. Black & Veatch also believes that cell breakage might decrease by soldering the ribbon to the cell at discrete points as opposed to soldering the entire length of the cell. 7.1.4 Layup and busbar soldering
Cell strings are placed on a sheet of EVA that covers the low iron glass. In one of the Module assembly plants observed, the strings are placed by hand, with the assistance of vacuum equipment, and carefully aligned to a template. In the other Module assembly plant visited by Black & Veatch, the strings are automatically placed by the cell tabbing and stringing machine. Busbars are soldered to the strings to provide an electrical path to the junction box (installed later). 7.1.5 Pre‐laminate preparation
A second sheet of EVA and the backsheet are placed over the cell assembly. A visual inspection takes place at this point using a mirror to identify mechanical defects and foreign material in the pre‐laminate assembly. After the visual inspection, the assembly is inspected by means of electroluminescence (EL). EL imaging enables the operator to see defects in the PV cells that can not be observed under normal lighting conditions. Black & Veatch believes that EL is an appropriate inspection technique that is used by leading module manufacturers to reveal electrical defects at this stage.

JA Solar Hong Kong Limited Solar Module Due Diligence
7 Manufacturing Process and Quality Assurance
April 12, 2012 7‐6 Black & Veatch
7.1.6 Lamination
Lamination takes place in laminators manufactured by Orient and BoostSolar. Lamination takes place in a single chamber at high temperature and under pressure. The laminate is then allowed to cool in open air before continuing to the next process step. During the first site visit, Black & Veatch was informed that the standard operating procedure for lamination does not include specifications for the placement of the pre‐laminates in the laminator. Black & Veatch believes that the repeatability of the pre‐laminate placement is important to ensure consistent laminate quality. Black & Veatch observed during the second site visit that guides had been implemented on the laminators to aid in the repeatable placement of the pre‐laminates. Black & Veatch finds JA Solar’s process for lamination to be consistent with accepted industry practice
7.1.7 Trimming
Trimming of excess EVA and backsheet after lamination is done manually with a cold blade. This results in a jagged cut that can compromise the adhesion of the glass, EVA and backsheet layers at the edge of the module. Black & Veatch suggests using a hot knife to reduce the stress impressed by the cutting action on the edge of the Module.
7.1.8 Framing
Silicone adhesive is dispensed automatically into the long members of the frame and manually into the short members of the frame. JA Solar indicated that it plans to transition to fully automated dispensing in the near future. The four frame members are held in place using silicone adhesive and a corner key. Black & Veatch observed that the corner key is installed in the short frame members by the frame supplier but the long members of the frame are not crimped at the corner key. Black & Veatch believes that the frame may have a higher likelihood of meeting its durability expectations if all four frame members are crimped at the corner key.
7.1.9 Junction box Installation
Black & Veatch witnessed that an operator manually applies silicone adhesive to the busbars in the area where they protrude through the back sheet. Black & Veatch believes that this process corresponds to established industry practice but notes that more care is required to ensure the complete encapsulation of the busbar exit area. Black & Veatch observed at least one instance in which this area was not completely encapsulated. This could present a higher risk of moisture ingress in the field. The junction box is attached to the back of the Module using an automatically‐dispensed silicone adhesive. The junction box is not potted (filled with material). Not potting the junction box is common among Chinese PV manufacturers but Black & Veatch is aware of module designs that fill the junction box with a pottant that is impermeable to moisture, electrically insulating and that has a thermal conductivity that is greater than air. In the case of the JA Solar Modules, the presence of such a pottant could impede moisture from entering the junction box and potentially corroding the electrical contact between the module busbar and the junction box terminal. The pottant also has the potential to relieve mechanical stress at that joint and offers the possibility of reducing the operating

JA Solar Hong Kong Limited Solar Module Due Diligence
7 Manufacturing Process and Quality Assurance
April 12, 2012 7‐7 Black & Veatch
temperature of the diodes. High diode operating temperatures are known sources of diode failure. JA Solar has indicated that it is transitioning to potting its junction boxes as quickly as possible. 7.1.10 Module curing and cleaning
The Modules sit for 6 to 8 hours (depending on adhesive supplier recommendation) in a temperature and humidity controlled area after the installation of the frame and junction box to allow the silicone to cure. This lengthy step could be eliminated if a quick‐set adhesive were to replace the silicone. After the silicone is cured the excess silicone that has oozed out of the frame is removed by means of a blade. Black & Veatch observed during the first visit that excess silicone was removed from the frame using a sharp blade which could cause silicone to be cut out of the frame. The sharp blade has been replaced with a plastic tool which is too dull to fit between the frame and the glass and therefore can not cut the adhesive out from that space. Black & Veatch additionally notes that during the first visit, the temperature of the curing area was observed to be 19 °C which is outside the JA Solar specification of 25±2 °C. This could lead to the silicone not being sufficiently cured before additional handling of the module which could in turn increase failures in the field due to less robust adhesion at the frame and junction box. During the second visit, Black & Veatch observed that the temperature specification had changed to 20 °C or greater and that the records showed compliance with this requirement for each of the four daily measurements taken over the past two days.
7.1.11 Electrical and flash testing
Each Module undergoes a dry hipot test (electrical safety test) prior to flash testing. The dry hipot test station is performed in an open environment which could pose a safety hazard to the operator and others in the area. After the electrical safety test, the Modules are held in one of three temperature controlled rooms for the purpose of ensuring that they are at the correct temperature for flash testing. During the first factory visit, Black & Veatch observed that one of the three rooms was out of the specified range of 25±2°C and that all three were below the nominal 25°C. Black & Veatch observed that all the rooms were within the specification during the second factory visit and that the logs showed compliance with the specification for the past several days. The flash testing occurs on a horizontal Spire tester with a temperature sensor. The flash tester measures the Module temperature and adjusts the measured power of the Module for the measured temperature to obtain the Module power at STC. The flash test results are used to sort the Modules into separate bins by power (275W, 280W, and so on).
7.1.12 EL testing
The Module’s EL image is again analyzed after dry hipot and flash testing. Black & Veatch believes that this is an industry best practice. As stated earlier, EL provides a large amount of information that can identify actual defects, or potential sources of latent defects, in the cells.
JA Solar Hong Kong Limited Solar Module Due Diligence
7 Manufacturing Process and Quality Assurance
April 12, 2012 7‐8 Black & Veatch
7.1.13 Module packaging
Modules are placed vertically on their long edges in a corrugated cardboard box. Black & Veatch notes that the module packaging is similar to the packaging used by many other Chinese module manufacturers. The volume of cardboard in the packaging could cause disposal issues for customers in the field. Black & Veatch encourages JA Solar to explore alternative packaging schemes which use less material.
7.2 Safety
Black & Veatch recommends that JA Solar consider implementing the following measures to improve safety on the work floor:
The flash tester should be enclosed in order to protect persons in the vicinity of the tester from the bright flash.
The hi‐pot tester should be enclosed to prevent the risk of electrical shock during the hi‐pot test.
Everyone on the production floor should wear safety glasses with side shields.
All persons that handle Modules or other heavy items should wear steel toe shoes.
All persons handling unlaminated glass should wear personal protective equipment, such as, Kevlar gloves, sleeves, apron and steel toe shoes.

JA Solar Hong Kong Limited Solar Module Due Diligence 8 Quality Organization and Processes
April 12, 2012 8‐1 Black & Veatch
8. Quality Organization and Processes
Black & Veatch discussed JA Solar’s quality management organization during its visit to the Fengxian facility. Black & Veatch was also briefed on practices in place regarding personnel training, documentation and control, and product serialization. 8.1 Quality Assurance (QA) Organization
JA Solar’s quality assurance organization at the Fengxian facility numbers nearly 300 personnel. The quality assurance staff was divided among the following tasks:
Incoming material quality assurance Outgoing quality assurance Quality system management Customer quality management Process quality assurance Calibration
Black & Veatch found the quality assurance team to be well‐organized and well‐staffed. 8.2 Quality Assurance Facilities
JA Solar’s Quality Assurance lab is co‐located with the Module assembly operations at Fengxian. The lab is used to perform some incoming inspection tests and testing to ensure product durability. Black & Veatch visited the lab and noted that it was well‐equipped with environmental simulation chambers and a variety of specialized equipment for mechanical and electrical tests. During Black & Veatch’s first visit, JA Solar indicated that though periodic quality assurance checks of the in‐line process are conducted, it does not quarantine modules which could have been affected by any excursions from its specified process. To illustrate, JA Solar’s quality assurance team tests the gel content from samples collected at each laminator once every 24 hours. If the gel content is found to be out of the specified range, the Modules produced during that period are still shipped to customers instead of undergoing additional testing before shipment. During the second site visit, JA Solar indicated that it had changed its policy and will now quarantine any affected Modules and will not ship them until further testing has been performed. 8.3 Equipment and Maintenance
Most major equipment on the production line observed by Black & Veatch was produced by reputable capital equipment providers. The line was operational and seemed well maintained. JA Solar has four calibration engineers and operators dedicated to ensuring the calibration of the production and test equipment. JA Solar claims to have over 40 equipment preventative maintenance procedures documented in Chinese. JA Solar translated its laminator preventative maintenance procedures in English as sample for review by Black &

JA Solar Hong Kong Limited Solar Module Due Diligence 8 Quality Organization and Processes
April 12, 2012 8‐2 Black & Veatch
Veatch. This sample appears fairly complete as it listed tasks to be completed on weekly, monthly, quarterly, semi‐annual and annual bases and included sample data logs for each task. The procedures also define who in the organization is responsible for the maintenance and includes instructions for each task. 8.4 Document Control
JA Solar personnel described the documentation of the product and the manufacturing process and the processes in place to control such documentation. Black & Veatch finds the process for processing change orders and maintaining a centralized database for documentation to be consistent with accepted industry practice. 8.5 Product Serialization
JA Solar uses a mix of paper and computerized records to track Module‐specific information. Each Module is accompanied by a “run card” during the manufacturing process during which certain information is recorded. The information on these run cards include which operators worked on the Modules and the identification for input materials such as backsheet and EVA. These run cards are currently stored in a warehouse and the run card for a specific Module can be retrieved if the Module serial number is known. Since these records are not computerized, a reverse lookup (e.g. find all serial numbers affected by a bad lot of backsheet) is not possible. The computerized records for JA Solar’s Modules include the flash test data and electro‐luminescence images for each Module. JA Solar indicated that it plans to implement a fully computerized data tracking system in the near future which will contain all of the information described above, including the run card information. Black & Veatch notes that best‐in‐class data tracking systems are fully computerized.

JA Solar Hong Kong Limited Solar Module Due Diligence 9 Module Performance
April 12, 2012 9‐1 Black & Veatch
9. Module Performance
9.1 Record for Increasing Module Efficiency
Black & Veatch was informed that JA Solar’s cell and Module efficiencies have increased consistently since 2008. Figure 9‐1 shows the cell and Module efficiency values for each year since then. Black & Veatch learned that the increase from 2008 to 2009 was due to two factors:
Increased spectral response in the short wavelength region of the spectrum due to shallower junction.
Decreased series resistance due to the use of higher conductivity paste.
Black & Veatch was told that the increase in efficiencies from 2009 to 2010 resulted from:
Lower cell surface reflectivity due to a change in the surface texture of the cells. Decrease series resistance due to the use of double screen printing.
JA Solar explained that the change in efficiencies from 2010 to 2011 in the monocrystalline cells were the result of introducing the Secium type monocrystalline cells that incorporate a selective emitter. This feature further enhances the cell’s spectral response in the short wavelength region of the spectrum. Black & Veatch was told that the increase in the efficiencies of the polycrystalline cells from 2010 to 2011 is the result of introducing the Maple technology.
12
14
16
18
20%
13.83%14.09%
14.34%
14.85%
16.00%16.30%
16.60%
17.50%
14.60%14.85%
15.11%
15.62%
17.50%17.80%
18.20%
18.70%
Dec 09 Jun 10 Dec 10 Jun 11
Conversion efficiency (%)
Polymodule
Poly cell
Monomodule
Mono cell
Figure 91. Increase in JA Solar Cell and Module efficiency from 2008 to 2011

JA Solar Hong Kong Limited Solar Module Due Diligence 9 Module Performance
April 12, 2012 9‐2 Black & Veatch
9.2 Field Performance
Black & Veatch reviewed four months of performance data for single 20 MWac site located in Campania, Italy (the Project) to assess the performance of the JA modules. Black & Veatch observed that the Project behaved as expected with regard to power loss due to temperature, that the Modules exhibited reasonable low light performance and that the overall performance ratio of the Project behaved as expected. 9.1.1 Project Temperature Performance
JA Solar provided Black & Veatch cell temperature and production data from the Project. Black & Veatch examined the relationship between DC performance ratio and module temperature for June 2011 through September 2011. The objective of this analysis is to assess whether the Project power loss due to temperature was in agreement with the 0.42 percent loss per degree C specified on the Module datasheet. Performance Ratio
y = -0.004x + 0.9548 R² = 0.3154
Module Temperature
70%
72%
74%
76%
78%
80%
82%
35°C 40°C 45°C 50°C 55°C
Figure 92. Project Performance Ratio as a Function of Module Temperature
The slope of the best fit line through the scatter plot indicates that DC performance ratio decreases by approximately 0.4 percent per degree C. Black & Veatch finds this to be in reasonable agreement with the specified power temperature coefficient of 0.42 percent per degree C. The relatively low R2 value (correlation coefficient) is likely caused by the short time period under review and non‐module effects such as non‐uniform soiling, low light effects, and other system level losses which add noise to the data. Over a longer time period, the R2 value would likely improve. Regardless, this data demonstrates that the temperature response of the Project using JA Solar Modules is within expectations.

JA Solar Hong Kong Limited Solar Module Due Diligence 9 Module Performance
April 12, 2012 9‐3 Black & Veatch
9.1.2 Low Light Performance
Black & Veatch examined Project performance as a function of light level from 400 W/m2 to 1,000 W/m2 and found no correlation. This implies that the effect of irradiance on Module efficiency between 400 and 1000 W/m2 is not visible at the Project level. Black & Veatch did not examine irradiance less than 400 W/m2 due to the presence of non‐module effects in system performance such as shading. 9.1.3 Plant Performance Ratio
The four months of Project data provided by JA Solar did not reveal evidence of Module degradation or a cliff event that would result from rapid Module performance degradation. Seasonal effects dominate the signal in the performance data as seen in Figure 9‐3 Performance Ratio
(Temperature Corrected)
86.6%
84.7%
83.4%83.1%
81%
82%
83%
84%
85%
86%
87%
Jun 2011 Jul 2011 Aug 2011 Sep 2011
Figure 93. TemperatureCorrected Performance Ratio
The reduction in performance ratio between June 2011 and September 2011 is likely attributable to less desirable sun angles and other seasonal effects expected during the autumn season. A larger time range of data is required to accurately quantify long term Module degradation.

JA Solar Hong Kong Limited Solar Module Due Diligence 9 Module Performance
April 12, 2012 9‐4 Black & Veatch
9.1.4 Field Performance Conclusions
Black & Veatch’s review of four months of data for the 20 MW Campania PV power plant indicated that the Project performed as expected during the period. Temperature response and low light response of the plant met expectations indicated in the Module datasheet. Black & Veatch was unable to rigorously quantify long term Module degradation due to the short time period of available data. Black & Veatch however did not observe a cliff degradation event or significantly greater than expected degradation. The Modules and Project appear to be performing within expectations. 9.3 Definitions of Performance
Performance of a PV module is defined by how well that module converts sunlight into electricity in various irradiance and temperature conditions. Due to the many operating conditions PV modules operate in, a comprehensive single metric of module performance has yet to be agreed upon, and therefore multiple relevant metrics exist. 9.4.1 STC Rating
The performance of a module is quantified by the module rating which is provided by manufacturer and measured at standard test conditions (STC) in accordance with IEC 61215 and IEC 61646. Standard conditions are laboratory conditions which are rarely seen in the field: 1000 W/m2 and 25 degree Celsius cell temperature. The STC rating of a module represents how efficiently the module will convert sunlight into electricity under high irradiance low temperature conditions. These test conditions are the “standard” because they are easy to emulate in laboratory settings. 9.4.2 Temperature Coefficient of Power
PV modules are less efficient at converting sunlight into energy at high temperatures and more efficient at low temperatures. This is often a linear or near linear relationship which can be defined by a single parameter referred to as temperature coefficient of power. This value is typically provided in units of [% / ° C] to show the reductions of conversion efficiency as temperature increases. 9.4.3 Low Light Performance
The conversion efficiency of a PV module is also varies with light level. This is largely a function of the shunt and series resistances within the cell; however other factors play a role. Quantifying low light performance is often difficult and few standards exist. 9.4.4 Performance Ratio
Performance ratio is a metric of performance which often captures the performance of the entire system, including modules, inverter, wiring, shading and soiling. Performance ratio also captures the effects of temperature and low light on the module. The performance ratio of a plant is defined as:
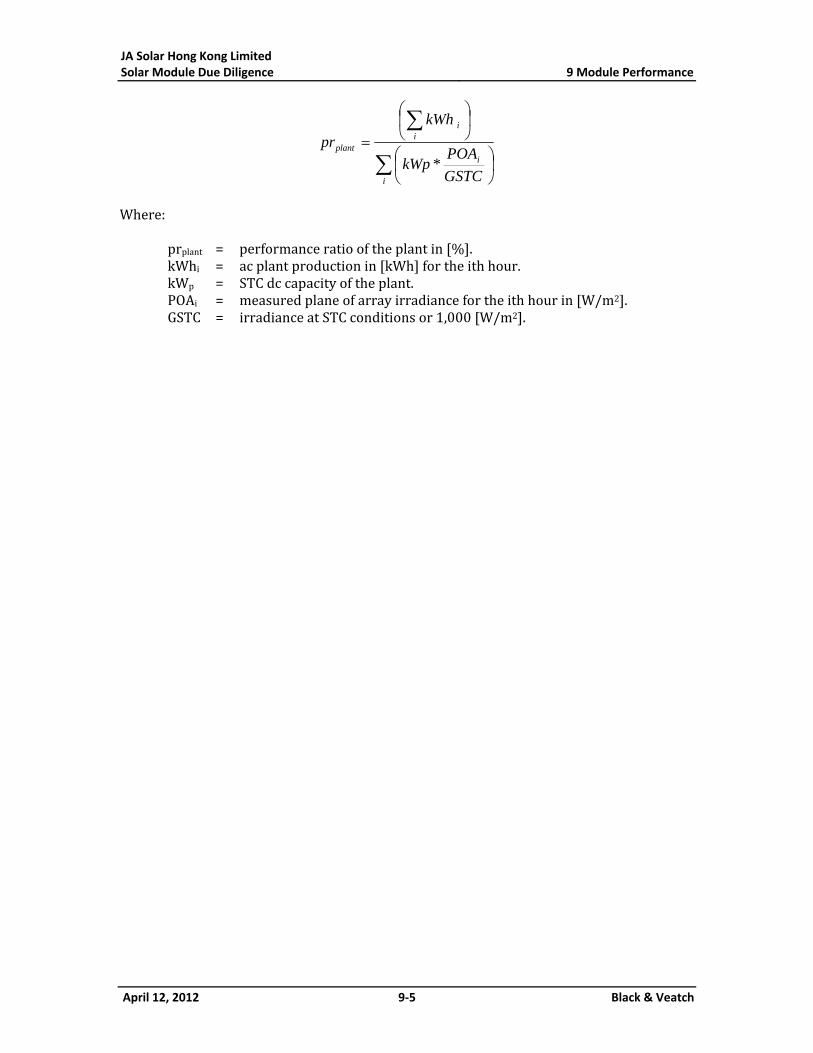
JA Solar Hong Kong Limited Solar Module Due Diligence 9 Module Performance
April 12, 2012 9‐5 Black & Veatch
i
i
ii
plant
GSTC
POAkWp
kWh
pr
*
Where:
prplant = performance ratio of the plant in [%]. kWhi = ac plant production in [kWh] for the ith hour. kWp = STC dc capacity of the plant. POAi = measured plane of array irradiance for the ith hour in [W/m2]. GSTC = irradiance at STC conditions or 1,000 [W/m2].

JA Solar Hong Kong Limited Solar Module Due Diligence
Appendix A. NREL Benchmark for Degradation
April 12, 2012 B‐1 Black & Veatch
Appendix A NREL Benchmark for Degradation
Black & Veatch has reviewed publicly available literature on the topic of performance degradation of crystalline PV modules. During the review, Black & Veatch established a range of representative degradation values for monocrystalline and multicrystalline PV modules. The value derived by Black & Veatch appears in Table B‐1.
Table B1. B&V Crystalline Module Degradation
Rate
Technology (%/year)
mc‐Si 0.4 to 0.8
pc‐Si 0.4 to 0.7
Notes: Degradation should be applied year over year. For example, the Year 2 degradation rate should be applied to the end of Year 1 degraded capacity.
The primary sources of information in the review were two papers published in November/December 2010 by Dirk Jordan et.al. of NREL. These papers study the data measured by NREL on multiple modules over many years. The papers also review the module degradation results reported by a variety of authors worldwide. The NREL papers are academic studies, which are specific to a given module technology. The results are not traceable to any particular module manufacturer. The degradation results reported in the literature reviewed vary significantly within a study and from one study to another. It should be noted that Black & Veatch’s values are subject to review as more information on module performance becomes available. Black & Veatch encourages manufacturers to provide specific degradation rates data relevant to their product. The primary limitations of this task were threefold. First, there is not an industry standard for quantifying the degradation loss for a given module. Secondly, module technologies, while sharing similarities, vary considerably by manufacturer and product design. Thirdly, each technology will likely react and respond differently to location climate1, based on factors like temperature fluctuations, UV radiation, and humidity. Despite these limitations, we believe that the available data can provide helpful guidelines, and a workable estimate of degradation loss per year.
1 King DL et al. Photovoltaic Module Performance and Durability Following Long‐Term Field Exposure. Sandia National Laboratories, April 2000.

JA Solar Hong Kong Limited Solar Module Due Diligence
Appendix A. NREL Benchmark for Degradation
April 12, 2012 B‐2 Black & Veatch
Recent results in the area of PV module degradation estimates were reported by Dirk Jordan of NREL in the Survey of PV Field Experience presented at the DOE Utility/Lab Workshop on PV Technology and Systems held on November 8‐9, 2010 in Tempe, AZ and the related article “Module Reliability Trends” co‐authored by Sarah Kurtz and Dirk Jordan and published in the December 2010/January 2011 issue of Solarpro. Based on a literature review of 780 field‐ tested PV modules comprising crystalline and thin film technologies, the authors report that the most commonly reported degradation rate is 0.5 percent per year, while the average rate is 0.7 percent per year. 2 Thus, the distribution of degradation rates is clearly skewed to the higher values, with a highest statistically significant reported value of 4.0 percent per year. These degradation rates are usually modeled as the slope of the least‐squares linear fit of a power vs. time plot.3 Because of the difficulties of amalgamating the results of various studies performed on modules in the field—due to factors like differing testing conditions, manufacturers, dates of installation and geographical location—NREL conducts controlled and monitored studies at the Performance and Energy Rating Testbed (PERT). Their goal is to scientifically study module performance degradation over time. A critical feature of the analysis of the PERT results is that degradation rates have only been calculated for modules that have been monitored for over two years. This factor provides considerable legitimacy to their test results. Table B‐2 summarizes the NREL findings from their study of 44 individual modules from over 10 manufacturers on PERT. As shown, the values are reported by module technology and between installation years, pre‐2000 and post‐2000. The box and whisker plots demonstrate the statistically significant range of the data.
Table B2. PERT Median Degradation Rates
NREL Median Degradation Rates (%/year) Pre2000 Post2000
a‐Si 0.89 1.35
CdTe 0.89 0.28
CIGS 2.41 0.97
mc‐Si 0.52 Unavailable
pc‐Si 2.54 0.52
Source: Jordan D, Kurtz S. Module Reliability Trends. SolarPro, December 2010, pp 24‐28.
2 Jordan D, Kurtz S. Module Reliability Trends. SolarPro, December 2010, pp 24‐28. 3 Osterwald, C. Comparison of Degradation Rates of Individual Modules Held at Maximum Power, NREL, 2006.
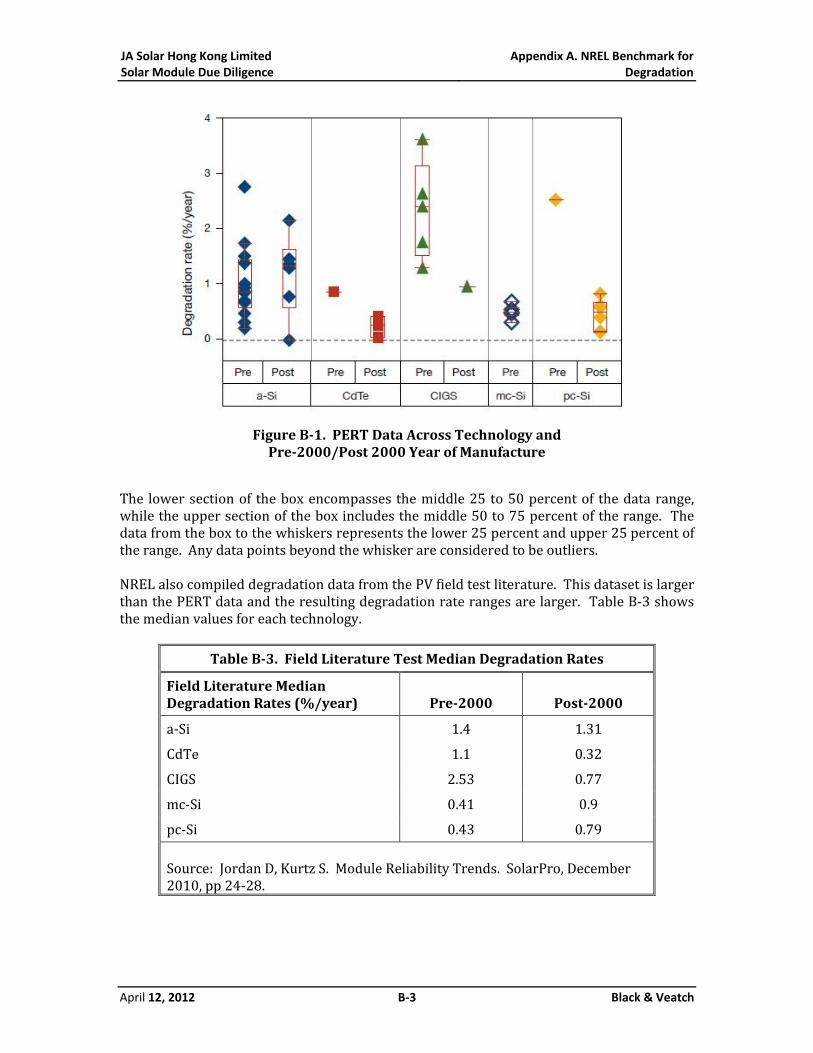
JA Solar Hong Kong Limited Solar Module Due Diligence
Appendix A. NREL Benchmark for Degradation
April 12, 2012 B‐3 Black & Veatch
Figure B1. PERT Data Across Technology and Pre2000/Post 2000 Year of Manufacture
The lower section of the box encompasses the middle 25 to 50 percent of the data range, while the upper section of the box includes the middle 50 to 75 percent of the range. The data from the box to the whiskers represents the lower 25 percent and upper 25 percent of the range. Any data points beyond the whisker are considered to be outliers. NREL also compiled degradation data from the PV field test literature. This dataset is larger than the PERT data and the resulting degradation rate ranges are larger. Table B‐3 shows the median values for each technology.
Table B3. Field Literature Test Median Degradation Rates
Field Literature Median Degradation Rates (%/year) Pre2000 Post2000
a‐Si 1.4 1.31
CdTe 1.1 0.32
CIGS 2.53 0.77
mc‐Si 0.41 0.9
pc‐Si 0.43 0.79
Source: Jordan D, Kurtz S. Module Reliability Trends. SolarPro, December 2010, pp 24‐28.

JA Solar Hong Kong Limited Solar Module Due Diligence
Appendix A. NREL Benchmark for Degradation
April 12, 2012 B‐4 Black & Veatch
Figure B2. Field Test Literature Data across Technology and
Pre2000/Post 2000 Year of Manufacture
Based on this data, we do observe an interesting trend among the silicon technologies in field literature degradation rates. The mono‐crystalline and poly‐crystalline both exhibit an upward trend in their median value from pre‐2000 to post‐2000. The findings of the recent NREL study are helpful because they assess degradation across technology types and review multiple data sources. Given the limited amount of published module field performance data available for review, it is difficult to establish a reliable degradation rate for a given module type operating in a given climate. At this point in time the recent study by Dirk Jordan and Sarah Kurtz provides arguably the most trustworthy degradation rate for pc‐Si publicly available. The number of samples in the pre and post 2000 categories for NREL PERT and for data reported in the literature appears in Table B‐4.
Table B4. Number of Samples in PERT and Field Literature Data
Module Type PERT
Pre2000 PERT
Post 2000 Literature Pre2000
Literature Post2000
pc‐Si 1 >5 >20 >20

JA Solar Hong Kong Limited Solar Module Due Diligence
Appendix A. NREL Benchmark for Degradation
April 12, 2012 B‐5 Black & Veatch
Black & Veatch’s rationale for degradation values by technology is as follows: the PERT modules were monitored and measured rigorously. The same level of assertion cannot be made for the data taken from the literature. Thus, for pc‐Si post 2000 data a 75 percent ‐ 25 percent weighted average was performed in favor of PERT data. For pc‐Si pre‐2000 data comprised of one PERT data point, the weighted average was reversed in favor of the field literature because of the absence of sufficient PERT data. Manufacturing technologies have changed over time for mc‐Si and pc‐Si, and many contemporary modules are made by different companies than before 2000 and likely use alternate materials assembled with changing criteria. Thus, a 75 ‐25 percent weighted average was performed in favor of the post 2000 data to reflect more contemporary degradation rates. Dirk Jordan has published additional data on the degradation rates by climate type, including continental, desert, hot & humid, polar, steppe and temperate. Although there appears to be some connection between climate and climate type, the current data is inconclusive. Black & Veatch does not give guidance on degradation by climate currently.